Visualize this, mother trucker - static.rainfocus.com · © 2018 SPLUNK INC. During the course of...
46
© 2018 SPLUNK INC. © 2018 SPLUNK INC. Visualize this, mother trucker Mark Sivill | Senior Sales Engineer October 2018
-
Upload
nguyencong -
Category
Documents
-
view
213 -
download
0
Transcript of Visualize this, mother trucker - static.rainfocus.com · © 2018 SPLUNK INC. During the course of...

© 2018 SPLUNK INC.© 2018 SPLUNK INC.
Visualize this, mother trucker
Mark Sivill | Senior Sales Engineer
October 2018

© 2018 SPLUNK INC.
During the course of this presentation, we may make forward-looking statements regarding future events or the expected performance of the company. We caution you that such statements reflect our current expectations and estimates based on factors currently known to us and that actual events or results could differ materially. For important factors that may cause actual results to differ from those contained in our forward-looking statements, please review our filings with the SEC.
The forward-looking statements made in this presentation are being made as of the time and date of its live presentation. If reviewed after its live presentation, this presentation may not contain current or accurate information. We do not assume any obligation to update any forward-looking statements we may make. In addition, any information about our roadmap outlines our general product direction and is subject to change at any time without notice. It is for informational purposes only and shall not be incorporated into any contract or other commitment. Splunk undertakes no obligation either to develop the features or functionality described or to include any such feature or functionality in a future release.
Splunk, Splunk>, Listen to Your Data, The Engine for Machine Data, Splunk Cloud, Splunk Light and SPL are trademarks and registered trademarks of Splunk Inc. in the United States and other countries. All other brand names, product names, or trademarks belong to their respective owners. © 2018 Splunk Inc. All rights reserved.
Forward-Looking Statements
THIS SLIDE IS REQUIRED FOR ALL 3 PARTY PRESENTATIONS.

© 2018 SPLUNK INC.
Agenda
▶ Splunk Visualizations • Starting out• Creating your own
▶ Scalable Vector Graphics - Custom Visualization• What’s a Scalable Vector Graphic• SVG app

© 2018 SPLUNK INC.
Splunk Visualizations

© 2018 SPLUNK INC.
Dashboards
▶ Point and Click▶ No additional install▶ Visualizations
• Pie Chart• Bar Chart• Maps• Bubble Chart
http://docs.splunk.com/Documentation/Splunk/latest/Viz/Aboutthismanual

© 2018 SPLUNK INC.
Simple XML
▶ Dashboards are stored as XML▶ Direct XML access gives additional
options over point and click▶ Change out-of-the-box
visualizations• Set default colors for charts• Set height• Add JavaScript / Cascading Style Sheet
(CSS)
http://docs.splunk.com/Documentation/Splunk/latest/Viz/PanelreferenceforSimplifiedXML

© 2018 SPLUNK INC.
Simple XML - example
<dashboard stylesheet="svg:light_theme_background.css" hideEdit="true">
<label>Simple XML</label>
<row>
<panel>
<chart>
<search>
<query>| makeresults | eval change=“me”</query>
</search>
<option name="charting.seriesColors">[0x353c44]</option>
<option name="height">400</option>
..
..
http://docs.splunk.com/Documentation/Splunk/latest/Viz/PanelreferenceforSimplifiedXML

© 2018 SPLUNK INC.
Glass tables
▶ Premium Apps only (Enterprise Security / IT Service Intelligence)
▶ Uses whole screen
▶ Layer metrics onto image or Visio “like” background
▶ Background can be used to add context such as business process
https://docs.splunk.com/Documentation/ES/latest/User/CreateGlassTable

© 2018 SPLUNK INC.
Custom Visualizations - Using
▶ Find on Splunkbase▶ Ones I frequently use
• Status indicator• Maps+ for Splunk• Scalable Vector Graphics - Custom
Visualization
https://splunkbase.splunk.com/

© 2018 SPLUNK INC.
Custom Visualizations - Building
▶ Very flexible
▶ Requires JavaScript skills
▶ Likely require Cascading Style Sheets (CSS) skills
▶ Wrapper existing JavaScript libraries ( D3.js )
▶ Please share on Splunkbase
https://docs.splunk.com/Documentation/SplunkCloud/latest/AdvancedDev/CustomVizTutorial
© 2018 SPLUNK INC.
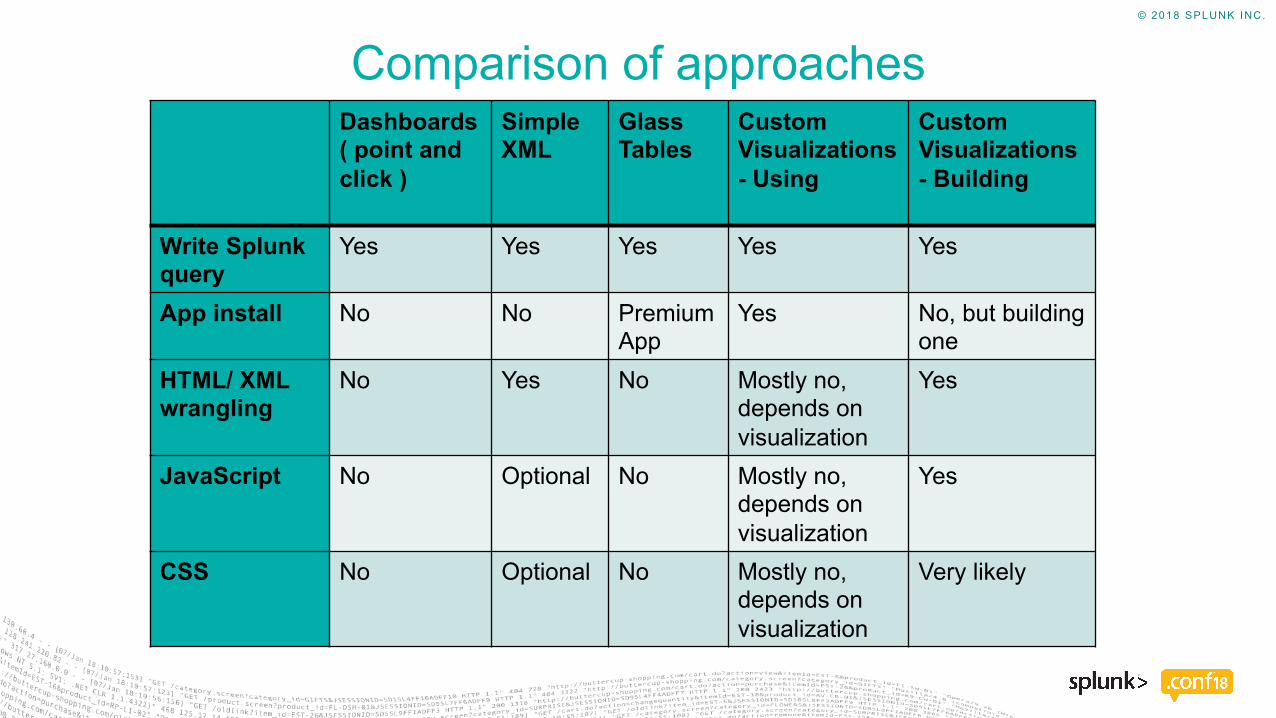
Comparison of approachesDashboards ( point and click )
Simple XML
Glass Tables
Custom Visualizations - Using
Custom Visualizations - Building
Write Splunk query
Yes Yes Yes Yes Yes
App install No No Premium App
Yes No, but building one
HTML/ XML wrangling
No Yes No Mostly no, depends on visualization
Yes
JavaScript No Optional No Mostly no, depends on visualization
Yes
CSS No Optional No Mostly no, depends on visualization
Very likely

© 2018 SPLUNK INC.
Scalable Vector Graphics - Custom
Visualization

© 2018 SPLUNK INC.
Scalable Vector Graphics vs Bitmap
▶ Image file format
▶ SVG / AI vs PNG / GIF /JPEG / WEBP
▶ Vector images vs Bitmap (or Raster)
▶ Bitmaps made of different colored pixels on a grid

© 2018 SPLUNK INC.
Scalable Vector Graphics - Format
▶ Drawn with lines and curves as opposed pixel coordinates
▶ Vector based so it scales
▶ Defined using XML
▶ Open web standard -https://www.w3.org/TR/SVG11/
▶ Not best format for photosBitmap Vector

© 2018 SPLUNK INC.
Scalable Vector Graphics - Creating
▶ Create simple SVG using text editor
▶ More complex SVG can be created with Inkscape or OmniGraffle
▶ Loads of examples on web -https://openclipart.org/
▶ View created SVG file in web browser
<svg xmlns="http://www.w3.org/2000/svg" viewBox="0 0 100 100" width="100" height="100"><circle cx="50" cy="50" r="50" style="fill: gold;"></circle></svg>
https://www.w3.org/Graphics/SVG/IG/resources/svgprimer.html

© 2018 SPLUNK INC.
SVG app – pulling this together
▶ SVG is a text based image format
▶ SPL can generate text fields therefore SPL can generate SVG
▶ Custom Visualizations can take SPL text fields and apply JavaScript and CSS
▶ Find JavaScript library that turns SVG text into SVG image -http://svgjs.com/
https://splunkbase.splunk.com/app/3815/

© 2018 SPLUNK INC.
Demonstration

© 2018 SPLUNK INC.
Easier with SVG Macros
▶ Prebuilt • Trucks with Cargo ( Single / Multiple )• Numbers / Text ( Circle / Square )• Batteries ( Bar / Percentage )
▶ Please share your SVG macros or SPL examples on Splunk Answers for SVG app ( link below ) using MIT license
https://answers.splunk.com/app/questions/3815.html

© 2018 SPLUNK INC.
Comparison of approaches including SVG appDashboards ( point and click )
Simple XML
Glass Tables
Custom Visualizations - Using
Scalable Vector Graphics -Custom Visualization
Custom Visualizations - Building
Write Splunk query
Yes Yes Yes Yes Yes Yes
App install No No Premium App
Yes Yes No, but building one
HTML/ XML wrangling
No Yes No Mostly no, depends on visualization
No if using SVG macros, yes otherwise
Yes
JavaScript No Optional No Mostly no, depends on visualization
No Yes
CSS No Optional No Mostly no, depends on visualization
No Very likely

© 2018 SPLUNK INC.
What’s the catch
▶ Wrangling large XML text fields▶ Escape double quotes when
importing external files▶ No dashboard drill down▶ Macros to reduce complexity▶ Leverage existing SVG images or
third party graphic tools

© 2018 SPLUNK INC.
Advantages
▶ Scales from dashboard panel to whole screen
▶ Only limited by SVG format▶ Reuse existing SVG images▶ Build own SVG with third party tools▶ Reuse with configurable macros▶ No JavaScript / CSS

© 2018 SPLUNK INC.
1. Many ways to put visualizations together in Splunk with respective pros and cons
2. SVG app provides highly customizable visualization without requiring a deep developer skill set
3. It gets easier if we all share our SVG macros
Key Takeaways

© 2018 SPLUNK INC.
Don't forget to rate this session in the .conf18 mobile app
Thank You

© 2018 SPLUNK INC.© 2018 SPLUNK INC.
Visualize this, mother trucker
Mark Sivill | Senior Sales Engineer
October 2018 | Orlando, Florida

© 2018 SPLUNK INC.
Appendix -Demonstration
screenshots

© 2018 SPLUNK INC.

© 2018 SPLUNK INC.

© 2018 SPLUNK INC.

© 2018 SPLUNK INC.

© 2018 SPLUNK INC.

© 2018 SPLUNK INC.

© 2018 SPLUNK INC.

© 2018 SPLUNK INC.

© 2018 SPLUNK INC.

© 2018 SPLUNK INC.

© 2018 SPLUNK INC.

© 2018 SPLUNK INC.

© 2018 SPLUNK INC.

© 2018 SPLUNK INC.

© 2018 SPLUNK INC.

© 2018 SPLUNK INC.

© 2018 SPLUNK INC.
Appendix - Attributions

© 2018 SPLUNK INC.
SVG Attributions
▶ “boy playing with toy truck” by johnny_automatic -https://openclipart.org/detail/724/boy-playing-with-toy-truck
▶ Stop Sign - https://en.wikipedia.org/wiki/Stop_sign
▶ Darth Vader - https://www.svgrepo.com/svg/170435/darth-vader

© 2018 SPLUNK INC.
Appendix – Driving Tracks

© 2018 SPLUNK INC.
Driving Tracks
▶ C.W. McCall - Convoy ( 4:02 mins ) -https://www.youtube.com/watch?v=Sd5ZLJWQmss
▶ Rascal Flatts - Life Is a Highway ( 4:58 mins ) -https://www.youtube.com/watch?v=5tXh_MfrMe0
▶ Jerry Reed - East Bound and Down ( 2:49 mins ) -https://www.youtube.com/watch?v=uHZJej98_T0

© 2018 SPLUNK INC.© 2018 SPLUNK INC.
Visualize this, mother trucker
Mark Sivill | Senior Sales Engineer
October 2018 | Orlando, Florida