Business Model Driven Service Architecture Design for Enterprise

B O S C H A N D S I E M E N S H O M E A P P L I A N C E S G R O U P
Visualization of Enterprise Architecture Model Evolution Based on an Example in the Consumer Goods Industry
n Master Thesis Final Presentation
n October 2013
n Nevzat Orhan, TU Munich
n Supervisor: Prof. Dr. Florian Matthes
n Advisor: Herbert Stirmlinger Sascha Roth

B O S C H A N D S I E M E N S H O M E A P P L I A N C E S G R O U P Master Thesis – Final Presentation I Nevzat Orhan I Slide: 2
Agenda
• Introduction
• Research Questions
• Integration Approach
• Technical Approach
• Results
• Future Improvement
• Conclusion
B O S C H A N D S I E M E N S H O M E A P P L I A N C E S G R O U P Master Thesis – Final Presentation I Nevzat Orhan I Slide: 3
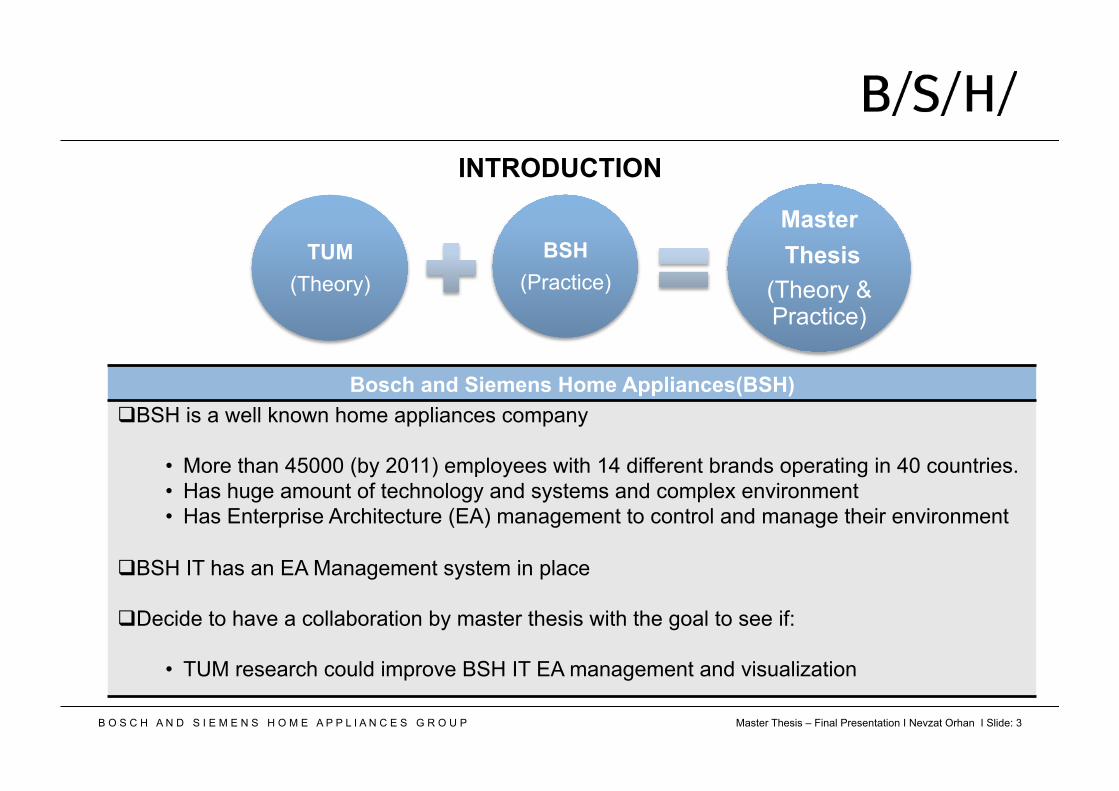
INTRODUCTION
Bosch and Siemens Home Appliances(BSH) q BSH is a well known home appliances company
• More than 45000 (by 2011) employees with 14 different brands operating in 40 countries. • Has huge amount of technology and systems and complex environment • Has Enterprise Architecture (EA) management to control and manage their environment
q BSH IT has an EA Management system in place q Decide to have a collaboration by master thesis with the goal to see if:
• TUM research could improve BSH IT EA management and visualization
TUM (Theory)
BSH (Practice)
Master Thesis
(Theory & Practice)
B O S C H A N D S I E M E N S H O M E A P P L I A N C E S G R O U P Master Thesis – Final Presentation I Nevzat Orhan I Slide: 4
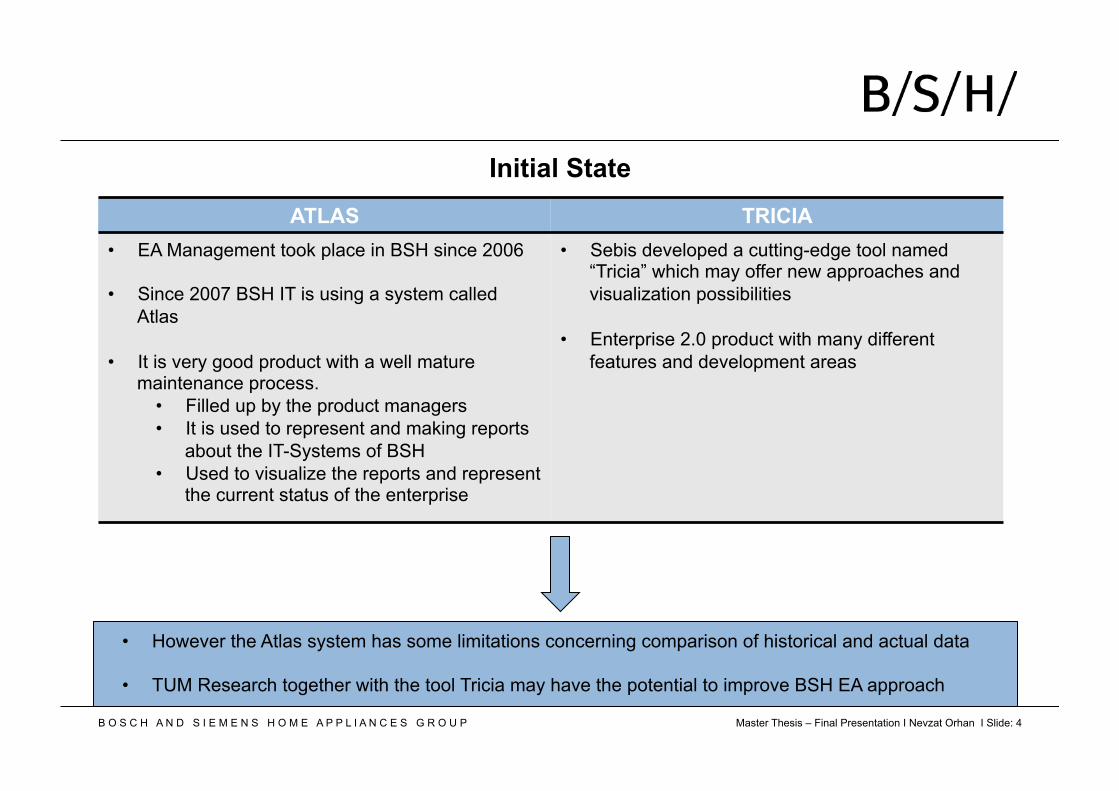
Initial State ATLAS TRICIA
• EA Management took place in BSH since 2006 • Since 2007 BSH IT is using a system called
Atlas • It is very good product with a well mature
maintenance process. • Filled up by the product managers • It is used to represent and making reports
about the IT-Systems of BSH • Used to visualize the reports and represent
the current status of the enterprise
• Sebis developed a cutting-edge tool named “Tricia” which may offer new approaches and visualization possibilities
• Enterprise 2.0 product with many different features and development areas
• However the Atlas system has some limitations concerning comparison of historical and actual data • TUM Research together with the tool Tricia may have the potential to improve BSH EA approach
B O S C H A N D S I E M E N S H O M E A P P L I A N C E S G R O U P Master Thesis – Final Presentation I Nevzat Orhan I Slide: 5
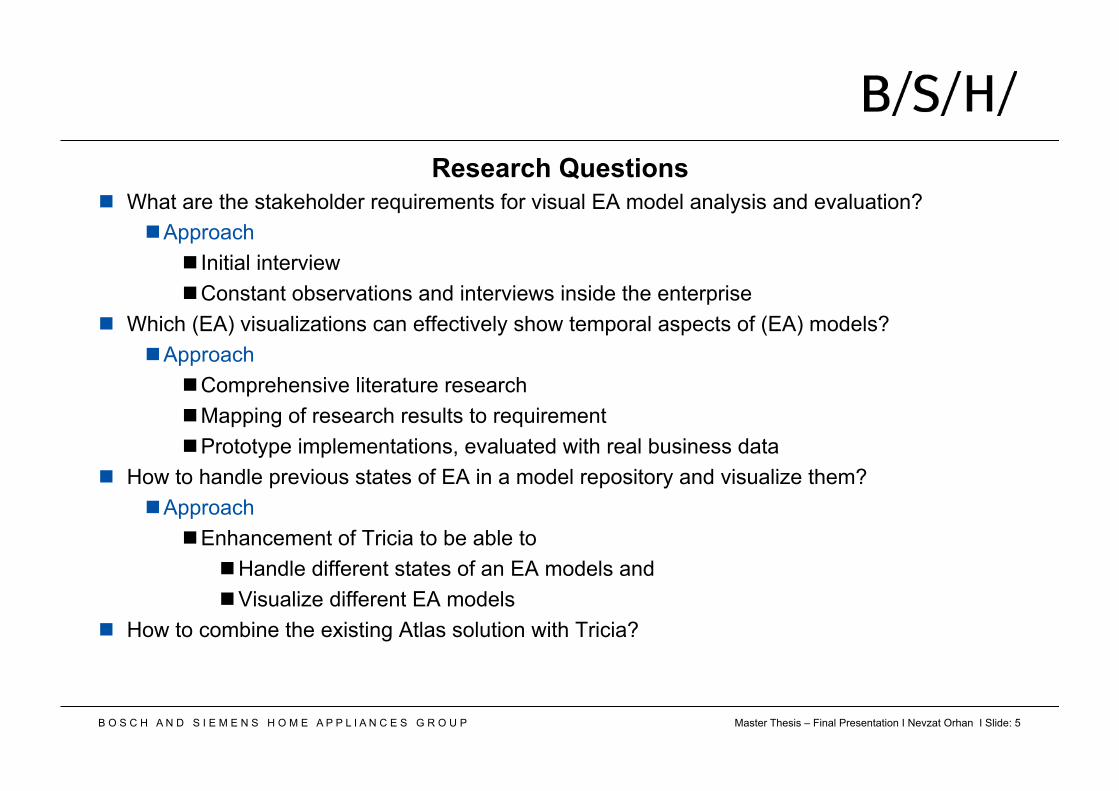
Research Questions n What are the stakeholder requirements for visual EA model analysis and evaluation?
n Approach n Initial interview n Constant observations and interviews inside the enterprise
n Which (EA) visualizations can effectively show temporal aspects of (EA) models? n Approach
n Comprehensive literature research n Mapping of research results to requirement n Prototype implementations, evaluated with real business data
n How to handle previous states of EA in a model repository and visualize them? n Approach
n Enhancement of Tricia to be able to n Handle different states of an EA models and n Visualize different EA models
n How to combine the existing Atlas solution with Tricia?
B O S C H A N D S I E M E N S H O M E A P P L I A N C E S G R O U P Master Thesis – Final Presentation I Nevzat Orhan I Slide: 6
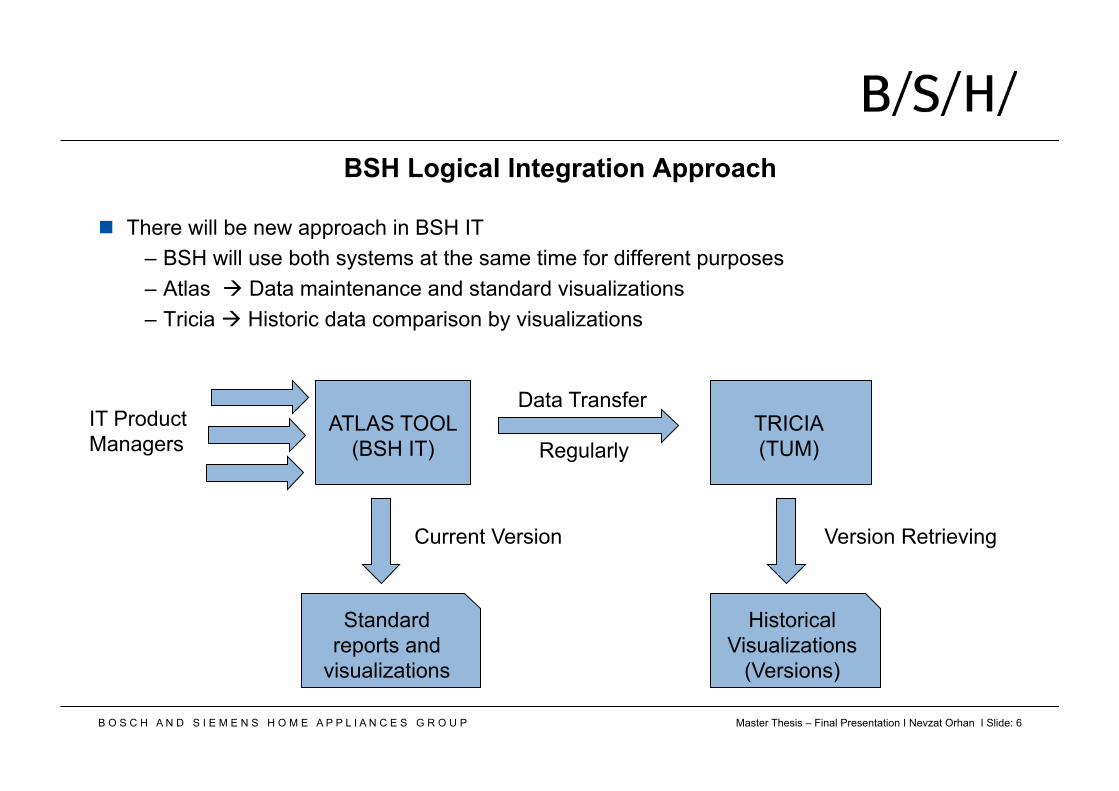
BSH Logical Integration Approach
n There will be new approach in BSH IT – BSH will use both systems at the same time for different purposes – Atlas à Data maintenance and standard visualizations – Tricia à Historic data comparison by visualizations
Standard reports and
visualizations
Historical Visualizations
(Versions)
ATLAS TOOL (BSH IT)
TRICIA (TUM)
IT Product Managers
Data Transfer
Regularly
Version Retrieving Current Version
B O S C H A N D S I E M E N S H O M E A P P L I A N C E S G R O U P Master Thesis – Final Presentation I Nevzat Orhan I Slide: 7
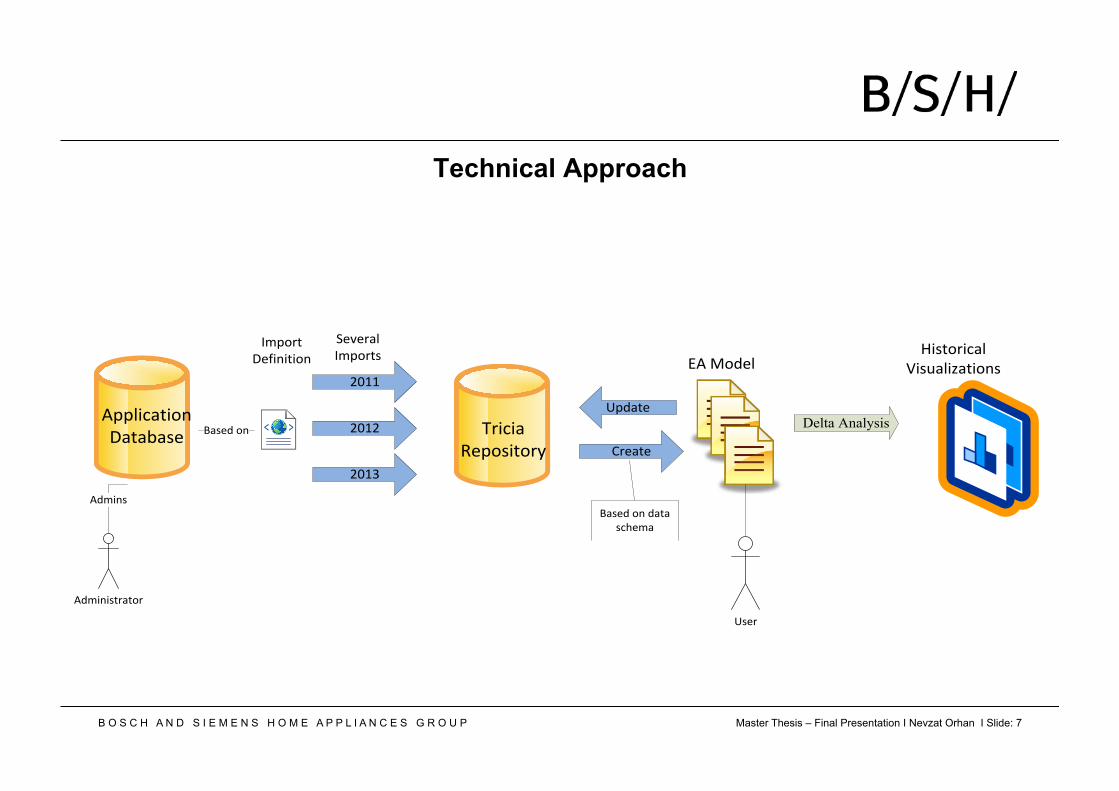
Technical Approach
!"#$%&"'()*+"#,()"-($"%.#
/&"'"(*012%#"$%&3
422)"'($"%.*5($(6(#1
7181&()*9:2%&$# ;4*<%=1)
Delta Analysis
4=:"."#$&($%&
>#1&
4=:".#
?@AA
B&1($1
?@AC
?@A?>2=($1
9:2%&$*51D"."$"%.
E(#1=*%.
E(#1=*%.*=($(*#'F1:(
B O S C H A N D S I E M E N S H O M E A P P L I A N C E S G R O U P Master Thesis – Final Presentation I Nevzat Orhan I Slide: 8
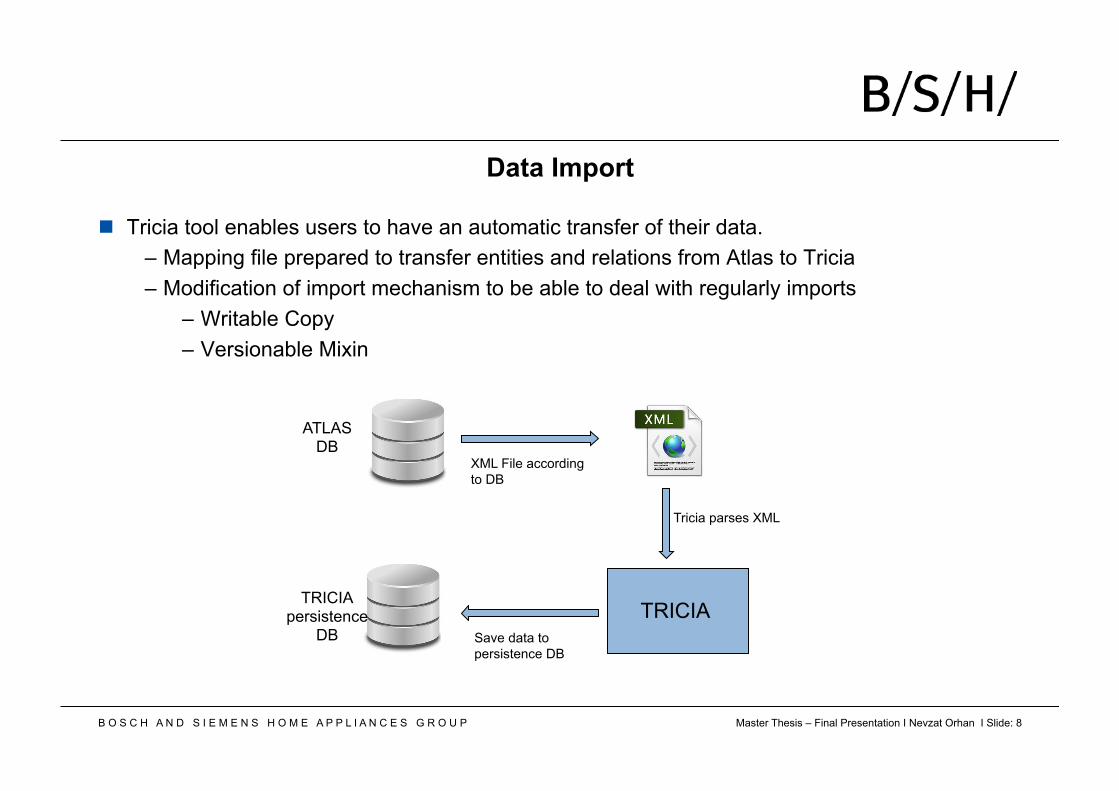
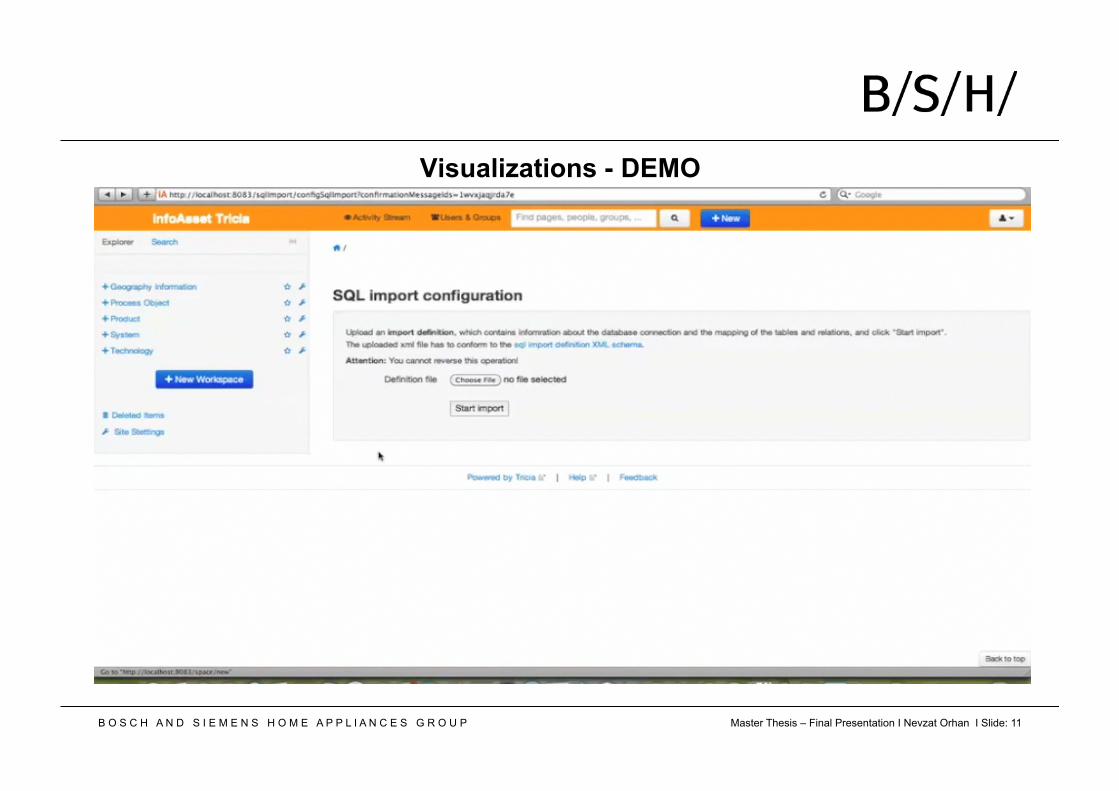
Data Import
n Tricia tool enables users to have an automatic transfer of their data. – Mapping file prepared to transfer entities and relations from Atlas to Tricia – Modification of import mechanism to be able to deal with regularly imports
– Writable Copy – Versionable Mixin
XML File according to DB
TRICIA
Tricia parses XML
Save data to persistence DB
ATLAS DB
TRICIA persistence
DB
B O S C H A N D S I E M E N S H O M E A P P L I A N C E S G R O U P Master Thesis – Final Presentation I Nevzat Orhan I Slide: 9
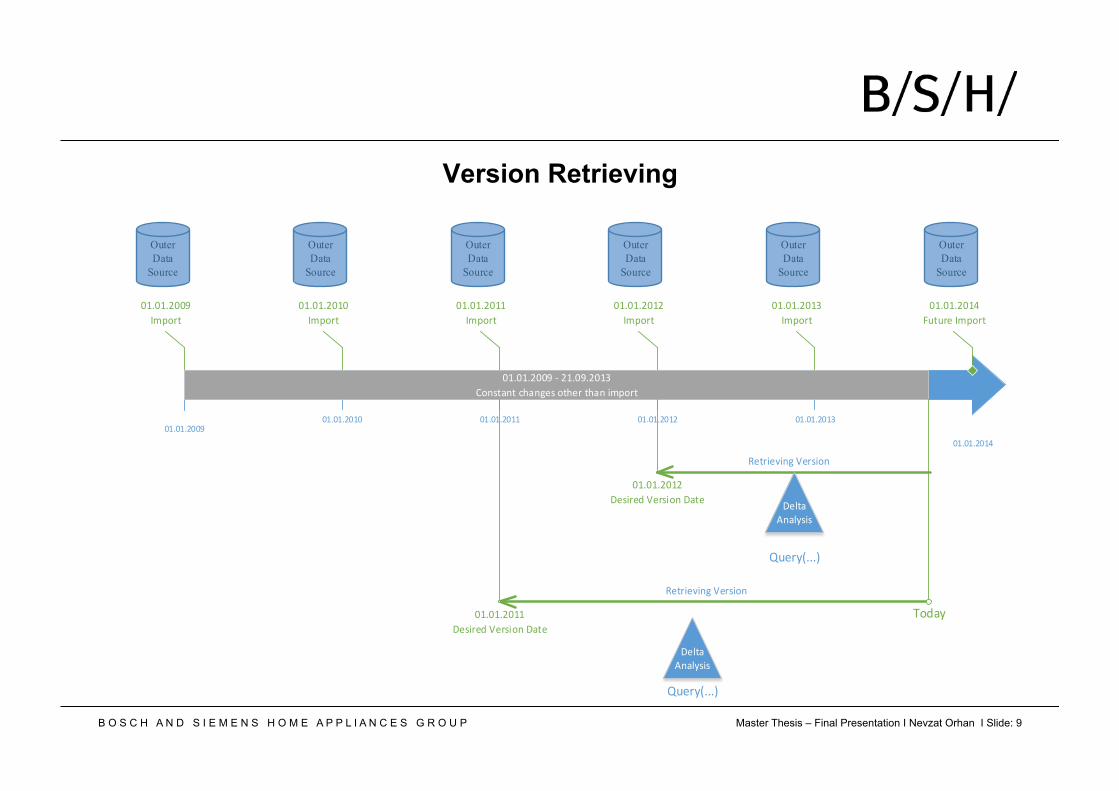
Version Retrieving
!"#!"#$!!%!"#!"#$!"&
!"#!"#$!"! !"#!"#$!"" !"#!"#$!"$ !"#!"#$!"'
!"#!"#$!!%()*+,-
!"#!"#$!"!()*+,-
!"#!"#$!""()*+,-
!"#!"#$!"$()*+,-
!"#!"#$!"'()*+,-
!"#!"#$!!%./.$"#!%#$!"'0+12-31-.4531672.+-57,.-531.8)*+,-
!"#!"#$!"&9:-:,7.()*+,-
OuterDataSource
OuterDataSource
OuterDataSource
OuterDataSource
OuterDataSource
;7-,87<816.=7,28+1
>7?-3@13?A282
OuterDataSource
B:7,AC###D.
!"#!"#$!"">728,7E.=7,28+1.>3-7
F+E3A
!"#!"#$!"$>728,7E.=7,28+1.>3-7
;7-,87<816.=7,28+1
>7?-3@13?A282
B:7,AC###D.
B O S C H A N D S I E M E N S H O M E A P P L I A N C E S G R O U P Master Thesis – Final Presentation I Nevzat Orhan I Slide: 10
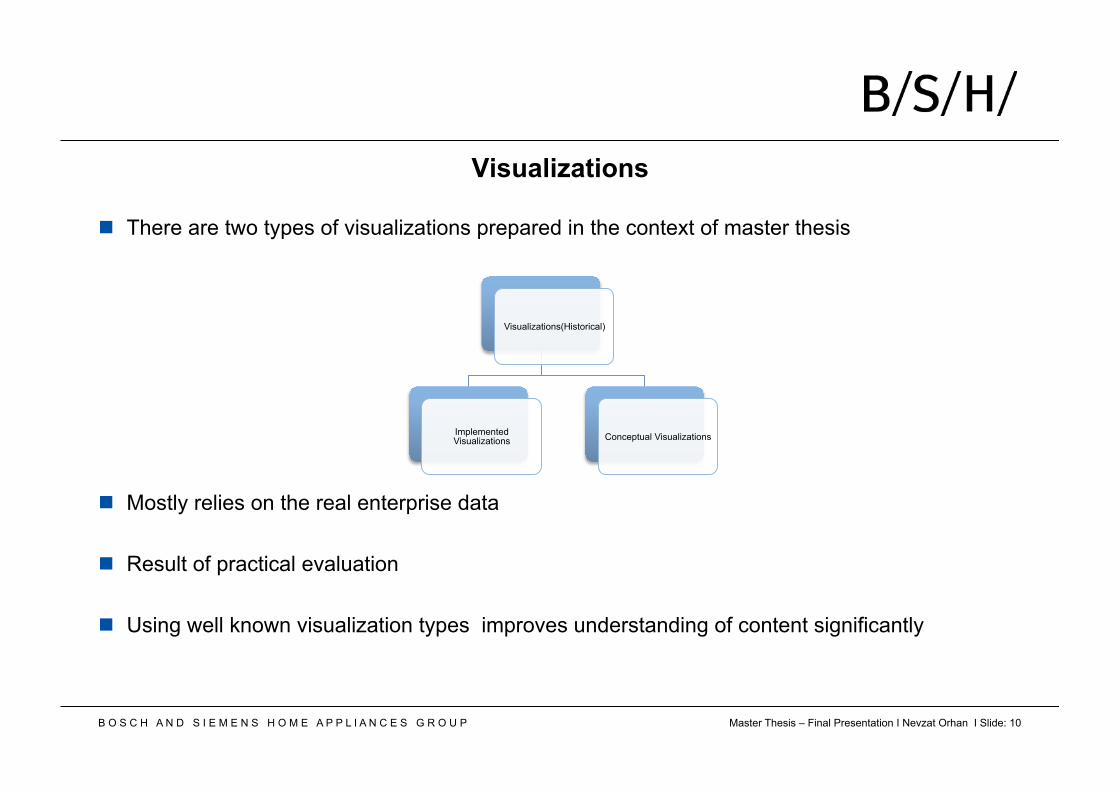
Visualizations
n There are two types of visualizations prepared in the context of master thesis
n Mostly relies on the real enterprise data
n Result of practical evaluation
n Using well known visualization types improves understanding of content significantly
Visualizations(Historical)
Implemented Visualizations Conceptual Visualizations
B O S C H A N D S I E M E N S H O M E A P P L I A N C E S G R O U P Master Thesis – Final Presentation I Nevzat Orhan I Slide: 11
Visualizations - DEMO
B O S C H A N D S I E M E N S H O M E A P P L I A N C E S G R O U P Master Thesis – Final Presentation I Nevzat Orhan I Slide: 12
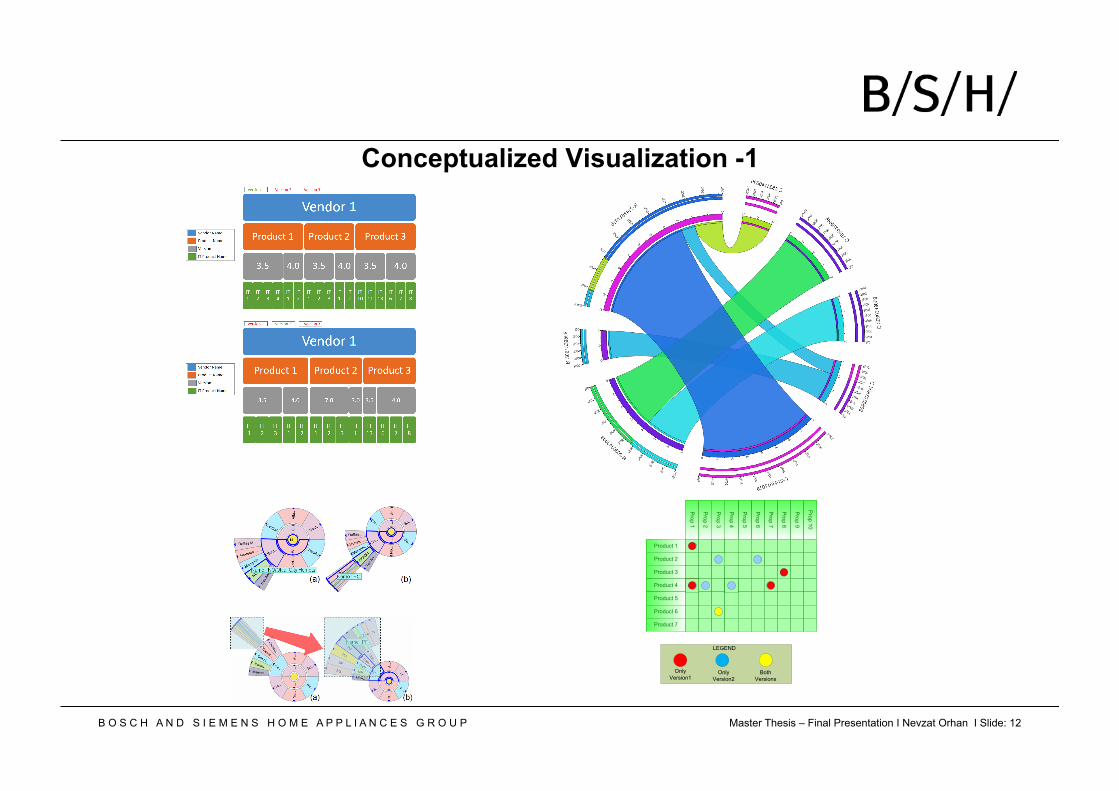
Conceptualized Visualization -1 !
!!
Figure 5: Examples of expanding/collapsing mechanism. (a) Ex-panding one branch from the base levels; (b) Drill down deeper intothe branch.
Figure 6: An example of multiple foci in FanLens.
4.2.1 ZoomingZooming is the classic method to solve this problem which is im-plemented by enlarging the sweep angle of the focus so all the thinslices in it are enlarged as well [16, 19]. Our solution follows thiseffective and intuitive idea (Figure 7 (b)) and brings two advantagesfrom the expanding/collapsing mechanism. For one thing, it main-tains smooth transition of views because the focus was changedwhere it was and no reposition is needed. For another, it preservesthe context of quantitative attributes better because the angles ofslices outside the zooming area are unchanged.
4.2.2 SelectingSelecting the thin slice is another potential problem that has notbeen addressed specifically. A previous solution to this was zoom-ing before selecting, which surely works but also lowers the effi-ciency. In many occasions users need to locate one slice quicklyand precisely to find some detailed information or drill down intodeeper levels.
We proposed an effective solution to this problem by applyingfisheye distortion [6] to the slice angles in one certain hierarchylayer. Figure 8 shows the basic idea. The angle corresponding tomouse position θm is the center of distortion where the slice bordersare repelled from neighboring borders thus the slices are enlarged.The range in which fisheye distortion affects is fixed within θm−θ0
Figure 7: An example of zooming in FanLens. (a) Thin slices in radial,space-filling visualization; (b) Zooming enlarges the sweep angle ofthe focus.
and θm +θ0 to avoid unnecessary change of the slices further fromthe distortion center.
Figure 8: Illustration of the basic idea of fisheye distortion.
The fisheye distortion formula we used is basically the classicone which works in three steps. Firstly, angles θ within the rangeθm − θ0 and θm + θ0 are normalized into range [−1,1] (Equation1). Then fisheye transformation is applied to all normalized anglesaccording to Equation 2. Finally, the transformed angles θ ′
f aremapped to the range θm −θ0 and θm +θ0 (Equation 3).
θ ′ =(θ −θm)
2θ0(1)
θ ′f =
⎧⎪⎨
⎪⎩
(1+d)θ ′
(1−dθ ′) θ ′ ∈ (−1,0]
(1+d)θ ′
(1+dθ ′) θ ′ ∈ (0,1)(2)
θ f = θ ′f θ0 +θm (3)
Figure 9 shows the effect of fisheye distortion. Figure 9 (a) isthe view before applying the distortion where several clusters ofthin slices exist and slices in them cannot be distinguished fromneighboring ones. But with fisheye distortion turned on, the thincluster is enlarged when the cursor moves nearby and users canclearly inspect its contents, as shown in Figure 9 (b).
Product 1
Prop 10
Prop 9
Prop 8
Prop 7
Prop 6
Prop 5
Prop 4
Prop 3
Prop 2
Prop 1
Product 2
Product 3
Product 4
Product 5
Product 6
Product 7
LEGEND
OnlyVersion1
OnlyVersion2
BothVersions
B O S C H A N D S I E M E N S H O M E A P P L I A N C E S G R O U P Master Thesis – Final Presentation I Nevzat Orhan I Slide: 13
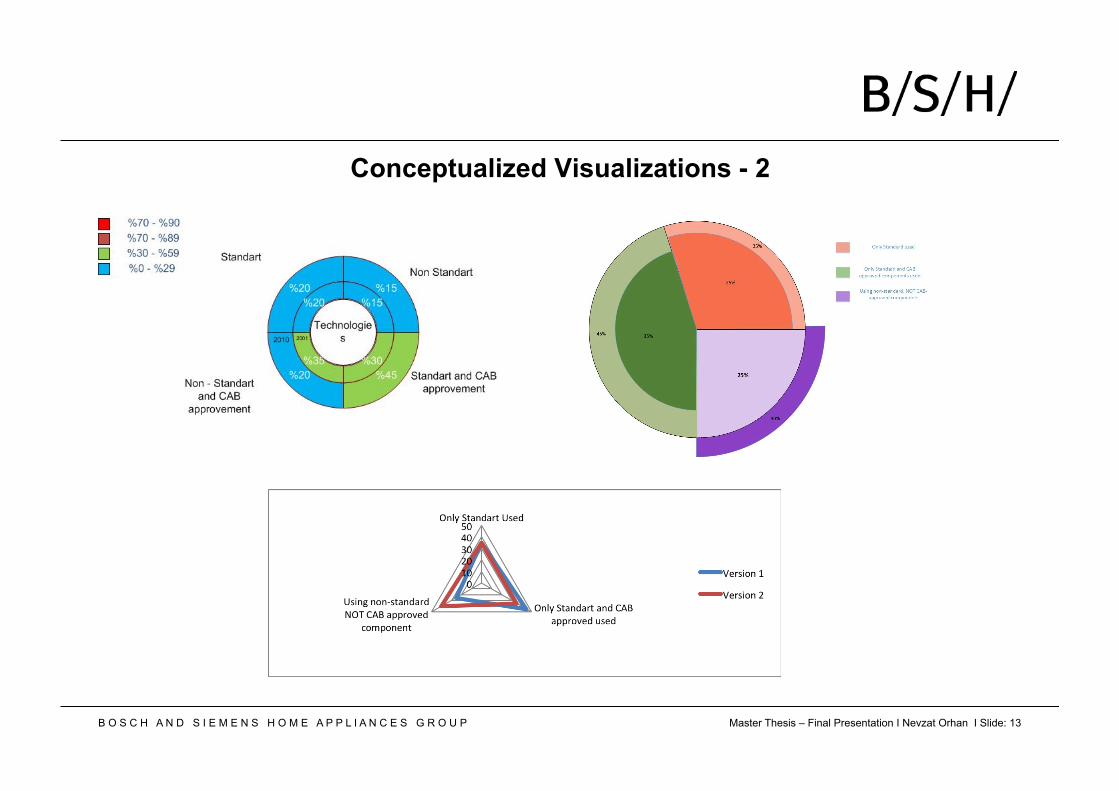
Conceptualized Visualizations - 2
!
!!
B O S C H A N D S I E M E N S H O M E A P P L I A N C E S G R O U P Master Thesis – Final Presentation I Nevzat Orhan I Slide: 14
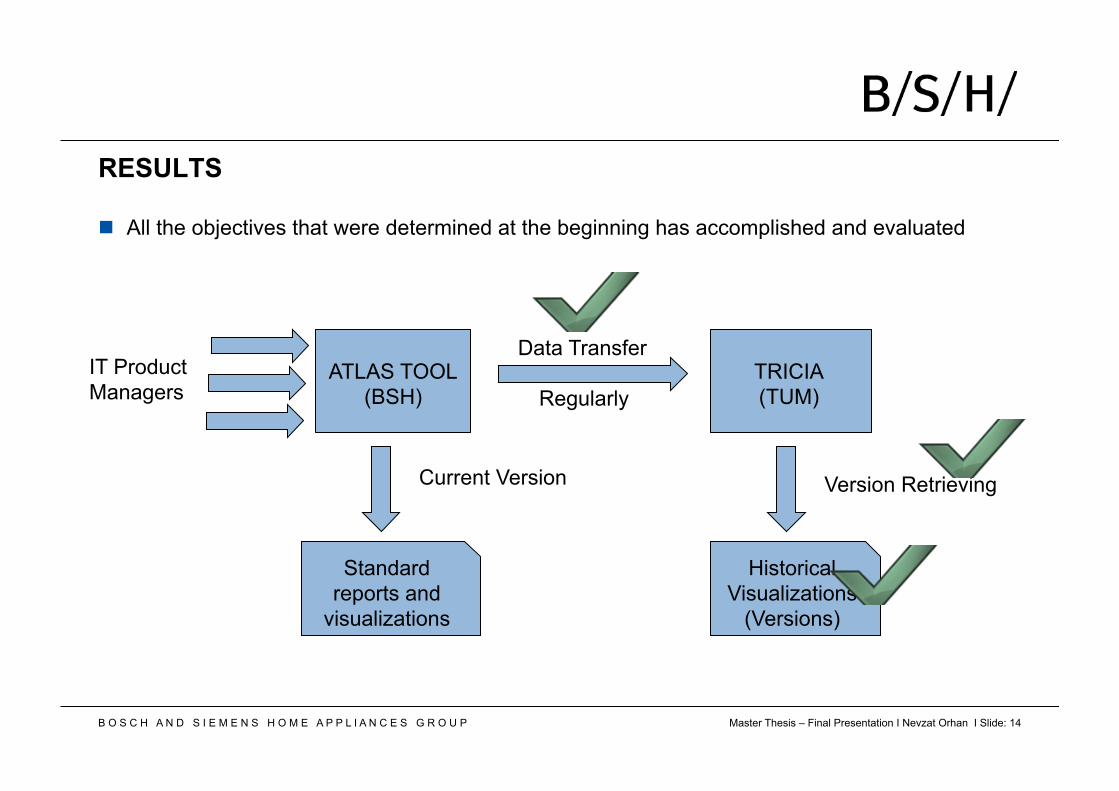
RESULTS
Standard reports and
visualizations
Historical Visualizations
(Versions)
ATLAS TOOL (BSH)
TRICIA (TUM)
IT Product Managers
Data Transfer
Regularly
Version Retrieving Current Version
n All the objectives that were determined at the beginning has accomplished and evaluated
B O S C H A N D S I E M E N S H O M E A P P L I A N C E S G R O U P Master Thesis – Final Presentation I Nevzat Orhan I Slide: 15
Further Improvements
n Implementation of conceptualized visualizations n Performance Improvements for Import mechanism
n Design of the current visualization can be improved
n Documentation of the Tricia should be definitely improved for business perspectives n Different states can be stored in EA repository
B O S C H A N D S I E M E N S H O M E A P P L I A N C E S G R O U P Master Thesis – Final Presentation I Nevzat Orhan I Slide: 16
THANK YOU FOR YOUR ATTENTION !
QUESTIONS & COMMENTS ?
B O S C H A N D S I E M E N S H O M E A P P L I A N C E S G R O U P Master Thesis – Final Presentation I Nevzat Orhan I Slide: 17
Backup Slides
B O S C H A N D S I E M E N S H O M E A P P L I A N C E S G R O U P Master Thesis – Final Presentation I Nevzat Orhan I Slide: 18
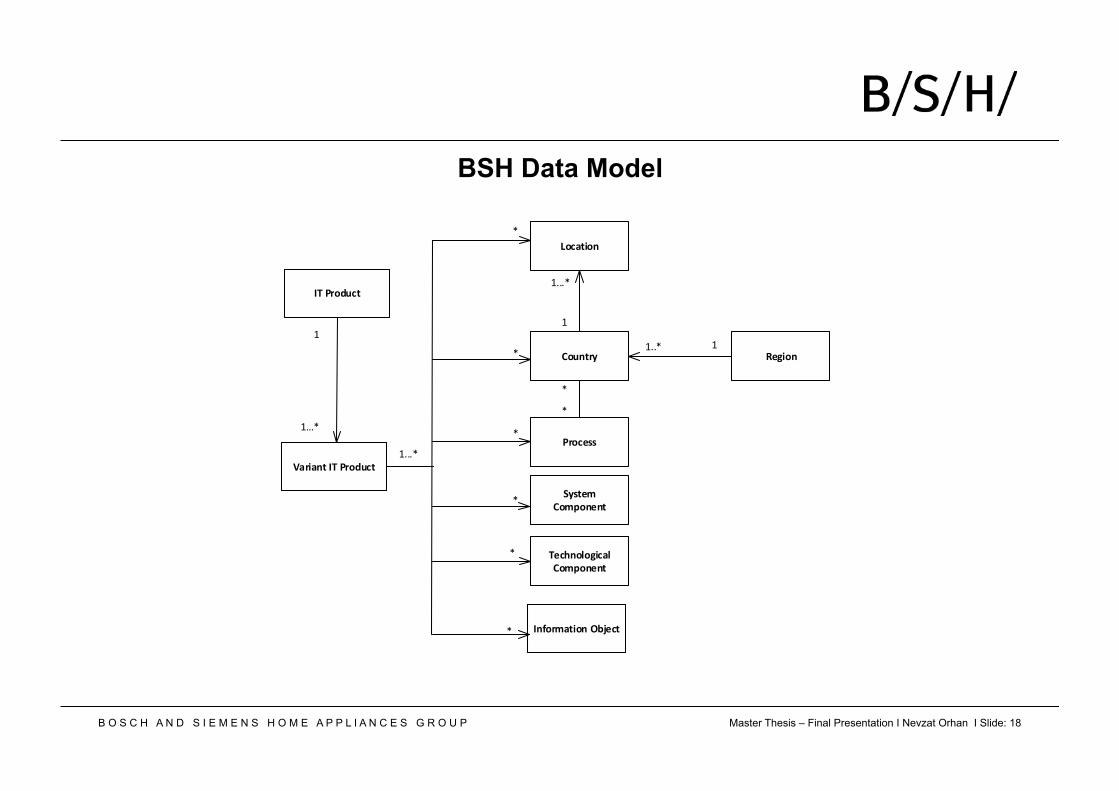
BSH Data Model
!"#$"%&'()'*#+,-.&
()'*#+,-.&
!"""#
#
#
#
#
!""# !!
!�#
!
!"""#
(%/+#0"&$+%'1234.&
)4.5%+6+7$."6'8+09+%4%&
:;<&40'8+09+%4%&
*#+.4<<
8+-%&#;
=+."&$+%
>47$+%
#
#
#
#
B O S C H A N D S I E M E N S H O M E A P P L I A N C E S G R O U P Master Thesis – Final Presentation I Nevzat Orhan I Slide: 19
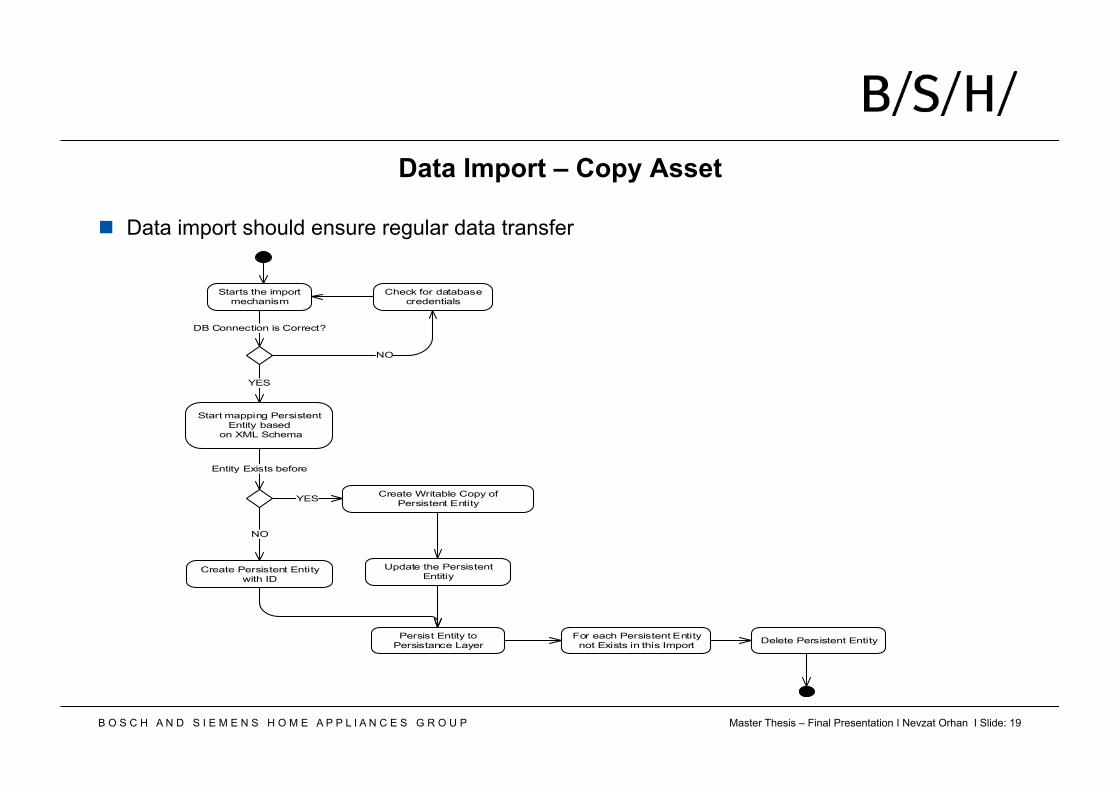
Data Import – Copy Asset
n Data import should ensure regular data transfer
Starts the importmechanism
Check for databasecredentials
NO
YES
Start mapping PersistentEntity based
on XML Schema
Entity Exists before
Create Writable Copy ofPersistent Entity
Create Persistent Entity with ID
YES
NO
DB Connection is Correct?
Update the Persistent Entitiy
Persist Entity toPersistance Layer Delete Persistent EntityFor each Persistent Entity
not Exists in this Import