Visualization methodology of Quality of Bathymetric Data ...
49
International Hydrographic Organization Organisation Hydrographique Internationale S-101PT4, Monaco, 13-14 June 2019 S-101 PROJECT TEAM Visualization methodology of Quality of Bathymetric Data and S-100 Validation Checks Presented by Chair of the Data Quality Working Group
Transcript of Visualization methodology of Quality of Bathymetric Data ...

International Hydrographic OrganizationOrganisation Hydrographique Internationale
S-101PT4, Monaco, 13-14 June 2019
S-101 PROJECT TEAM
Visualization methodology of Quality of Bathymetric Data
and
S-100 Validation Checks Presented by Chair of the
Data Quality Working Group

International Hydrographic OrganizationOrganisation Hydrographique Internationale
Data Quality
Good data quality does not mean
that the quality of the data has to be good.
It means that the end user is well informed
how good the Quality of the Data is.
S-101PT4, Monaco, 13-14 June 2019

International Hydrographic OrganizationOrganisation Hydrographique Internationale
IHO Data Quality Working Group [1]List of WG
Members:
• Australia
• Brazil
• Canada
• Denmark
• Finland
• France
• India
• Italy
• Indonesia
• Japan
• Mexico
• Netherlands
• Norway
• South Africa
• Sweden
• UK
• USA
Expert
Contributors:
• TELEDYNE
• IC-ENC
• INTERTANKO
• PRIMAR
• IHO TSSO
• IHO Secr.
italic =
correspondence
member
S-101PT4, Monaco, 13-14 June 2019

International Hydrographic OrganizationOrganisation Hydrographique Internationale
IHO Data Quality Working Group [2]

International Hydrographic OrganizationOrganisation Hydrographique Internationale
S-101PT4, Monaco, 13-14 June 2019
What problem needs to be resolved?
1. Paper CHRIS19-01.5B (former HSSC).
• Enhancing the Presentation of Survey Quality in an ENC (submitted by UK).
• Executive summary: To consider a recommendation of the UK’s Marine Accident Investigation Branch (MAIB) arising from its investigation into the grounding of the jack-up barge Octopus.
• Specifically, to investigate ways of ensuring that ECDIS displays provide a clear warning or indication to the mariner whenever the survey data used to produce the electronic chart in use is of poor quality.
• UK MAIB Report No 18/2007, published 9 August 2007: “Report of the investigation of the grounding of the jack-up barge Octopus towed by the tug Harald, Stronsay Firth, Orkney Islands, 8 September 2006”.
• Damage value: approximate UK£1M
International Hydrographic OrganizationOrganisation Hydrographique Internationale
S-101PT4, Monaco, 13-14 June 2019
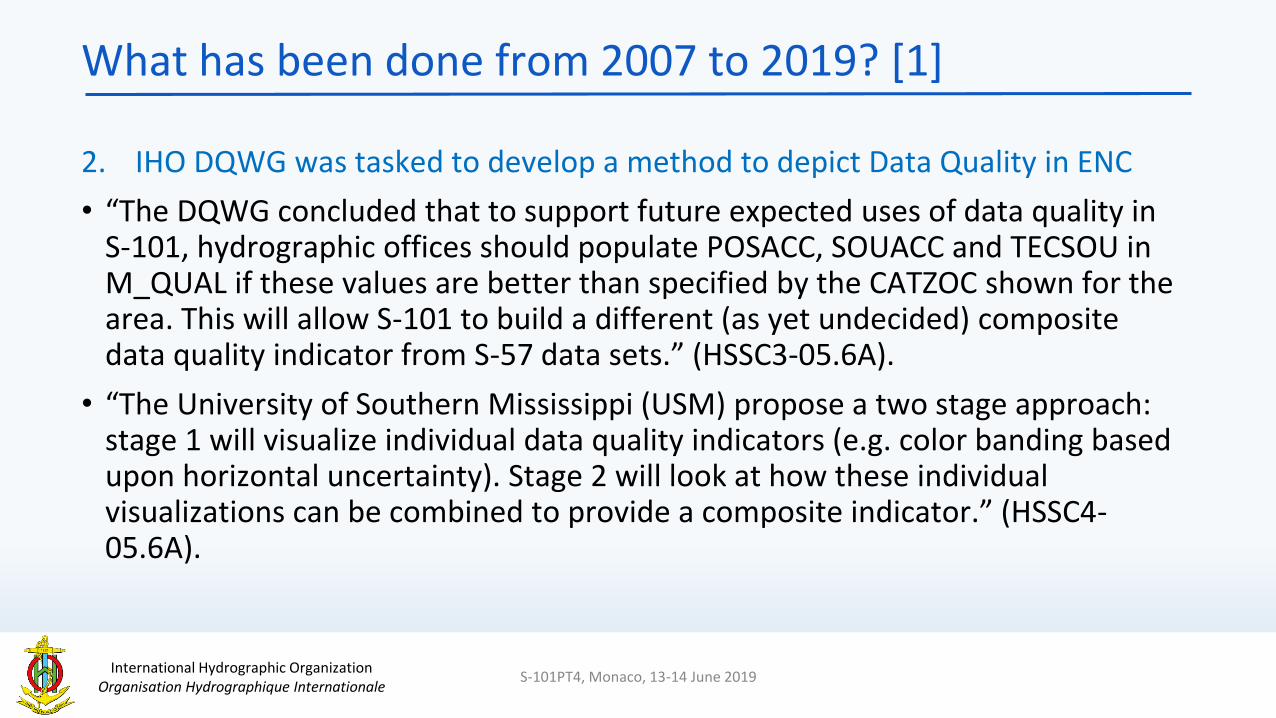
What has been done from 2007 to 2019? [1]
2. IHO DQWG was tasked to develop a method to depict Data Quality in ENC
• “The DQWG concluded that to support future expected uses of data quality in S-101, hydrographic offices should populate POSACC, SOUACC and TECSOU in M_QUAL if these values are better than specified by the CATZOC shown for the area. This will allow S-101 to build a different (as yet undecided) composite data quality indicator from S-57 data sets.” (HSSC3-05.6A).
• “The University of Southern Mississippi (USM) propose a two stage approach: stage 1 will visualize individual data quality indicators (e.g. color banding based upon horizontal uncertainty). Stage 2 will look at how these individual visualizations can be combined to provide a composite indicator.” (HSSC4-05.6A).

International Hydrographic OrganizationOrganisation Hydrographique Internationale
S-101PT4, Monaco, 13-14 June 2019
What has been done from 2007 to 2019? [2]
2. IHO DQWG was tasked to develop a method to depict Data Quality in ENC
• “Essentially the findings of USM confirmed that the concept of representing data quality by a color wash overlay of red for poor, yellow (amber) for medium and green (or clear) for good is the most intuitive and clearest means of doing so.” (HSSC5-05.6A).
• “One conclusion from this work was that the long held view that the final data quality display should be a red, amber or green color wash overlay was abandoned.” (HSSC6-05.6A rev.1).
• DQWG14-08C: Proposal for a new method to display quality information
• DQWG14: workshop to discuss this paper -> Proposal to HSSC-11 (May 2019)

International Hydrographic OrganizationOrganisation Hydrographique Internationale
S-101PT4, Monaco, 13-14 June 2019
The solution to the problem
3. Proposal for a conditional visualization methodology of Quality of Bathymetric Data.
1. Decision Tree How to allocate appropriate Quality of Bathymetric Data values. 2. Introduction of the concept of a SAFETY ZONE around the vessel.3. Get the POSACC and VERACC values of isolated features dangerous to
navigation.4. If not available, make use of the Aggregated value of QoBD and apply this to
isolated features dangerous to navigation.5. Draw circles around isolated features if they are within the SAFETY ZONE.6. Provide clear visible alarms to the Mariners -> SAFETY ZONE ALERT /
GROUNDING RISK.7. Make use of smart algorithms to show this information when needed.

International Hydrographic OrganizationOrganisation Hydrographique Internationale
Decision Tree (graphical) – STEP1
data
assessment
Start
S-101PT4, Monaco, 13-14 June 2019
temporal
variation
full area search undertaken,
significant seafloor features
detected, depths measured
vertical
uncertainty
horizontal
uncertainty
Quality of
Bathymetric
Data value
Assessed, not
Oceanic, not
Unassessed
QoBD =
Oceanic
QoBD =
Unassessed
unlikely to change
seafloor
coverage
0.50 + 1%depth 5 + 5%depth QoBD = 1
likely to change but
significant shoaling
unexpected1.0 + 2%depth 20m QoBD = 2
full area search not achieved,
uncharted features hazardous to
surface navigation are not expected
but may exist.
1.0 + 2%depth 50m QoBD = 3
full area search not achieved, depth
anomalies may be expected
likely to change and
significant shoaling
expected
extreme event
2.0 + 5%depth 500m QoBD = 4
full area search not achieved, large
depth anomalies may be expected
>2.0 + 5%depth >500m QoBD = 5
full area search undertaken,
significant seafloor features
detected, depths measured
true
false
(CATZOC A1)
(CATZOC A2)
(CATZOC B)
(CATZOC C)
(CATZOC D)

International Hydrographic OrganizationOrganisation Hydrographique Internationale
Decision Tree (textual) – STEP 1STEP Question/Result Answer = YES Answer = NO
1 Is data assessment = unassessed? Go to 2 Go to 3
2 QUALITY OF BATHYMETRIC DATA = UNASSESSED
3 Is data assessment = Oceanic? Go to 4 Go to 5
4 QUALITY OF BATHYMETRIC DATA = OCEANIC
5 Is category of temporal variation “Unlikely to change”? Go to 6 Go to 10
6 full area search undertaken, significant seafloor features detected, depths measured? Go to 7 Go to 15
7 Is vertical uncertainty < 0.5m + 1% of depth? Go to 8 Go to 12
8 Is horizontal position uncertainty < 5m + 5% of depth? Go to 9 Go to 13
9 QUALITY OF BATHYMETRIC DATA = 1 (CATZOC = A1)
10 Is category of temporal variation = likely to change but significant shoaling unexpected? Go to 11 Go to 19
11 full area search undertaken, significant seafloor features detected, depths measured? Go to 12 Go to 15
12 Is vertical uncertainty < 1.0m + 2% of depth? Go to 13 Go to 21
13 Is horizontal position uncertainty < 20m? Go to 14 Go to 17
14 QUALITY OF BATHYMETRIC DATA = 2 (CATZOC = A2)
S-101PT4, Monaco, 13-14 June 2019

International Hydrographic OrganizationOrganisation Hydrographique Internationale
Decision Tree (textual) – STEP 1
STEP Question/Result Answer = YES Answer = NO
15Full area search not achieved, uncharted features hazardous to surface navigation are not expected but may exist?
Go to 16 Go to 20
16 Is vertical uncertainty < 1.0m + 2% of depth? Go to 17 Go to 21
17 Is horizontal position uncertainty < 50m? Go to 18 Go to 22
18 QUALITY OF BATHYMETRIC DATA = 3 (CATZOC = B)
19 Is category of temporal variation = likely to change and significant shoaling expected? Go to 20 Go to 24
20 Full area search not achieved, depth anomalies may be expected? Go to 21 Go to 25
21 Is vertical uncertainty < 2.0m + 5% of depth? Go to 22 Go to 26
22 Is horizontal position uncertainty < 500m? Go to 23 Go to 26
23 QUALITY OF BATHYMETRIC DATA = 4 (CATZOC = C)
24 Is category of temporal variation = extreme event? Go to 26 Go to 2
25 Full area search not achieved, large depth anomalies may be expected? Go to 26 Go to 2
26 QUALITY OF BATHYMETRIC DATA = 5 (CATZOC = D)
S-101PT4, Monaco, 13-14 June 2019

International Hydrographic OrganizationOrganisation Hydrographique Internationale
HSSC-11, Cape Town, South Africa, 6-9 May 2019
SAFETY ZONE – STEP 2
• In current ECDIS systems, the Mariner enters a draft value, a Safety Depth andSafe Clear Distance (SCD) from isolated objects hazardous to navigation.
• By doing so, the Mariner creates a SAFETY ZONE around the vessel.
SCD (m)
Draft
Safety Depth
2 x SCD (m)
International Hydrographic OrganizationOrganisation Hydrographique Internationale
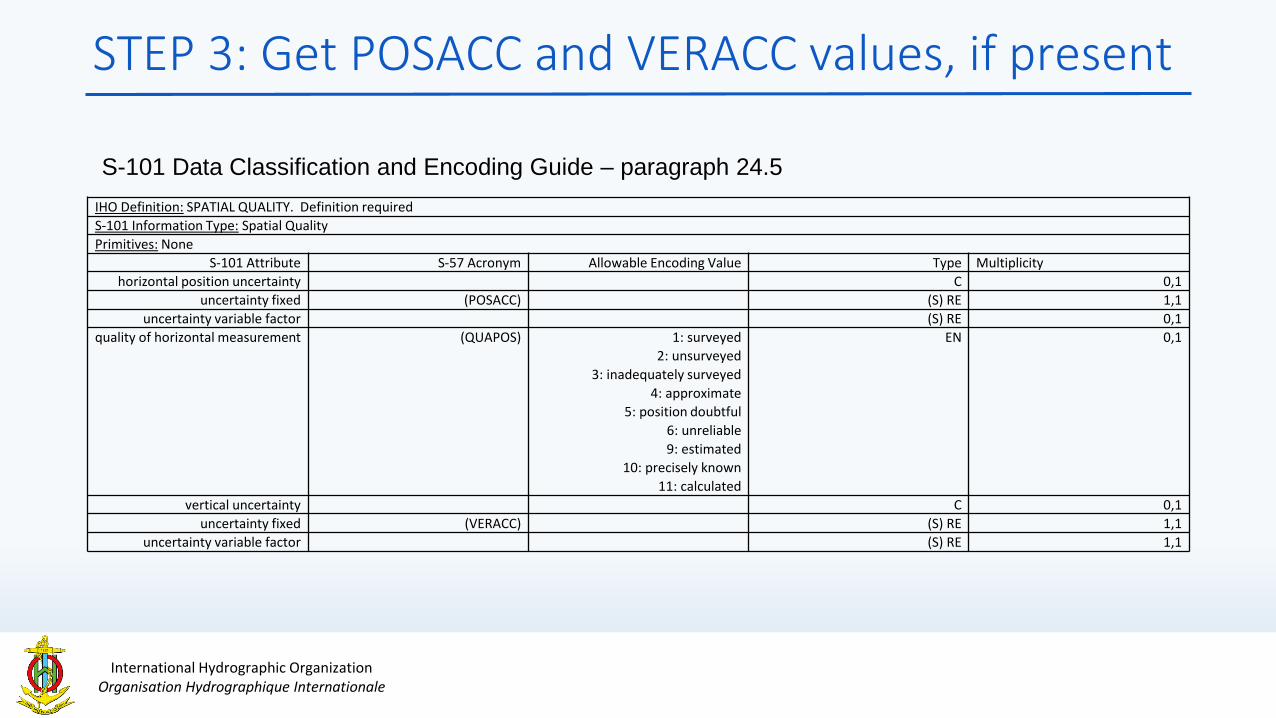
STEP 3: Get POSACC and VERACC values, if present
IHO Definition: SPATIAL QUALITY. Definition required
S-101 Information Type: Spatial Quality
Primitives: None
S-101 Attribute S-57 Acronym Allowable Encoding Value Type Multiplicity
horizontal position uncertainty C 0,1
uncertainty fixed (POSACC) (S) RE 1,1
uncertainty variable factor (S) RE 0,1
quality of horizontal measurement (QUAPOS) 1: surveyed
2: unsurveyed
3: inadequately surveyed
4: approximate
5: position doubtful
6: unreliable
9: estimated
10: precisely known
11: calculated
EN 0,1
vertical uncertainty C 0,1
uncertainty fixed (VERACC) (S) RE 1,1
uncertainty variable factor (S) RE 1,1
S-101 Data Classification and Encoding Guide – paragraph 24.5

International Hydrographic OrganizationOrganisation Hydrographique Internationale
S-101PT4, Monaco, 13-14 June 2019
STEP 4 – USE CATZOC VERTICAL UNCERTAINTY VALUES
• Smart algorithm, vertical uncertainty of Quality of Bathymetric Data is taken into account for decision support of a safe passage.
0 m2 m5 m
10 m
20 m
30 m
50 m
200 m
Oceanic
Draft = 17m
Safety Depth = 19m
Nearest SC = 20m0.7m 1.4m
(A1) (A2) (B)
1.4m
(C)
3.0m
(D)
>3.0m
(U)
?100 m
Vertical Uncertainty
Standard Contour LinesExample

International Hydrographic OrganizationOrganisation Hydrographique Internationale
S-101PT4, Monaco, 13-14 June 2019
STEP 4 – USE CATZOC VERTICAL UNCERTAINTY VALUES
• SAFETY ZONE alarm for UWTROC, WRECKS, OBSTRN, SOUNDG.
(A1) (A2 and B) (D) (U)(C)
Draft = 17m
Safety Depth = 19m
Nearest SC = 20m
Charted Depth of UWTROC = 20.1m
A1 = safe passageA2 = safety zone alertB = safety zone alertC = grounding riskD = grounding riskU = grounding risk
International Hydrographic OrganizationOrganisation Hydrographique Internationale
S-101PT4, Monaco, 13-14 June 2019
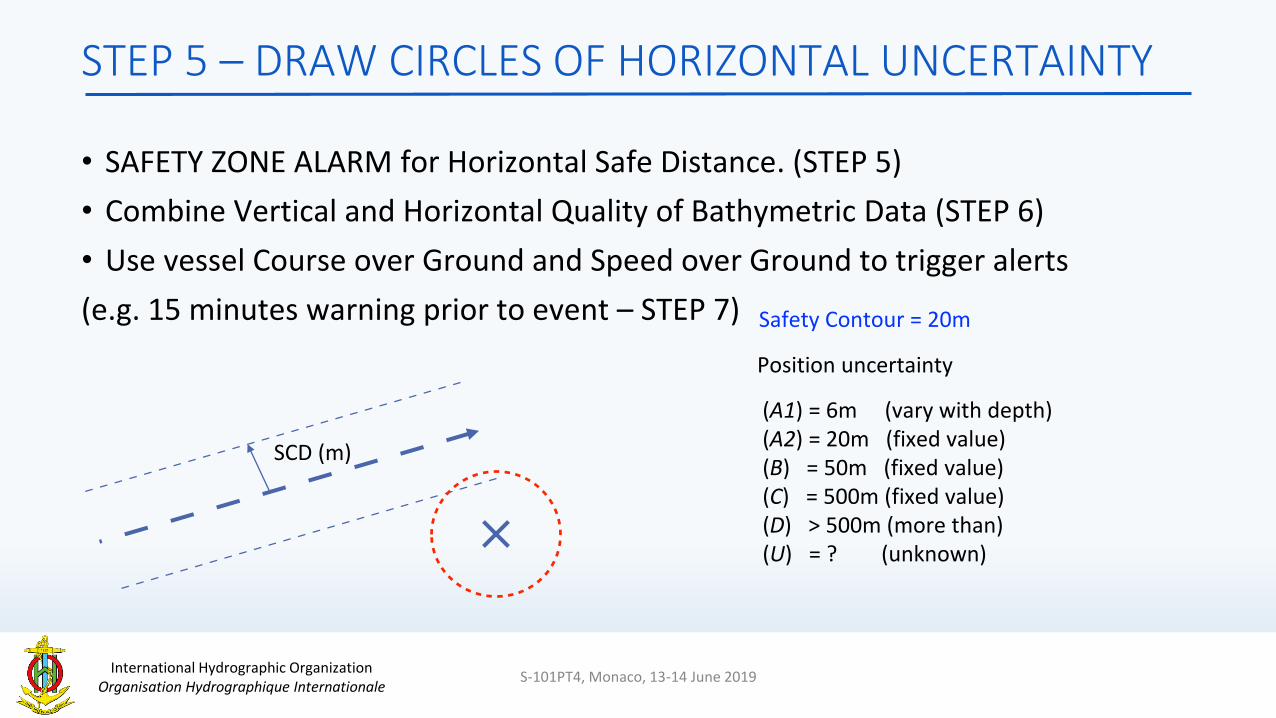
STEP 5 – DRAW CIRCLES OF HORIZONTAL UNCERTAINTY
• SAFETY ZONE ALARM for Horizontal Safe Distance. (STEP 5)
• Combine Vertical and Horizontal Quality of Bathymetric Data (STEP 6)
• Use vessel Course over Ground and Speed over Ground to trigger alerts
(e.g. 15 minutes warning prior to event – STEP 7)
SCD (m)
Safety Contour = 20m
Position uncertainty
(A1) = 6m (vary with depth)(A2) = 20m (fixed value)(B) = 50m (fixed value)(C) = 500m (fixed value)(D) > 500m (more than)(U) = ? (unknown)

International Hydrographic OrganizationOrganisation Hydrographique Internationale
GROUNDING RISK ALERT
Isolated danger with minimum depicted depth of 20.1m, no individual quality values. In area of CATZOC = C, least possible depth = 17.1m. System will issue a grounding risk alert.
Isolated danger with POSACC/VERACC – no safety zone or grounding risk alert.
S-101PT4, Monaco, 13-14 June 2019

International Hydrographic OrganizationOrganisation Hydrographique Internationale
BLOCKED PASSAGE D/T POOR QUALITY
S-101PT4, Monaco, 13-14 June 2019
Transit in-between two isolated dangers in CATZOC C area is not advised. DEPCNTs are approximate, drawn as dashed lines.

International Hydrographic OrganizationOrganisation Hydrographique Internationale
Visualization methodology of Quality of Bathymetric Data
• Method to depict the quality of the bathymetry and isolated features
hazardous to the safety of navigation. (wrecks, rocks, obstructions)
• Also supportive for decision making and autonomous shipping.
• Visual warning on front bridge (SAFETY ZONE ALERT or GROUNDING
RISK).
draft
safety
depth UKC
Safety zone = UKC+SCD
Charted depth = 20.1 m
20m contr
safe depth
draft
0.7m 1.4m 3.0m >3.0mA1 A2 B C D
Navigable depth (95% confidence)
CATZOC value
A1 = 19.4
A2, B = 18.7
C = 17.1
D < 17.1
Nearest safety contour20m

International Hydrographic OrganizationOrganisation Hydrographique Internationale
Visualization methodology of Quality of Bathymetric Data
Position uncertainty
(A1) = 6m (@20m)(A2) = 20m (fixed value)(B) = 50m (fixed value)(C) = 500m (fixed value)(D) > 500m (more than)(U) = ? (unknown)
50m circle
1:22000
50m circle
1:10000
CATZOC = C
CATZOC = A2
A circle is drawn around the wreck, the
positional uncertainty of CATZOC C is
applied. The fairway has CATZOC A2,
the circle stops at the edge of the
fairway.
If the navigable depth > Mariners safety
depth, no circle is drawn. Vessel can sail
over the isolated feature.
IF VERACC and/or POSACC of a wreck is
available it will be used, ELSE the QoBD value
will be used and depicted as PRECNT area
S-101 implementation:

International Hydrographic OrganizationOrganisation Hydrographique Internationale
S-101PT4, Monaco, 13-14 June 2019
Recommendations for S-101PT
• Screen wide symbology (CATZOC) is needed for spatial awareness.
• Avoid screen clutter.
• Should be an area centered symbol, not staggered. Maximum size = 5 mm.
• Boundaries of Quality of Bathymetric Data should be visualized.
• Introduce a check route functionality.
• Use QoBD values to validate the SAFETY ZONE under/around the vessel.
• Create clear warning signals (show details/accept) for SAFETY ZONE alerts in planning and monitoring mode.

International Hydrographic OrganizationOrganisation Hydrographique Internationale
S-101PT4, Monaco, 13-14 June 2019
Recommendations for HOs
• Provide meaningful values to Quality of Bathymetric Data (S-101)
(1, 2, 3, 4, 5 or Oceanic. Unassessed should not be used)
• Provide horizontal/vertical uncertainty for isolated features
(UWTROC, WRECKS, OBSTRN, SOUNDG) hazardous to navigation:
- if the horizontal/vertical uncertainty of the individual features is different from thesurrounding Quality of Bathymetric Data (CATZOC),
- mainly in areas < 30m depth,
- in/close to major shipping routes.
• Assign DEPCNTs with QUAPOS=3 (inadequately surveyed) or QUAPOS=4 (approximate) in areas with CATZOC=D (all depths) or C (<30m depth).
• Be aware of vertical uncertainty when generating High-Density ENCs in areas of Quality of Bathymetric Data = 4 or 5 (CATZOC = C or D).
• Be aware of the use of S-102 as a decision aid, combined with S-101.

International Hydrographic OrganizationOrganisation Hydrographique Internationale
Decision making and autonomous shipping
S-101PT4, Monaco, 13-14 June 2019
Departure
(berth)
Pilot
Station
Pilot
Station
Arrival
(berth)
Autonomous part of journey
Conventional
route
planning
Apply draft,
safety zone
Apply Quality
of
Bathymetric
Data
(CATZOC)
Compute
shortest and
safe route
Execute and
monitor
voyage

International Hydrographic OrganizationOrganisation Hydrographique Internationale
The concept of Data Quality -> Validation
courtesy of ISO
S-101PT4, Monaco, 13-14 June 2019

International Hydrographic OrganizationOrganisation Hydrographique Internationale
S-1xx Validation Checks
• List of recommendations of Validation Checks
• Follows the ISO 19157 Guideline
• Will lead to a Minimum Standard for Data Validation
• To be incorporated into S-97 part C (Data Quality)
• Validation needs to be operational for acceptance of S-101 Ed 3.0.0
S-101PT4, Monaco, 13-14 June 2019

International Hydrographic OrganizationOrganisation Hydrographique Internationale
ISO 19157 Ordering in data quality evaluation [1]
actual dataset
format consistency evaluation (1)
readable?no
not readable part
readable part of
actual dataset
conformant
with rules?
yes
data items violating rulesno
data suitable for further assessment
yes
other logical consistency evaluation (2)
courtesy of ISO
S-101PT4, Monaco, 13-14 June 2019

International Hydrographic OrganizationOrganisation Hydrographique Internationale
ISO 19157 Ordering in data quality evaluation [2]
completeness evaluation (3)
items present
in actual data
and ground
truth?
no items present in either
actual data or ground truth
features present both in
actual and ground truth data
yes
data suitable for further assessment
accuracy evaluation (4)
courtesy of ISO
S-101PT4, Monaco, 13-14 June 2019

International Hydrographic OrganizationOrganisation Hydrographique Internationale
Logical consistency - definition
• Logical Consistency is defined as the degree of adherence to logical rules of data structure, attribution, and relationships (data structure can be conceptual, logical or physical). If these logical rules are documented elsewhere (for example in a data product specification) then the source should be referenced (for example in the data quality evaluation).
S-101PT4, Monaco, 13-14 June 2019

International Hydrographic OrganizationOrganisation Hydrographique Internationale
Format consistency evaluation (1)
• format consistency – degree to which data is stored in accordance with the physical structure of the dataset
• Format consistency is described in S-100 part 10 – Encoding formats
• S-100 does not mandate particular encoding formats so it is left to developers of product specifications to decide on suitable encoding standards and to document their chosen format. The issue of encoding information is complicated by the range of encoding standards that are available, which include but are not limited to: ISO/IEC8211, GML, XML, GeoTiff, HDF-5, JPEG2000.
S-101PT4, Monaco, 13-14 June 2019

International Hydrographic OrganizationOrganisation Hydrographique Internationale
Other logical consistency evaluation (2)
• conceptual consistency – adherence to rules of the conceptual schema
• domain consistency – adherence of values to the value domains
• topological consistency – correctness of the explicitly encoded topological characteristics of a dataset
S-101PT4, Monaco, 13-14 June 2019

International Hydrographic OrganizationOrganisation Hydrographique Internationale
Conceptual consistency (2a)
• S-100 part 1, conceptual schema language. It provides description of:
• classes
• attributes
• basic data types
• primitive types
• complex types
• predefined derived types
• enumerated types
• codelist types
• relationships and associations
• composition and aggregation
• stereotypes
• optional, conditional, and mandatory
attributes and associations
• naming and name spaces
• notes
• packages
S-101PT4, Monaco, 13-14 June 2019

International Hydrographic OrganizationOrganisation Hydrographique Internationale
Domain consistency (2b)
This is described in S-100 Part 5 – Feature Catalogue.
This Part provides a standard framework for organizing and reporting the classification of real world phenomena in a set of geographic data. It defines the methodology for classification of the feature types and specifies how they are organized in a feature catalogue and presented to the users of a set of geographic data. This methodology is applicable to creating catalogues of feature types in previously uncatalogued domains and to revising existing feature catalogues to comply with standard practice. It applies to the cataloguing of feature types that are represented in digital form. Its principles can be extended to the cataloguing of other forms of geographic data.
S-101PT4, Monaco, 13-14 June 2019

International Hydrographic OrganizationOrganisation Hydrographique Internationale
Topological consistency (2c)
• This is described in S-100 Part 7 – Spatial Schema. It supports 0, 1, 2, and 2.5 dimensional spatial schemas and two levels of complexity –geometric primitives and geometric complexes.
• S-101 Validation Checks.xlsx lists a number of Topological checks.
• Inherited from S-58 Validation checks that apply to S-57 Topological Validation.
• Based on ISO 19125-1:2004 Geometry
S-101PT4, Monaco, 13-14 June 2019
International Hydrographic OrganizationOrganisation Hydrographique Internationale
Definitions for ISO 19125-1:2004 geometry [1]
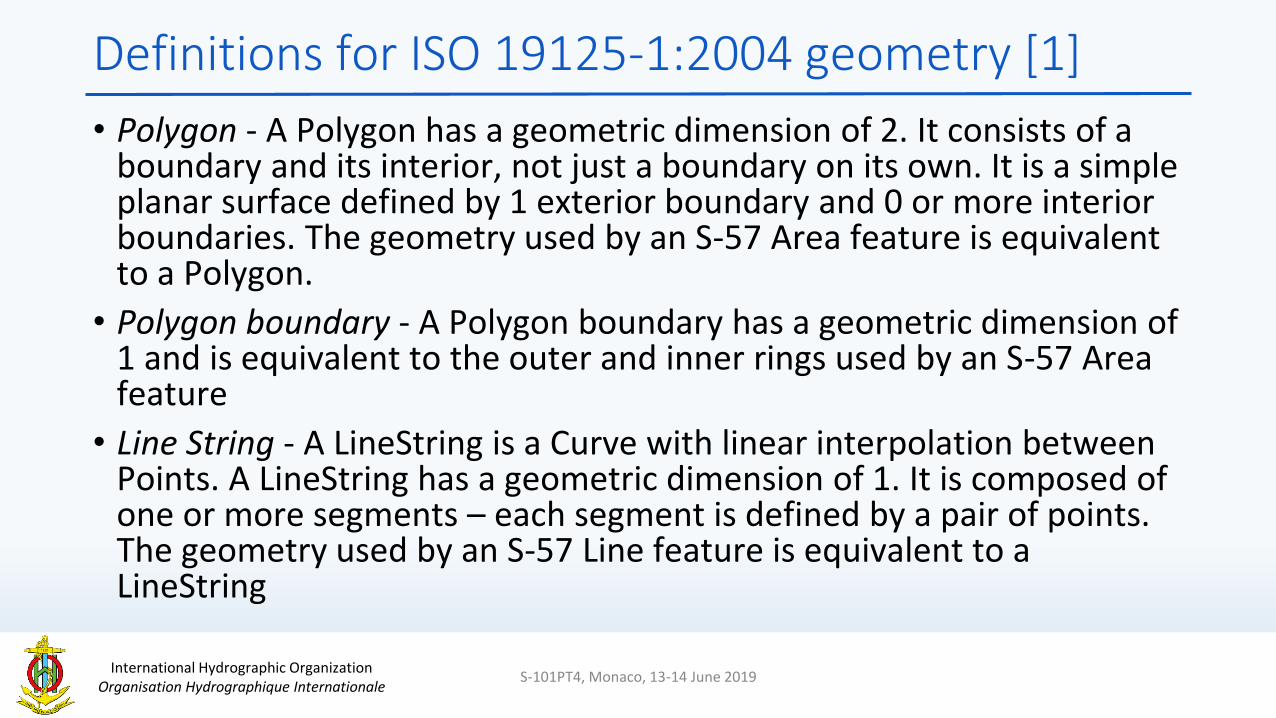
• Polygon - A Polygon has a geometric dimension of 2. It consists of a boundary and its interior, not just a boundary on its own. It is a simple planar surface defined by 1 exterior boundary and 0 or more interior boundaries. The geometry used by an S-57 Area feature is equivalent to a Polygon.
• Polygon boundary - A Polygon boundary has a geometric dimension of 1 and is equivalent to the outer and inner rings used by an S-57 Area feature
• Line String - A LineString is a Curve with linear interpolation between Points. A LineString has a geometric dimension of 1. It is composed of one or more segments – each segment is defined by a pair of points. The geometry used by an S-57 Line feature is equivalent to a LineString
S-101PT4, Monaco, 13-14 June 2019

International Hydrographic OrganizationOrganisation Hydrographique Internationale
Definitions for ISO 19125-1:2004 geometry [2]
• Line - An ISO 19125-1:2004 line is a LineString with exactly 2 points. Note that the geometry used by an S-57 Line feature is equivalent to a LineString, not a line in ISO 19125-1:2004 terms. In this document the term Line refers to an S-57 Line feature or a LineString which can have more than two points.
• Point - Points have a geometric dimension of 0. The geometry used by an S-57 Point feature is equivalent to an ISO 19125-1:2004 point.
• Reciprocal – inversely related or opposite.
ISO 19125-1:2004 S-101
Polygon Area feature geometry OR Area
Polygon boundary Outer and inner rings
LineString Line feature geometry OR Line
Point Point feature geometry OR Point

International Hydrographic OrganizationOrganisation Hydrographique Internationale
Geometric operator relationships
• In ISO 19125-1:2004 the dimensionally extended nine-intersection model (DE-9IM) defines 5 mutually exclusive geometric relationships between two objects (Polygons, LineStrings, and/or Points). One and only one relationship will be true for any two given objects:
1. WITHIN
2. CROSSES
3. TOUCHES
4. DISJOINT
5. OVERLAPS
S-101PT4, Monaco, 13-14 June 2019

International Hydrographic OrganizationOrganisation Hydrographique Internationale
Other operators to help define the relationship
1. CONTAINS
- the reciprocal of WITHIN
- within is the primary operator; however, if a is not within b then a may contain bso CONTAINS may be the unique relationship between the objects.
2. EQUAL
- a special case of WITHIN / CONTAINS.
3. INTERSECTS
- reciprocal of DISJOINT
- have at least one point in common
4. COVERS and is COVERED_BY
- reciprocal operators
- extends CONTAINS and WITHIN respectively
5. COINCIDENT
S-101PT4, Monaco, 13-14 June 2019

International Hydrographic OrganizationOrganisation Hydrographique Internationale
Example - WITHIN
a)Polygon / Polygon
b)Polygon / LineString
c)LineString / LineString
d)Polygon / Point
e)LineString / Point
S-101PT4, Monaco, 13-14 June 2019

International Hydrographic OrganizationOrganisation Hydrographique Internationale
Example - CROSSES
Note that example c) shows one solid
line and one dashed line – their
interiors intersect.
If any Line were split into two separate
Line features at the intersection point
then the relationship would be
TOUCHES because a boundary would
be involved.
S-101PT4, Monaco, 13-14 June 2019

International Hydrographic OrganizationOrganisation Hydrographique Internationale
Example - TOUCHES
Note the Polygon touches Polygon
example (a) is also a case where
the Polygon boundaries are
COINCIDENT.
In the Polygon/LineString example
two of the LineStrings that share a
linear portion of the Polygon
boundary are also COINCIDENT
with the Polygon boundary
S-101PT4, Monaco, 13-14 June 2019

International Hydrographic OrganizationOrganisation Hydrographique Internationale
Example - DISJOINT
This translates to: Geometric object a is disjoint from Geometric Object b if the intersection of
a and b is the empty set.
S-101PT4, Monaco, 13-14 June 2019

International Hydrographic OrganizationOrganisation Hydrographique Internationale
Example - OVERLAPS
Note: Lines that OVERLAP are also COINCIDENT
S-101PT4, Monaco, 13-14 June 2019

International Hydrographic OrganizationOrganisation Hydrographique Internationale
Example - EQUALS
Geometric object a is spatially equal to geometric object b.
S-101PT4, Monaco, 13-14 June 2019

International Hydrographic OrganizationOrganisation Hydrographique Internationale
Example – COVERS and IS COVERED BY
Given two geometric objects,
a and b,
if a is COVERED_BY b
then b must cover a
No point of geometry a is
outside geometry b.
Note that the figure above on the left is an example of Lines that are COVERED_BY a polygon.
The figure on the right is NOT an example of a Line that is covered by a Polygon – it is an example of a
Line that TOUCHES a Polygon. In both cases the Lines are COINCIDENT with the Polygon boundary.
S-101PT4, Monaco, 13-14 June 2019

International Hydrographic OrganizationOrganisation Hydrographique Internationale
Example - COINCIDENT
Example of two coincident lines.
Above are examples of objects
COINCIDENT with the boundary of a
Polygon. LineStrings following a portion
of a Polygon boundary or Polygons
sharing a boundaryportion.
Note that by definition a Line can be
COINCIDENT with an interior boundary of
a Polygon.
S-101PT4, Monaco, 13-14 June 2019

International Hydrographic OrganizationOrganisation Hydrographique Internationale
Completeness evaluation (3)
• Completeness is defined as the presence and absence of features, their attributes, and relationships. It consists of two data quality elements:
- commission, excess data present in a dataset;
- omission, data absent from a dataset.
S-101PT4, Monaco, 13-14 June 2019
International Hydrographic OrganizationOrganisation Hydrographique Internationale
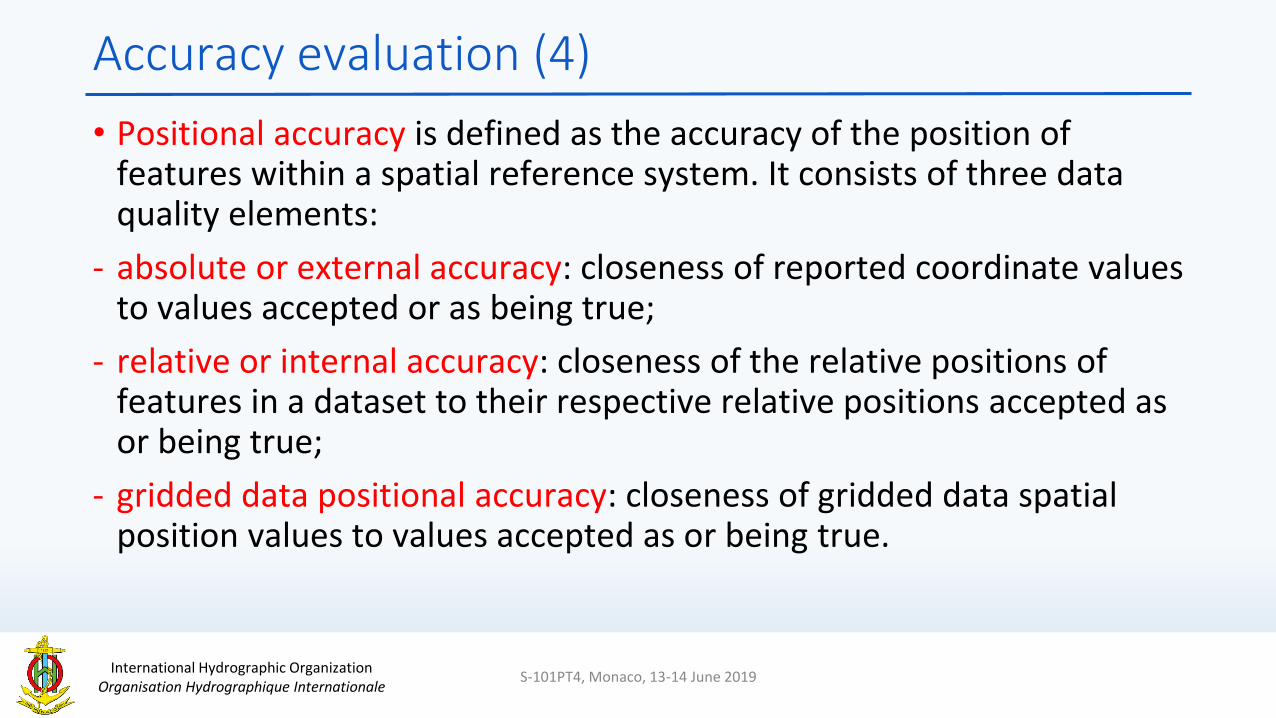
Accuracy evaluation (4)
• Positional accuracy is defined as the accuracy of the position of features within a spatial reference system. It consists of three data quality elements:
- absolute or external accuracy: closeness of reported coordinate values to values accepted or as being true;
- relative or internal accuracy: closeness of the relative positions of features in a dataset to their respective relative positions accepted as or being true;
- gridded data positional accuracy: closeness of gridded data spatial position values to values accepted as or being true.
S-101PT4, Monaco, 13-14 June 2019

International Hydrographic OrganizationOrganisation Hydrographique Internationale
S-101 Validation Checks (S-101PT4-3.5)
• Total of 420 record (different validation checks)
1. format consistency check: 3 records
2. conceptual consistency checks: 103 records
3. domain consistency checks: 1 record
4. topological consistency checks: 75 records
5. completeness checks: 8 records
6. accuracy evaluation: 2 records
S-101PT4, Monaco, 13-14 June 2019

International Hydrographic OrganizationOrganisation Hydrographique Internationale
Action required of S-101PT
• Note this report
• Raise own HO awareness about:
• Existence of the Decision Tree to allocate QoBD value
• Existence of the methodology of visualization of the QoBD
• Note the recommendations for HOs regarding QoBD
• Provide test data for this methodology
• Note the recommendations from ISO ordering Validation Checks
• Consider if all appropriate logical consistency checks are present
• Take any action as deemed appropriate
S-101PT4, Monaco, 13-14 June 2019