VISUALIZATION AND CONSTRUCTION OF REAL TIME...
18
100 CHAPTER 7 VISUALIZATION AND CONSTRUCTION OF REAL TIME WEB-CENTRIC INTELLIGENT HEALTH CARE DIAGNOSTIC SYSTEM USING UML 7.1 INTRODUCTION Unified modeling language (UML) is appropriate for modeling systems ranging from enterprise information systems to distributed Web based applications. A visual modeling language, such as UML, allows software to be visualised in multiple dimension, so that a computer system can be completely understood before the construction begins. Furthermore, UML can be used to produce several models at increasing levels of detail. The overall scope of the software can quickly and easily be defined at the start of the project with a high level model allowing for accurate estimation. Details in increasing levels can then be added to each part of the software as it is constructed, until finally the software appears as code. The code can then be tested against a test model that is derived from the original model of requirements. The ultimate aim of this research is to develop an overall scope of the Web based telehealth care intelligent diagnostic system using UML notations with a high level model allowing for accurate estimation. The Use Case Driven nature of modeling with UML ensures that all levels of model trace back to elements of the original functional requirements.
Transcript of VISUALIZATION AND CONSTRUCTION OF REAL TIME...

100
CHAPTER 7
VISUALIZATION AND CONSTRUCTION OF REAL TIME WEB-CENTRIC INTELLIGENT HEALTH CARE
DIAGNOSTIC SYSTEM USING UML
7.1 INTRODUCTION
Unified modeling language (UML) is appropriate for modeling
systems ranging from enterprise information systems to distributed Web
based applications. A visual modeling language, such as UML, allows
software to be visualised in multiple dimension, so that a computer
system can be completely understood before the construction begins.
Furthermore, UML can be used to produce several models at increasing
levels of detail. The overall scope of the software can quickly and easily
be defined at the start of the project with a high level model allowing for
accurate estimation. Details in increasing levels can then be added to
each part of the software as it is constructed, until finally the software
appears as code. The code can then be tested against a test model that is
derived from the original model of requirements.
The ultimate aim of this research is to develop an overall scope of
the Web based telehealth care intelligent diagnostic system using UML
notations with a high level model allowing for accurate estimation. The
Use Case Driven nature of modeling with UML ensures that all levels of
model trace back to elements of the original functional requirements.

101
The justification that orients the precious detection of the diabetes
diseases, as well as of any other diabetes related diseases is that the
earlier the disease is diagnosed, more effective will be the more will be
the cure, allowing less aggressive treatment. In a few years time, Internet
and especially WWW developed quickly from a media of information
sharing to a ubiquitous platform of several applications like online
banking, e-governance, e-commerce, digital libraries etc. Today, the
developers of expert systems have the good chance to share their
applications via the Web also.
The promotion of an expert system includes a number of
challenges that must be surmounted like: domain experts’ identification
and persuasion for collaboration, knowledge acquisition and knowledge
representation, coding, validation, verification etc . Hence, we propose a
Web centric expert system with design, development and maintain a
complex Web site, which embodies the expert system. Since there is a
frantic rush to be on the Web, the number of expert systems are expected
to grow, which is a reason for some of the current problems surrounding
Web based systems development.
7.2 VISUALIZATION AND CONSTRUCTION OF REAL TIME
WEB CENTRIC INTELLIGENT HEALTH CARE
DIAGNOSIS SYSTEM USING UNIFIED MODELING
LANGUAGE
The activity model is a variation of a state machine in which the
states are activities representing the performance of operations. The

102
transitions are triggered by the completion of the operations. It represents
a state machine of a procedure itself; the procedure is the implementation
of an operation on the owning class.
Table 7.1 Activity of the objects
OBJECTS ACTIVITY
Patient Login, Answer, Questions Telehealth server Verify, preliminary Questions, generate tests, indepth
questions, generate diagnosis and prescription, Alert
Doctor Approve the diagnosis Attendant Conduct tests, update the results
Figure 7.1 shows the activity diagram of the Web centric expert
system that describes the dynamic aspects of the systems. It is a flow
chart showing the flow of control from one activity to another activity of
the Web centric expert system. It also depicts the sequential steps in a
computational process. This activity diagram will be useful for
constructing executable systems through forward and reverse
engineering. Table 7.1 focuses on the activities that take place among the
objects patient, telehealth server, doctor and attendant and the operations
that pass among the objects.
We use activity diagrams in situations wherein all or most of the events represent the completion of internally-generated actions (that is, procedural flow of control). We use ordinary state diagrams in situations wherein asynchronous events occur.

103
Figure 7.1.Activity diagram of Web centric diabetes diagnosis Telemedicine
system
A class diagram is a type of static structure diagram that describes
the structure of a system by showing the system's classes, their attributes,
and the relationships between the classes. Figure 7.2 shows the class
diagram of the Web centric expert system with a set of classes like
patients, hospitals, kiosk, doctors, and their attributes, interfaces, and
collaborations and their relationships. It is the static design view of the
Web centric expert system.
The purpose of a class diagram for Web centric expert system is to
depict the classes within the model. In an object-oriented application,
classes have attributes (member variables), operations (member
functions) and relation-ships with other classes. The UML class diagram
of Web centric expert system depicts all these things quite easily. The

104
fundamental element of the class diagram is an icon the represents a
class. A class icon is simply a rectangle divided into three
compartments. The topmost compartment contains the name of the class
(patient). The middle compartment contains a list of attributes (member
variables- name, address, email-id, date of birth etc), and the bottom
compartment contains a list of operations (member functions-login,
answer questions , undergo tests ).
Figure 7.2- Class diagram of Web centric diabetes diagnosis Telemedicine
system
The collaboration diagram focuses upon the relationships between the objects.
They are very useful in visualizing the way several objects collaborate to get a
job done and for comparing a dynamic model with a static one. Collaboration and
105
sequence diagrams describe the same information, and can be transformed into
one another without difficulty. The collaboration diagram of Web centric expert
system allows us to name a conceptual chunk that encompasses both static and
dynamic aspects. It names a society of classes, interfaces, and other elements that
work together to provide cooperative behavior.
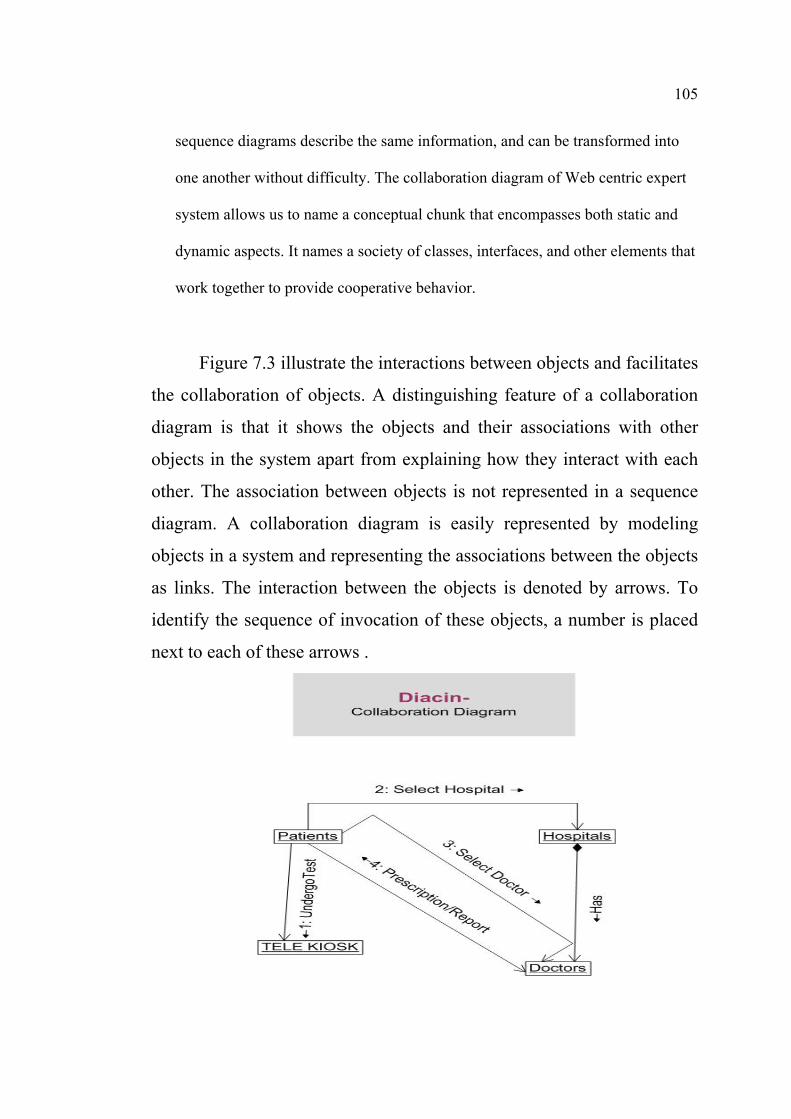
Figure 7.3 illustrate the interactions between objects and facilitates
the collaboration of objects. A distinguishing feature of a collaboration
diagram is that it shows the objects and their associations with other
objects in the system apart from explaining how they interact with each
other. The association between objects is not represented in a sequence
diagram. A collaboration diagram is easily represented by modeling
objects in a system and representing the associations between the objects
as links. The interaction between the objects is denoted by arrows. To
identify the sequence of invocation of these objects, a number is placed
next to each of these arrows .

106
Figure 7.3. Collaboration diagram of Web centric diabetes diagnosis
Telemedicine system
The main purpose of the component diagram is to show the structural
relationships between the components of a system. Component diagrams are
useful communication tools for various groups. The diagrams can be presented to
key project stakeholders and the implementation staff. Developers find the
component diagram useful because it provides them with a high-level,
architectural view of the system that they will be building, which helps
developers begin formalizing a roadmap for the implementation, and make
decisions about task assignments and/or needed skill enhancements. Figure 7.4
shows a component diagram which depicts how a Web centric intelligent health
care diagnosis system is split up into physical components and shows the
dependencies among these components. Physical components could be, for
example, files, headers, link libraries, modules, executables, or packages.

107
Figure 7.4. Component diagram of Web centric diabetes diagnosis
Telemedicine system
Figure 7.5 shows the UML sequence diagram, which models the
flow of logic within the system in a visual manner, enabling us both to
document and validate our logic, and are commonly used for both
analysis and design purposes. Sequence diagrams are the most popular
UML artifact for dynamic modeling, which focuses on identifying the
behavior within our system.
Sequence diagrams are typically used to model:
Usage scenarios- A usage scenario is a description of a potential
way our system is used.
The logic of methods- Sequence diagrams can be used to explore
the logic of a complex operation, function, or procedure.
The logic of services- A service is effectively a high-level
method, often one that can be invoked by a wide variety of
clients.

108
Figure 7.5. Sequence diagram of Web centric intelligent health care
diagnosis system
The use case diagram is used to identify the primary elements and
processes that form the system as shown in Figure 7.6. The primary
elements are termed as "actors" and the processes are called "use cases."
The Use case diagram shows which actors interact with each use case. A
use case diagram captures the functional aspects of a system .Due to the
simplicity of use case diagrams, and more importantly, because they are
shorn of all technical jargon, use case diagrams are a great storyboard
tool for user meetings. Use case diagrams define the requirements of the
system being modeled and hence are used to write test scripts for the
modeled system.
Figure 7.6. Use case diagram of Web centric intelligent health care
diagnosis system

109
UML state charts are normally needed when an object has a different reaction dependent on its state. The state design pattern uses polymorphism to define behavior. The state pattern passes a reference to the state it wants to set. It normally uses the singleton pattern to pass this reference meaning to the states that are global. State chart diagram shown in Figure 7.7 represents the behavior of entities capable of dynamic behavior by specifying its response to the receipt of event instances. Typically, it is used for describing the behavior of classes, but state charts may also describe the behavior of other model entities such as use-cases, actors, subsystems, operations, or methods.
Figure 7.7. State chart diagram of Web centric intelligent health
care diagnosis
7.3 RESULTS AND DISCUSSIONS

110
The functionality of telehealth care solution is to interact with the
patient via the Internet through the user interface at the patient kiosk.
Figure 7.8 shows the patient entry login that can be done at the patient
kiosk end or at home through Internet.
Figure 7.8 The patient entry login
The tele expert system will conduct a virtual consultation session
with the user through the user interface to determine his/her current
health profile. The virtual consultation session is a GUI based dialogue
between the user and the tele expert system application during which the
expert system forwards the number of questionnaire to the user either to
collect information / verify available information and / or derived
conclusions as shown in Figure 7.9. The user is expected to provide valid

111
responses to the questions presented by the expert system in a touch
screen mode or through the customized keyboard.
Figure 7.9. The virtual consultation session between the user and
the tele expert system
Based on the user’s responses, the next questionnaire is generated
and passed back to the user. Each consultation session spans across
multiple transactions between the user and the tele expert system. The
attractive feature of the tele expert system is that it dynamically
generates the questions to be asked of the user based on the user’s
current health profile and his / her earlier submitted responses. During
the consultation, patient is suggested to undergo a series of suitable tests.
Figure 7.10 shows the Kiosk End: Tele-Health server analyses the
responses and suggests and tests to be undergone by the patient.

112
Figure 7.10. Kiosk End: Tele-Health server analyses
Patient has to move to the testing kiosk system, which is
interfaced with all the needed diagnostic instruments. Assisted by a
technician, the patient under goes the prescribed tests. Data acquired
during the tests process is automatically fed into the tele expert system
for diagnosis. The expert system makes a diagnosis by not just
considering the current signs and symptoms of an individual but taking
into account factors such as the individual medical history, present
medications and treatment plans, if any, as recorded in the individual’s
telehealth patient database.
Figure 7.11 shows the diagnosis report generated by the tele
expert system which will be submitted to the doctor end of the chosen
hospital for further review and confirmation.

113
Figure 7.11. Diagnosis report generated by the tele expert system
The doctor interface helps the clinician to view his own patients
who have requested for healthcare assistance. Doctor can view the
patient history, test results and the diagnosis summary generated by the
Expert system based on the symptoms and history of the patient and
medication as shown in Figure 7.12.

114
Figure 7.12. Diagnosis summary generated by the expert system
The doctor can review and confirm the diagnosis report and the
same is forwarded to the patient end through the telehealth server as
shown in Figures 7.13. A copy of the summary is recorded in the
telehealth patient database. A database (case database) is maintained to
record the patient name, location of patient request, consulting doctor,
the hospital and so on.

115
Figure 7.13. The doctor’s editing option to confirm the diagnosis
report
Figure 7.14. The doctor’s editing option to confirm the
prescription generated by the expert system

116
A confirmed diagnosis report along with the prescription will be
submitted to the patient end for print out as shown in Figure 7.14. Under
critical conditions, the patient is suggested to come ONLINE with the
doctor through videoconferencing or messaging facility for further
medical assistance.
Figure 7.15. The prescription and diet chart generated by the tele
diagnosis system.
The prescription and diet chart will be generated by the tele
diagnosis system as shown in Fig.7.15. When any request is received
from kiosk to the telehealth server, the server checks for validity of the
user. If the patient is a registered user, the tele expert system conducts a
virtual consultation session based on previous history and this can be
viewed as Web page at the patient kiosk end.

117
Load balancing is the major feature that is looked after by the
Telehealth server. When server receives multiple requests
simultaneously, load balancing is done to get optimal resource utilization
and decrease computing time. 2-mirrored HDD are used to attain greater
degree of fault tolerance, which allows the service to continue even in
the face of server down time due to server failure or server maintenance.
Once the dialogue between the healthcare institution end and the
patient kiosk end is complete, a copy of the generated report from the
expert system and the finalized report from the doctor end is stored in the
telehealth patient database.
7.4 CONCLUSIONS
The potential benefits of decision support systems for diabetic
patient management are seen to be the cost saving they provide in terms
of man-hours of verbal instruction by medical experts, the support in
terms of objectives and consistent decision making.
The UML is not a visual programming language, but its models can be directly
connected to a variety of programming languages. This Design process has been
followed for WEBDIACIN. The Web based intelligent Tele diabetes diagnosis
expert system WEBDIACIN, has the ability to access our diabetes expert system
from any part of the world.