Visualization & Vision Science
32
IEEE VIS 2017, Phoenix, AZ Visualization & Vision Science Ronald A. Rensink Departments of Psychology and Computer Science University of British Columbia Vancouver, Canada
Transcript of Visualization & Vision Science

IEEE VIS 2017, Phoenix, AZ
Visualization &Vision Science
Ronald A. Rensink
Departments of Psychology and Computer ScienceUniversity of British ColumbiaVancouver, Canada
2
Visualization and vision science can usefully interact in at least three ways:
1. The empirical results of vision science can help with design
2. The methodologies of vision science can help with evaluation
3. The general approach of vision science can help with understanding
3
Knowledge of human vision can help with design (e.g., Spence, 2007; Ware, 2012)
• color (e.g., Szafir, VIS 2017)
• texture (e.g., Hagh-Shenas, Interrante, & Park, 2006)
• motion (e.g., Bartram & Ware, 2002)
1. Empirical Results
Our knowledge of perception has been growing; human vision involves much more than these…

4
Visual Attention – is more important than we thought…

5
Change blindness (Rensink, O’Regan, & Clark, 1997)
– attention is needed to see change

6
Non-attentional processes – are also more important than we thought…
Visual Attention – is more important than we thought…
7
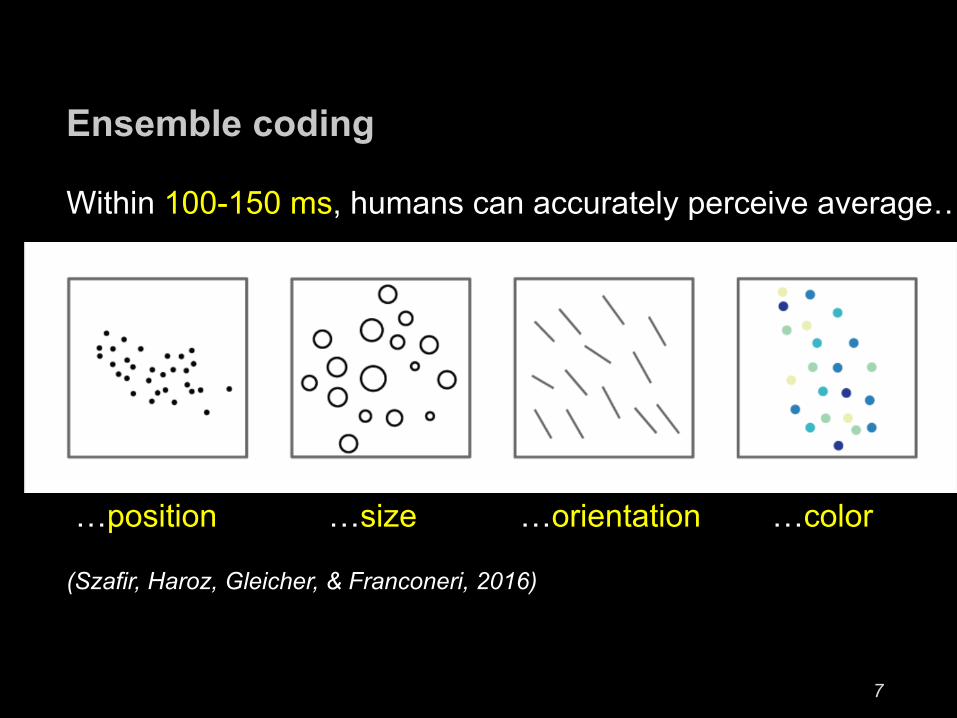
Ensemble coding
Within 100-150 ms, humans can accurately perceive average…
…position …size …orientation …color
(Szafir, Haroz, Gleicher, & Franconeri, 2016)

8
Vision Science: Empirical Results
Recommendations:• beware that perception is often not what you think,
and that our knowledge of it is rapidly changing
• try to use textbooks that are recent (≤ 10 yrs old)
• try to use review articles that are recent (≤ 10 yrs old)
• talk to your friendly neighborhood vision scientist J

9
Evaluation: Many ways to measure performance
Consider some of those developed in vision science…• highly sensitive assessments of performance
• quantities measured are often not obvious
• result of long experience in avoiding “booby traps”• can often be adapted to complex situations
2. Methodologies

10
E.g.: Just noticeable difference (JND)
Q: Which light has the greater intensity?
Light 1 Light 2
Intensity = 10 W Intensity = 12 W
JND = the difference in intensity needed tochoose correctly 75% of the time.
A measure of the precision (variability) of estimatesJND∝ 1 / SNR = noise / signal

11
JND(r) = separation (in r) for 75% correct
E.g.: Just noticeable difference (JND)
Q: Which scatterplot has the greater correlation?

12
!
(Let u = 1 - br)
Du = kuDu
u= k
Weber’s Law
Dr = JND (75% correct)Dr = k(1/b - r)
k: variability= 0.21 [.17, .24]
b: bias= 0.90 [.84, .94]
(Rensink & Baldridge, 2010)(also - Harrison et al., 2014)

13
JNDs can be applied to various representations
(Beecham, Dykes, Meulemans, & Wood, 2017)
E.g., spatial correlation in choropleth maps

14
Other kinds of measures are also relevant…- use relative rather than absolute measures
E.g. – measuring accuracy of correlation in scatterplots, use bisection rather than numbers
Adjust test plot to be midway between reference plots

15
Other kinds of measures are also relevant…- use relative rather than absolute measures
- multidimensional scaling (also relative)
- timing of processes (e.g., via masking)
- etc., etc…

16
Vision Science: Methodologies
Recommendations:• remember that there’s a lot of “booby-traps” out there
(e.g., estimating values by assigning numbers)
• look at handbook chapters in vision science
• talk to your friendly neighborhood vision scientist J

17
3. General Approach
Goal: Understanding—why does a visualization work?(aka theory…)
If we understood the mechanisms involved, might be able to• determine the conditions under which it will / won’t work• simplify / speed up parts of its evaluation• inspire new, more effective designs

18
Approach: Focus on minimal systems that actually exist,and are easy to manipulate.
Drosophila(fruit fly)

19
To investigate how a visualization works:
3. General Approach
3. look for laws that describe the results4. look for mechanisms to account for these laws / performance
1. create a minimal version of the target visualization2. measure performance under various conditions

20
Example #1: Scatterplots—correlation r (Rensink & Baldridge, 2010; Rensink, 2017)

21
(Rensink, 2017)!
PrecisionJND(r) = k (1 /b – r)
Accuracyg(r) = ln(1 – b r)
ln(1 – b)
Two parameters (k, b) describe precision and accuracyCan determine via just two JND measurements(!)

22
Color
Shape(symmetric)
No differences
No differences
Size
No differencesRensink (2014)

23
What underlies all this?

24
Proposal (Rensink, 2017):Our visual system perceives entropy
• Visual system infers a probability distribution from the dot cloud, likely via ensemble coding
• Logarithm of the width of this distribution approximates entropy• Perceptual system uses this as a proxy for Pearson correlation

25
Implication: Other kinds of visualizations are possible - based on inferred probability distributions, not pixels- new designs may work as well as scatterplots

26
Nonspatial carriers
<x1, x2>
(horizontal)(vertical)
<x1, x2>
(horizontal)(blue-yellow)

27
Same laws apply! (Rensink, 2014, 2015)

28
Same laws apply! (Rensink, 2014, 2015)

29
(Skau & Kosara, 2016)
Manipulate:
- Size of the slice• area• angle• perimeter
- Shape of the slice
Simplified task: What is the proportion of the (only) pie slice?
Example #2: Pie Charts—Proportions (Kosara & Skau, 2016; Skau & Kosara, 2016)

30
Vision Science: General Approach
Recommendations• research on “why” should be a distinct part of VIS• focus on minimal versions of visualizations
• cf . the use of fruit flies in biology
• focus on particular aspects of these• measure performance under controlled conditions
• connect—if possible—with perceptual mechanisms

31

32
A Huge Amount of Thanks to…
• Past & present members of the UBC Visual Cognition Lab:Akbar Alikhan
Gideon BaldridgeJacky ChungMario Cimet
Madison ElliottAdelena LeonNatália Lopes
Praveena Manogaran
Kyle MelnickYana Pertels
Theo RosenfeldBenjamin ShearRamyar Sigarchy
Sai VenkatasubramanianKristen WatermanSpencer Williams
• The Boeing Company for their support