The nautical charts of the Spanish Mediterranean - e-Perimetron

e-Perimetron, Vol. 5, No. 3, 2010 [118-131] www.e-perimetron.org | ISSN 1790-3769
[118]
Richard Rodger∗, Christopher Fleet∗∗, Stuart Nicol∗∗∗
Visualising urban geographies
Keywords: Historical maps; geo-referencing; geo-coding; economic and social history; Edinburgh
Summary: The paper builds on a current research partnership between academics and the Na-tional Library of Scotland's map collection. The central aim is to bring together socio-economic historical data with historical maps and expertise on their geo-referencing and web-mapping technologies provided by the NLS. (For further details see http://geo.nls.uk/urbhist/).
Introduction
In studies of towns and cities, and indeed throughout the humanities and social sciences, a signifi-cant volume of data is held as an address, or as an area, such as a registration district or ward. We even talk of post codes or zip codes when referring to differential levels of health provision or motor insurance. However, at all academic levels, from undergraduate projects to advanced post-doctoral research, the spatial dimension of historical analysis is often under-utilised by historians because the learning curve of Geographical Information Systems (GIS) is fierce for non-specialists. To have an accessible tool to map historical data for GIS novices would thus transform the research and teaching potential for many who are currently deterred by the steep investment of learning GIS. The partnership involved in this project is creating a dynamic website of open source applications, allowing new insights into the spatial character and historical development of the Scottish capital. Edinburgh will only be the exemplar for integrating historical mapping with historical data; the objective is to enable students, academics and the public to use new open source tools for related web-applications to reveal the spatial characteristics of other cities. This is a fundamentally differ-ent approach since 'Visualising Urban Geographies' brings hundreds of the NLS' historical maps within reach of users through a straightforward tool that can be customised to suit their own data. Thus, for example, a local history society's membership addresses for, say 1900 can be plotted on an NLS map of the period in a one-stop process that does not require expertise in GIS. The paper is split into three main sections that broadly cover the main objectives of the project:
� To create a set of geo-referenced historical maps of Edinburgh in the 19th century acces-sible for student learning purposes.
� To develop routines, using free and open source software, to allow the historical source material to be interrogated, layered, visualized, and analysed.
� To develop new graphical and statistical outputs (including dynamic maps, views, graphs, diagrams, reports) relating to the social and economic history of Edinburgh, and to further
∗ Professor of Economic and Social History, School of History, Classics and Archaeology, University of Edin-burgh [[email protected]] ∗∗ Deputy Map Collections Manager, National Library of Scotland [[email protected]] ∗∗∗ eLearning and Web Development Officer, School of History, Classics and Archaeology, University of Edin-burgh [[email protected]]

e-Perimetron, Vol. 5, No. 3, 2010 [118-131] www.e-perimetron.org | ISSN 1790-3769
[119]
the understanding of 19th and 20th century cities more generally through new representa-tions of its historical geography, cartography, and social and cultural history.
To create a set of geo-referenced historical maps of Edinburgh in the 19th century accessible for
student learning purposes
Through practically geo-referencing a set of historical maps for Edinburgh, this part of the project aims to create assistance on the practicalities of geo-referencing an historical map and making it available online. Fortunately, it is becoming steadily easier for those without knowledge of or ac-cess to a GIS to use free tools such as MetaCarta Rectifier1, MapCruncher2, Google Earth, Map-Warper3 or Georeferencer.org for geo-referencing. There are also growing quantities of freely available, relevant geo-referenced spatial data for control points to be matched to, and far greater quantities of ungeo-referenced mapping available as images. Once geo-referenced, tools such as MapTiler4 are becoming more versatile and powerful in their ability to transform a growing range of images in different formats and projections into the required WGS84 Spherical Mercator coor-dinate system for overlaying with Google Maps and Earth and related data and mapping. In short, in the lifetime of this project, we believe that the required tools and data will be freely available online to allow the geo-referencing of any historical map and the project will therefore point to these tools and provide advice and illustrations of using them. However, at this point in time, for the purposes of this project, we used a mixture of proprietary (ESRI ArcGIS) and open source (GDAL and MapTiler) software and geo-referenced historical mapping in NLS. The methodology was as follows:
� cropping the non-geographic parts of the map (ie. removing the margins / blank areas be-yond the map boundaries);
� opening the early map as an image in ArcGIS; � adding Control Points / Link Points of known locations to image; � transforming the map to the new position based on these control points.
We already had some existing geo-referenced historical Ordnance Survey maps covering Edin-burgh in the NLS, so the control points were matched to points on these maps. As the purpose of the geo-referencing was to overlay other data on these maps, the objective was to fit the early map as closely as possible to the real world. This is in distinction to other types of geo-referencing for the purposes of map retrieval or examining geodetic accuracy. We generally chose the higher-order spline or adjust polynomial transformations for our purposes. The spline transformation, as a true rubber sheeting method, transforms the source control points exactly to target control points, and optimises for local accuracy, but not global accuracy. The adjust transformation uses a mixture of the spline and affine transformation, taking account of the control points within a broader context, so optimises for both global and local accuracy (Boutoura & Livieratos, 2006). As noted by others, geo-referencing is an art as much as a science, and there was a need to ex-periment with different numbers of control points and these different transformations in order to achieve the best fit for particular maps.
1 http://labs.metacarta.com/rectifier/ 2 http://research.microsoft.com/en-us/um/redmond/projects/mapcruncher/ 3 http://warper.geothings.net/ 4 http://www.maptiler.org/

e-Perimetron, Vol. 5, No. 3, 2010 [118-131] www.e-perimetron.org | ISSN 1790-3769
[120]
In terms of coordinate reference systems, we used the British National Grid, commonly used within the United Kingdom and in internal NLS mapping. Once geo-referenced, the map was ex-ported as a GeoTIFF image which could be handled by MapTiler, specifying the relevant coordi-nate system (EPSG:27700). The resulting tileset could then be copied to the NLS web server, and made available through Google maps or Openlayers HTML and Javascript files (http://geo.nls.uk/urbhist/). The initial aim was to select 10-15 early maps of Edinburgh that would best illustrate the practi-calities of linking with social and economic data available for the city. The selection reflected the following main considerations:
� The need to use maps that could be meaningfully fitted on a modern map base. There has been and will be a continuing debate as to the practical and epistemological problems of warping and transforming early maps that were not intended to be visualized digitally in ways that are possible today. Whilst our aim was to illustrate this issue, we did not con-sider it appropriate to work before the earliest ichnographic (overhead) plan of the city, drawn by the military engineer, William Edgar in the mid 18th century.
� The need to use out-of-copyright mapping, constrained the end time limit to pre-1940 commercial mapping, and pre-1960 Crown Copyright (Ordnance Survey) mapping.
� A preference for using flat map sheets that have not been cut / dissected and mounted on linen. Flat sheets, scanned with a sheet-feed scanner, provided the best distortion-free im-ages. We also experimented, but found considerable difficulty, in mosaicking together separate dissections of maps. Unlike the Roy Military Survey mosaicking (Fleet & Kowal, 2007), that kept the original dissections as visible artefacts, aiming at an authentic facsim-ile of the original, our aim in this project was to best fit the map to the real world and ef-fectively erase the dissections. Mapping from over a century ago, has often lost edges to each dissection in variable ways, which when combined with differences of orientation and expansion/contraction over time, made for work that was more intricate and time-consuming than our project allowed for.
� The use of a range of scales of mapping in order to provide appropriate multiple back-drops to different types of data.
To develop routines, using free and open source software, to allow the historical source material
to be interrogated, layered, visualized, and analysed
We have been trialling a variety of free and open source tools for working with historical data and integrating it with the geo-referenced raster mapping described above. The majority of the data we have been working with is either address based, from sources such as post office directories, or statistical census data relating to city regions. In this section we will discuss some of our proposed methodologies.
Geo-coding
Geo-coding is the process of finding geographic coordinates from other geographic data - in this case we are looking to find coordinates in terms of latitude and longitude from an address. In the past this has involved expertise with GIS software and access to good quality commercial street-level data sets. With the release of Google, Yahoo! and Microsoft mapping APIs each has made street-level data freely available (under certain terms and conditions) and, via their APIs, the abil-

e-Perimetron, Vol. 5, No. 3, 2010 [118-131] www.e-perimetron.org | ISSN 1790-3769
[121]
ity to build web applications to geo-code many addresses at once. There are a number of existing web-based tools that make use of these APIs to convert addresses into coordinates and we feel that they are sufficiently easy to use and accurate so as to enable historians to prepare their source material for analysis. Some shortcomings to bear in mind:
� free datasets are often less accurate than commercially available ones; � street-level data not available for certain countries; � when dealing with historical data (e.g. addresses from old directories) it is worth remem-
bering that some addresses may be unavailable due to demolition, fire and new building development.
Geo-coding with Batchgeo
Batchgeo5 is a website that allows you to copy and paste multiple addresses from a spreadsheet into a web form to be geo-coded as a batch (fig. 1). The resulting points are presented on a Google Map and any obvious errors can be corrected by manually by moving the markers. The dataset can then be downloaded as a KML file (Keyhole Markup Language), to be viewed in Google Earth, or copied back to a spreadsheet complete with latitude, longitude, postal and accuracy col-umns. The website uses Google Maps API and also offers a version which queries the Yahoo! Maps API if the initial results appear inaccurate.
Figure 1: The batchgeo website.
5 http://www.batchgeocode.com/

e-Perimetron, Vol. 5, No. 3, 2010 [118-131] www.e-perimetron.org | ISSN 1790-3769
[122]
Geo-coding with Google Spreadsheets
Google Spreadsheets6 is part of the Google Docs family of online office applications. A signifi-cant feature of the spreadsheet application is that it allows you to take advantage of Googles ex-tensive online search facilities direct from the spreadsheet itself, including its geo-coding facilities (fig. 2). Using the =ImportData() formula it is possible to create an http geocode request and copy the formula into multiple cells. There are various explanations on the web describing in detail how to do this (e.g. see Tony Hirst’s Google Maps API tricks blog7). It is worth bearing in mind that, as of time of writing, this method is limited to 50 search requests per spreadsheet.
Figure 2: An example Google Spreadsheet with geo-coded addresses.
Thematic mapping
Thematic choropleth maps show statistical data aggregated over regions with tones or patterns applied to these regions. One major issue related to mapping historical statistical data is in trying to define the regions that it describes; census data may describe statistics in relation to registration districts or parishes, which have changed considerably. We have found it difficult to source digi-tised historic boundaries for Edinburgh. EDINA's UK Borders repository8 contains various digi-tised historic boundary types created by Portsmouth University's Great Britain Historic GIS Pro-
6 http://www.docs.google.com/ 7 http://apitricks.blogspot.com/2008/10/geocoding-by-google-spreadsheets.html 8 http://edina.ac.uk/ukborders/
e-Perimetron, Vol. 5, No. 3, 2010 [118-131] www.e-perimetron.org | ISSN 1790-3769
[123]
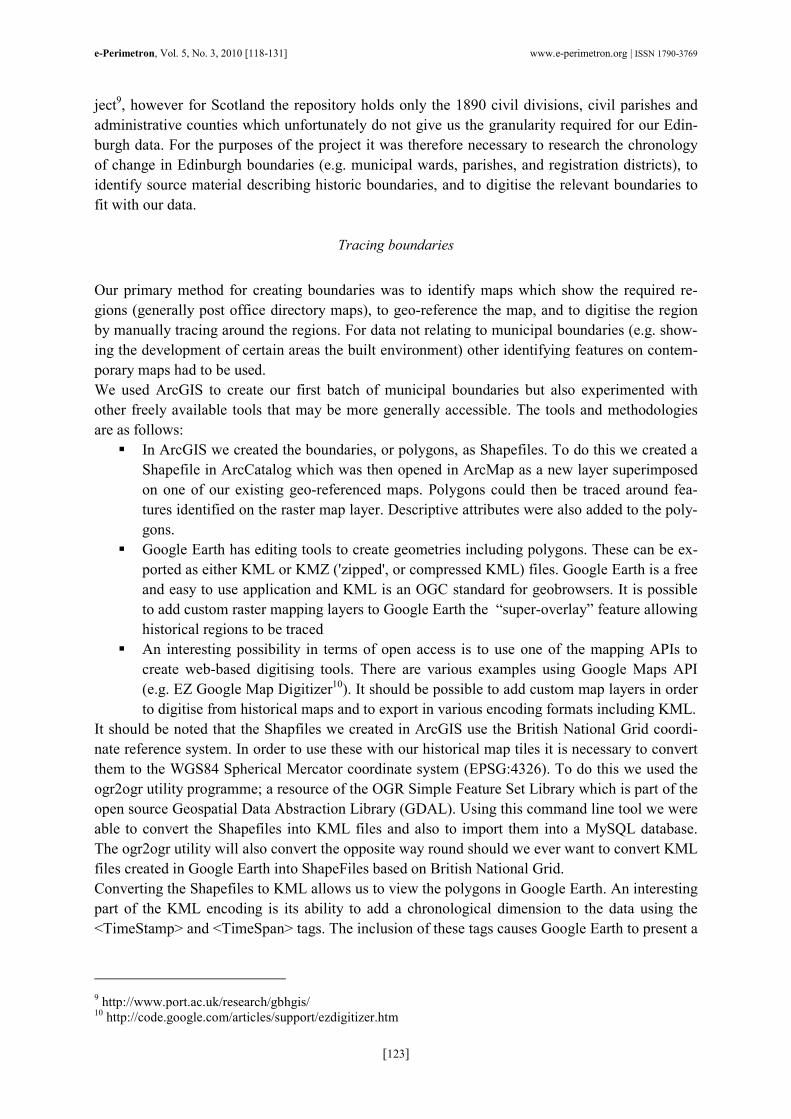
ject9, however for Scotland the repository holds only the 1890 civil divisions, civil parishes and administrative counties which unfortunately do not give us the granularity required for our Edin-burgh data. For the purposes of the project it was therefore necessary to research the chronology of change in Edinburgh boundaries (e.g. municipal wards, parishes, and registration districts), to identify source material describing historic boundaries, and to digitise the relevant boundaries to fit with our data.
Tracing boundaries
Our primary method for creating boundaries was to identify maps which show the required re-gions (generally post office directory maps), to geo-reference the map, and to digitise the region by manually tracing around the regions. For data not relating to municipal boundaries (e.g. show-ing the development of certain areas the built environment) other identifying features on contem-porary maps had to be used. We used ArcGIS to create our first batch of municipal boundaries but also experimented with other freely available tools that may be more generally accessible. The tools and methodologies are as follows:
� In ArcGIS we created the boundaries, or polygons, as Shapefiles. To do this we created a Shapefile in ArcCatalog which was then opened in ArcMap as a new layer superimposed on one of our existing geo-referenced maps. Polygons could then be traced around fea-tures identified on the raster map layer. Descriptive attributes were also added to the poly-gons.
� Google Earth has editing tools to create geometries including polygons. These can be ex-ported as either KML or KMZ ('zipped', or compressed KML) files. Google Earth is a free and easy to use application and KML is an OGC standard for geobrowsers. It is possible to add custom raster mapping layers to Google Earth the “super-overlay” feature allowing historical regions to be traced
� An interesting possibility in terms of open access is to use one of the mapping APIs to create web-based digitising tools. There are various examples using Google Maps API (e.g. EZ Google Map Digitizer10). It should be possible to add custom map layers in order to digitise from historical maps and to export in various encoding formats including KML.
It should be noted that the Shapfiles we created in ArcGIS use the British National Grid coordi-nate reference system. In order to use these with our historical map tiles it is necessary to convert them to the WGS84 Spherical Mercator coordinate system (EPSG:4326). To do this we used the ogr2ogr utility programme; a resource of the OGR Simple Feature Set Library which is part of the open source Geospatial Data Abstraction Library (GDAL). Using this command line tool we were able to convert the Shapefiles into KML files and also to import them into a MySQL database. The ogr2ogr utility will also convert the opposite way round should we ever want to convert KML files created in Google Earth into ShapeFiles based on British National Grid. Converting the Shapefiles to KML allows us to view the polygons in Google Earth. An interesting part of the KML encoding is its ability to add a chronological dimension to the data using the <TimeStamp> and <TimeSpan> tags. The inclusion of these tags causes Google Earth to present a
9 http://www.port.ac.uk/research/gbhgis/ 10 http://code.google.com/articles/support/ezdigitizer.htm

e-Perimetron, Vol. 5, No. 3, 2010 [118-131] www.e-perimetron.org | ISSN 1790-3769
[124]
timeline slider control allowing the user to view data from set periods of time. New York Public Library uses this technique to good effect in their Mapping NYC Google Earth index11 (fig. 3).
Figure 3: The New York Public Library Google Earth index.
Displaying polygons (tiles versus vectors)
There are well documented limitations in the use of vector overlays in Web 2.0 mapping (see An-toniou and Morley's paper12 for an interesting discussion on the subject). Although it is possible to display our polygons in a Google Maps API interface (fig. 4) we expect performance, particularly in Internet Explorer, to be sluggish due to the relative size of the shapes. For this reason we ex-perimented with GMap Creator13 and MapTube14, developed by University College London's Centre for Advanced Spatial Analysis15. GMap Creator produces a choropleth map as set of pre-rendered tiles from a Shapefile (fig. 5). We found that in order to do this accurately it was neces-sary to first convert the ShapeFile to the WGS84 coordinate system. After publishing the tiles on our website we were able to register the maps in MapTube and compare the data by overlaying layers. We can also use the tiled maps to create custom tile overlays in our own Google Maps in-terfaces.
11 http://www.nypl.org/blog/2009/02/26/mapping-nyc/ 12 http://www.svgopen.org/2008/papers/82-Web_Mapping_and_WebGIS_do_we_actually_need_to_use_SVG/ 13 http://www.casa.ucl.ac.uk/software/gmapcreator.asp 14 http://www.maptube.org/ 15 http://www.casa.ucl.ac.uk/

e-Perimetron, Vol. 5, No. 3, 2010 [118-131] www.e-perimetron.org | ISSN 1790-3769
[125]
Figure 4: 1905 municipal ward boundaries as vector overlay in Google Maps.
Figure 5: Municipal wards from 1865 & 1905/06 Post Office Directory maps shown in MapTube.

e-Perimetron, Vol. 5, No. 3, 2010 [118-131] www.e-perimetron.org | ISSN 1790-3769
[126]
The Thematic Mapping Engine
The Thematic Mapping Engine16 is an open source web application developed by Bjørn Sandvik as part of his MSc in GIS project at the University of Edinburgh. The engine enables users to cre-ate customised thematic maps as KMZ files from datasets that can be opened in Google Earth or downloaded to your computer. There is a JavaScript API allowing users to create thematic maps from their own data. The online example engine uses UNdata17 as its data source and a modified version of the World Borders Dataset Shapefile18 for polygon boundaries. The engine supports various thematic map-ping techniques including: proportional symbols; colours; time series and time slider.
Figure 6: An example from the Thematic Mapping Engine showing extruded polygons
A mapping application
In order to engage users with the NLS maps, and Rodger's historical data, we consider it neces-sary to develop simple web-based interfaces for creating customised collections of maps and data, including the ability for users to integrate their own data if required. This should include easy to use tools to layer maps and data as well as the ability to digitise from those layers and to geo-code and view user generated source data. This section briefly describes some requirements of our ap-plication.
16 http://thematicmapping.org/engine/ 17 http://data.un.org/ 18 http://thematicmapping.org/downloads/world_borders.php

e-Perimetron, Vol. 5, No. 3, 2010 [118-131] www.e-perimetron.org | ISSN 1790-3769
[127]
Selecting map layers
Users should be able to select maps of Edinburgh, including the raster thematic mapping, to be layered along with a selection of contemporary maps. It should be possible for users to select layer order and transparency to allow comparison (fig. 7).
Figure 7: Layers combined in Google Maps with 1905/06 Post Office Directory map and ward boundaries
Visualising data
It should be possible to add layers of data. This data will comprise Rodger’s historical datasets, as well as boundary polygons, from a database. Layers will be selected by date in order for maps to be layered with contemporary data. It should also be possible for users to overlay their own geo-coded data from KML files or from datasets stored in Google Spreadsheets. Point-in-polygon comparison with boundary polygons will allow users to quickly build thematic mapping from ad-dress-based scatter plots.

e-Perimetron, Vol. 5, No. 3, 2010 [118-131] www.e-perimetron.org | ISSN 1790-3769
[128]
Figure 8: Geo-coded data overlaid on 1893-4 Ordnance Survey large scale town plan.
To develop new graphical and statistical outputs (including dynamic maps, views, graphs, dia-
grams, reports) relating to the social and economic history of Edinburgh, and to further the un-
derstanding of 19th and 20th century cities more generally through new representations of its
historical geography, cartography, and social and cultural history
The Edinburgh 'colonies' are well known locally as a distinctive form of housing, being terraced, low density and only of two storeys compared to the typical, 4 storey 19th century Scottish tene-ments of between 6 and 16 flats. The colonies were built by building tradesmen in response to an employer's lock out in 1861. Un-employed as a result of the employers' actions they banded together, encouraged by evangelical churchmen who saw this as an independent self-help effort to improve the living conditions of the working class. The builders formed a limited liability company - a novel departure itself - and fi-nanced the company by buying shares. They bought parcels of land on the urban fringe - hence the name 'colonies' - and sold the houses to their fellow tradesmen on the basis of mortgage ad-vances at between £135 and £150. The streets are themselves in colonies and the company adopted the beehive as its logo - a connection with the cooperative movement and its worker bees. Streets names are also in colonies - families of names of plants, trees, and other natural features, and of the names of the founder members of the company. The houses have proved very attrac-tive, and durable. Over 2000 were built between 1862 and 1930; none has been demolished (Rodger 2001). Type of material usable for historical mapping includes: Average household size per colony; the percentage of female household heads per colony; most common birthplace counties for each col-ony; greatest concentration of occupations per colony; average number of lodgers per colony; male/female ratios; shareholder addresses for two dates.

e-Perimetron, Vol. 5, No. 3, 2010 [118-131] www.e-perimetron.org | ISSN 1790-3769
[129]
The benefits of this approach are that it allows differentiation in the local geographies of the city to be represented simply for those unfamiliar with the districts of Edinburgh and may establish spatial patterns that a table does not permit.
Figure 9: Proportional symbols indicating colony populations in 1891. Pie charts indicate occupational structure. Timeline
indicates development dates.

e-Perimetron, Vol. 5, No. 3, 2010 [118-131] www.e-perimetron.org | ISSN 1790-3769
[130]
Figure 10: Occupational structure explained in more detail .
Figure 11: Colony data overlaid on geo-referenced 1905/06 Post Office Directory map (KML superOverlay).
e-Perimetron, Vol. 5, No. 3, 2010 [118-131] www.e-perimetron.org | ISSN 1790-3769
[131]
Conclusion
We are currently about half way through this project, and so this paper reports work in progress to date. The historical maps, data, tools, and guidance will be added to the Visualising Urban Geog-raphies website by the time the project reaches completion in December 2010. Although the pro-ject is focusing on Edinburgh, its key aspiration is to act as an exemplar for parallel work in other locations using similar maps, data and tools. Through this ongoing work the project hopes to achieve the following outcomes and benefits:
1. The development of easy-to-use tools to integrate historical maps and data in new applica-tions so as to create new knowledge and re-use existing research in theses, published and archival sources. This will have particular benefits for 'amateur' historians, local history societies and organisations, bringing an enhanced awareness of their geographical and his-torical communities.
2. The creation of new tools to visualise geographical knowledge through an interactive website will enrich existing teaching and research on historical geography at all levels – primary, secondary, further education and higher education.
3. The provision of a mapping platform to encourage and facilitate other institutions to add value by including information from their collections using open source web-mapping technologies (for example National Archives of Scotland, the Royal Commission on An-cient and Historical Monuments in Scotland, Edinburgh City Council)
4. Enabling a sizeable international public to access and explore historical information relat-ing to 19th and 20th century Edinburgh through simple, graphical web applications, and to explore their own localities using the techniques illustrated.
5. The embedding of a research culture within the NLS, and an improved awareness in the University of the quality and potential of a rich research resource. This will strengthen mutually beneficial research collaboration and knowledge exchange in the future.
6. Encouragement and support for the Edinburgh Historic Town Atlas project, by stimulating new academic work on Edinburgh's historical geography, and contributing to the elec-tronic component of the Atlas.
References
Boutoura, C. & E. Livieratos (2006). Some fundamentals for the study of the geometry of early maps by comparative methods, e-Perimetron 1, 60-70 http://www.e-perimetron.org/Vol_1_1/Boutoura_Livieratos/1_1_Boutoura_Livieratos.pdf
Fleet C., & K.C. Kowal (2007). Roy Military Survey map of Scotland(1747-1755): mosaicing, geo-referencing, and web delivery, 194-208, e-Perimetron 2, 194-208 http://www.e-perimetron.org/Vol_2_4/Fleet_Kowal.pdf
Přidal P., P. Žabička (2008). Tiles as an approach to on-line publishing of scanned old maps, vedute and other historical documents, e-Perimtron 3, 10-21 http://www.e-perimetron.org/Vol_3_1/Pridal_Zabicka.pdf
Rodger R. (2001). The transformation of EdinburghI: land, property and trust in the nineteenth century, Cambridge: Cambridge University Press.