Visual Similarity Analysis of Web Pages based on Gestalt ...
172
Visual Similarity Analysis of Web Pages based on Gestalt Theory by Zhen Xu A thesis submitted in partial fulfillment of the requirements for the degree of Doctor of Philosophy in Software Engineering & Intelligent Systems Department of Electrical and Computer Engineering University of Alberta © Zhen Xu, 2017
Transcript of Visual Similarity Analysis of Web Pages based on Gestalt ...

Visual Similarity Analysis of Web Pages based on Gestalt Theory
by
Zhen Xu
A thesis submitted in partial fulfillment of the requirements for the degree of
Doctor of Philosophy in
Software Engineering & Intelligent Systems
Department of Electrical and Computer Engineering University of Alberta
© Zhen Xu, 2017

ii
ABSTRACT
With the rapid development of internet technology, web page has evolved from a
traditional rich-text information source to a multi-functional tool, which can serve images,
audios and videos, act as the GUI (Graphical User Interface) components of distributed
applications, and so on. Similarity evaluation of the modern web pages becomes more
essential yet difficult. On one hand, while many search engine rely on keyword search,
texts play less important roles in web pages. On the other hand, there exists a variety of
browsers and platforms that support HMTL/CSS/JavaScript in different levels, causing a
web page is displayed differently among browsers.
To address these issues, we propose four research topics. The first topic is to
identify semantic blocks on web pages. We propose a model for merging web page content
into semantic blocks based on human perception. To achieve this goal, we construct a layer
tree to remove hierarchical inconsistencies between visual layout and DOM tree of web
pages; we translate the Gestalt Laws of grouping to computer compatible rules can train a
classifier to combine the laws to a unified rule to detect semantic blocks. The second topic
is to estimate visual similarity of web pages. Existing approaches use DOM (Document
Object Model) trees or images, but they either only focus on the structure of web pages or
ignore inner connections among web page features. Therefore, we provide the block tree
to combine both structural and visual information of web pages. Using this block tree
structure, we propose a visual similarity measurement. The purpose of the third topic is to
improve the visual similarity measurement and use it to detect visual differences in web
pages when they are rendered in different browsers. The extended subtree model that maps
iii
sub trees instead of each single node is introduced for the precision improvement. The forth
topic utilize the improved visual similarity measurement to create an automated testing
framework for cross-browser visual incompatibility detection. An automated testing tool
is also designed.
Major contribution of this thesis is two-folds. On the one hand, it enriches
theoretical analysis in the detection of semantic content, visual similarity, and cross-
browser differences for web pages. On the other hand, it also provides an insight for testing
cross-browser incompatibilities in practice.

iv
To my wife, my daughter, and my parents!

v
Acknowledgments
More than four years have passed since I came to Canada to pursuit my PhD degree. A
lot of things have happened during this time period, and I cherish every moment of it, no
matter they are happy or sad. I have millions to say to my family, teachers, and friends.
First of all, I would like to give my sincere thanks to my dear supervisor James Miller.
He has always supported me, guided me, and gave me confidence during my study. He is
such an excellent teacher that I can always find my direction under his supervision no
matter what difficulties I met in the process of researching. He is such a responsible teacher
that he always responses to my email quickly and he always put his students’ benefits in
the first place. Many times, even during weekends or holidays, he still can give me
feedback very quickly. Without his push, I could not have made the progress I have
achieved now. He is such an amiable teacher that he can always find a way to cheer me up
when I did not make any progress at all. I would say he is the best teacher I have met and
I owe him a lot.
Second, I want to give my thanks to my wife, Wenjing Wang, who has always supported
me no matter what happens. She always stands on my side and encourages me. Especially
when I encountered some difficulties in my research and felt frustrated, she never gave me
up and she never imposed stresses on me. Instead, she enlightened me with gentle words
and cooked me delicious food. I feel very lucky to have such a wonderful wife.
At last, I also feel grateful of my parents: my father Xinghua Xu and my mother Yuling
Yan. Although they are back in China, they still care about me so much. Without their love
and raise, I cannot grow up so healthy and strong. Additionally, I would like to thank my
friends as well. Thanks for their help in my life. Without them, my life could not have been
so fulfilling and colorful. Allow me name them here: Yanan Xie, Zhengrong Cheng, Jikai
Liu, Xihui Liang, and many others. Thanks so much, buddies!

vi
Table of Contents
CHAPTER 1 Introduction ............................................................................................................ 1
1 Motivation and Goals ............................................................................................................. 2
2 Main Contributions and Thesis Outline ............................................................................... 3
CHAPTER 2 Identifying Semantic Blocks in Web Pages Using Gestalt Laws of Grouping .. 5
Abstract ...................................................................................................................................... 5
1 Introduction ............................................................................................................................ 6
2 Related Work .......................................................................................................................... 8
3 Gestalt Layer Merging Model ............................................................................................. 12
3.1 Layer Tree Constructor ................................................................................................ 12
3.2 Gestalt Laws Translator ............................................................................................... 15
3.3 Web Page Blocks Identifier .......................................................................................... 17
4 Implementation .................................................................................................................... 18
4.1 Buildup of the Layer Tree ............................................................................................ 18
4.2 Translation of the Gestalt Laws ................................................................................... 20
4.3 Identification of Web Page Blocks ............................................................................... 28
5 Experiments .......................................................................................................................... 30
5.1 Comparison Test ............................................................................................................ 31
5.2 Efficiency Test ................................................................................................................ 33
6 Conclusions ........................................................................................................................... 40
Acknowledgement ................................................................................................................... 41
References ................................................................................................................................ 42
CHAPTER 3 Estimating Similarity of Rich Internet Pages Using Visual Information ....... 45
Abstract .................................................................................................................................... 45
1 Introduction .......................................................................................................................... 45
2 Related Work ........................................................................................................................ 48
3 The Block Tree ..................................................................................................................... 50
3.1 Construction of Blocks by Gestalt Laws of Grouping ................................................ 51
3.2 Construction of the Block Tree .................................................................................... 56
3.3 Hausdorff Distance and Normalised Hausdorff Distance .......................................... 57
3.4 Colour Translation and Colour Difference ................................................................. 59
3.5 Image Similarity Comparison ...................................................................................... 60

vii
4 Visual Similarity between Two Web Pages ........................................................................ 61
4.1 Block Tree Edit Distance .............................................................................................. 61
4.2 Case Study ...................................................................................................................... 63
5 Experiments .......................................................................................................................... 69
5.1 Test Set ........................................................................................................................... 70
5.2 Experimental Methodology .......................................................................................... 71
5.3 Experimental Results .................................................................................................... 74
6 Conclusion ............................................................................................................................. 77
Acknowledgement ................................................................................................................... 79
References ................................................................................................................................ 79
CHAPTER 4 Cross-Browser Differences Detection based on an Empirical Measurement for
Web Page Visual Similarity ........................................................................................................ 82
Abstract .................................................................................................................................... 82
1 Introduction .......................................................................................................................... 82
2 Translating Algorithm of the Gestalt Laws of Grouping ................................................. 84
2.1 Motivations and Goals .................................................................................................. 84
2.2 Translating the Gestalt Law of Simplicity .................................................................. 85
2.3 Translating the Gestalt Law of Closure ...................................................................... 85
2.4 Translating the Gestalt Law of Proximity ................................................................... 86
2.5 Translating the Gestalt Law of Similarity ................................................................... 91
2.6 Translating the Gestalt Law of Continuity ................................................................. 97
2.7 Translating the Gestalt Law of Common Fate ........................................................... 98
3 The Empirical Visual Similarity Measurement ............................................................... 100
3.1 The Extended Subtree ................................................................................................. 101
3.2 The Validity Experiment ............................................................................................ 104
4 Detection of Cross-Browser Differences........................................................................... 107
4.1 Experimental Setups ................................................................................................... 108
4.2 Experimental Results .................................................................................................. 109
4.3 Case Studies ................................................................................................................. 113
5 Related Work ...................................................................................................................... 119
6 Conclusion and Future Work ............................................................................................ 123
Acknowledgment ................................................................................................................... 124
References .............................................................................................................................. 124

viii
CHAPTER 5 An Automated Testing Framework for Cross-Browser Visual Incompatibility
Detection ..................................................................................................................................... 127
Abstract .................................................................................................................................. 127
1 Introduction ........................................................................................................................ 127
2 Related Work ...................................................................................................................... 129
3 Automated Testing Framework ........................................................................................ 132
3.1 Automated Page-Level Detection of VIs .................................................................... 133
3.2 Automated System-Level Testing for VI Detections ................................................ 138
4 Automated Testing Tool .................................................................................................... 142
4.1 Browser and Platform Registration ........................................................................... 142
4.2 Template Based Test Case Organization ................................................................... 143
4.3 Version Based Automation ......................................................................................... 145
4.4 Case Study .................................................................................................................... 146
5 Conclusions ......................................................................................................................... 148
Acknowledgment ................................................................................................................... 149
References .............................................................................................................................. 149
CHAPTER 6 Conclusions ......................................................................................................... 151
1 Summary of Thesis ............................................................................................................. 151
2 Publications ......................................................................................................................... 152
Bibliography............................................................................................................................... 154

ix
List of Tables
Table 2.1 Variables used by the naive Bayes classifier ................................................................ 29
Table 2.2 Numbers of TPs, FPs and FNs ...................................................................................... 33
Table 2.3 κ of two raters’ evaluations .......................................................................................... 37
Table 2.4 κ interpretation .............................................................................................................. 38
Table 2.5 Average precision, recall and F-1 score of both algorithms ......................................... 38
Table 3.1 Tree Sizes of the Three Web Pages .............................................................................. 66
Table 3.2 κ of Each Two Raters’ Evaluations .............................................................................. 73
Table 3.3 B-TED Value Details .................................................................................................... 75
Table 3.4 Experimental Results .................................................................................................... 77
Table 4.1 Proximity Candidate Comparison Results .................................................................... 90
Table 4.2 Color Comparison Results ............................................................................................ 93
Table 4.3 Image Comparison Results ........................................................................................... 97
Table 4.4 Results of Mann–Whitney U Test and Cliff’s Delta Effect Size Estimation .............. 105
Table 4.5 Comparison of Human Perceptions and Calculation Results (Original Web Pages) . 111
Table 4.6 Comparison of Human Perceptions and Calculation Results (Ad-Free Web Pages) . 112
Table 4.7 Case Study of Google.ca ............................................................................................. 113
Table 4.8 Case Study of W3schools’ JSON Home Page ............................................................ 114
Table 5.1 EST Similarity Values of the Cross-Comparisons ..................................................... 147

x
List of Figures
Figure 2.1 Working Procedure of GLM Model ............................................................................ 18
Figure 2.2 Paradox between Perceptual Proximity and Hausdorff Distance ................................ 23
Figure 2.3 Area definition and relevant length ............................................................................. 25
Figure 2.4 Comparison of Identification Results .......................................................................... 32
Figure 2.5 Disagreement in GLM Blocks Identification Results ................................................. 36
Figure 2.6 Evaluations of GLM and VIPS on the Test Set .......................................................... 40
Figure 3.1 Home Page of “Google.ca” ......................................................................................... 52
Figure 3.2 Home Page of “Twitter.com” ...................................................................................... 53
Figure 3.3 Gestalt Laws of Proximity, Similarity and Continuity ................................................ 54
Figure 3.4 Home Page of “Ubuntu.com”...................................................................................... 56
Figure 3.5 HD Inconsistency ........................................................................................................ 58
Figure 3.6 NHD Dimensions ........................................................................................................ 59
Figure 3.7 The Calculation Model ................................................................................................ 62
Figure 3.8 Case Study: The Home Page of ECE .......................................................................... 64
Figure 3.9 Case Study: The Home Page of ECE (marked) .......................................................... 65
Figure 3.10 Part of the Block Tree ............................................................................................... 65
Figure 3.11 Case Study: The Home Page of UA .......................................................................... 67
Figure 3.12 Case Study: The Home Page of FGSR ...................................................................... 68
Figure 3.13 The Distribution of Randomly Selected Web Pages per Web Site ........................... 71
Figure 3.14 The Distribution of Block Tree Size ......................................................................... 71
Figure 3.15 Experimental Methodology ....................................................................................... 74
Figure 3.16 B-TED Distributions of Subset 1 .............................................................................. 75
Figure 4.1 Contradictions between Calculation Distances and Perceptual Distances .................. 88
Figure 4.2 The Distribution of Proximity Candidate Comparison Results ................................... 90
Figure 4.3 Distributions of Color Comparison Results ................................................................ 93
Figure 4.4 Distributions of Image Comparison Results ............................................................... 97
Figure 4.5 Home Page of Amazon ............................................................................................... 98
Figure 4.6 Translation of Gestalt Laws of Grouping .................................................................... 99
Figure 4.7 Example of the Visual Incompatibility Detection and Similarity Estimation ........... 102
Figure 4.8 EST Similarity of All 15 Rounds .............................................................................. 105
Figure 4.9 Performance of the Empirical Measurement on Different Thresholds ..................... 107
Figure 4.10 Distribution of Test Cases ....................................................................................... 109
Figure 4.11 Distributions of the Experimental Results for Original Web Pages ........................ 110
Figure 4.12 Distributions of the Experimental Results for Ad-Free Web Pages ........................ 112
Figure 4.13 Screenshots of Google.ca in the Four Browser Scenarios ....................................... 115
Figure 4.14 Screenshots of W3schools’ JSON Home Page in the Four Browser Scenarios ...... 116
Figure 4.15 Screenshots of Amazon.ca in the Four Browser Scenarios ..................................... 118
Figure 4.16 Screenshots of FedEx.com in the Four Browser Scenarios ..................................... 119
Figure 5.1 The Three Tools for Cross-IE Incompatibility Detection ......................................... 131
Figure 5.2 Detection Reports of Browsera and CrossBrowserTesting ....................................... 132
Figure 5.3 The Example of UAlberta’s Home Page ................................................................... 136

xi
Figure 5.4 The Automated Testing Framework ......................................................................... 141
Figure 5.5 Sequence Diagram of the Automated Testing Tool .................................................. 143
Figure 5.6 Initialization Dialogs of the Automated Testing Tool............................................... 143
Figure 5.7 Extracting Templates from Django Projects ............................................................. 144
Figure 5.8 Schedule Builder of the Automated Testing Tool ..................................................... 146

1
CHAPTER 1 Introduction
Internet has brought many benefits and opportunities to our modern life, one of which
is the development and usage of web pages. Web pages have changed our way of life in a
variety of ways. Nowadays web pages are thriving and have invaded into every way of life,
including banking, trading, shopping, education, and etc. Web pages become so important
and prevalent that we can barely live without them. For example, online banking allows us
to shop by browsing commercial web pages and later make a payment; major universities
and colleges offer educational resources through their own web pages for students
wherever they are as long as they have access to internet; e-commerce has changed the way
of traditional marketing and brings about more convenience both to merchants and
customers.
While we enjoy the convenience web pages have brought to our daily life, we should
see that there are issues associated with them as well. For instance, many web pages are
embedded with abundant irrelevant information, such as pop-up ads and extraneous images,
which interrupts our reading efficiency and prevents us from acquiring the real information
we are seeking. The similarity of web pages is also an issue. Some web pages are designed
so similar that ordinary people can hardly see the differences between them. Malicious
designers will mimic the design of major web sites deliberately so that they can trick users
for illegal gains.
Since the technique behind web pages is complex, the usage of web pages is a double-
edged sword. We can benefit from it if they are used properly or we can also suffer from

2
them otherwise. In this thesis, we will look at web pages from the aspects of semantic
content, similarity, and cross-browser issues.
1 Motivation and Goals
After reading relevant papers in the literature, we find that four issues are imminent
and important in the area of web pages, these can be as summarized in the follows.
Firstly, web pages are inundated with vast of irrelevant information such as ads and
extraneous images. The irrelevant information not only makes web pages more
complicated, but also affects the efficiency and effectiveness of our knowledge acquisition.
Secondly, web pages have become increasingly important as we growing rely on
them. As such, a number of illegal web pages have immerged by mimicking the real ones.
Since ordinary users cannot tell the differences between the real web pages and the fake
ones in many cases, it is necessary for web page designers and researchers to find a way to
reduce the influence of web page misusage.
Thirdly, with the advent of various web browsers and platforms, web pages designed
for a specified carrier cannot work well in another, which leads to cross-browser issues for
web pages. How to detect these issues correctly and effectively becomes important and
necessary for us to trust on web pages.
In order to tackle the above-mentioned issues, we seek to achieve the following goals
in this thesis.

3
Regarding the first issue, we will find approaches to identify semantic content in web
pages. By doing so, we attempt to provide a method for retrieving information from web
pages effectively and efficiently.
Regarding the second, issue, our goal is to propose a method for estimating similarity
of web pages. As a matter of fact, there are a number of methods available at present for
estimating web page similarity. However, current methods are not feasible with regard to
modern rich-format web pages.
Regarding the last issue, the purpose is to investigate cross-browser issues and
develop an approach to detect differences existing in various web browsers and platforms.
It is noted that we mainly focus on visual differences of web pages in this regard. Based
on the proposed approach, we will further develop an automated testing framework for
detecting cross-browser incompatibilities.
2 Main Contributions and Thesis Outline
The major contributions of this thesis are summarized as follows:
Investigated and interpreted the Gestalt laws of grouping into computer compatible
rules for web page content segmentation.
Provided a semantic block tree model to represent web pages visual information.
Proposed a numeric measurement for web page visual similarity evaluation.
Improved the interpretation of Gestalt laws of grouping by a series of empirical
experiments.
Improved the visual similarity measurement by using the extended subtree model
to replace the tree edit distance.

4
Utilized the visual similarity measurement to evaluate cross-browser similarity of
web pages.
Designed an automated testing framework to detect cross-browser visual
incompatibilities.
This thesis adopts the paper-based format and organized as follows. In Chapter 2, we
present our first journal paper as it is published. This paper provides an approach to identify
semantic blocks in web pages using the Gestalt laws of grouping. Chapter 3 presents our
second journal paper as it is published. This paper offers a way to estimate similarity of
rich web pages using visual information. In Chapter 4, we present our third journal paper
as it is in review. This paper deals with detection of cross-browser differences for web page
visual similarity. Chapter 5 shows our fourth journal paper as it is submitted. It describes
an automated testing framework for detecting cross-browser differences. The last chapter
summarizes and concludes the thesis as a whole.

5
CHAPTER 2 Identifying Semantic Blocks in Web
Pages Using Gestalt Laws of Grouping1
Abstract
Semantic block identification is an approach to retrieve information from web
pages and applications. As website design evolves, however, traditional methodologies
cannot perform well any more. This chapter proposes a new model to merge web page
content into semantic blocks by simulating human perception. A “layer tree” is constructed
to remove hierarchical inconsistencies between the DOM tree representation and the visual
layout of the web page. Subsequently, the Gestalt laws of grouping are interpreted as the
rules for semantic block detection. During interpretation, the normalized Hausdorff
distance, the CIE-Lab color difference, the normalized compression distance, and the series
of visual information are proposed to operationalize these Gestalt laws. Finally, a classifier
is trained to combine each operationalized law into a unified rule for identifying semantic
blocks from the web page. Experiments are conducted to compare the efficiency of the
model to a state-of-art algorithm, the VIPS. The comparison results of the first experiment
show that the Gestalt layer merging (GLM) model generates more “true positives” and less
“false negatives” than VIPS (VIsion-based Page Segmentation). The next experiment upon
a large-scale test set produces an average precision of 90.53% and recall rate of 90.85%,
which is approximately 25% better than that of VIPS.
1 Xu, Zhen, and James Miller. "Identifying semantic blocks in Web pages using Gestalt laws of grouping." World Wide Web 19.5 (2016): 957-978.

6
Keywords: DOM Tree; Gestalt Law of Grouping; Normalized Hausdorff Distance; CIE-
Lab; Normalized Compression Distance.
1 Introduction
Modern web pages are much more complicated in both content and layout than ever
before. Many pages include vast amounts of “irrelevant” information, such as pop-up ads,
game animations, and extraneous images. Due to this, content identification is becoming
more and more difficult. Nevertheless, it is the basis for further work, i.e., content
extraction, data mining, anti-phishing, etc.; hence, it is important that a solution to this
problem is found. The number of applications derived from semantic block identification
in web pages, has climbed in recent years. To be specific, major applications include:
Content extraction: with extensive information available on current rich-format
web pages, removing “irrelevant” information and extracting target information
quickly and exactly is a vital task.
Data mining: it aims to investigate data patterns from the large amount of data
carried by target web pages. Web page semantic block identification divides web
pages into distinct blocks by their semantics, and this process will boost data mining
mechanisms and thus improve their accuracy.
Anti-phishing: current web pages carry both good and bad information, for example,
a variety of fake web pages has emerged, trying to obtain illegal benefits from the
public. Under this situation, anti-phishing becomes an important topic and assumes
the heavy responsibility of distinguishing fake web pages. Through analyzing

7
contextual semantics, blocks with fake content can be detected and distinguished
from genuine content.
UI design: Despite technology improvements in web design, web pages becomes
increasingly complex at the same time. An excellent web page should be one that
serves the needs and demands of its target customers, rather than feed them with
abundant irrelevant information. Thus, semantic block identification provides a
potential guideline to enhance UI design of web pages and web sites.
Web search: to search target information fast and accurately, the semantic meaning
of the web page blocks is as important as its content and layout. That is, semantic
block identification provides another insight into web search, on top of web page
layout and pure text content.
Traditional methodologies on block identification work well on textual web pages,
however, they cannot efficiently process rich-format modern web pages. It is obvious that
people can recognize related web page content fast and correctly even before reading it,
regardless of the complexity of the web pages. According to Gestalt psychology, this is
because that humans group objects based on a series of laws – the Gestalt laws of grouping
(Palmer 1990; Sternberg 2003; Koffka 1995).
Therefore, this chapter proposes the “Gestalt Layer Merging” (GLM) model to
solve the problem of the traditional methodologies. The GLM model simulates human
perception by utilizing the Gestalt laws of grouping and three tasks are mainly involved in
this model:
It extracts the web page content from the DOM tree and constructs a “layer tree”.
This layer tree has an identical hierarchy with the visual layout of the web page.

8
It interprets the Gestalt laws of grouping. The Gestalt laws are translated into
comparable measurements to evaluate and merge the layer tree nodes into semantic
blocks.
It combines different Gestalt laws into a unified rule for identification. The
combination obtained by a classifier specifies how the web page content is merged,
and how the final semantic blocks are displayed.
The organization of this chapter is as follows: Sect. 2 discusses an overview of
related work on web page block identification; Sect. 3 describes the GLM model’s outline;
Sect. 4 gives details on the implementation of the model; Sect. 5 runs experiments to merge
and identify web page blocks and evaluates the result by precision and recall; and finally,
Sect. 6 draws conclusions from the experimental result.
2 Related Work
Web pages of ten years ago were not as rich in layout as that of today – they
contained mostly plain text and text hyperlinks, while images, video, and audio streams
were not very common. In addition, because many of the web pages focused on publishing
(textual) articles, their layouts were usually very simple. Thus, the web pages can be
identified by text extraction simply and directly. Besides, using tabular tags such as
“<TABLE>”, “<TR>” and “<TD>” to hold content was once very popular in web page
design. Therefore, many researches extracted content blocks by such tabular clues. For
example, Lin and Ho (2002) analyzed such web pages to extracted informative content
blocks. Because modern web pages usually do not apply tabular skeleton, this method is
not suitable any more.

9
Some other researchers have chosen to directly analyze the source HTML files.
Gupta et al. (2003) applied two sets of filters to retrieve text. Their first filter set was a text
filter that removed images, links, scripts and styles, and the second filter set contained four
components, namely, an advertisement remover, a link list remover, an empty table
remover, and a removed link retainer. By applying the two sets of filters, all images and
stream media were removed from the web page. Although performed well on textual web
pages, it can retrieve very limited information from rich format web pages. Reis et al. (2004)
proposed the RTDM, a restricted top-down mapping algorithm based on the “tree edit
distance”. This methodology solved the structure-based page classification problem; and
can extract news articles from web pages automatically. However, it focused only on the
textual content while paid no attention on the layout, therefore had limitations on
processing modern web pages. Kohlschütter and Nejdl (2008) proposed a densitometric
approach, the “block fusion” algorithm, by which they merged (fused) text into blocks
according to the density of the paragraphs. The number of “tokens” an “lines” are used to
determine the density of the paragraphs. The disadvantage of the “block fusion” algorithm
lies on its assumption that the maximum width of a line is 80 – this only applies to
traditional monospaced terminals, but not to the varies of modern displaying devices. Kang
et al. (2010) investigated the HTML tag repeat patterns. Based on the repetition patterns,
their REPS algorithm splits the web page content (tags) into blocks. By applying proper
value to the threshold of the “normalized importance weight”, their algorithm worked well
on block identification. However, many modern web pages, especially home pages of
modern websites, are designed very simple in layout, containing very few of such repetition

10
patterns. The REPS cannot identify blocks on such web pages as well as it did in traditional
textual pages.
Evolution of browsers enables web pages to become richer in both content and
layout. Due to the power of CSS and JavaScript, the source HTML files are no longer
sufficient to represent what we see from the web page. Therefore, researchers have
considered visual clues. Cai, et al. (2003a; 2003b; Yu, et al. 2003; Song, et al., 2004)
proposed the VIPS algorithm in their research. The VIPS algorithm utilizes all the visual
clues that CSS supported, considers each DOM element as a rectangular block (for
separator identification), and segments web pages by iteratively detecting separators
among these visual blocks. This work has been highly influential, and still represents the
state-of-art in this area. However, although the visual clues of the web page layout were
taken into consideration by the VIPS algorithm, the researchers still segmented pages in a
“manual” way – they studied the rendering style of web pages and concluded limited
segmenting rules, leading to an incompleteness of analyzing the visual clues. Meanwhile,
the VIPS algorithm was proposed and evaluated on the traditional web pages with tabular
skeleton, but performed less efficient on modern web pages. Chen et al. (2003) proposed a
methodology similar to VIPS. They first evaluate the position of each DOM element to
decide if it is a header, a footer, or a sidebar; and then detect the separators among such
blocks. Based on these visual clues, they segment web pages into semantic blocks.
Visual based web page block identification is also useful for displaying web pages
on small screen devices. Hattori et al. (2007) propose the “content distance” of HTML tags
and derived a layout-based segmentation algorithm for visual block identification. The
“content distance” is calculated based on the node depth of the DOM tree, which is a novel

11
metric in this area. However, the implementation of this distance only parses the source
HTML files, leading to missing important features such as dynamically loaded content or
CSS properties. The layout-based segmentation algorithm pre-splits a page according to
the “cell” size, which is divided by tabular skeleton or “<DIV>” wrappers, and the splitting
procedure relies heavily on the parameter of “maximum cell size”. However, the
determination of such an important parameter is not solved in the chapter, making the
algorithm un-implementable by third parties. Baluja (2006) propose a machine learning
framework to identify blocks and recast web pages to fit cell phone screens. In the
methodology, they calculated the entropy and the “information gain” based on the area of
each DOM element, extract its spatial coordinates as features, and build a decision tree to
split the web page into blocks. Specifically, the algorithm splits each web page into 9 grids,
each mapped to a button in the number pad. By pressing a number, the user interacted with
the corresponding grid (for example, zoom in/out). Although it seems to perform well, this
algorithm can only identify a fixed number of blocks with a predefined spatial pattern, this
makes it completely unsuitable for general purpose utilization! In addition, in many cases,
it splits complete semantic blocks into different grids incorrectly because it evaluates the
“information gain” of each vertical and horizontal line while ignores the actual boundaries
of DOM elements. Therefore, this algorithm has a very limited application in the research
area of web page semantic block identification. Besides, as the hardware evolves, small
screen devices that need to display web pages draw much less popularity, leading to the
demand of recasting web pages shrink. Instead, more mature solutions for recasting web
pages (such as Bootstrap2) have been widely employed.
2 http://getbootstrap.com/

12
Some other researchers investigated the semantic block identification problem in
other ways. Chakrabarti et al. (2008) formulated the problem in a combinatorial
optimization framework. They constructed a weighted graph from the DOM tree of a web
page, used the energy-minimizing cuts to perform machine learning of the weights, and
finally split web page content into blocks by the learnt weights. Cao et al. (2010)
transformed each page into an image of RGB colors, and then applied an edge detecting
algorithm (Canny, et al. 1986) to “shrink” the image into several “dividing zones”, which
were the actual web page blocks. Their experiment demonstrated this image processing
algorithm worked well on textual web pages.
3 Gestalt Layer Merging Model
The Gestalt layer merging (GLM) model aims to identify web page blocks by
simulating human perception with the Gestalt laws of grouping. Three components are
included in the model, namely, the layer tree constructor, the Gestalt laws translator, and
the web page block identifier.
3.1 Layer Tree Constructor
The DOM tree is a fast and precise representation of a web page; however, it cannot
be directly used as the input in this model. People read only visible content from the web
pages, so the invisible DOM elements are useless, i.e., they are simply noise to this model.
Meanwhile, the visual hierarchy of a web page sometimes differs from the corresponding
DOM hierarchy, causing perception errors to this model. Such noise and errors must be
eliminated before analyzing.

13
Definition: Given a web page 𝑊𝑃, the layer tree 𝐿𝑇 of 𝑊𝑃 is a finite set where
each element 𝑛 (that is, layer tree node) of 𝐿𝑇 is a layer representing a visible element 𝑒
from DOM tree 𝐷𝑇 of 𝑊𝑃 (𝐿𝑇 = {𝑛 | 𝑛 ← 𝑒, 𝑒 ∈ 𝐷𝑇}) and all elements follow the visual
hierarchy of 𝑊𝑃.
The layer tree constructor takes the DOM tree of a web page as a prototype to build
up its layer tree. The construction includes removing the invisible DOM elements and
fixing the hierarchy. An invisible DOM element is either an element with area of 0
(including the borders and shadows), an element without any actual content (text, image,
background, etc.), or an element that is completely covered by its visible child elements.
The visual hierarchy refers to the geometrical distribution and overlapping relationships of
the DOM elements. The layer tree and layer tree nodes have the following properties:
Property 1: A layer tree node always represents a visible DOM element.
The DOM tree of a web page contains not only the content information, but also
structural and other information. While the former information can be seen by people, the
latter is often ignored, so it is not required in this model. For example, some “DIV”
elements contain no direct content and only act as “wrappers” – holding other elements.
Such elements will not be extracted into layer tree nodes.
Property 2: A layer tree node always represents a complete DOM element.
This follows the Gestalt laws of prägnanz. A DOM element may contain many
kinds of sub content, for example, it may have both foreground text and a background
image. Although, visually speaking, such a DOM element can be further split, we do not

14
extract each of the sub content into a separate layer node. Instead, only one layer node is
extracted representing the complete DOM element.
Property 3: A layer tree node is always a complete rectangle.
This follows the Gestalt laws of closure. In a web page, it is common that some
layers overlap others, so that the parts of the lower layers that covered by the upper layers
cannot be seen. For example, an input box may overlap its parental layer’s background
image. In fact, people still perceive such rectangles as complete. Therefore, it is reasonable
to consider layer tree nodes as complete rectangles.
Property 4: The root node of a layer tree always represents the “BODY” element.
Visible content of a web page locates under the “BODY” subtree. However, the
“BODY” element sometimes is empty, which means it is invisible. In such a case, the
browser will still draw the web page on a white background. This browser behavior enables
the “BODY” to become a visible DOM element. Consequently, it is correct to be selected
as the root of the layer tree.
Property 5: A layer tree node is always located inside its parent layer (if it has a
parent layer).
The layer tree is designed to represent a web page. It must follow the visual
hierarchy of the page. In the DOM tree, child elements are located inside their parent
elements by default; however, some CSS rules can manipulate locations, such as
“position”, “float”, “z-index”, etc. These rules sometimes cause the DOM
hierarchy to be misaligned against the visual hierarchy. Therefore, in layer tree
construction, such an inconsistency must be eliminated.

15
3.2 Gestalt Laws Translator
This translator interprets the Gestalt laws of grouping into machine compatible
rules. The Gestalt laws explain the mechanisms of how humans perceive and understand
things. When processing web pages (layer trees), two Gestalt laws are used to build up the
layer tree, and other four Gestalt laws are expanded into six rules to identify web page
blocks.
3.2.1 The Gestalt Law of Prägnanz
The Gestalt law of prägnanz is also referred to as Gestalt law of simplicity. Humans
tend to perceive objects into the simplest organizations. This is the overarching Gestalt law
of grouping. Based on this law, we take the assumption that every layer node in the layer
tree represents a complete DOM element and such a layer node should not be split any
further in the GLM model.
3.2.2 The Gestalt Law of Closure
Humans tend to perceive incomplete shapes as complete. While building up a layer
tree, we interpret this law to be that each node of the layer tree represents a complete
rectangle, no matter how it is actually displayed.
3.2.3 The Gestalt Law of Proximity
Humans tend to perceive objects that are close to others as a single group, while
those objects that are far from each other are placed into separate groups. This law groups
elements based on their distances.

16
Browser behavior tells us that web page layers are placed adjacently to each other
by default. So if we use the edge distance of layers as proximity, the value will be 0 for
many cases. In another case, if there are two big layers and another two small layers each
having the same edge distance, the gaps between the pairs of layers will not be visually the
same. To solve this issue, we utilize a variant of the Hausdorff distance (Chaudhuri and
Rosenfeld 1999; Sim, et al. 1999; Zhao et al. 2005) between layers as a working definition
of proximity. This is because it takes the sizes of the two objects into consideration.
3.2.4 The Gestalt Law of Similarity
Humans tend to perceive similar objects as a single group. The similarity of two
objects is determined by their appearances.
As a layer node is always a rectangle, the appearance includes its size, background,
and foreground. Consequently, this law is expanded into three laws, accordingly. The first
expanded law compares the size, which consists of both its width and height; the second
expanded law compares background content, which consists of the background color and
image; and the third expanded law compares the foreground content, which are the textual
styles.
3.2.5 The Gestalt Law of Continuity
Humans tend to perceive objects that are aligned together as a single group. This
law evaluates the positions of layers.
The browser aligns content by top and left by default. Therefore, if some layers are
right or bottom aligned, they may be deliberately placed together by the designer of the

17
web page. Hence, such continuity provides a strong clue that these layers are semantically
related.
3.2.6 The Gestalt Law of Common Fate
Humans tend to perceive objects that share the same motion trend as a single group.
Most of the layers in a web page do not move at all. Some layers may contain
animations or videos, but the layers themselves do not move. Thus, it is not possible to
directly evaluate the motion trend. However, this law can evaluate the “static” trend of the
layers.
3.2.7 The Gestalt Law of Symmetry
Humans tend to perceive symmetric objects together as a single group, even if they
are far from each other. As most web pages are not designed to have symmetric layers, we
do not utilize this law.
3.3 Web Page Blocks Identifier
A classifier combines the rules from the Gestalt law translator to identify web page
blocks. Taking the layer tree of a web page as the input, the identifier evaluates each layer
and makes a decision whether the layers can be put into the same group. While only siblings
can be grouped, layers having different parents will be automatically put into different
groups. Such merged groups represent the final blocks. They will be collected and the web
page will be updated.
The GLM model’s working procedure is illustrated in Figure 2.1.

18
Figure 2.1 Working Procedure of GLM Model
4 Implementation
4.1 Buildup of the Layer Tree
Although the layer tree is similar to a subset of the DOM tree, building it is not just
removing redundant nodes and information. Layer tree nodes must keep both content text
and layout information, while the layer tree must keep the correct hierarchy of these nodes.
Since CSS is able to float DOM elements to any place of the page, the DOM hierarchy is,
for many cases, not identical to the rendered (visual) hierarchy. Thus, it is necessary to
reconstruct the layer tree.
4.1.1 Create Layer Tree Nodes
The most important node of a tree is the root. For the layer tree, the root node is
created from the “BODY” element. If a web page’s “BODY” is invisible, it is set to a white
background. Next, for each layer tree node, we create it as follows:
1) Acquire the corresponding DOM element.

19
2) Check if the DOM element is visible. Mark it as invisible and skip it if it meets any
of these conditions: the HTML tag is invisible; either the element's height or width
equals to 0; some of its CSS properties specify that it is not to be rendered; or it is
completely transparent and empty.
3) If the DOM element is visible, calculate its geometric attributes representing the
size. As mentioned previously, we consider every layer as a rectangle according to
Gestalt law of closure. Therefore, the layer tree node’s geometric attributes include
the coordinates of its left top vertex as well as its height and width.
4) Identify the layout information of the layer tree node from the CSS styles. Every
clue related to the layout can be interpreted from the CSS styles of the DOM
element, so this step is actually retrieving useful CSS properties such as text styles,
background styles, etc.
5) Different from DOM elements having more than one text node, the layer tree nodes
contain only one text component, and this component is part of the node rather than
its child nodes. So this step is to merge and trim all the DOM element’s text nodes
into one single property of the layer node.
6) Give the layer tree node a name. The name of a layer tree node is not necessary for
applying Gestalt laws of grouping. It is only used for identifying the node. We
simply use the XPath of the DOM element as the name.
4.1.2 Build Layer Tree with Nodes
The hierarchy of a layer tree is constructed from the DOM tree of the web page. As
sometimes CSS styles replace the original layout and dis-render some DOM elements, the
layer stacking hierarchy is not always identical with the DOM hierarchy. In addition,

20
invisible elements existing in the DOM tree shall be removed when building up the layer
tree. Thus, a modification is necessary.
To construct the layer tree, we manipulate nodes as follows:
1) Take the “BODY” layer node as the root node.
2) From the root node on, for every layer tree node, append all child (layer tree) nodes
according to their corresponding DOM hierarchy.
3) If any node is completely located inside any of its sibling nodes, then move the
node downward so that it becomes a child node of that sibling. Sibling nodes that
geometrically overlap each other are acceptable in the layer tree model. They are
still considered as sibling nodes.
4) If a DOM element is invisible or empty, then there is no corresponding layer tree
node. However, its child DOM elements may have corresponding layer tree nodes.
In this condition, these child layer tree nodes shall become children of the layer tree
node which is related to this DOM element’s first visible parent element.
Creating layer tree nodes from DOM elements is done simultaneously with building
up the layer tree. This procedure starts from adding the root node to the layer tree, and then
executes recursively until all visible DOM elements are extracted and added to the layer
tree.
4.2 Translation of the Gestalt Laws
As mentioned above, the Gestalt law of similarity is expanded into three laws,
namely, background similarity, text similarity, and size similarity. Among all the six laws:

21
The Gestalt law of proximity is translated as to compare the distance between two
layers. The distance in the GLM model is defined as the normalized Hausdorff
distance between layers. Sect. 4.2.1 discusses details about the calculation.
Background similarity is evaluated by both background color and image. Color
comparison is conducted in CIE-Lab color space instead of RGB color space, and
image comparison is done by calculating the normalized compression distance.
They are discussed in Sect. 4.2.2 and Sect. 4.2.3.
Text similarity is evaluated by comparing a set of text and paragraph related CSS
properties. Similarly, with background color, the text colors are compared under
CIE-Lab space; the other CSS styles are directly compared by their corresponding
values.
Size similarity is represented by both the width and height of the layers.
The Gestalt law of continuity is interpreted to compare the left, top, right and
bottom coordinates of layers. If any of the four edges between two layers share the
same value, then they are continuous.
The “Static trend” from the Gestalt law of common fate is represented by the
“position” CSS property. By default, the positions are the same for semantically
related layers. If any of a group of layers has a different “position”, then it is
designed to be separated from the others. Therefore, it belongs to a different block
with others.

22
4.2.1 Normalized Hausdorff Distance
As mentioned previously, a normalized Hausdorff distance between two layers is
used as the proximity. For the two layers 𝐿1 and 𝐿2, the Hausdorff distance (HD) between
them is calculated as follows:
1) For any point 𝑙1 in 𝐿1 and 𝑙2 in 𝐿2, the distance between them is the length of the
line segment:
‖𝑙1 − 𝑙2‖ = √(𝑥𝑙1− 𝑥𝑙2
)2 + (𝑦𝑙1− 𝑦𝑙2
)2 ;
2) For any point 𝑙1 in 𝐿1, the distance between it and 𝐿2 is the infimum of distances
between 𝑙1 and all points in 𝐿2:
𝑑(𝑙1, 𝐿2) = inf𝑙2∈𝐿2
‖𝑙1 − 𝑙2‖ ;
3) Hausdorff distance from 𝐿1 to 𝐿2 (ℎ𝑑1,2) is the supremum of distances between 𝐿2
and all points in 𝐿1:
ℎ𝑑1,2 = sup𝑙1∈𝐿1
𝑑(𝑙1, 𝐿2) ;
4) Hausdorff distance between 𝐿1 and 𝐿2 is the maximum value between the
Hausdorff distance from 𝐿1 to 𝐿2 and the Hausdorff distance from 𝐿2 to 𝐿1 , as
shown in (2-1):
𝐻𝐷(𝐿1, 𝐿2) = max{ℎ𝑑1,2, ℎ𝑑2,1} . (2-1)
However, it is not sufficient to directly use HD as the proximity. This is because of
a perceptual inconsistency: if there is a pair of large layers close to each other and another

23
pair of small layers far from each other, the proximities of the two pairs are perceptually
different (far vs. close), while the HD may have the same values. For example, as shown
in Figure 2.2, 𝐿1 and 𝐿2 are both 50×50 while adjacent to each other; 𝐿3 and 𝐿4 are 10×10
while having an edge distance of 40. In this case the perceptual proximities of the two
groups they are not the same, however, the NDs of the two pairs are both 50.
Figure 2.2 Paradox between Perceptual Proximity and Hausdorff Distance
Such inconsistency is caused by the sizes of the two layers. To eliminate it, we
introduce a modification of the original Hausdorff distance as the proximity – the
normalized Hausdorff distance (NHD). It is calculated by adding a normalizing factor –
relevant length (Re) – to (2-1), as shown in (2-2):
𝑁𝐻𝐷(𝐿1, 𝐿2) = max {ℎ𝑑1,2
𝑅𝑒𝐿1
,ℎ𝑑2,1
𝑅𝑒𝐿2
} , (2-2)
where, 𝐿1, 𝐿2 are the two layers; sup and inf retrieve the supremum and infimum of a set
of values; ‖𝑙1 − 𝑙2‖ is the norm (distance) between 𝑙1 and 𝑙2 ; and 𝑅𝑒𝐿1, 𝑅𝑒𝐿2
are the
relevant lengths, respectively.
Re can be either the height, width, or both (the diagonal) of the layer, depending on
the related location of the two layers. Note that 𝑅𝑒𝐿1 and 𝑅𝑒𝐿2
in (2-2) may be different.
(a) (b)

24
For example (Figure 2.3d), 𝑅𝑒𝐿1 is the diagonal length of 𝐿1 while 𝑅𝑒𝐿2
is the height of
𝐿2. As shown in Figure 2.3, having analyzed all possible distributions of two layers, we
conclude the NHD calculation as follows:
1) 𝐿1 is completely inside or outside of 𝐿2. We do not deal with this condition and
simply set 𝑁𝐻𝐷 to 0 (although ℎ𝑑2,1 ≠ 0 in Figure 2.3a). This only happens when
calculating proximity between a parent and a child layer:
𝑁𝐻𝐷(𝐿1, 𝐿2) = 0 .
2) 𝐿1 is completely in the north/south area (between left and right edges) of 𝐿2
(Figure 2.3b). In this condition, 𝑅𝑒𝐿1 is the height of 𝐿1, and ℎ𝑑1,2 equals to the
vertical distance between top edges (North) or bottom edges (South) of the two
layers:
𝑅𝑒𝐿1= ℎ𝑒𝑖𝑔ℎ𝑡𝐿1
;
ℎ𝑑1,2 = 𝑑𝑖𝑠𝑡v = {|𝑡𝑜𝑝𝐿1
− 𝑡𝑜𝑝𝐿2|, 𝑐𝑦
1 < 𝑐𝑦2
|𝑏𝑜𝑡𝑡𝑜𝑚𝐿1− 𝑏𝑜𝑡𝑡𝑜𝑚𝐿2
|, 𝑐𝑦1 > 𝑐𝑦
2 ,
Where, 𝑐𝑦1 and 𝑐𝑦
2 are the y coordinates of the two layers’ centroids, 𝑐𝑦1 ≠ 𝑐𝑦
2.

25
Figure 2.3 Area definition and relevant length
3) 𝐿1 is completely in the west/east area (between top and bottom edges) of 𝐿2
(Figure 2.3c). Similarly, 𝑅𝑒𝐿1 is the width of 𝐿1, and ℎ𝑑1,2 is the horizontal edge
distance between their left edges (west) or right edges (east):
𝑅𝑒𝐿1= 𝑤𝑖𝑑𝑡ℎ𝐿1
;
ℎ𝑑1,2 = 𝑑𝑖𝑠𝑡h = {|𝑙𝑒𝑓𝑡𝐿1
− 𝑙𝑒𝑓𝑡𝐿2|, 𝑐𝑥
1 < 𝑐𝑥2
|𝑟𝑖𝑔ℎ𝑡𝐿1− 𝑟𝑖𝑔ℎ𝑡𝐿2
|, 𝑐𝑥1 > 𝑐𝑥
2 ,
(a) Inside (b) North/South
(c) West/East (d) Corner Region(s)

26
Where, 𝑐𝑥1 and 𝑐𝑥
2 are the x coordinates of the two layers’ centroids, 𝑐𝑥1 ≠ 𝑐𝑥
2.
4) 𝐿1 covers one or two corner areas of 𝐿2 (Figure 2.3d). As none of the two
rectangular layers completely locates inside of the other, 𝐿1 can only cover one
corner area or at most two adjacent corner areas of 𝐿2. In this condition, both the
height and the width of 𝐿1 are the relevant lengths, so 𝑅𝑒𝐿1 is the diagonal length
of 𝐿1; and ℎ𝑑1,2 is the distance between the furthest vertices:
𝑅𝑒𝐿1= 𝑑𝑖𝑎𝑔𝑜𝑛𝑎𝑙𝐿1
= √𝑤𝑖𝑑𝑡ℎ𝐿1
2 + ℎ𝑒𝑖𝑔ℎ𝑡𝐿1
2 ;
ℎ𝑑1,2 = √𝑑𝑖𝑠𝑡v2 + 𝑑𝑖𝑠𝑡h
2 .
Having the 𝑁𝐻𝐷 calculated, we can merge the layers according to Gestalt law of
proximity. If a series of sibling layers share the same proximity, then they belong to one
single group; however, if any pair of two layers has a different proximity than other pairs,
they shall be put into a different group.
4.2.2 Comparing Two Colors
While most web pages use RGB color space, CIE-Lab color space is used in this
chapter because it is designed to approximate human vision, and it provides standards to
evaluate color differences.
When retrieving a CSS color, most browsers will return a RGB value or
“transparent”. The first step to compare colors is to fix the transparent color. In fact, if a
layer has a transparent background color with no background image, the under layer’s
content will show. Thus “transparent” is not this layer’s actual displaying background color

27
– it is its parent layer’s background color. If all layers under the layer (that is, all the parent
layers of it) are transparent and none of these parent layers contains any background image,
then all the parent layers and the child layer will have a white background color. Having
determined this, we can assign all layers with a non-transparent background color properly.
The non-transparent RGB colors are then converted into CIE-Lab through (2-3) and
(2-4) (Connolly and Fleiss 1997; Johnson and Fairchild 2003):
(𝑋𝑌𝑍
) = (0.4303 0.3416 0.17840.2219 0.7068 0.07130.0202 0.1296 0.9393
) (𝑅𝐺𝐵
) , (2-3)
where, 𝑅, 𝐺, 𝐵 are the red, green and blue channel of the RGB color; and 𝑋, 𝑌 𝑍 are the X,
Y, Z channel of the color in XYZ color space.
𝐿∗ = 116 𝑓(𝑌 / 𝑌0) − 16
𝑎∗ = 500 [𝑓(𝑋 / 𝑋0) − 𝑓(𝑌 / 𝑌0)]
𝑏∗ = 500 [𝑓(𝑌 / 𝑌0) − 𝑓(𝑍 / 𝑍0)] , (2-4)
where, 𝐿∗, 𝑎∗, 𝑏∗ are the L*, a* and b* channel of the color; 𝑋0, 𝑌0, 𝑍0 are the tristimulus
values of CIE-Lab standard illuminant 𝐷50; and 𝑓(𝑞) is calculated as:
𝑓(𝑞) = {√𝑞3 𝑞 > 0.008856
7.787 𝑞 + 0.1379 𝑞 ≤ 0.008856 .
The CIE-Lab color difference is used to determine whether two colors can be
considered as the same or not. Specifically, the color difference ∆𝐸0012 under the
CIEDE2000 standard (Luo, et al. 2001; Sharma et al. 2005) is calculated, as shown in (2-
5):
∆𝐸0012 = √(
∆𝐿′
𝑘𝐿𝑆𝐿)
2
+ (∆𝐶′
𝑘𝐶𝑆𝐶)
2
+ (∆𝐻′
𝑘𝐻𝑆𝐻)
2
+ 𝑅𝑇 (∆𝐶′
𝑘𝐶𝑆𝐶) (
∆𝐻′
𝑘𝐻𝑆𝐻) . (2-5)

28
During comparison, if ∆𝐸0012 is greater than 3.30 (Liu, et al. 2012), then the two
colors are considered as different.
4.2.3 Comparing Two Images
Background images are provided by CSS as URLs. However, it is not correct to
simply compare the URLs because images with different URLs may still be the same. A
correct way to compare images is to compare their content. We first retrieved images from
URLs; and then convert them from RGB color space into CIE-Lab color space. To compare
similarity of the two images (CIE-Lab color pixels), we calculate the normalized
compression distance (NCD) as shown in (2-6) (Li, et al. 2004; Cilibrasi 2007):
𝑁𝐶𝐷(𝑥, 𝑦) =𝐶(𝑥𝑦) − 𝑚𝑖𝑛{𝐶(𝑥),𝐶(𝑦)}
𝑚𝑎𝑥{𝐶(𝑥),𝐶(𝑦)} , (2-6)
where, 𝑥, 𝑦 are the pixel representation of the two images; 𝑥𝑦 is the concatenation of 𝑥 and
𝑦; and 𝐶(𝑞) calculates the length of the compressed data 𝑞.
We select LZMA as the compression algorithm. Having obtained 𝑁𝐶𝐷(𝑥, 𝑦), if it
is smaller than 0.25 (Roshanbin and Miller 2011), then the two images 𝑥 and 𝑦 can be
considered to contain the same content.
4.3 Identification of Web Page Blocks
Each of the six translated laws can provide a result that determines whether two
layers should be merged together of not. The (final) result must combine the six sets of
results together. However, it is not easy to analyze them after the application of the laws.
An alternative solution is to combine the six laws together before the identification.

29
4.3.1 Combination of the Gestalt Laws
There exist no obvious rules on combining the Gestalt laws. Therefore, we choose
the naive Bayes classifier (McCallum and Nigam 1998) to explore the hidden connection
between them. In this classifier, the category variable 𝐶 of the classifier is set as “0” and
“1”, representing “not merge” and “merge”, respectively, while the feature vector consists
of six variables, each representing the corresponding Gestalt law, as shown in Table 2.1.
Table 2.1 Variables used by the naive Bayes classifier
Variables Values
0 1
𝑭
𝐹1 Gestalt law of proximity
do not merge
the layers merge the layers
𝐹2 Gestalt law of similarity (background)
𝐹3 Gestalt law of similarity (text style)
𝐹4 Gestalt law of similarity (layer size)
𝐹5 Gestalt law of continuity
𝐹6 Gestalt law of common fate
𝐶 all the above Gestalt laws
To train the classifier, we do not build the training set with concrete web pages.
This is because the training set shall contain all possible conditions of 𝑭, such actual web
pages are very rare. For example, it is hard to find a web page in the condition that all the
layers follow and only follow the Gestalt law of proximity (𝑭 = (𝐹1, 𝐹2, 𝐹3, 𝐹4, 𝐹5, 𝐹6) =
(1,0,0,0,0,0)). Due to this, we deliberately designed the sample pages to construct the
training set, which has covered all values of 𝑭. The training set consists of 64 cases (26 =
64). The training set is manually classified, and then fed to the classifier.
4.3.2 Collection of the Identification Results
The trained classifier reads the layer tree of a web page, evaluates the (sibling)
layers by the six laws to create the corresponding feature vector 𝑭, and finally categorizes
the layers as “merge them” or “not merge them”. The final identification results consist of

30
a series of groups, where each group represents a semantic block. Layers in each block can
be identified from the web page by its node name.
The blocks are stored into database. As we separate layers with different parents
automatically into different groups, each semantic block will only contain sibling layers.
Sometimes, a semantic block holds all sibling layers of a parent layer. In this condition, it
is reasonable to replace all the child layers with the parent layer in the block.
As mentioned before, the advantage of Mozilla Firefox extension is that it is able
to modify the web page in real-time. Therefore, in this implementation, having obtained
the merging results, we update them to the original web page immediately. The updates are
displayed by marking the corresponding DOM elements with a special background. For
each semantic block, a different color (except black and white) is assigned, and each layer
in this block is marked with this color as background. Meanwhile, border shadows are also
added to make it clearer.
5 Experiments
We develop a Mozilla Firefox extension to implement the GLM model. This is
because:
Mozilla Firefox provides APIs for manipulating DOM elements without any extra
effort such as parsing HTML code, JavaScript functions or CSS properties, making
it possible to build up the layer tree easily and fast;
The DOM tree provided in Mozilla Firefox is the one used for rendering the original
web page, thus it is the most accurate data source of a web page we can find; and

31
Any modification of the DOM tree is applied immediately, and shown (in real-time)
to the users.
Experiment results of the GLM are compared with Cai’s VIPS algorithm (Reis, et
al. 2004), which is state-of-art and normally considered the most accurate web page
segmentation algorithm. Algorithms by Hattori et al. (2007) and Baluja (2006) were also
considered, but these algorithms are not implementable for this problem space. Details of
the problems with these algorithms can be found in Sect. 2 .
5.1 Comparison Test
This test examines the identification results of the two algorithms on two test cases:
the home pages of University of Alberta and IEEE standards association. For each of the
two web pages, the two algorithms identify a series of blocks. However, some of the blocks
are incorrect – they are the “false positive” results (FP); the correct blocks that any
algorithms misses are the “false negative” results (FN); the correctly identified blocks are
the “true positive” results (TP). The original pages and the result pages of are shown in
Figure 2.4. Note that the screenshots of VIPS results are modified to illustrate results more
clearly, because Cai’s software cannot display all identified blocks in a single page.

32
Figure 2.4 Comparison of Identification Results
From the figure, observations can be found that the both GLM and VIPS have
successfully identified correlated semantic blocks. For example, the middle navigation bar
holding 7 icons (each element in the block is marked with yellow background) in Figure
2.4b, the big image block (marked with light red) in Figure 2.4c, the “news” block at the
left bottom (marked with light green background) in Figure 2.4e, and the footer block
(marked with purple) in Figure 2.4f, etc.
(a) Original page (b) GLM identification
1
(c) VIPS identification
1
(d) Original page 2 (e) GLM identification
2
(f) VIPS identification
2

33
According to the observation, the GLM algorithm has performed better than VIPS
on the two test cases. VIPS has identified very limited number of blocks, and misses a lot:
for the UA home page, it only finds 28 blocks in total; while GLM finds 47 blocks; and for
the IEEE home page, the total numbers of blocks found by the two algorithms are 15 and
41, respectively. This is because VIPS only identifies big blocks while it misses small ones.
For example, as shown in Figure 2.4c, VIPS has identified the middle block (marked with
light green border), but inside of this block, it fails to mark none of the three sub blocks –
the left side image, the middle text block, and the right side buttons group. As a comparison
in Figure 2.4b, GLM has identified both big block (marked with light blue background)
and two of the three sub blocks, missing only the left side image. Furthermore, even when
VIPS finds big blocks, many big blocks are still missed. For example, the “news” block
(left part of the lower yellow block) in Figure 2.4c, the video block in in Figure 2.4f, etc.
This drawback contributes to a high value of VIPS “false negatives”, namely, 26 in IEEE
home page, and 14 in UA home page. The statistics are summarized in Table 2.2.
Table 2.2 Numbers of TPs, FPs and FNs
Test
case
GLM VIPS
TP FP FN TP FP FN
IEEE 38 3 3 10 5 26
UA 41 6 2 18 10 14
5.2 Efficiency Test
The second group of experiments evaluates the efficiency of the GLM and compare
it with the VIPS through a large test set. Cai’s VIPS software only provides manual
operation for block identification and cannot displays all blocks together in the web page,

34
therefore is not feasible for mass evaluation. To solve this problem, we chose this
implementation3.
The test set covers the homepages of the world’s 500 top websites as defined from
statistics produced by Alexa4 . Before running the tests, we filter out “inappropriate”
samples of websites such as duplicate sites (for example, “google.com”, “google.ca”, etc.),
temporarily unavailable sites and sites that contain inappropriate content. The final test set
consists of 381 websites.
5.2.1 Evaluation Metrics
The algorithm is evaluated by measuring its precision, recall and F-1 scores. Having
acquired the numbers of TPs, FPs, and FNs for each web page, the three metrics can be
calculated by (2-7):
𝑃𝑖 = 𝐵𝐴 ∩ 𝐵𝑖
𝐵𝐴 =
𝑇𝑃𝑖
𝑇𝑃𝑖 + 𝐹𝑃𝑖
𝑅𝑖 = 𝐵𝐴 ∩ 𝐵𝑖
𝐵𝑖 =
𝑇𝑃𝑖
𝑇𝑃𝑖 + 𝐹𝑁𝑖
𝐹𝑖 = 2 𝑃𝑖 𝑅𝑖
𝑃𝑖 + 𝑅𝑖
, (2-7)
where, 𝑃𝑖 , 𝑅𝑖 , 𝐹𝑖 are precision, recall and F-1 score of the 𝑖 th web page,
respectively; 𝐵𝐴 is the number of blocks identified by the algorithm; 𝐵𝑖 is the number of
blocks that the 𝑖th web page contains; and 𝑇𝑃𝑖, 𝐹𝑃𝑖, 𝐹𝑁𝑖 are the number of “true positives”,
“false positives” and “false negatives”, respectively.
As no computer system or software can count the correct 𝑇𝑃𝑖 , 𝐹𝑃𝑖 , 𝐹𝑁𝑖
automatically, we rely upon human judgement. In this chapter, we recruit five volunteers
3 https://github.com/tpopela/vips_java 4 http://www.alexa.com/topsites. The top sites were retrieved on April 4, 2014.

35
to evaluate all the 381 samples. The volunteers all utilize the Internet every day, so it is
believed that they have sufficient experience to identify web page blocks correctly. They
are required to judge the correctness of each result calculated by the algorithm. That is, to
find the 𝑇𝑃𝑖, 𝐹𝑃𝑖 and 𝐹𝑁𝑖 from both the screenshots of GLM and VIPS for each web page.
5.2.2 Inter Rater Reliability
The five volunteers evaluate each web page sample and count the 𝑇𝑃𝑖, 𝐹𝑃𝑖 and 𝐹𝑁𝑖
independently. Before using their evaluations for the calculation of precision, recall and F-
1 scores, a verification of inter-rater reliability (Gwet 2010) showing the agreement level
among the five raters is needed. If they disagree with each other, then it will be meaningless
to rely on their rates. During the verification, we calculate Cohen’s Kappa (Jacob 1960) to
verify it, as shown in (2-8):
𝜅 = 𝑃𝑟(𝑎) + 𝑃𝑟(𝑒)
1 − 𝑃𝑟(𝑎) , (2-8)
where, 𝑃𝑟(𝑎) and 𝑃𝑟(𝑒) are the observed and expected percentage of agreement,
respectively.
Mean 𝜅 values of all samples between each two raters’ 𝑇𝑃, 𝐹𝑃 and 𝐹𝑁 are listed
in Table 2.3. The reason that 𝜅 values of GLM’s 𝑇𝑃 are lower lies in the fact that 𝑇𝑃
blocks are the major parts of each web page. Of all the test cases, the average 𝑇𝑃 is 36.89
while average 𝐹𝑃 and 𝐹𝑁 are 3.35 and 3.03, respectively. Raters’ disagreement level on
the larger group is higher than that on the smaller groups:
1) The identification results contain blocks with different granularities. One rater
considered small blocks as TP bocks while another rater considered them as FP

36
blocks. Such an example from Figure 2.4b is the green button inside the text
rectangle floating upon the big image (See the yellow ellipse in Figure 2.5) – three
of the raters believed the buttons should not be separated from the text, while the
other two raters identified them as one block. Although almost every sample
contained blocks where one was inside of another, less than 10% of them caused
granularity issues in the five volunteers’ ratings. However, this was the major
source of deviations.
Figure 2.5 Disagreement in GLM Blocks Identification Results
2) There are “hidden” blocks. This is actually because the background colors and
shadow borders of these blocks are overlapped by their upper blocks, hence the
view of these blocks was obscured. An example from Figure 2.4b is the block
holding the three buttons at the right side of the middle area (red ellipse in Figure
2.5) – the buttons were identified as a block and marked (actually their parent layer
was marked) with background color and shadow borders, however it was very

37
difficult to view due to its obscuration. Such human errors are less than 5% among
the five volunteers’ ratings, but contribute to the second largest category of
deviations.
Results in Table 2.3 provide strong evidence that even human “experts” are less
than perfect when undertaking this task, and hence it is clearly a demanding task for an
automated system.
Table 2.3 𝜅 of two raters’ evaluations
Raters GLM VIPS
A B 𝑻𝑷 𝑭𝑷 𝑭𝑵 Overall 𝑻𝑷 𝑭𝑷 𝑭𝑵 Overall
1 2 0.5746 0.9136 0.9475 0.6270 0.7137 0.7934 0.8977 0.7689
1 3 0.5106 0.9167 0.9320 0.5715 0.7384 0.7630 0.9045 0.7710
1 4 0.5319 0.9136 0.9320 0.5895 0.7662 0.7731 0.8807 0.7850
1 5 0.5000 0.9044 0.9351 0.5618 0.7416 0.7832 0.8943 0.7785
2 3 0.5267 0.9229 0.9475 0.5868 0.6708 0.7596 0.8840 0.7335
2 4 0.5534 0.9198 0.9413 0.6089 0.6770 0.7494 0.8841 0.7329
2 5 0.5028 0.9044 0.9444 0.5648 0.6523 0.7527 0.8670 0.7194
3 4 0.5374 0.9259 0.9567 0.5968 0.6771 0.7358 0.8705 0.7260
3 5 0.5161 0.9013 0.9413 0.5757 0.6801 0.7596 0.8841 0.7381
4 5 0.5373 0.9136 0.9444 0.5949 0.6925 0.7630 0.9011 0.7479
Table 2.4 shows the interpretations of the 𝜅 value (Landis and Koch 1997). From
the table, the GLM’s overall 𝜅 values between every two raters’ rates are all in a moderate
level (𝜅 > 0.5) while VIPS’ overall 𝜅 values all in a substantial level (𝜅 > 0.7). Such
agreement is equivalent to many works reporting inter-rate reliability statistics on complex
visual and medical classification problems (Pereira, et al. 2009; Hauzeur, et al. 1999;
Unwin 1998; Tewarie, et al. 2012; Albrecht, et al. 2012) and hence it is considered
sufficient for the task. Therefore, we can infer that the five raters all agreed with each other.

38
Table 2.4 𝜅 interpretation
𝜿 Strength of agreement
0.00 ~ 0.20 Slight
0.21 ~ 0.40 Fair
0.41 ~ 0.60 Moderate
0.61 ~ 0.80 Substantial
0.81 ~ 1.00 Almost perfect
5.2.3 Evaluation Results
By testing the precisions, recalls and F-1 scores of the two algorithms on the 381
web page samples, we conclude that GLM is more accurate than VIPS. Each of the five
volunteers’ rates as well as an average of these rates are evaluated. The evaluation results
are shown in Table 2.5.
Table 2.5 Average precision, recall and F-1 score of both algorithms
Volunteers GLM VIPS
Precision Recall F-1 Score Precision Recall F-1 Score
1 90.55% 90.87% 90.40% 65.79% 67.98% 63.80%
2 90.55% 90.88% 90.40% 65.87% 68.01% 63.87%
3 90.48% 90.79% 90.30% 65.80% 67.93% 63.79%
4 90.49% 90.84% 90.34% 65.69% 68.01% 63.76%
5 90.50% 90.86% 90.36% 65.77% 67.93% 63.79%
Average 90.53% 90.85% 90.37% 65.79% 67.98% 63.81%
As can be seen from Table 2.5, each volunteer produces results which are very
similar to each other (errors within 1% and standard deviations within 0.001), providing a
high degree of confidence that the results are independent of the volunteers and their
performance. It clearly shows that GLM outperforms VIPS in every situation – the average
GLM precision of the test samples is 90.53%, which is 24.74% better than VIPS.
Meanwhile, GLM provides a high recall rate of 90.85% and a high F-1 score of 90.37% –
22.87% and 26.56% higher than VIPS, respectively.
Figure 2.6 shows the box plots of all the results, where “P” denotes precision, “R”
denotes recall, and “F” denotes F-1 score. Visually we can conclude that the GLM

39
distributions, for each of the three evaluation metrics, are clearly superior to its VIPS
equivalent. In addition, if we look at the plots more closely:
1) Although both algorithms can identify samples with highest average precision
(Figure 2.6e) as 100%, GLM’s lowest precision is 56.45% (volunteer 2) and lowest
average precision is 58.72% (both for “www.reddit.com”) while VIPS’ lowest
average precision is 0% (18 samples). VIPS’ lowest non-zero precision is 1.14%
(volunteer 5) and lowest non-zero average precision is 1.21% (“www.y8.com”).
2) The median of GLM’s average precision, recall and F-1 score are 92.13%, 91.49%
and 91.09% (Figure 2.6f), respectively, meaning that more than half of the results
are over 91%. On contrary, VIPS provides the average precision, recall and F-1
score with medians of 74.68%, 74.19% and 72.08%, respectively.
3) The first quartile of GLM’s average precision is 86.36% while the third quartile is
95.63%, meaning GLM can guarantee that more than half of its results have average
precision within the range between 87% and 95%. The first and third quartiles of
VIPS’ precision are 42.86% and 100%, which is a much wider range. This shows
that although VIPS can provide some better samples, it also provides many poorer
samples than GLM.
From the data, we can find that the GLM algorithm works better than VIPS in
general. The reason lies on the fact that the GLM model interprets most of the Gestalt laws
of grouping to simulate a human’s mechanism of perception, while VIPS relies mainly on
visual of web pages to identify blocks. As modern web pages evolve, layouts are no longer
as simple as ten years ago and the visual separators are much less obvious.

40
Figure 2.6 Evaluations of GLM and VIPS on the Test Set
6 Conclusions
This chapter proposes a web page semantic block identification algorithm utilizing
the Gestalt laws of grouping, and applies two experiments to evaluate its efficiency. The
GLM model consists of three components: the layer tree builder, the Gestalt law translator,
and the web page blocks identifier. The layer tree builder produces input data to the Gestalt
(a) Volunteer 1 (b) Volunteer 2
(c) Volunteer 3 (d) Volunteer 4
(e) Volunteer 5 (f) Average

41
laws translator. It extracts visible DOM elements into layer nodes and builds the layer tree
from DOM tree of the web page by fixing the hierarchical inconsistency. The Gestalt laws
translator, the core component of the GLM model, interprets four of the major Gestalt laws
of grouping. The web page blocks identifier combines each interpreted law into a unified
law, applies it to the layer tree to obtain the semantic blocks, and finally feedbacks the
blocks to both the original web page and the local database.
Two groups of experiments are conducted to evaluate the efficiency of the model
by comparing with the VIPS algorithm. The first group runs two test cases to compare the
two algorithms’ identification results. The outcomes show that the GLM model generates
more “true positives” and less “false negatives” than VIPS, which means that the VIPS
does not perform well on modern rich format web pages. The second group tests home
pages of the world’s top 500 websites. Five volunteers are recruited to evaluate the
identification results manually. Three metrics have been calculated by collecting their
evaluations, namely, precision, recall and F-1 score. The testing results clearly
demonstrates that the GLM model is superior to VIPS:
GLM has higher precision, recall and F-1 score than VIPS;
Medians of the GLM precisions and recalls are both higher than those of VIPS; and
GLM provides steadier and higher distributions of precisions and recalls than VIPS.
Acknowledgement
The authors give thanks to China Scholarship Council (CSC) for their financial
support.

42
References
Albrecht, P., M uller, A.-K., Ringelstein, M., Finis, D., Geerling, G., Cohn, E., Aktas, O.,
Hartung, H.-P., Hefter, H., Methner, A., 2013. Retinal neurodegeneration in wilsons disease
revealed by spectral domain optical coherence tomography. In: Neurology. Vol. 80. Lippincott
Williams & Wilkins 530 WALNUT ST, PHILADELPHIA, PA 19106-3621 USA.
Baluja, S., 2006. Browsing on small screens: recasting web-page segmentation into an
efficient machine learning framework. In: Proceedings of the 15th international conference on
World Wide Web. ACM, pp. 33–42.
Cai, D., Yu, S., Wen, J.-R., Ma, W.-Y., 2003a. Extracting content structure for web pages
based on visual representation. In: Asia-Pacific Web Conference. Springer, pp. 406–417.
Cai, D., Yu, S., Wen, J.-R., Ma, W.-Y., 2003b. Vips: a vision-based page segmentation
algorithm.
Canny, J., 1986. A computational approach to edge detection. IEEE Transactions on pattern
analysis and machine intelligence (6), 679–698.
Cao, J., Mao, B., Luo, J., 2010. A segmentation method for web page analysis using
shrinking and dividing. International Journal of Parallel, Emergent and Distributed Systems 25 (2),
93–104.
Chakrabarti, D., Kumar, R., Punera, K., 2008. A graph-theoretic approach to webpage
segmentation. In: Proceedings of the 17th international conference on World Wide Web. ACM, pp.
377–386.
Chaudhuri, B. B., Rosenfeld, A., 1999. A modified hausdorff distance between fuzzy sets.
Information Sciences 118 (1), 159–171.
Cilibrasi, R. L., et al., 2007. Statistical inference through data compression.
Cohen, J., 1960. A coefficient of agreement for nominal scales. Educational and
psychological measurement 20 (1), 37–46.
Connolly, C., Fleiss, T., 1997. A study of efficiency and accuracy in the transformation
from rgb to cielab color space. IEEE Transactions on Image Processing 6 (7), 1046–1048.
Gupta, S., Kaiser, G., Neistadt, D., Grimm, P., 2003. Dom-based content extraction of html
documents. In: Proceedings of the 12th international conference on World Wide Web. ACM, pp.
207–214.
Gwet, K. L., 2014. Handbook of inter-rater reliability: The definitive guide to measuring
the extent of agreement among raters. Advanced Analytics, LLC.

43
Hattori, G., Hoashi, K., Matsumoto, K., Sugaya, F., 2007. Robust web page segmentation
for mobile terminal using content-distances and page layout information. In: Proceedings of the
16th international conference on World Wide Web. ACM, pp. 361–370.
Hauzeur, J., Mathy, L., De Maertelaer, V., 1999. Comparison between clinical evaluation
and ultrasonography in detecting hydrarthrosis of the knee. The Journal of rheumatology 26 (12),
2681–2683.
Johnson, G. M., Fairchild, M. D., 2003. A top down description of s-cielab and ciede2000.
Color Research & Application 28 (6), 425–435.
Kang, J., Yang, J., Choi, J., 2010. Repetition-based web page segmentation by detecting
tag patterns for small-screen devices. IEEE Transactions on Consumer Electronics 56 (2).
Koffka, K., 2013. Principles of Gestalt psychology. Vol. 44. Routledge.
Kohlsch utter, C., Nejdl, W., 2008. A densitometric approach to web page segmentation.
In: Proceedings of the 17th ACM conference on Information and knowledge management. ACM,
pp. 1173–1182.
Landis, J. R., Koch, G. G., 1977. The measurement of observer agreement for categorical
data. biometrics, 159–174.
Li, M., Chen, X., Li, X., Ma, B., Vit anyi, P. M., 2004. The similarity metric. IEEE
transactions on Information Theory 50 (12), 3250–3264.
Lin, S.-H., Ho, J.-M., 2002. Discovering informative content blocks from web documents.
In: Proceedings of the eighth ACM SIGKDD international conference on Knowledge discovery
and data mining. ACM, pp. 588–593.
Liu, H. X., Wu, B., Liu, Y., Huang, M., Xu, Y. F., 2013. A discussion on printing color
diffierence tolerance by ciede2000 color diffierence formula. In: Applied Mechanics and Materials.
Vol. 262. Trans Tech Publ, pp. 96–99.
Luo, M. R., Cui, G., Rigg, B., 2001. The development of the cie 2000 colour-diffierence
formula: Ciede2000. Color Research & Application 26 (5), 340–350.
McCallum, A., Nigam, K., et al., 1998. A comparison of event models for naive bayes text
classification. In: AAAI-98 workshop on learning for text categorization. Vol. 752. Madison, WI,
pp. 41–48.
Palmer, S. E., 1990. Modern theories of gestalt perception. Mind & Language 5 (4), 289–
323.
Pereira, A. C., Eggertsson, H., Martinez-Mier, E. A., Mialhe, F. L., Eckert, G. J., Zero, D.
T., 2009. Validity of caries detection on occlusal surfaces and treatment decisions based on results
from multiple caries-detection methods. European journal of oral sciences 117 (1), 51–57.

44
Reis, D. d. C., Golgher, P. B., Silva, A. S., Laender, A., 2004. Automatic web news
extraction using tree edit distance. In: Proceedings of the 13th international conference on World
Wide Web. ACM, pp. 502–511.
Roshanbin, N., Miller, J., 2011. Finding homoglyphs-a step towards detecting unicode-
based visual spoofing attacks. Web Information System Engineering–WISE 2011, 1–14.
Sharma, G., Wu, W., Dalal, E. N., 2005. The ciede2000 color-diffierence formula:
Implementation notes, supplementary test data, and mathematical observations. Color Research &
Application 30 (1), 21–30.
Sim, D.-G., Kwon, O.-K., Park, R.-H., 1999. Object matching algorithms using robust
hausdorff distance measures. IEEE Transactions on image processing 8 (3), 425–429.
Song, R., Liu, H.,Wen, J.-R., Ma,W.-Y., 2004. Learning block importance models for web
pages. In: Proceedings of the 13th international conference on World Wide Web. ACM, pp. 203–
211.
Sternberg, R. J., Sternberg, K., 2016. Cognitive psychology. Nelson Education.
Tewarie, P., Balk, L., Costello, F., Green, A., Martin, R., Schippling, S., Petzold, A., 2012.
The oscar-ib consensus criteria for retinal oct quality assessment. PloS one 7 (4), e34823.
Unwin, N., Alberti, K., Bhopal, R., Harland, J., Watson, W., White, M., 1998. Comparison
of the current who and new ada criteria for the diagnosis of diabetes mellitus in three ethnic groups
in the uk. Diabetic medicine 15 (7), 554–557.
Yu, S., Cai, D., Wen, J.-R., Ma, W.-Y., 2003. Improving pseudo-relevance feedback in
web information retrieval using web page segmentation. In: Proceedings of the 12th international
conference on World Wide Web. ACM, pp. 11–18.
Zhao, C., Shi, W., Deng, Y., 2005. A new hausdorff distance for image matching. Pattern
Recognition Letters 26 (5), 581–586.

45
CHAPTER 3 Estimating Similarity of Rich
Internet Pages Using Visual Information5
Abstract
Traditional text-based web page similarity measures fail to handle rich-
information-embedded modern web pages. Current approaches regard web pages as either
DOM trees or images. However, the former only focuses on the web page structure, while
the latter ignores the inner connections among different web page features. Therefore, they
are not suitable for modern web pages. Hence, the idea of a block tree is introduced, which
contains both structural and visual information of web pages. A visual similarity
measurement is proposed as the edit distance between two block trees. Finally, an
experiment is undertaken, by cross-comparing 500 web pages, illustrating that the model
appears to be highly accurate, empirically demonstrating that the measurement is highly
promising.
Keywords: Block Tree; Gestalt Laws of Grouping; Normalised Compression Distance;
Tree Edit Distance; Web Page Classification.
1 Introduction
Recent years have witnessed a rapid development of the Internet, which brings
about huge changes in people’s daily life through the interaction with web sites. As a matter
5 Xu, Zhen, and James Miller. “Estimating Similarity of Rich Internet Pages Using Visual Information”. Accepted by International Journal of Web Engineering and Technology on May 2017.

46
of fact, web pages have become an important tool and indispensable part of our life. For
example, people read web pages to obtain the news or information they are interested in,
get service through online systems from service providers (such as banking and socialising),
or conduct e-business. Therefore, similarity analysis of web pages is essential and has a
widespread automation application. First, it can serve as a preliminary task such as in an
anti-phishing process, i.e., through detecting similar web pages, the search scope of
potential phishing sites can be decreased to some extent. Second, it can perform version
control and evolution of web pages. Web pages evolve very fast, and the similarity analysis
provides a method to detect changes and adopt relevant control policies if necessary. Third,
it can be used for software testing. For robust software, the page should be able to response
correctly and display relevant information upon a user’s input. We can detect whether the
software functions correctly by comparing the actual page and the target page.
Due to its importance, web page similarity analysis has drawn the attention of many
researchers. However, there are still some issues, which mainly result from the fact that
modern web pages, with much more abundant information such as images and streaming
media, present additional challenges to web page classification (Wei, et al. 2014). Hence,
traditional approaches that rely heavily on textual content cannot handle modern web pages.
From the observation of human behaviours, we found that no matter how complicated web
pages are, people always have the ability of recognising and correlating content at a first
glance. The theory behind it is that humans can read the visual information directly, rather
than through the understanding of the textual content. Users do not examine web page
details, but rather the layout and design of the page to create a single impression. This is
analogous to the idea of “super signals” (Dörner 1996), a theory to account for human

47
decision making under time constraints and massive numbers of stimuli. Dörner argues
that humans collapse a number of features into a single composite impression. This
thinking pattern presents us with an interesting question: if the computer can think, can
they detect similarity more precisely? The answer is obvious, but the next question is how
can we achieve this goal? The Gestalt laws of grouping summarise the characteristics of
people’s thinking patterns. We believe that the laws can be a potential way to introduce
human-based analysis into the study of visual similarity. Therefore, in this chapter, we will
investigate web page similarity from the visual perspective by using Gestalt laws of
grouping. Our major contributions in this chapter are:
We develop a data structure to represent web pages based on the Gestalt laws of
grouping.
We propose a model to evaluate the similarity of rich web pages according to a tree
edit distance.
The rest of this chapter is organised as follows: in Section 2, we review the related
work, and provide background on currently used classification methods; section 3
introduces the concept of the block tree, and puts forward an approach to interpret and
apply the Gestalt laws of grouping; in Section 4, we come up with a visual similarity
measurement and a classification model which exploits this measurement; section 5
prepares the test sets, outlines the experimental methodology, performs the experiment on
aforementioned test sets, and analyse the outcomes; to finish, we summarise and conclude
this chapter’s contributions in Section 6.

48
2 Related Work
In general, two major orientations are widely applied including treating web pages
as images or trees, to explore web page visual similarity.
In the first category, a web page is abstracted as an image before computing their
similarities. Recently, many scholars have focused their study on image similarity (Chechik,
et al. 2010; Rohlfing 2012). A feature-based image similarity measurement approach uses
image phase congruency measurements to compute the similarities between two images
(Liu and Laganière 2007). Kwitt et al. (2008) present an image similarity model by using
Kullback-Leibler divergences between complex wavelet sub band statistics for texture
retrieval. Sampat et al. (2009) put forward an image similarity method called the complex
wavelet structural similarity. The theory behind it is that consistent phase changes in the
local wavelet coefficients may arise owing to certain image distortions. Image similarity
techniques are popular and have made some progress in web page similarity, for example,
Saar et al. (2015) proposed a classification model for cross-browser testing based on image
similarity. However, we found that a specified web page is an object embedded with a
variety of elements and these elements can interact (such as overlap or partly overlap) with
each other. Image similarity cannot reveal this interaction among elements. It is, therefore,
a different problem from pure image similarity assessment.
In the other category, a web page is regarded as tree structured data, and thus web
page similarity is studied through investigating tree similarity. With respect to tree
structured data, a handful of tree distance functions are applied, such as tree edit distance
(Shahbazi and Miller et al. 2014), multisets distance (Müller-Molina et al. 2009), entropy

49
distance (Connor, et al. 2011), and path distance (Buttler 2004). The tree edit distance is
defined as the minimum cost of operations for transferring one tree to another (Cording
and Lyngby 2011). Tree edit distances can be further divided into different sub-categories
in terms of distinct mapping constraints including top-down, bottom-up, isolated subtree,
etc. (Zhai and Liu 2006). Müller-Molina et al. (2009) propose a tree distance function with
multisets, which are sets that allow repetitive elements. Based on multiset operations, they
define a similarity measure for multisets. They achieve this by converting a tree into two
multisets, with one multiset including complete subtrees and another consisting of all the
nodes without children. Connor et al. (2011) develop a bounded distance measurement for
comparing tree structure based on Shannon’s entropy equations. Buttler (2004) analyses
the drawbacks of tree edit distance similarity, tag similarity, and Fourier transform
similarity. Then he proposes path similarity to measure the similarity of the document tree
between two distinct documents. Although the above achievements on tree similarity are
significant, the theory cannot be used directly on web page similarity research. The main
reason is that the theme of tree similarity has always been structural similarity. However,
our focus is on content similarity, in spite the obvious connection between structural and
content similarity.
Web page classification is an important topic relevant to web page similarity
analysis. Hernández et al. (2014) explore a classification method based on URLs and
develop an algorithm to produce URL-based web page classifiers that are used to perform
enterprise web page classification. Onan (2015) combine various classifiers to enhance
existing classification models by investigating different feature selection algorithms,
ensemble approaches, and classification methods. Lee et al. (2015) introduced a simplified
50
swarm optimization (SSO) algorithm for the purpose of obtaining the best weights for each
feature in their data training process such that they can use the best weights in classifying
the new web pages.
3 The Block Tree
Two major ways to represent a web page for visual similarity evaluation are the
screen shot image and the DOM tree. The former holds all visible details, but fails to
preserve the hierarchical clues. Although the later contains both visible and invisible details,
the invisible details have no contribution to visual similarity. This chapter combines the
advantages of the above two methods and proposes a new web page representation method,
which is referred to as the block tree. It extracts only visible DOM elements and merges
these elements into separate groups according to their semantic meanings.
Definition 1 (Block Tree): Given a web page 𝑊𝑃, the block tree 𝐵𝑇 of 𝑊𝑃 is a
finite set of nodes, where each node 𝑛 (that is, the block) indicates a group of semantically
related visible elements 𝐸 from the DOM tree 𝐷𝑇 of 𝑊𝑃 (𝐵𝑇 = {𝑛|𝑛 ← 𝐸, 𝐸 ⊂ 𝐷𝑇}) and
all the blocks follow the visual hierarchy of 𝑊𝑃.
To construct blocks, we merge separate render objects into semantically related
groups based on the Gestalt laws of grouping (Koffka 1955).
Definition 2 (Render Object): Given a web page 𝑊𝑃, the render object maps to
a visible DOM element 𝑒 of the DOM tree 𝐷𝑇 of 𝑊𝑃. The object contains all visible CSS
properties of 𝑒 as the visual features and serves as the merging candidates to build the
blocks of the block tree 𝐵𝑇.
51
According to the above definitions, only the visible DOM elements are considered
and the invisible DOM elements are ignored during the construction of the blocks. The
visual features of a render object refer to its geometric properties (left, top, width, and
height) and all visible CSS properties. Note that invisible CSS properties, such as
“margin” or “padding”, are not included. This is because they do not include any visual
information of the web page. In addition, the semantic meaning of the text is not included,
owing to their weak effect on the web page visual similarity. For example, two pieces of
text with the same meaning but written in different languages will be recognised as
different text by way of comparing textual strings, but will be regarded as the same text if
using the semantic meaning as the criteria.
3.1 Construction of Blocks by Gestalt Laws of Grouping
The Gestalt laws of grouping explain a human’s mechanism for perception. To
construct each block for the block tree, these laws need to be translated into computer
compatible rules (Stevenson 2012; Xu and Miller 2015).
The Gestalt law of simplicity indicates that humans tend to organise objects into
the simplest representation. In a web page, the simplest representation of content
are the DOM elements. Taking “google.ca” as an example, Figure 3.1 shows its
home page. In the figure, the middle image above the search box contains multiple
elements (i.e., the text “GOOGLE” is the title and the three columns are the texts,
images, and animations, respectively). However, when we read the whole web page,
we treat it as one entire image rather than several separated ones. As such, to

52
interpret this law, we consider the render object which maps to the DOM element
as the smallest unit, and it cannot be further split.
Figure 3.1 Home Page of “Google.ca”
The Gestalt law of closure states that humans tend to perceive incomplete shapes
as complete ones. Because child DOM elements overlap their parent elements,
many of the render objects are not completely shown in the final web page. For
example, in Figure 3.2 (the home page of “twitter.com”), the upper right part of
the background image is covered by two log-in boxes, but they are not regarded as
two holes. Instead, our minds still believe the background image is complete. That
is, the render object remains as a complete rectangle. Herein, we construct all render
objects as complete rectangles rather than irregular shapes according to this law.

53
Figure 3.2 Home Page of “Twitter.com”
The Gestalt law of proximity illustrates that humans tend to group close objects
together while separate distant objects apart. Based on this law, we merge render
objects into different blocks by distance. In a series of render objects, if any pair of
siblings have a larger distance than others, they should be put into separate groups.
For example, as shown in Figure 3.3a, the top two objects are grouped together,
the third and the fourth objects from the top are put into a second group, and the
bottom object belongs to a third group. The dimensions of the render objects,
compared with the gap, are commonly significant in web pages, so it cannot be
ignored in calculating the proximity. The Hausdorff distance (HD) (Huttenlocher
1993; Dubuisson and Jain 1994; Chaudhuri and Rosenfeld 1999) takes the
dimensions into consideration, but it is not precise enough. Therefore, the
normalised Hausdorff distance (NHD), a variant of HD, is proposed. The details
are discussed in Section 3.3.
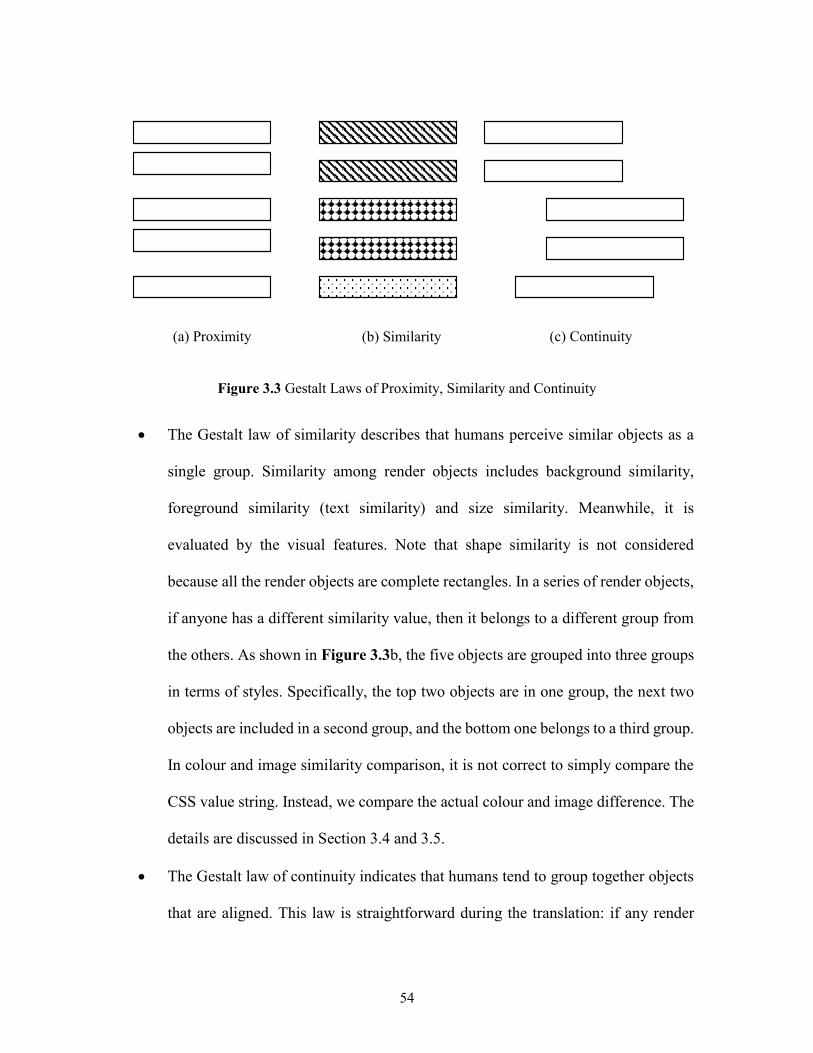
54
Figure 3.3 Gestalt Laws of Proximity, Similarity and Continuity
The Gestalt law of similarity describes that humans perceive similar objects as a
single group. Similarity among render objects includes background similarity,
foreground similarity (text similarity) and size similarity. Meanwhile, it is
evaluated by the visual features. Note that shape similarity is not considered
because all the render objects are complete rectangles. In a series of render objects,
if anyone has a different similarity value, then it belongs to a different group from
the others. As shown in Figure 3.3b, the five objects are grouped into three groups
in terms of styles. Specifically, the top two objects are in one group, the next two
objects are included in a second group, and the bottom one belongs to a third group.
In colour and image similarity comparison, it is not correct to simply compare the
CSS value string. Instead, we compare the actual colour and image difference. The
details are discussed in Section 3.4 and 3.5.
The Gestalt law of continuity indicates that humans tend to group together objects
that are aligned. This law is straightforward during the translation: if any render
(a) Proximity (b) Similarity (c) Continuity

55
object is not aligned with its siblings, then it belongs to a different group. So
according to Figure 3.3c, the five objects are split into three groups, namely the top
two, the next two, and the bottom one.
The Gestalt law of common fate argues that humans are prone to include the objects
with the same motion trend in the same group. However, once a web page is fully
loaded, the major factor that causes web page motion is the “scrolling behaviour”.
As such, we only consider the scrolling behaviour as the motion trend. When the
user scrolls the page, all the content will scroll accordingly. If any render object
does not scroll in the same way with its siblings, then it belongs to a different group.
For example, the lower banner marked by the black ellipse in Figure 3.4(the home
page of “ubuntu.com”) always hangs at the bottom even when the use scrolls the
page, so its scrolling behaviour is not consistent with others. This kind of behaviour
can be verified by the CSS property “position”.
The Gestalt law of symmetry illustrates humans’ tendency of perceiving symmetric
objects as a single group, even when they are far from each other. This law rarely
appears in web pages; hence we will omit it from the discussion in the chapter.
The Gestalt law of past experience indicates that humans tend to interpret objects
according to the past experience. This law requires a higher level of cognations
which does not belong to the field of web page analysis, so we will omit this law
as well.
Among all the above six Gestalt laws, the first two shows us how to extract render
objects from the DOM tree, and the remaining four regulates the way of merging the

56
extracted render objects into groups (that is, the blocks in the block tree) by the visual
features.
Figure 3.4 Home Page of “Ubuntu.com”
3.2 Construction of the Block Tree
The block tree takes the previously merged blocks as tree nodes, and follows the
DOM tree’s hierarchy to organise these nodes. At the beginning, the first visible DOM
element is the “BODY”, so the root node of the block tree will be a block that holds it.
Although sometimes a BODY is invisible, the page will still be drawn by the browser on a
white background, leaving the transparent BODY visible. Next, we follow the bottom up
rule. From the root block onwards, all the direct child render objects of a block are
evaluated by the Gestalt laws and split into one or more groups. Each of the laws are then
applied to create a block. These blocks will maintain their hierarchy in the DOM tree.

57
However, if a DOM element is invisible but its direct children are visible, then the parent
of the children’s corresponding blocks will all point to the parent block of the invisible
DOM element.
3.3 Hausdorff Distance and Normalised Hausdorff Distance
The HD between two render objects 𝑅1 and 𝑅2 can be calculated by (3-1) and (3-
2) following the two steps.
1) Hausdorff distance from 𝑅1 to 𝑅2 refers to the maximum value of all distances from
any point 𝑟1 in 𝑅1 to its nearest point in 𝑅2:
ℎ𝑑(𝑅1, 𝑅2) = sup𝑟1∈𝑅1
inf𝑟2∈𝑅2
‖𝑟1 − 𝑟2‖ , (3-1)
where, 𝑅1 and 𝑅2 are the two render objects; 𝑟1 and 𝑟2 refer to any points in 𝑅1 and
𝑅2 , respectively; sup and inf calculate the maximum and minimum value of a
given set, respectively; and ‖𝑟1 − 𝑟2‖ calculates the Euclidian distance between 𝑟1
and 𝑟2.
2) Hausdorff distance between 𝑅1 and 𝑅2 refers to the maximum value of all distances
from any point in a render object to its nearest point in the other render object:
𝐻𝐷(𝑅1, 𝑅2) = max{ℎ𝑑(𝑅1, 𝑅2), ℎ𝑑(𝑅2, 𝑅1)} . (3-2)
As shown in Figure 3.5, 𝑅1 and 𝑅2 are two squares both of the size 50×50 and
share a same vertical side; 𝑅3 and 𝑅4 are another two squares both of the sized 10×10, and
their bottom sides are in the same line while the horizontal distance between their closest
vertical sides are 40. According to (1), ℎ𝑑(𝑅1, 𝑅2) equals to 50, which is the distance

58
between 𝑎1 and its nearest point in 𝑅2 (that is, 𝑎2). Similarly, ℎ𝑑(𝑅2, 𝑅1), ℎ𝑑(𝑅3, 𝑅4) and
ℎ𝑑(𝑅4, 𝑅3) equals to the distance between 𝑑2 and 𝑑1, 𝑎3 and 𝑎4, 𝑑4 and 𝑑3, respectively.
Therefore, according to (2), both 𝐻𝐷(𝑅1, 𝑅2) and 𝐻𝐷(𝑅3, 𝑅4) are 50.
Figure 3.5 HD Inconsistency
In the above example, it seems that the first pair of squares looks closer to each
other than the second pair. However, their HDs are the same. Therefore, using HD as the
proximity measurement will cause contradictions and inaccuracies. In fact, this paradox is
caused by the dimensions of the render objects. Hence, it can be eliminated by normalising
the value of HD. By doing this, we obtain the normalised HD, which is denoted by NHD.
When a render object is located inside of another render objects, its NHD is 0; otherwise it
is the maximum of the normalised ℎ𝑑, as shown in (3-3):
𝑁𝐻𝐷(𝑅1, 𝑅2) = max {ℎ𝑑(𝑅1,𝑅2)
𝑑𝑅1
,ℎ𝑑(𝑅2,𝑅1)
𝑑𝑅2
} , (3-3)
where, 𝑑𝑅1 is the dimension of render object 𝑅1, and 𝑑𝑅2
is the dimension of render object
𝑅2.
The dimension varies according to the relative position of the two render objects.
An example is illustrated in Figure 3.6. To determine 𝑑𝑅0 , we split the surrounding region

59
of 𝑅0 by the dashed lines. 𝑅1 is inside of 𝑅0, while 𝑅2, 𝑅3 and 𝑅4 cover the north, west,
and corner regions of 𝑅0, respectively. In this circumstance, 𝑁𝐻𝐷(𝑅0, 𝑅1) is equal to 0;
when calculating the values of ℎ𝑑(𝑅0, 𝑅2), ℎ𝑑(𝑅0, 𝑅3), and ℎ𝑑(𝑅0, 𝑅4), 𝑑𝑅0 represents the
height, width, and diagonal of 𝑅0, respectively.
Figure 3.6 NHD Dimensions
3.4 Colour Translation and Colour Difference
In spite of RGB colour space being adopted by most web pages, it is difficult to
define a universally acceptable RGB colour difference. On the other hand, the CIE-Lab
colour space has provided a standard colour difference solution – the ∆𝐸00 (Luo et al. 2001;
Sharma, et al. 2005), as shown in (3-4):
∆𝐸00 = √(∆𝐿∗
𝑘𝐿𝑆𝐿)
2
+ (∆𝐶∗
𝑘𝐶𝑆𝐶)
2
+ (∆𝐻∗
𝑘𝐻𝑆𝐻)
2
+ 𝑅𝑇 (∆𝐶∗
𝑘𝐶𝑆𝐶) (
∆𝐻∗
𝑘𝐻𝑆𝐻) , (3-4)
where, ∆𝐿∗, ∆𝐶∗ and ∆𝐻∗ are the lightness, chroma and hue differences, respectively; 𝑆𝐿,
𝑆𝐶 and 𝑆𝐻 are the weighting functions of the lightness, chroma and hue components,
respectively; 𝑘𝐿 , 𝑘𝐶 and 𝑘𝐻 are the parametric factors; and 𝑅𝑇 is the interactive term
between the hue and chroma differences.

60
Colours can be converted from RGB space to CIE-Lab space. Once the conversion
is completed, a threshold for distinguishing the two colours is necessary. Liu et al. have
studied the concept of what constitutes two different colours via extensive experimentation;
they have concluded that a threshold can be set to 3.30 (2013) to distinguish between two
colour samples. Therefore, we use their value to identify our colour similarity.
3.5 Image Similarity Comparison
The browser parses the HTML and CSS before applying them in a web page, but it
draws and displays images directly without parsing the content. This leaves the extracting
of images’ visual features from the page impossible. Hence, to compare image similarity,
we take the raw (CIE-Lab) images as the direct input. A measurement for evaluating the
similarity/difference of arbitrary objects is the normalised information distance (NID)
(Bennett, et al., 1998). However, it is not computable (Terwijn, et al. 2011) because an
“ideal” compressor (i.e., the compressor which provides the same result as the single object
when compressing two identical objects) does not exist.
A potential replacement of NID is the normalised compression distance (NCD),
where the compressor must be lossless. The NCD is calculated by (3-5) (Li, etc. 2004):
𝑁𝐶𝐷(𝑋, 𝑌) = 𝐶(𝑋𝑌) − min{𝐶(𝑋),𝐶(𝑌)}
max{𝐶(𝑋),𝐶(𝑌)} , (3-5)
where, 𝑋 and 𝑌 are the two images; 𝑋𝑌 is the concatenation of 𝑋 and 𝑌 ; and 𝐶(𝑞)
calculates the length of the lossless compression of 𝑞.
The value of NCD is 0.0 if two images are identical, and 1.0 if they are completely
different. Similar with ∆𝐸00 in representing colour difference, a proper threshold is

61
necessary to decide the image similarity. Roshabin and Miller (2011) have undertaken
studies on the empirical threshold, and we adopt their findings in this chapter: the
compression should be implemented by a LZMA compressor, and a threshold of 0.25
provides an adequate decision point.
4 Visual Similarity between Two Web Pages
After web pages being represented by the block trees, the similarity of a pair of web
pages can be determined by the similarity of their block trees. This similarity can be
determined by the tree edit distance (TED) (Tai, K. C. 1979) because the block trees are
labelled and ordered. The order of the block tree nodes follows the appearance of them,
which is essentially follow the appearance of the render objects, and the label of a block is
its visual feature set.
4.1 Block Tree Edit Distance
Let 𝑇 be a block tree, |𝑇| be the size (that is, number of nodes), 𝑡𝑖 be the ith node
in the post-order traversal, and 𝑇𝑝 and 𝑇𝑞 be two different block trees, respectively. TED
of 𝑇𝑝 and 𝑇𝑞 is then defined as the minimum cost of edit operations when shifting from
𝑇𝑝 to 𝑇𝑞. In this chapter, we assume costs of all the edit operations are the same and take
the value of 1. In this case, the TED reflects the number of edit operations.
The edit operations include insertion, deletion, and relabel. When transferring 𝑇𝑝
to 𝑇𝑞, if a node 𝑡𝑖𝑝
in 𝑇𝑝 has no corresponding node 𝑡𝑗𝑞 in 𝑇𝑞, then the edit operation is
deletion. If 𝑡𝑗𝑞 has no corresponding node 𝑡𝑖
𝑝, then it is insertion. If a pair of corresponding
nodes 𝑡𝑖𝑝
and 𝑡𝑗𝑞
exist but their labels are different, then it is a relabel operation. The

62
mapping of the corresponding nodes, denoted by 𝑚(𝑡𝑖𝑝
, 𝑡𝑗𝑞
), is not arbitrary. Rather, it
should follow a series of rules (Shahbazi and Miller 2014). Considering two mappings
𝑚(𝑡𝑖1
𝑝 , 𝑡𝑗1
𝑞 ) and 𝑚(𝑡𝑖2
𝑝 , 𝑡𝑗2
𝑞 ), the rules include:
the one-to-one rule – a node of the first tree can only map to one node of the second
tree: 𝑗1 = 𝑗2 ⇔ 𝑖1 = 𝑖2;
the horizontal-order-preserving rule – 𝑡𝑗1
𝑞 locates before 𝑡𝑗2
𝑞 ⇔ 𝑡𝑖1
𝑝 locates before 𝑡𝑖2
𝑝.
the vertical-order-preserving rule – 𝑡𝑗1
𝑞 is an ancestor of 𝑡𝑗2
𝑞 ⇔ 𝑡𝑖1
𝑝 is an ancestor of
𝑡𝑖2
𝑝.
By default, TED calculates the structural similarity of two trees. However, what we
concern about is the visual similarity induced by the visual features. Hence, in the block
tree, we encode the visual features into the labels, and consequently, during the block tree
edit distance (B-TED) calculation, the relabel operation will compare the blocks “visually”.
For instance, when mapping one block in a block tree to another block in a second block
tree, if the first block has different visual features with the second block, then it is relabelled
after mapping with a relabel operation; it remains the same otherwise. The model of block
tree construction and visual similarity calculation is illustrated by Figure 3.7.
Figure 3.7 The Calculation Model

63
4.2 Case Study
This section investigates the block tree and visual similarity model through a series
of test cases. The first test case is the home page of the electrical and computer engineering
department from the university of Alberta (ECE, http://www.ece.engineering.ualberta.ca/).
The original page, shown in Figure 3.8, includes various blocks, such as the left navigation
menu, the big image under the department banner, the three columns of “news and events”,
and the footer. Figure 3.9 illustrates the page after merging. Different background colours
and boarder shadows are utilized to indicate different blocks. For example, if two render
objects are marked with the same colour, they belong to the same block.
Two conclusions can be made from Figure 3.8 and Figure 3.9. Fist, most of the
render objects are merged into blocks. For example, the background of the menu items (i.e.,
the objects framed with the white-edged rectangle) above the department banner are
marked with green, and that of all the footer content is marked with light pink. Second,
some render objects are not identified correctly, such as the left navigation menu (i.e., the
object framed with the red-edged round rectangle). It is obvious that the menu should go
to the same block, but they are marked in different colours. This is because each menu item
is a link (an “A” DOM element) under a list item (a “LI” DOM element) according to the
hierarchy, under which each A has the same size and position with its parent “LI”.
Therefore, each “LI” and “A” are marked with the background colour, resulting in invisible
LI block from the final screenshot image. In fact, content in the right of the three columns
(the right red rounded rectangle) are in the same case, but the margins (i.e., the uncovered
background by the three columns) eliminate this display issue by showing the content
covered by the paragraphs. In fact, this problem happens whenever the foreground text and

64
the background colours/images are displayed in different DOM elements and is a limitation
of the current model.
Figure 3.8 Case Study: The Home Page of ECE
The block tree of the above web page is partly shown in Figure 3.10. Each line in
the figure indicates a single block, where the full visual features are saved for visual
similarity evaluation. Different indentions reflect the hierarchy.

65
Figure 3.9 Case Study: The Home Page of ECE (marked)
[BODY]: left=0,top=0, # visual features are partly shown
|- [FORM]: left=0,top=0, #...
| |- [DIV,FOOTER]: left=0,top=0, #...
| | |- [HEADER,SECTION]: left=0,top=0, #...
| | | |- [DIV,DIV]: left=0,top=0, #...
| | | | |- [DIV]: left=157,top=0, #...
| | | | | |- [A]: left=157,top=10, #...
| | | | | | |- [SPAN]: left=-99833,top=9, #...
| | | | | |- [NAV,DIV]: left=336,top=35, #...
| | | | | | |- [DIV]: left=336,top=34, #...
| | | | | | | |- [UL]: left=336,top=34, #...
# ... ...
Figure 3.10 Part of the Block Tree

66
Another two web pages are analysed to evaluate the visual similarity, including the
home pages of the University of Alberta (UA, http://ualberta.ca/), and that of the faculty of
graduate studies and research (FGSR, https://uofa.ualberta.ca/graduate-studies), as shown
in Figure 3.11 and Figure 3.12, respectively.
Among the three web pages, the last two pages are more similar with each other in
both theme (such as the colours, fonts, and image styles) and layout settings. More
specifically, they both have function menus and green banner images at the top; navigation
menu below the green banner, and green footer at the bottom; the central pages are mixed
with images and paragraphs; the news and events sections have three columns, where the
left columns are the wildest and the right columns are the narrowest. In comparison, the
first page owns a blue theme, a navigation menu locating at the left, and a central page with
image and texts separated. Table 3.1 shows the sizes of the “BODY” sub DOM tree, the
visual tree (that is, the DOM tree of visible elements) and the block.
Table 3.1 Tree Sizes of the Three Web Pages
Web Page DOM Tree Visual Tree Block Tree
1 235 157 88
2 420 278 128
3 831 233 114

67
Figure 3.11 Case Study: The Home Page of UA

68
Figure 3.12 Case Study: The Home Page of FGSR

69
From the table, although the second two pages are similar, the size difference
between their DOM trees is larger than that between the first two DOM trees. Also, the
size difference between the second two pages’ visual trees is smaller than that between the
rest pairs. These two facts prove again that only the visible content of a web page
contributes to the visual similarity. Hence, the DOM tree is not suitable for visual similarity
evaluation, owing to abundant invisible elements it contains. In addition, the block tree size
difference between the last two pages is smaller than that between the first and the second
as well as that between the first and the third, which indicates the block tree reflects visual
similarity.
Calculated by the three block trees, B-TEDs are: 121 between web page 1 and 2,
128 between page 1 and 3, and 108 between page 2 and 3. None of these values is 0, which
represents that the three block trees are different from each other. Due to the smallest B-
TED being witnessed, page 2 and 3 are most similar. Meanwhile, B-TED between page 1
and 2 is smaller than that between page 1 and 3, indicating that page 2 is more similar with
page 1 compared to page 3.
5 Experiments
The experiments are designed to evaluate whether B-TED is an effective
measurement for web page visual similarity analysis. First, a set of web pages are crawled
as the test cases and split into subsets randomly. Then the aforementioned model is applied
to all pairs of test cases within each subset to calculate the B-TEDs. The values of B-TEDs
indicate the similarity between web pages; and the pre-classified results are exploited to
obtain the values of precision, recall, and accuracy rates.
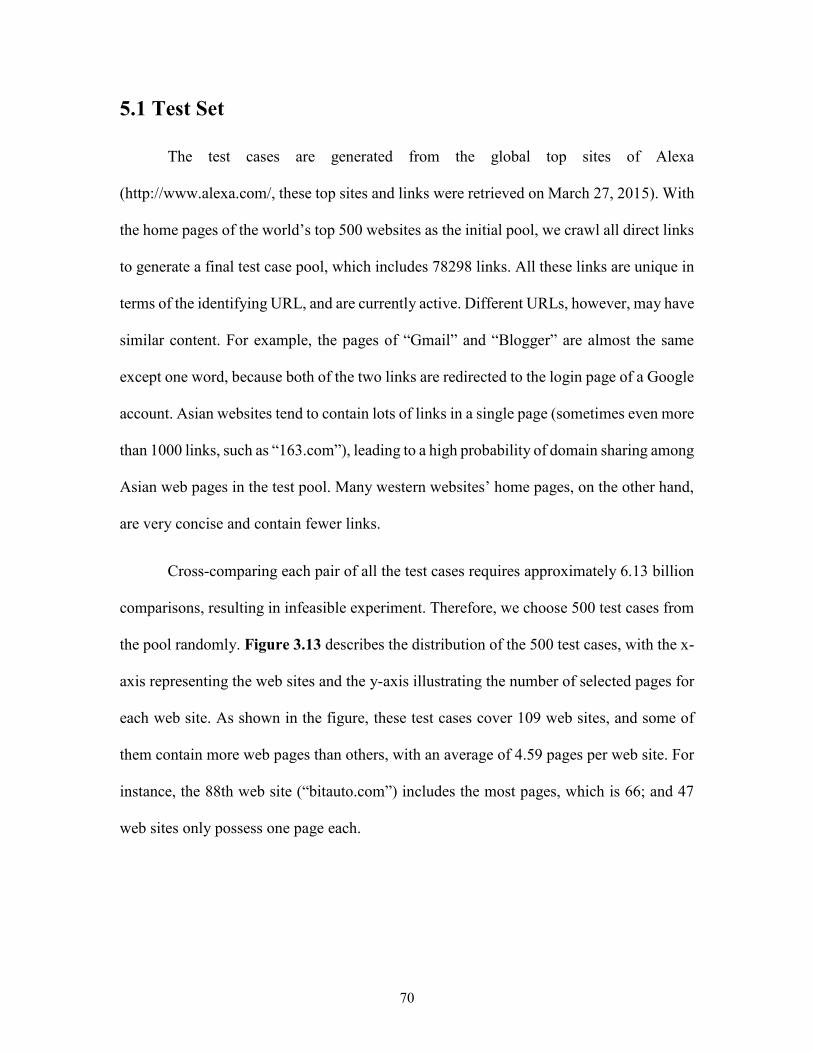
70
5.1 Test Set
The test cases are generated from the global top sites of Alexa
(http://www.alexa.com/, these top sites and links were retrieved on March 27, 2015). With
the home pages of the world’s top 500 websites as the initial pool, we crawl all direct links
to generate a final test case pool, which includes 78298 links. All these links are unique in
terms of the identifying URL, and are currently active. Different URLs, however, may have
similar content. For example, the pages of “Gmail” and “Blogger” are almost the same
except one word, because both of the two links are redirected to the login page of a Google
account. Asian websites tend to contain lots of links in a single page (sometimes even more
than 1000 links, such as “163.com”), leading to a high probability of domain sharing among
Asian web pages in the test pool. Many western websites’ home pages, on the other hand,
are very concise and contain fewer links.
Cross-comparing each pair of all the test cases requires approximately 6.13 billion
comparisons, resulting in infeasible experiment. Therefore, we choose 500 test cases from
the pool randomly. Figure 3.13 describes the distribution of the 500 test cases, with the x-
axis representing the web sites and the y-axis illustrating the number of selected pages for
each web site. As shown in the figure, these test cases cover 109 web sites, and some of
them contain more web pages than others, with an average of 4.59 pages per web site. For
instance, the 88th web site (“bitauto.com”) includes the most pages, which is 66; and 47
web sites only possess one page each.

71
Figure 3.13 The Distribution of Randomly Selected Web Pages per Web Site
Figure 3.14 illustrates the sizes of all the block trees (i.e., the number of nodes per
block tree). Among them, the largest block tree has 1237 nodes, and the smallest contains
only 4 nodes. The mean size of all the block trees is 346.38.
Figure 3.14 The Distribution of Block Tree Size
5.2 Experimental Methodology
It is infeasible to cross-compare the visual similarity between web pages manually,
this is because there will be (5002
) = 142750 pairs of pages. Therefore, in the experiment,
we build a web classification model to identify the visual similarity automatically. This
classification model runs a naive Bayes classifier (McCallum and Nigam 1998) and follows

72
a 10-fold cross-validation (Refaeilzadeh et al. 2009) routine. Specifically, in the
experimental preparation, the test set is first divided into 10 subsets randomly and equally.
The next step is to prepare the feature set for the classifier. For each subset, there are (502
)
= 1225 pairs of web pages, so the feature vector contains 1225 records, each of which
includes the block trees of the two web pages as well as the B-TED values between them.
Also, we set the category variable as a Boolean with “YES” denoting similar and “NO”
representing different.
The category variable is determined manually. In each subset, all the web pages are
read by five people and then split into several groups, where visually similar pages are put
in the same group, while different pages are placed into different groups. The split
decisions are made purely by the comprehensive understanding of the five people, so we
can use it to evaluate how well the algorithm simulates human perception. For example,
the home pages of “google.ca” and “google.fr” are similar so they are put in the same group;
and conversely, the home page of “google.ca” is visually different from that of
“yahoo.com”, so they are sorted into different groups. During manual classification, it is
not reasonable to make the five people identify web page similarity following rules,
because any given rule will affect people’s way of thinking, leading to the inaccurate
judgement and thus disrupting the manual classification. After pre-classification, if two
web pages are in the same group, then the corresponding category of this feature record
will be “YES”; and vice versa. Inter rater reliability of the five people are evaluated by
Cohen’s Kappa, where the results are shown in Table 3.2. According to the table and Table
2.4, 𝜅 of each two of the five raters are all within the “substantial” range (and higher) for
all the 10 subsets, indicating the five people all agree with each other.
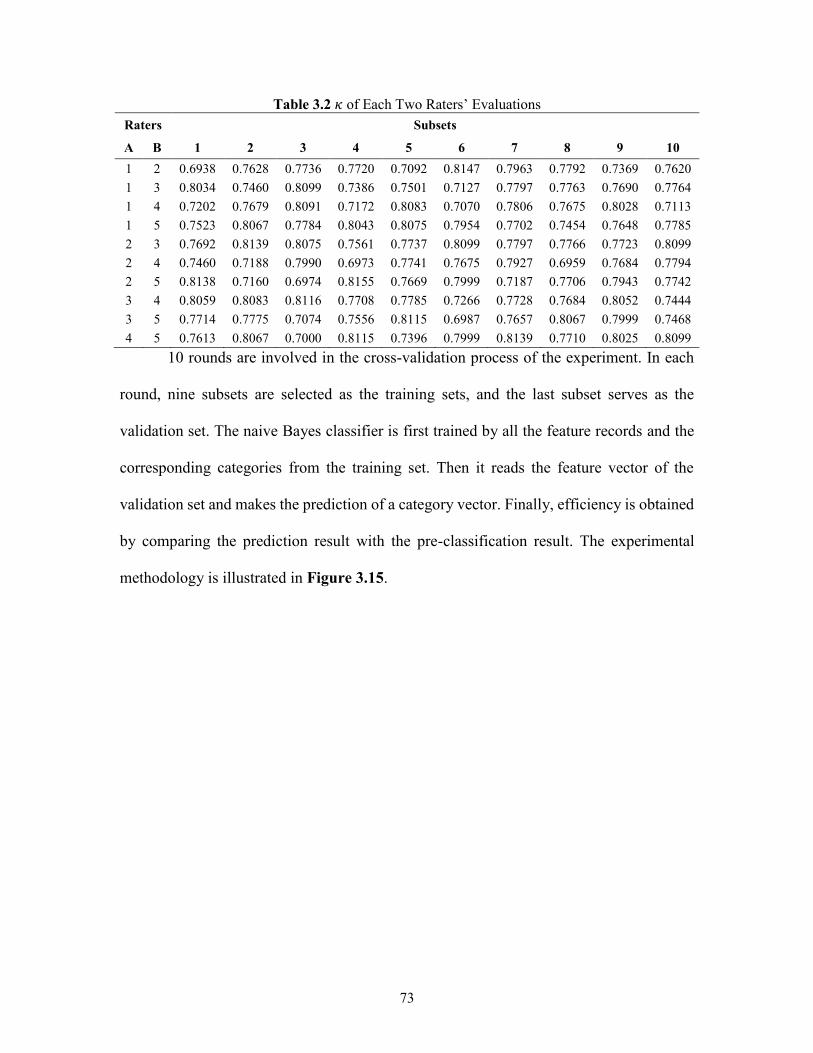
73
Table 3.2 𝜅 of Each Two Raters’ Evaluations
Raters Subsets
A B 1 2 3 4 5 6 7 8 9 10
1 2 0.6938 0.7628 0.7736 0.7720 0.7092 0.8147 0.7963 0.7792 0.7369 0.7620
1 3 0.8034 0.7460 0.8099 0.7386 0.7501 0.7127 0.7797 0.7763 0.7690 0.7764
1 4 0.7202 0.7679 0.8091 0.7172 0.8083 0.7070 0.7806 0.7675 0.8028 0.7113
1 5 0.7523 0.8067 0.7784 0.8043 0.8075 0.7954 0.7702 0.7454 0.7648 0.7785
2 3 0.7692 0.8139 0.8075 0.7561 0.7737 0.8099 0.7797 0.7766 0.7723 0.8099
2 4 0.7460 0.7188 0.7990 0.6973 0.7741 0.7675 0.7927 0.6959 0.7684 0.7794
2 5 0.8138 0.7160 0.6974 0.8155 0.7669 0.7999 0.7187 0.7706 0.7943 0.7742
3 4 0.8059 0.8083 0.8116 0.7708 0.7785 0.7266 0.7728 0.7684 0.8052 0.7444
3 5 0.7714 0.7775 0.7074 0.7556 0.8115 0.6987 0.7657 0.8067 0.7999 0.7468
4 5 0.7613 0.8067 0.7000 0.8115 0.7396 0.7999 0.8139 0.7710 0.8025 0.8099
10 rounds are involved in the cross-validation process of the experiment. In each
round, nine subsets are selected as the training sets, and the last subset serves as the
validation set. The naive Bayes classifier is first trained by all the feature records and the
corresponding categories from the training set. Then it reads the feature vector of the
validation set and makes the prediction of a category vector. Finally, efficiency is obtained
by comparing the prediction result with the pre-classification result. The experimental
methodology is illustrated in Figure 3.15.

74
Figure 3.15 Experimental Methodology
5.3 Experimental Results
The B-TED distribution of the 1225 records in subset 1 is displayed in Figure 3.16.
Two findings can be concluded from this figure. First, B-TED can be used as a visual
similarity measurement, owing to the fact its different values towards with similar pages
and different pages. To be specific, B-TED values between similar web pages (the “YES”
category) are smaller than that between different web pages (the “NO” category). Second,
the threshold to determine web page similarity does not exist, because there is no clear gap
between the two categories Distributions of the remaining nine subsets are similar, which
reveals the above findings as well.

75
Figure 3.16 B-TED Distributions of Subset 1
Table 3.3 depicts more details about the B-TED values. The maximum B-TED of
each subset ranges from 1037 to 1542, and the minimum value is between 24 and 112.
With respect to the mean values, the “YES” cases have values from 662.90 to 811.89, and
the “NO” test cases take the values from 309.35 to 357.09. The latter is approximately 300
smaller than the former, indicating that although the obvious threshold does not exist, the
visual similarity can still be identified by the B-TED.
Table 3.3 B-TED Value Details
Subset Maximum Minimum Mean of “YES”
cases
Mean of “NO”
cases
1 1490 54 764.24 355.03
2 1233 42 758.12 309.35
3 1292 32 736.67 352.26
4 1174 78 731.92 312.45
5 1373 68 811.89 333.61
6 1037 112 690.02 348.86
7 1093 27 662.90 343.56
8 1085 24 666.78 317.45
9 1052 80 663.64 357.09
10 1542 82 799.02 346.90

76
To evaluate the model’s performance, the precision, recall, and accuracy of the
classification are collected by (3-6).
𝑃𝑖 = 𝑇𝑃𝑖
𝑇𝑃𝑖 + 𝐹𝑃𝑖
𝑅𝑖 = 𝑇𝑃𝑖
𝑇𝑃𝑖 + 𝐹𝑁𝑖
𝐴𝑖 = 𝑇𝑃𝑖 + 𝑇𝑁𝑖
𝑇𝑃𝑖 + 𝑇𝑁𝑖+𝐹𝑃𝑖+𝐹𝑁𝑖
, (3-6)
where, 𝑖 denotes the subset number; 𝑃𝑖, 𝑅𝑖, and 𝐴𝑖 are the precision, recall, and accuracy
of the classification, respectively; 𝑇𝑃𝑖 , 𝑇𝑁𝑖 , 𝐹𝑃𝑖 , and 𝐹𝑁𝑖 are the numbers of “true
positive”, “true negative”, “false positive”, and “false negative” classifications,
respectively:
if two web pages are similar and correctly identified by the classifier, then they are
referred to as true positive (TP);
if two web pages are different and correctly identified, then they are referred to as
true negative (TN);
if two web pages are different but incorrectly identified as similar, then they are
referred to as false positive (FP);
if two web pages are similar but incorrectly identified as different, then they are
referred to as false negative (FN).
From the experimental results shown in Table 3.4, it can be seen that round 6
demonstrates the best performance with precision of 94.72% and accuracy of 98.29%.
Conversely, the first trial demonstrates the poorest performance with a precision of 74.38%,
and an accuracy of 87.27%. This is caused by the high FP rate of the corresponding
predictions. This problem also appears in round 10. There are more TPs and TNs than FPs

77
and FNs in each of the 10 rounds. Also, the overall accuracy is 94.43%, which proves that
B-TED is an effective measurement for visual similarity. Meanwhile, FPs are non-zero,
showing that some pairs of different pages are incorrectly identified as similar. Conversely,
FNs are all zero, which reveals that there are no pairs of similar pages identified as different.
The probably reason for this is that people tend to focus on the overall sketch when looking
for similarity, and pay attention to details when searching for differences. Therefore, if two
pages are similar, the probability that they are identified as different is very low; conversely,
if they are different, there is possibility that they are judged as similar.
Table 3.4 Experimental Results
Round TP TN FP FN Precisio
n Recall
Accurac
y
1 453 616 156 0 74.38% 100.00% 87.27%
2 619 528 78 0 88.81% 100.00% 93.63%
3 592 554 79 0 88.23% 100.00% 93.55%
4 682 505 38 0 94.72% 100.00% 96.90%
5 732 432 61 0 92.31% 100.00% 95.02%
6 786 418 21 0 97.40% 100.00% 98.29%
7 810 390 25 0 97.01% 100.00% 97.96%
8 659 530 36 0 94.82% 100.00% 97.06%
9 734 460 31 0 95.95% 100.00% 97.47%
10 593 475 157 0 79.07% 100.00% 87.18%
Average 666.00 490.80 68.20 0 90.27% 100.00% 94.43%
6 Conclusion
Modern web pages are embedded with abundant information, such as images and
streaming media. Hence, traditional text-based similarity evaluation methods are
problematic; however, similarity based on visual information is a promising orientation for
modern web pages.
In this chapter, a novel approach to this problem is proposed. The “block tree”
model is introduced to represent a web page visually. This is done by retrieving visual
information from the web page and interpreting the Gestalt laws of grouping to merge

78
related content. A normalised Hausdorff distance is introduced to evaluate proximities; the
CIE-Lab colour space and its colour difference are used to find the colour similarities; and
the normalised compression distance is used to calculate image similarities. A page
similarity classification model is then built based on the block tree edit distance (B-TED).
When calculating B-TED, we label each block tree node with all its visual features, and
compare the corresponding nodes by them.
An experiment is preformed utilizing a test set built from randomly crawling
popular web sites. To evaluate the correctness of B-TED as a measurement for visual
similarity, a 10-fold cross-validation is conducted. The overall precision, recall, and
accuracy in the experiment are 90.27%, 100%, and 94.43%, respectively. This implies that
B-TED is a promising measurement for web page similarity evaluation, and provides
satisfactory identification results.
In spite of the contributions, limitation still exists for the proposed methodology.
That is, the hierarchy of the block tree does not precisely reflect the visual layout when
foreground text and background colours/images are separated. In the future work, a proper
solution for this limitation will be the first task.
To the best of our knowledge, this is the first time that the Gestalt laws of grouping
have been used to investigate web page similarity. Therefore, no similar study exists in the
literature. In the future, we plan to investigate and validity our interpretation of these laws
via experiments which explored the effectiveness of each law independently.

79
Acknowledgement
The authors would like to thank China Scholarship Council (CSC) and Natural
Sciences and Engineering Research Council of Canada (NSERC) for their financial support.
References
Bennett, C. H., G acs, P., Li, M., Vit anyi, P. M., Zurek, W. H., 1998. Information distance.
IEEE Transactions on information theory 44 (4), 1407–1423.
Buttler, D., 2004. A short survey of document structure similarity algorithms. Tech. rep.,
Lawrence Livermore National Laboratory (LLNL), Livermore, CA.
Chaudhuri, B. B., Rosenfeld, A., 1999. A modified hausdorff distance between fuzzy sets.
Information Sciences 118 (1), 159–171.
Chechik, G., Sharma, V., Shalit, U., Bengio, S., 2010. Large scale online learning of image
similarity through ranking. Journal of Machine Learning Research 11 (Mar), 1109–1135.
Connor, R., Simeoni, F., Iakovos, M., Moss, R., 2011. A bounded distance metric for
comparing tree structure. Information Systems 36 (4), 748–764.
Cording, P. H., Lyngby, K., 2011. Algorithms for web scraping. PDF] Available:
http://www2. imm. dtu. dk/pubdb/views/publicationdetails. php.
Dorner, D., 1996. The logic of failure: Recognizing and avoiding error in complex
situations. Basic Books.
Dubuisson, M.-P., Jain, A. K., 1994. A modified hausdorff distance for object matching.
In: Pattern Recognition, 1994. Vol. 1-Conference A: Computer Vision & Image Processing.,
Proceedings of the 12th IAPR International Conference on. Vol. 1. IEEE, pp. 566–568.
Hern andez, I., Rivero, C. R., Ruiz, D., Corchuelo, R., 2014. Cala: An unsupervised url-
based web page classification system. Knowledge-Based Systems 57, 168–180.
Huttenlocher, D. P., Klanderman, G. A., Rucklidge, W. J., 1993. Comparing images using
the hausdorff distance. IEEE Transactions on pattern analysis and machine intelligence 15 (9), 850–
863.
Koffka, K., 2013. Principles of Gestalt psychology. Vol. 44. Routledge.
Kwitt, R., Uhl, A., 2008. Image similarity measurement by kullback-leibler divergences
between complex wavelet subband statistics for texture retrieval. In: Image Processing, 2008. ICIP
2008. 15th IEEE International Conference on. IEEE, pp. 933–936.

80
Lee, J.-H., Yeh,W.-C., Chuang, M.-C., 2015.Web page classification based on a simplified
swarm optimization. Applied Mathematics and Computation 270, 13–24.
Li, M., Chen, X., Li, X., Ma, B., Vit anyi, P. M., 2004. The similarity metric. IEEE
transactions on Information Theory 50 (12), 3250–3264.
Liu, H. X.,Wu, B., Liu, Y., Huang, M., Xu, Y. F., 2013. A discussion on printing color
difference tolerance by ciede2000 color difference formula. In: Applied Mechanics and Materials.
Vol. 262. Trans Tech Publ, pp. 96–99.
Liu, Z., Lagani`ere, R., 2007. Phase congruence measurement for image similarity
assessment. Pattern Recognition Letters 28 (1), 166–172.
Luo, M. R., Cui, G., Rigg, B., 2001. The development of the cie 2000 colour-difference
formula: Ciede2000. Color Research & Application 26 (5), 340–350.
McCallum, A., Nigam, K., et al., 1998. A comparison of event models for naive bayes text
classification. In: AAAI-98 workshop on learning for text categorization. Vol. 752. Madison, WI,
pp. 41–48.
M uller-Molina, A. J., Hirata, K., Shinohara, T., 2008. A tree distance function based on
multi-sets. In: Pacific-Asia Conference on Knowledge Discovery and Data Mining. Springer, pp.
87–98.
Onan, A., 2016. Classifier and feature set ensembles for web page classification. Journal
of Information Science 42 (2), 150–165.
Refaeilzadeh, P., Tang, L., Liu, H., 2009. Cross-validation. In: Encyclopedia of database
systems. Springer, pp. 532–538.
Rohlfing, T., 2012. Image similarity and tissue overlaps as surrogates for image registration
accuracy: widely used but unreliable. IEEE transactions on medical imaging 31 (2), 153–163.
Roshanbin, N., Miller, J., 2011. Finding homoglyphs-a step towards detecting unicode-
based visual spoofing attacks. Web Information System Engineering–WISE 2011, 1–14.
Saar, T., Dumas, M., Kaljuve, M., Semenenko, N., 2016. Browserbite: cross-browser
testing via image processing.
Software: Practice and Experience 46 (11), 1459–1477.
Sampat, M. P., Wang, Z., Gupta, S., Bovik, A. C., Markey, M. K., 2009. Complex wavelet
structural similarity: A new image similarity index. IEEE transactions on image processing 18 (11),
2385–2401.
Shahbazi, A., Miller, J., 2014. Extended subtree: a new similarity function for tree
structured data. IEEE Transactions on knowledge and Data Engineering 26 (4), 864–877.
81
Sharma, G., Wu, W., Dalal, E. N., 2005. The ciede2000 color-difference formula:
Implementation notes, supplementary test data, and mathematical observations. Color Research &
Application 30 (1), 21–30.
Stevenson, H., 2012. Emergence: The gestalt approach to change. Unleashing Executive
and Orzanizational Potential. Retrieved 7.
Tai, K.-C., 1979. The tree-to-tree correction problem. Journal of the ACM (JACM) 26 (3),
422–433.
Terwijn, S. A., Torenvliet, L., Vit anyi, P. M., 2011. Nonapproximability of the normalized
information distance. Journal of Computer and System Sciences 77 (4), 738–742.
Wei, Y., Wang, B., Liu, Y., Lv, F., 2014. Research on webpage similarity computing
technology based on visual blocks. In: Chinese National Conference on Social Media Processing.
Springer, pp. 187–197.
Xu, Z., Miller, J., 2016. Identifying semantic blocks in web pages using gestalt laws of
grouping. World Wide Web. 19 (5), 957–978.
Zhai, Y., Liu, B., 2006. Structured data extraction from the web based on partial tree
alignment. IEEE Transactions on Knowledge and Data Engineering 18 (12), 1614–1628. 12

82
CHAPTER 4 Cross-Browser Differences
Detection based on an Empirical Measurement for
Web Page Visual Similarity6
Abstract
This chapter aims to develop a method to detect visual differences introduced into
web pages when they are rendered in different browsers. To achieve this goal, we propose
an empirical visual similarity measurement by mimicking human mechanisms of
perception. The Gestalt laws of grouping are translated into a computer compatible rule
set. A block tree is then parsed by the rules for similarity calculation. During the translation
of the Gestalt laws, experiments are performed to obtain measurements for proximity, color
similarity, and image similarity. After a validation experiment, the empirical measurement
is employed to detect cross-browser differences. Experiments and case studies on the
world’s most popular web pages provide positive results for this methodology.
Keywords: Block Tree; Extended Subtree; Gestalt Laws of Grouping; Web Page Visual
Similarity; Cross-Browser Differences Detection.
1 Introduction
Web applications, with web browsers as their carriers, have become an
indispensable part of our life today. While we enjoy the convenience that different web
6 Xu, Zhen, and James Miller. “Cross-Browser Differences Detection based on an Empirical Measurement for Web Page Visual Similarity”. ACM Transactions on Internet Technology (in review).

83
browsers bring to us, we also face the problems that web pages are rendered differently
across different web browsers. Cross-browser visualization issues, therefore, become
prevalent, which affects user experience. In addition, they also cause maintenance issues
for web designers.
Cross-browser issues refer to cross-browser incompatibilities, which are
differences in a web page’s appearances (i.e., visual features) or behaviors, or both, when
it is displayed on different browsers (Choudhary, et al. 2013). This chapter will focus on
the appearances of web pages. The first step (details can be found at Xu and Miller, 2015b)
is to remove the invisible elements and CSS attributes of the web page from its DOM tree.
The remaining visible elements are then grouped into different blocks by the Gestalt laws
of grouping to finally construct “the block tree”. The Gestalt laws of grouping are originally
used in psychology to account for people’s tendency of perceiving various objects as
organized together (Wolfe et al. 2009; Banerjee 1994). In the second step, we propose an
empirical visual similarity measurement to detect how similar (or different) a specified web
page is, when it is rendered in two different browsers. The major contributions of this
chapter include:
1) it provides a numerical mechanism to translate the Gestalt laws of grouping into a
set of computer-compatible rules;
2) it presents a novel data structure to represent web page visual information;
3) it develops an empirical measurement to evaluate web page visual similarity; and
4) it applies the empirical measurement to detect cross-browser differences.
The remainder of this chapter is organized as follows: Section 2 investigates the
empirical translation of the Gestalt laws of grouping; Section 3 introduces an empirical

84
measurement for evaluating the visual similarity between web pages; Section 4 conducts
experiments on detecting cross-browser differences. Section 5 reviews recent work; and
Section 6 draws conclusions from the presented work.
2 Translating Algorithm of the Gestalt Laws of
Grouping
2.1 Motivations and Goals
The Gestalt laws of Grouping illustrate how people perceive objects. In this section,
we attempt to translate these laws into a format that a computer can process within the
domain of web pages. It should be noted that this task is significantly different from, and
easier than, parallel efforts to translate these laws for general image processing applications.
Analyzing the screenshot image of a web page will contain significant noise components,
whereas using the DOM tree is effectively noise free. This is because the DOM tree stores
actual content (such as text or videos) while screenshot image stores color values of each
pixel. Also, the DOM tree includes the hierarchical information, thus relationships among
different content components is preserved. It is argued that utilizing the actual content
components and their relationships is essential to producing an accurate solution.
The original Gestalt laws of grouping include eight items (each item represents a
single law), i.e., the Gestalt laws of (a) simplicity, (b) closure, (c) proximity, (d) similarity,
(e) continuity, (f) common fate, (g) symmetry, and (h) past experience (Stevenson 2012;
Koffka 2013). In the context of web page similarity, the Gestalt laws of symmetry and the
Gestalt laws of past experience are not employed. This is because the former considers
symmetric elements that are in widely scattered locations (which are very rare in web

85
pages), and the latter refers to higher level of human perceptions (i.e., it requires knowledge
that is beyond the scope of web page analysis). Hence, we focus here on the remaining six
laws.
2.2 Translating the Gestalt Law of Simplicity
The Gestalt law of simplicity states that people tend to break down content into the
simplest units when reading a web page. Although a web page can be split as small as a
single pixel, we will not follow this method. This is because when we read the page, we
focus on useful information such as a single image or a piece of text instead of pixels. The
useful information corresponds to the DOM elements of a web page.
Taking the home page of the IEEE (https://www.ieee.org/index.html) as an
example, the logo contains three parts: the diamond figure, the big bold “IEEE”, and the
phrase under them. Despite having different types and styles, they are considered as a
single group rather than three unrelated items; this simplifies the process of reading and
understanding. Based on this observation, we define DOM elements as the smallest units
that cannot be further split during the process of web page analysis.
2.3 Translating the Gestalt Law of Closure
The Gestalt law of closure indicates that upper elements of a web page will cover
lower elements, however, humans are prone to regard the lower elements as complete
rectangles even if they are partially covered. Our brain fills the hole that is blocked by the
upper elements. Use the home page of Facebook (https://www.facebook.com/) as the
example, the login boxes cover the right part of the top ribbon, which makes the latter
incomplete. Even though, we still perceive the ribbon as complete. According to this

86
observation, we treat each element as a full rectangle during the process of web page
analysis. This also makes the representation much easier and thus is consistent with the
Gestalt law of simplicity and human visual systems.
2.4 Translating the Gestalt Law of Proximity
The Gestalt law of proximity argues that we tend to put close elements of a web
page into the same group and assign distant elements into different groups. Considering
the home page of Facebook again, we perceive the two login boxes as related (regarded as
a group), the five boxes regarding signup are related (regarded as a second group), and the
three boxes under the “Birthday” are also related (regarded as a third group). However, any
two elements in different groups are not related according to their distance relationships.
(The words proximity and distance are used interchangeable in this chapter.) For a series
of sibling elements, we calculate the proximity between every two adjacent elements. Then
we group the adjacent elements together if their proximities are the same and split them
into different groups otherwise. In order to find an appropriate mechanism to calculate the
proximity of elements, we will investigate and compare available proximity calculation
candidates documented in the literature.
2.4.1 Proximity Candidates
Two intuitive measurements for the proximity of rectangular objects are the
centroid distance (CD) and the gap distance (GD). CD is the Euclidean distance between
the centroids of the two rectangles; and GD denotes the distinct orthogonal distance
between the four sides of them.
𝐶𝐷(𝑁1, 𝑁2) = √(𝑥1 − 𝑥2)2 + (𝑦1 − 𝑦2)2 , (4-1)

87
𝐺𝐷(𝑁1, 𝑁2) = max{𝑆𝐺𝑁1,2h × 𝑑𝑖𝑠𝑡1,2
h , 𝑆𝐺𝑁1,2v × 𝑑𝑖𝑠𝑡1,2
v } , (4-2)
where 𝑁1 and 𝑁2 are the two rectangles; ( 𝑥1 , 𝑦1 ), and ( 𝑥2 , 𝑦2 ) are the respective
coordinates of the centroids of 𝑁1 and 𝑁2 ; 𝑑𝑖𝑠𝑡1,2v and 𝑑𝑖𝑠𝑡1,2
h represent the distance
between the closest vertical and horizontal sides of 𝑁1 and 𝑁2, respectively; and 𝑆𝐺𝑁1,2v
and 𝑆𝐺𝑁1,2h represent the corresponding signs. The parameters of GD are calculated
through:
𝑆𝐺𝑁1,2h = {
1, |𝑥1 − 𝑥2| > (𝑤𝑖𝑑𝑡ℎ1 + 𝑤𝑖𝑑𝑡ℎ2) 2⁄
−1, otherwise ;
𝑆𝐺𝑁1,2v = {
1, |𝑦1 − 𝑦2| > (ℎ𝑒𝑖𝑔ℎ𝑡1 + ℎ𝑒𝑖𝑔ℎ𝑡2) 2⁄
−1, otherwise ;
𝑑𝑖𝑠𝑡1,2h = min{|𝑙𝑒𝑓𝑡1 − 𝑙𝑒𝑓𝑡2|, |𝑙𝑒𝑓𝑡1 − 𝑟𝑖𝑔ℎ𝑡2|, |𝑟𝑖𝑔ℎ𝑡1 − 𝑙𝑒𝑓𝑡2|, |𝑟𝑖𝑔ℎ𝑡1 − 𝑟𝑖𝑔ℎ𝑡2|} ;
𝑑𝑖𝑠𝑡1,2v = min{|𝑡𝑜𝑝1 − 𝑡𝑜𝑝2|, |𝑡𝑜𝑝1 − 𝑏𝑜𝑡𝑡𝑜𝑚2|, |𝑏𝑜𝑡𝑡𝑜𝑚1 − 𝑡𝑜𝑝2|, |𝑏𝑜𝑡𝑡𝑜𝑚1 −
𝑏𝑜𝑡𝑡𝑜𝑚2|} .
However, these two distance measurements may lead to an inconsistent situation.
For example, as shown in Figure 4.1a, the left two large rectangles are close to each other,
and the right two small ones are more distant in the perceptual perspective. However, the
calculated CDs of the two pairs are actually the same. Similar problem happens for GD, as
shown in Figure 4.1b.
This issue is owing to the dimensions of the two nodes being ignored. Therefore,
an appropriate measurement should take size (i.e. width and height of the rectangle) into
account. The Hausdorff distance (HD) satisfies this requirement (Huttenlocher et al. 1993).
It denotes the maximum value of all distances from any point in one node to its nearest
point in the other node, as shown in (4-3):

88
𝐻𝐷(𝑁1, 𝑁2) = max{ℎ𝑑1,2, ℎ𝑑2,1} = max { sup𝑛1∈𝑁1
inf𝑛2∈𝑁2
‖𝑛1 − 𝑛2‖ , sup𝑛2∈𝑁2
inf𝑛1∈𝑁1
‖𝑛2 − 𝑛1‖} ,(4-3)
where 𝐻𝐷(𝑁1, 𝑁2) is the HD between 𝑁1 and 𝑁2 ; ℎ𝑑1,2 is the HD from 𝑁1 to 𝑁2 ;
‖𝑛1 − 𝑛2‖ calculates the Euclidean distance between two points 𝑛1 and 𝑛2; sup and inf
calculate the maximum and minimum value of a given set, respectively.
Figure 4.1 Contradictions between Calculation Distances and Perceptual Distances
As shown in Figure 4.1c, although HD reflects size of rectangles, it fails to
eliminate the inconsistency issues of CD and GD, Therefore, we choose the fourth
candidate, which is the normalized version of HD – the relative Hausdorff distance (RHD).
It is calculated by (4-4):
𝑅𝐻𝐷(𝑁1, 𝑁2) = max {ℎ𝑑1,2
𝑟𝑑1,
ℎ𝑑2,1
𝑟𝑑2} , (4-4)
where 𝑟𝑑1 and 𝑟𝑑2 are the relative dimensions that act as normalizing factors. The detail
of calculation can be found at (Xu and Miller 2015a).
2.4.2 Experiment and Discussion
The experiment focuses on proximity’s influence on people’s visual perception, so
we minimize other influencing factors (such as similarity and continuity) by controlling
these parameters. Specifically, we create eight rectangles, the sizes and content of which
(b) Gap Distance (a) Centroid Distance (c) Hausdorff
Distance

89
are randomly generated but kept the same. Meanwhile, the rectangles are evenly distributed
and kept close to each other, so that the edge distances between adjacent rectangles are
smaller than their dimensions. Consequently, all of them can be considered as one group.
Second, the edge distance between the fourth and the fifth elements increases continuously
while those of the remaining adjacent elements remain unchanged. Five volunteers were
requested to observe the changing scenario, and to record when the eight rectangles were
split into two groups, specifically between the fourth and the fifth rectangles, based on their
perception. The values of the four proximity candidates are calculated and logged.
Each volunteer repeated the above test 100 times. The difference between the
increased and the original values of a good proximity measurement should reflect the
threshold of the volunteer’s visual perception, i.e., it needs to be constant during the 100
tests. The differences of the four proximity candidates (∆𝐶𝐷, ∆𝐺𝐷, ∆𝐻𝐷 and ∆𝑅𝐻𝐷) are
illustrated in Figure 4.2. In the experiment, ∆𝐶𝐷, ∆𝐺𝐷 and ∆𝐻𝐷 are exactly the same
according to their formulas, because all the rectangles are exactly the same in dimension
and left-aligned. Therefore, in Figure 4.2, their corresponding curves coincide.
Table 4.1 shows the details of the comparison results. In the table, ∆𝐶𝐷, ∆𝐺𝐷,
∆𝐻𝐷, and ∆𝑅𝐻𝐷 are denoted as 1, 2, 3, and 4, respectively. The variances of ∆𝐶𝐷, ∆𝐺𝐷
and ∆𝐻𝐷 from all the 100 tests are all above 0.06, while the variances of ∆𝑅𝐻𝐷 are all
bellow 0.002. Consequently, we conclude that RHD provides the best performance as a
proximity estimation.

90
Figure 4.2 The Distribution of Proximity Candidate Comparison Results
As is stated above, the translation of the Gestalt law of proximity aims to group
elements together if their distances with adjacent elements are exactly the same. However,
the experimental results show that the mean of all the RHD values from the five volunteers
is approximately 0.05. Therefore, during the translation, we define “same” as ∆𝑅𝐻𝐷 <
0.05, i.e., if the value of ∆𝑅𝐻𝐷 is less than 0.05, we regard the two proximities as the same.
Table 4.1 Proximity Candidate Comparison Results
Volunteer 1 2 3 4 5
1, 2, 3 4 1, 2, 3 4 1, 2, 3 4 1, 2, 3 4 1, 2, 3 4
Maximum 6 0.0806 7 0.0986 6 0.0789 8 0.1012 8 0.1012
Minimum 2 0.0253 2 0.0290 2 0.0322 2 0.0298 2 0.0322
Mean 3.54 0.0541 3.81 0.0568 3.61 0.0562 3.62 0.0552 3.47 0.0524
Variance 0.6884 0.0001 1.3739 0.0002 0.8379 0.0001 1.1556 0.0002 0.9291 0.0001

91
2.5 Translating the Gestalt Law of Similarity
Different elements in a web page are displayed in various styles; however, the
Gestalt law of similarity reveals that we tend to perceive similar elements as related. This
law compares elements by all their visual features such as background colors/images,
textual styles and paragraph styles, which are represented by a series of CSS properties.
Generally, most CSS properties can be compared directly by their values. For example,
two textual elements with “font-style” both being “italic” are considered as
similar and as different from a third textual element with the same CSS property being
“normal”. When a CSS property contains colors or images (e.g. “background”,
“border-color”, “list-style-image”), it is not accurate for them to be compared
in this way. This is because the value of a color can be either the RGB value (e.g.
“rgb(255, 255, 255)” or “#FFFFFF”) or the color name (e.g. “white”). Both of
them can refer to the same color; however, the string values are not the same. For accuracy,
we compare the actual colors and images directly.
2.5.1 Empirical Comparison of Colors.
Most web pages describe colors utilizing the RGB space, so the direct way for
comparing two colors is by comparing their color difference under the RGB color space.
Riemersma (2008) exploits the weighted Euclidean distance as the color difference for the
RGB color space.
∆𝐶(𝐶1, 𝐶2) = √(2 +��
256) (𝑟1 − 𝑟2)2 + 4(𝑔1 − 𝑔2)2 + (2 +
255−��
256) (𝑏1 − 𝑏2)2 ,(4-5)

92
where 𝐶1 and 𝐶2 are the two colors; 𝑟, 𝑔 and 𝑏 are the values of a color’s red,
green and blue channels, respectively; and �� = (𝑟1 + 𝑟2) 2⁄ is the mean value of
the red channels.
An alternative color space is CIELAB, which has a wider gamut that covers all
RGB colors. Meanwhile, compared with the RGB color model designed for display devices,
the CIELAB model is designed to mimic human vision. Color differences in this space, the
∆𝐸0012, are calculated by (4-6) (Luo et al. 2001). The parameter list is omitted in this chapter
for brevity, but can be found in (Luo et al. 2001).
∆𝐸0012 = √(
∆𝐿′
𝑘𝐿𝑆𝐿)
2
+ (∆𝐶′
𝑘𝐶𝑆𝐶)
2
+ (∆𝐻′
𝑘𝐻𝑆𝐻)
2
+ 𝑅𝑇 (∆𝐶′
𝑘𝐶𝑆𝐶) (
∆𝐻′
𝑘𝐻𝑆𝐻) . (4-6)
Due to the respective merits of the two color spaces, we design experiments to test which
color space has a better color difference measurement in terms of distinguishing colors for
human perception when utilized in web pages. The empirical threshold for the better color
difference is determined by the experiments. The experiment consists of 50 rounds of tests
with each round including two groups of comparison. In each group, 100 pairs of random
colors are generated. The first group lists the 100 pairs by ∆𝐶, and the second group lists
them by ∆𝐸0012. We record both: (a) the first pair of colors that is distinguishable (by a
human test subject) in each group; and, (b) the corresponding color difference.
The experiment is repeated five times, and the results are shown in Table 4.2 and Figure
4.3. As can be seen in this table that the values of ∆𝐸0012 vary from 4.03 to 5.35 with a
variance being smaller than 0.1; and the values of ∆𝐶 fluctuate from 22.44 to 61.24 with a
variance being at least 63.90. The variance of ∆𝐸0012 is smaller than 0.1 while that of ∆𝐶 is
larger than 60, meaning that the former is more stable. Therefore, ∆𝐸0012 is more

93
distinguishable than ∆𝐶 for our human volunteers, and thus we select ∆𝐸0012 as the color
difference metric and set its mean value as the threshold, which is 4.65.
Table 4.2 Color Comparison Results
Repetition 1 2 3 4 5
∆𝐸0012 ∆𝐶 ∆𝐸00
12 ∆𝐶 ∆𝐸0012 ∆𝐶 ∆𝐸00
12 ∆𝐶 ∆𝐸0012 ∆𝐶
Maximum 5.06 57.70 5.15 61.24 5.15 57.48 5.35 57.50 5.05 56.05
Minimum 4.06 23.31 4.04 25.05 4.03 22.44 4.05 24.09 4.16 24.60
Mean 4.56 41.80 4.62 43.82 4.65 39.66 4.73 36.68 4.69 39.49
Variance 0.07 72.44 0.09 75.37 0.08 63.90 0.05 81.70 0.06 94.09
Figure 4.3 Distributions of Color Comparison Results
2.5.2 Empirical Comparison of Images
An image from a web page can be represented in several different ways: (a) a
general file object that is a series of binaries; (b) a mathematical sample that is a series of
numeric values; and (c) a general image that is a series of pixels.

94
When the image is treated as a file object, the similarity between two images can
be estimated by the normalized compression distance (NCD), (Li et al. 2004),
𝑁𝐶𝐷(𝐼1, 𝐼2) =𝐶(𝐼1𝐼2)−min {𝐶(𝐼1),𝐶(𝐼2)}
max {𝐶(𝐼1),𝐶(𝐼2)} , (4-7)
where, 𝐼1 and 𝐼2 are the two images, with are each represented as an array of pixel colors;
𝐼1𝐼2 is the concatenation of 𝐼1 and 𝐼2; and 𝐶(𝑥) calculates the compressed length of 𝑥. If
the two images are the same, then their NCD is 0.0; and if they are completely different,
the value is 1.0. Due to the performance of the current generation of compressors, errors
are inevitable when calculating NCD. That is, NCD is sensitive to the selection of the
compressor. The higher the performance of a compressor, the more accurate the result.
Therefore, we adopt the LZMA algorithm as recommended in several previous papers
(Chen et al. 2010; Claude et al. 2010). (Specifically, we utilized LZMA2, which is superior
to LZMA when compressing already compressed data such as JPEG).
If we treat an image as a mathematical sample, then the similarity can be calculated
mathematically as the mean square error (MSE) (Hore and Ziou 2010).
𝑀𝑆𝐸(𝐼1, 𝐼2) =1
𝑁∑ (𝑖𝑥
1 − 𝑖𝑥2)2𝑁
𝑥=1 , (4-8)
where 𝑁 equals to the size of 𝐼1 and 𝐼2 (that is, 𝑤𝑖𝑑𝑡ℎ × ℎ𝑒𝑖𝑔ℎ𝑡); 𝑖𝑥1 and 𝑖𝑥
2 refer to the
color values of pixels in 𝐼1 and 𝐼2, respectively.
To deal with a general image, the structural similarity index (SSIM) can be applied,
which is designed for digital image comparison in order to imitate human perception

95
(Koffka 2013). The value of SSIM for two identical images is 1.0, and for two completely
different images is -1.0. SSIM is calculated via (4-9),
𝑆𝑆𝐼𝑀(𝐼1, 𝐼2) =(2𝜇1𝜇2+𝑐)(2𝜎1,2+𝑑)
(𝜇12+𝜇2
2+𝑐)(𝜎12+𝜎2
2+𝑑) , (4-9)
where 𝜇1 and 𝜇2 are the mean of 𝐼1 and 𝐼2, respectively; 𝜎12 and 𝜎2
2 are the variances of
𝐼1 and 𝐼2, respectively; and, 𝑐 and 𝑑 are two variables to stabilize the division with the
denominator.
This experiment evaluates the aforementioned three measurements and aims at
finding the best one for image similarity. We choose the McGill calibrated color image
database (Olmos and Kingdom 2004) as the test pool to conduct a 10-round-comparison.
This database provides over 1500 images. These images are colorful natural and manmade
scenes – stored in tif format and 72 dpi resolution – such as animals, foliage, fruits, and
land water, which cover almost all the themes we see in web pages. During each round, 10
pairs of similar images (i.e., 20 images) are randomly selected from the test pool to build
up the test set. 20 images can make (202
) = 190 pairs of images (i.e., 190 comparisons).
Among them, the preselected 10 pairs of similar images are marked as the first 10 pairs,
and the remaining 180 pairs are randomly marked as the 11 to 190 pairs (i.e., last 180 pairs).
All the 190 pairs of images are evaluated by the three measurements respectively.
In Figure 4.4, two groups of box plots are drawn for each round, where group 1
shows the first 10 pairs and group 2 shows the remaining 180 pairs. All of the 10 rounds
(each sub-figure represents a round) reveal similar result patterns. Qualitatively, the MSE
values of group 1 in any round are not distinguishable from group 2, so it cannot be a useful

96
measurement. Regarding the NCD results, although the values of the first 10 pairs are
generally smaller than that of the last 180 pairs, they are too close to be distinguished, i.e.
approximately 0.02 between the minimum and the maximum. Therefore, it is difficult to
determine a threshold to divide the two groups apart. With respect to SSIM, there is a clear
separation (i.e., the horizontal dashed line as shown) in each sub-figure to allow an accurate
division between the two groups. As a result, among the three methods, only SSIM is
capable of distinguishing between similar pages and dissimilar pages, and the empirical
threshold is set to the overall mean value, which is 0.48.
Quantitatively, the minimal, maximal, and mean values of MSE, NCD, and SSIM
are illustrated in Table 4.3. For MSE and NCD, the value range (i.e., the values between
the minimum and the maximum) of the first 10 pairs crosses with that of the last 180 pairs.
In contrast, there is no common part between the value ranges of SSIM’s first 10 pairs and
the last 180 pairs. This, again, proves that only SSIM among the three is able to distinguish
the similar and the dissimilar of image pairs. Therefore, we select SSIM as the
measurement to calculate web page similarity. Furthermore, for SSIM, the smallest value
of the first 10 pairs is 0.5050, and the largest value of the last 180 pairs is 0.4504; therefore,
we pick their overall mean (i.e., 0.4755) as the threshold to distinguish between similar and
dissimilar images.

97
Figure 4.4 Distributions of Image Comparison Results
Table 4.3 Image Comparison Results
MSE NCD SSIM
Group 1 Group 2 Group 1 Group 2 Group 1 Group 2
Minimum 36.8994 86.7609 0.9722 0.9894 0.5050 0.0476
Maximum 311.8292 421.2648 0.9999 0.9999 0.8397 0.4504
Mean 162.4931 206.7298 0.9927 0.9989 0.5920 0.2105
2.6 Translating the Gestalt Law of Continuity
The Gestalt law of continuity expresses that people tend to judge the elements on a
web page as related in a situation where they are aligned, and as dissimilar when they are
not aligned. In other words, this law refers to the geometrical alignment. By default, the
browser places elements in a justified manner. If certain elements are not justified with

98
others, it indicates that they are not related. In this case, the designers have separated them
deliberately.
As shown in the example of Amazon’s home page (Figure 4.5), the paragraphs in
the blue rectangle (“Get to Know Us”, “Careers”, “About Amazon”, etc.) are left aligned,
indicating they are related content. In general, to evaluate continuity, we compare the left,
top, right, and bottom coordinates of two elements. If any of the four coordinates of two
elements are the same, we conclude that they are related; and that they are dissimilar
otherwise.
Figure 4.5 Home Page of Amazon
2.7 Translating the Gestalt Law of Common Fate
The Gestalt law of common fate describes that during the process of web page
loading, elements in a web page can have different motion trends, and people’s tendency
is to regard elements with the same motion trend as related. When the page is loaded, most

99
web page content does not move during the load operation. However, if the reader scrolls
up and down the page, all nodes will move by default. In some situations, there are elements
that do not move with scrolling pages, under this situation, we believe these elements have
different motion trends and as such that we treat them as dissimilar. This motion trend is
controlled by the CSS property “position”, therefore translation of this law will compare
the corresponding values of DOM elements for merging determination.
Taking the home page of Amazon in Figure 4.5 again as the example, when the page
is scrolled, the search bar (marked by the red rectangle) is always hanging at the top, but
other content moves accordingly. Under this circumstance, we tend to think of the search
bar and the other content as dissimilar.
With the DOM tree of a web page as the raw input, the translated Gestalt laws
constructs the block tree by removing all invisible elements and merging semantically
related elements into blocks, as shown in Figure 4.6. This data structure, the block tree that
contains all visual information of a web page, is used for visual similarity evaluation and
cross-browser difference detection. Efficiency of the block tree is discussed in (Xu and
Miller, 2015a), where it is utilized as part of a web page segmentation algorithm
empirically shown to outperform VIPS.
Figure 4.6 Translation of Gestalt Laws of Grouping

100
3 The Empirical Visual Similarity Measurement
The similarity between two block trees can be decided by the tree edit distance
(TED) (Pawlik and Augsten 2015). To calculate TED, the first step is to determine their
mapping relationship. If we post-order traverse all the nodes of a tree, then the mapping
relationship between nodes of two trees is restricted to the following three rules:
1) one-to-one rule: any node in one tree can map to one and only one node in the other
tree;
2) horizontal-order preserving rule: the (post-order-traversal) order of two sibling
nodes in one tree is always the same with the order of the mapped nodes in the other
tree;
3) vertical-order preserving rule: if two nodes are parent and child in one tree, then
their mapped nodes in the other tree must still be parent and child.
Note that a node in one tree may not be mapped to any node in the other tree. After
obtaining the mapping relationship, one of the following three types of edit operations is
determined. (1) if a node from the first tree does not map to any node in the second tree, it
is removed when the first tree is transformed to the second tree. (2) if a node from the
second tree does not map to any node in the first tree, it is added. (3) if a node from the
first tree maps to a node in the second tree, but the two mapped nodes have different content,
then the node in the first tree is relabeled. If the two mapped nodes have the same content,
then there is no edit operation during the transformational process. The value of TED
between the two trees refers to the number of edit operations required to transform one tree
to the other.

101
3.1 The Extended Subtree
The edit distance of the corresponding two block trees denotes the visual similarity
between two web pages. However, directly using TED as the visual similarity measurement
is not sufficient. First, it calculates the absolute distance between two trees, which is unable
to precisely reveal the similarity of two trees. Consider the situation of two comparisons
where one compares two 1000-node trees and the other compares two 10-node trees. If the
TED values under the two comparisons are both 10, the proportions of changed nodes are
1% and 100%, respectively. It is obvious that the smaller the proportion, the more similar
the two trees. Second, when we read web pages, we do not read only the detail of a single
block. Instead, we read the sub tree of each block. This is because in a web page, all the
descendants of a block (if exist) are placed above the block, thus the visible part of that
block is actually the sub tree. Therefore, a TED measurement, which maps single nodes
instead of sub trees, is not precise.
To solve these problems, we employ the extended subtree similarity (EST)
(Shahbazi and Miller 2014) to reflect the visual similarity between two block trees. This
model normalizes the TED, with similarity ranging from 0.0 to 1.0, regardless of the sizes
of the two trees. Particularly, 1.0 and 0.0 denote if two trees are identical or completely
different, respectively. Furthermore, the EST model maps sub trees instead of tree nodes,
which can be achieved by the new mapping rules (Shahbazi and Miller 2014):
1) sub tree mapping: EST maps both sub trees and single nodes;
2) one-time mapping: once two sub trees are mapped, the common sub trees of them
are not allowed to be mapped again;

102
3) sub tree weight assignment: the weight of a map equals to the mean value of the
two mapped sub trees’ weights, and a sub tree’s weight equals to the number of
nodes it has.
The EST similarity of two block trees X and Y is calculated by (4-10):
𝑆∗(𝑋, 𝑌) =√∑ 𝛽𝑘×𝑊(𝑚𝑘)𝛼
𝑚𝑘∈𝑀𝛼
𝑚𝑎𝑥(|𝑋|,|𝑌|) , (4-10)
where, |𝑋| and |𝑌| represents the numbers of nodes in 𝑋 and 𝑌; 𝑊(𝑚𝑘) is the weight of a
mapping 𝑚𝑘; 𝛼 is a coefficient that adjusts the relation among mappings according to their
sub tree sizes; and 𝛽𝑘 is a geometrical parameter reflecting the importance of 𝑚𝑘 with
respect to the position of 𝑘 in 𝑋 and 𝑌. 𝛽𝑘 = 1 when the node 𝑥𝑘 and 𝑦𝑘 have the same
depth in 𝑋 and 𝑌, otherwise 𝛽𝑘 = 𝛽0, which equals to a constant within the range of (0,1).
Figure 4.7 shows an example of the method, with the visual incompatibility detection
and similarity estimation between the two trees X and Y being conducted as follows.
Figure 4.7 Example of the Visual Incompatibility Detection and Similarity Estimation
1) All the nodes from the two trees need to be attached with numbers. This numbering
scheme is done by post-order traversal. Therefore, the nodes b, c, a in Tree X are
denoted as 𝑥1, 𝑥2 and 𝑥3, and nodes d, b, c, a in Tree Y are denoted as 𝑦1, 𝑦2, 𝑦3
and 𝑦4, respectively.

103
2) All possible mapping relationship need to be located before further analysis. As
mentioned above, the mapping scheme considers subtrees instead of nodes, and
therefore, the final mapping results include 𝑚1 = {𝑥1} ↔ {𝑦2} (subtree of b,
marked by the blue rectangle), 𝑚2 = {𝑥2} ↔ {𝑦3} (subtree of c, marked by the
green rectangle), and 𝑚3 = {𝑥2, 𝑥3} ↔ {𝑦3, 𝑦4} (subtree of a-c, marked by the
yellow rectangle).
3) The mapping results are saved in two matrices 𝑀𝑥 and 𝑀𝑦, where each cell of the
matrices records the mapping relationship between the corresponding nodes. For
example, the subtree of a-c has the root node a, which is the 3rd node in X and the
4th node in Y. Hence, the grid in the 3rd row and 4th column of 𝑀𝑥 stores {𝑥2, 𝑥3},
and the grid in 4th row and 3rd column of 𝑀𝑦 stores {𝑦3, 𝑦4}. If the corresponding
nodes does not map, then the grid is an empty set.
4) Now the complement set of nodes from the mapping results indicates the visual
incompatibilities. In this case, the node d in Y – the corresponding content only
appears in the web page instance Y but not in X.
5) According to the one-time mapping rule, common subtrees are to be avoided in
order to construct the largest subtree mapping. Of all the mapped subtrees, 𝑥1 only
belongs to 𝑚1. Therefore, the first element of 𝐿𝑆𝑥 stores this mapping relationship,
denoted as (12). 𝑦1 does not belong to any mapping relationship, so the first element
of 𝐿𝑆𝑦 stores an empty set. Both 𝑥2 and 𝑥3 in X (also 𝑦3 and 𝑦4 in Y) belong to 𝑚3,
and herein, the 2nd and 3rd elements of 𝐿𝑆𝑥 (and the 3rd and 4th elements of 𝐿𝑆𝑦)
store this mapping relationship.
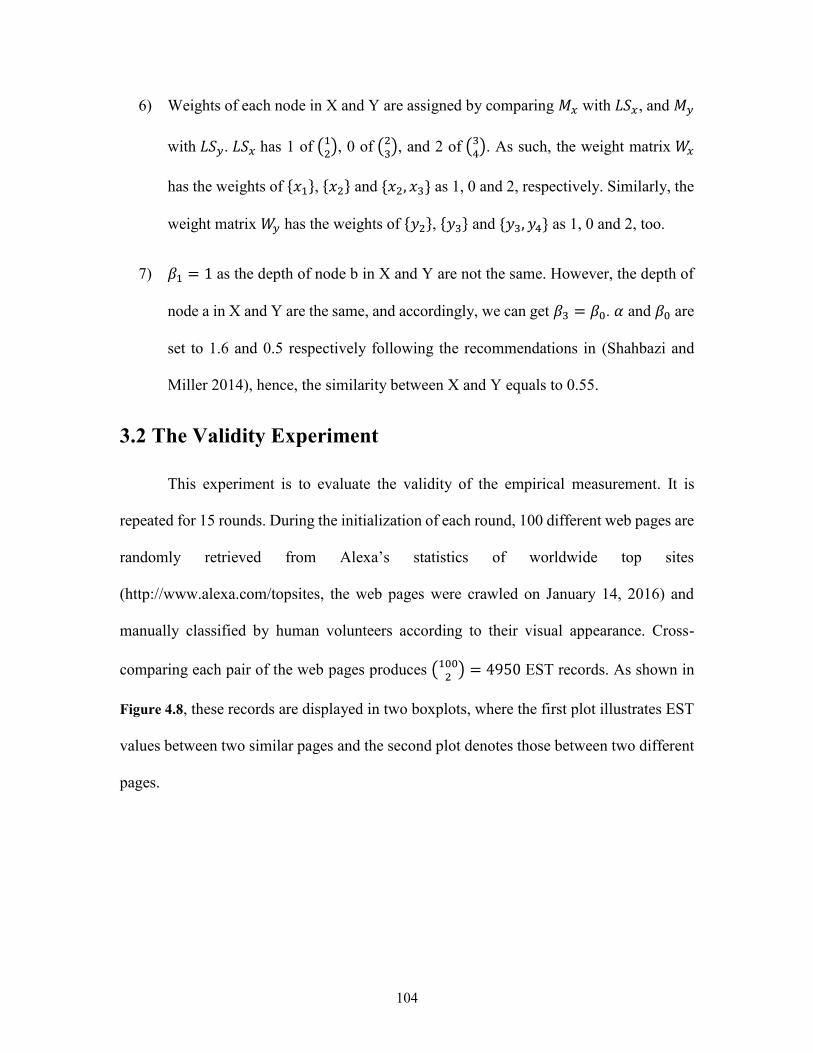
104
6) Weights of each node in X and Y are assigned by comparing 𝑀𝑥 with 𝐿𝑆𝑥, and 𝑀𝑦
with 𝐿𝑆𝑦. 𝐿𝑆𝑥 has 1 of (12), 0 of (2
3), and 2 of (3
4). As such, the weight matrix 𝑊𝑥
has the weights of {𝑥1}, {𝑥2} and {𝑥2, 𝑥3} as 1, 0 and 2, respectively. Similarly, the
weight matrix 𝑊𝑦 has the weights of {𝑦2}, {𝑦3} and {𝑦3, 𝑦4} as 1, 0 and 2, too.
7) 𝛽1 = 1 as the depth of node b in X and Y are not the same. However, the depth of
node a in X and Y are the same, and accordingly, we can get 𝛽3 = 𝛽0. 𝛼 and 𝛽0 are
set to 1.6 and 0.5 respectively following the recommendations in (Shahbazi and
Miller 2014), hence, the similarity between X and Y equals to 0.55.
3.2 The Validity Experiment
This experiment is to evaluate the validity of the empirical measurement. It is
repeated for 15 rounds. During the initialization of each round, 100 different web pages are
randomly retrieved from Alexa’s statistics of worldwide top sites
(http://www.alexa.com/topsites, the web pages were crawled on January 14, 2016) and
manually classified by human volunteers according to their visual appearance. Cross-
comparing each pair of the web pages produces (1002
) = 4950 EST records. As shown in
Figure 4.8, these records are displayed in two boxplots, where the first plot illustrates EST
values between two similar pages and the second plot denotes those between two different
pages.
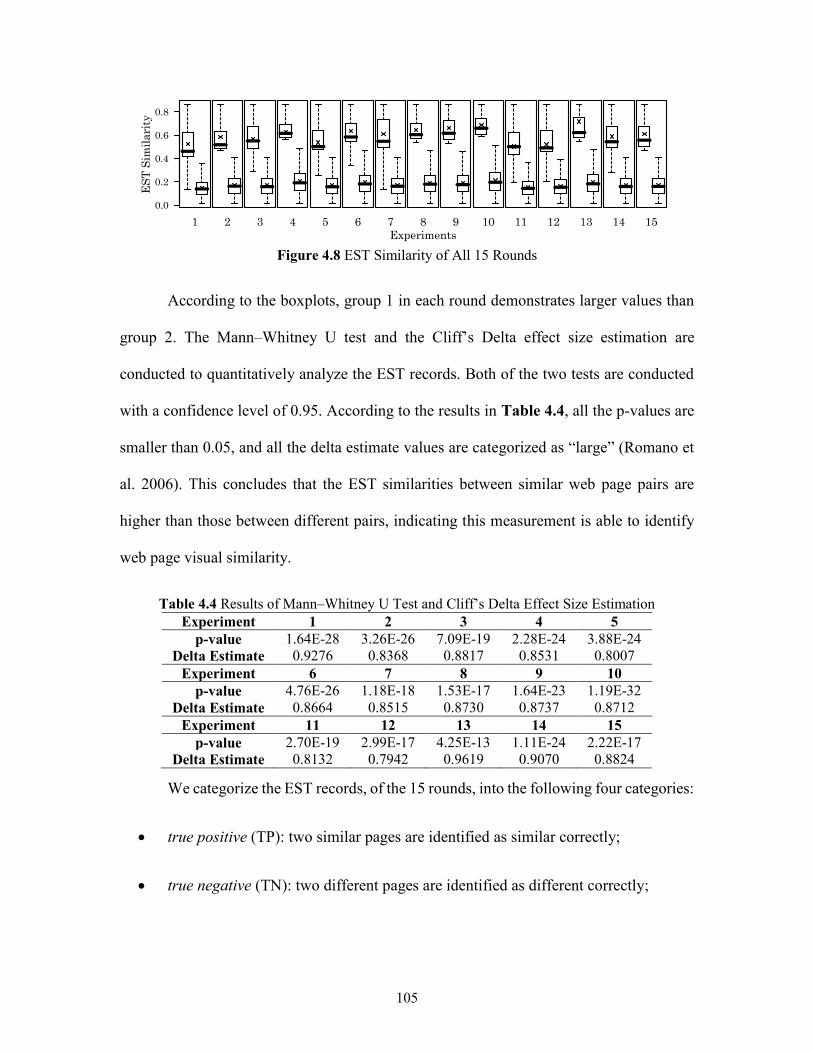
105
Figure 4.8 EST Similarity of All 15 Rounds
According to the boxplots, group 1 in each round demonstrates larger values than
group 2. The Mann–Whitney U test and the Cliff’s Delta effect size estimation are
conducted to quantitatively analyze the EST records. Both of the two tests are conducted
with a confidence level of 0.95. According to the results in Table 4.4, all the p-values are
smaller than 0.05, and all the delta estimate values are categorized as “large” (Romano et
al. 2006). This concludes that the EST similarities between similar web page pairs are
higher than those between different pairs, indicating this measurement is able to identify
web page visual similarity.
Table 4.4 Results of Mann–Whitney U Test and Cliff’s Delta Effect Size Estimation
Experiment 1 2 3 4 5
p-value 1.64E-28 3.26E-26 7.09E-19 2.28E-24 3.88E-24
Delta Estimate 0.9276 0.8368 0.8817 0.8531 0.8007
Experiment 6 7 8 9 10
p-value 4.76E-26 1.18E-18 1.53E-17 1.64E-23 1.19E-32
Delta Estimate 0.8664 0.8515 0.8730 0.8737 0.8712
Experiment 11 12 13 14 15
p-value 2.70E-19 2.99E-17 4.25E-13 1.11E-24 2.22E-17
Delta Estimate 0.8132 0.7942 0.9619 0.9070 0.8824
We categorize the EST records, of the 15 rounds, into the following four categories:
true positive (TP): two similar pages are identified as similar correctly;
true negative (TN): two different pages are identified as different correctly;

106
false positive (FP): the situation where two different pages are identified as similar
incorrectly; and
false negative (FN): two similar pages are identified as different incorrectly.
Five metrics based on the above four categories are investigated to find out the
optimal threshold, namely: precision (positive predictive value, PPV), negative predictive
value (NPV); recall (true positive rate, TPR), true negative rate (TNR), and accuracy
(Olson and Delen 2008). To be specific, PPV represents the ratio of similar page pairs
being correctly identified over all similar page pairs; while NPV reflects the proportion of
different page pairs being identified as different. Similarly, TPR denotes the ratio of similar
page pairs being correctly identified over all page pairs identified as similar; while TNR
refers to the fraction of different page pairs over all the identified different page pairs.
Accuracy is the ratio of correct identification to all identifications.
Figure 4.9 shows how the metrics vary according to the shift of the threshold. From
the left side figure, we can find that with the increase of the threshold, 0.40 is a turning
point of TP, FP, FN, and TN. Prior to this turning point, FP decreases significantly and TN
increases quickly; while after this point, TP has a sharp decrease and FP has a dramatic
increase. A similar pattern can be seen from the right side figure, too. This indicates that
0.40 is a best point for a threshold.

107
Figure 4.9 Performance of the Empirical Measurement on Different Thresholds
4 Detection of Cross-Browser Differences
The differences are detected by a series of experiments, where the EST similarity
value of each web page pair is calculated by comparing the corresponding block trees. A
static web page contains the same content for every loading, so the potential cross-browser
differences refer only to rendering style differences. However, due to many modern pages
having dynamic content, they change during every refreshing. Therefore, this dynamic
content should also be part of the detection targets.
In fact, there are two types of dynamic content: page-related content (for example,
weather status in a weather report page, or breaking news items in a newspaper page) and
advertisements. Although the first type is determined by the server side and cannot be
controlled by browsers, the second type is able to be filtered. Consequently, the
experiments are designed to proceed twice, where the first time is to evaluate the original
version of the web pages, and the second time is to test the ad-free version. During the
advertisement filtering in the second experiment, we employ “Adblock Plus” and

108
maximize its filter by enabling all its supported languages. We do not add any customized
filters.
4.1 Experimental Setups
The test sets of the two experiments use the same URL pool, which contains 1000
different records retrieved from Alexa’s top web sites (crawled on August 20th, 2016).
These web pages covered 360 different web sites, and the average number of pages per site
is 2.78. “bitauto.com” contains 31 pages in the pool, which is the largest number. 191 of
the 360 sites contribute only one page. The distribution is shown in Figure 4.10.
The first step of each experiment is the data retrieval. Two of the most popular
browsers, Google Chrome and Mozilla Firefox, are selected for cross-browser difference
detection, and they are further tested on both Linux and Windows platforms. Therefore,
there are four scenarios in each experiment, Chrome in Linux (CL), Chrome in Windows
(CW), Firefox in Linux (FL), and Firefox in Windows (FW). During the retrieval of each
scenario, we compose extensions compatible for the two browsers to parse the 1000 web
pages into a set of block trees. Specially, we set the browser’s inner window size to
1024×768 to eliminate potential side effects to the difference detection. Additionally,
Adblock Plus is enabled in the second experiment to filter any possible advertisements
from the original web pages. The four scenarios finally collect four sets of block trees for
each experiment.

109
Figure 4.10 Distribution of Test Cases
The second step is tree comparison. We cross-compare the corresponding block
trees of a web page by fixing either the browser or the platform. That is, by fixing the
browser, we will compare results in different platforms (i.e., CL vs. CW and FL vs. FW);
and by fixing the platform, we compare results in different browsers (i.e., CL vs. FL and
CW vs. FW).
Finally, we select the WebCompare algorithm (Alpuente and Romero 2009) as the
benchmark to test the performance of the proposed algorithm. This is because the
WebCompare algorithm (1) provides a compatible output; and, (2) can be considered as
the current state of the art. Many other algorithms were also considered as one of the
comparisons, but are finally removed from the experiments; the rationale for this decision
is discussed in Section 5.
4.2 Experimental Results
Figure 4.11 shows the distribution of EST and WebCompare similarity values for
each comparison scenario. Each bar in the histograms indicates the number of records that
is greater than or equal to the corresponding value as indicated in the x-axis, and each curve
shows the accumulate number of records that are less than the next value. For example, the
highest bar in the first chart shows that there are 450 EST values equal to “1.0”, and the

110
corresponding dot (the second dot from the right side) of the curve is 550 – the summation
of the two numbers is exactly 1000.
Figure 4.11 Distributions of the Experimental Results for Original Web Pages
According to the figure, the distribution of the four scenarios reveals the following
patterns: (a) All of the EST similarity values are greater than or equal to 0.75, and most of
them are greater than or equal to 0.9, indicating that the web pages are renderer similarly
by the two browsers on the two platforms. (b) Less than 60% of all the 1000 EST values
are 1.0, meaning that the cross-browser visual differences exist in the test cases and are
detected by the measurement. (c) The same-browser-comparisons generally produce higher
similarity estimates than same-platform-comparisons. And, (d) the EST similarity shows
higher values than the WebCompare similarity: most of the WebCompare values are
between 0.5 to 0.9, with the lowest value of 0.1095 and only one value of 1.0. That is
WebCompare only believes that in one situation is a web page rendered identically across
two browsers.

111
To figure out whether the two measurements are consistent with human perceptions,
we asked five volunteers to view the screenshot images of all the previous test cases and
then make further comparisons. They were required to mark “same” or “different” for each
pair of web pages. The identification results from all of the volunteers were identical. This
is because it is possible for a human to assert whether two screenshot images are identical
or not, but it is difficult for humans to assert numerically how much dissimilar they are
(this is exactly the reason why we need a numeric measurement to evaluate the similarity
of web pages). By comparing the previous (EST/WebCompare) values with the volunteers’
identifications, a confusion matrix can be built for the following scenarios: “both
EST/WebCompare value and the volunteer identification of the two pages are same”,
“EST/WebCompare value of two web pages shows different but the volunteer identifies as
same”, “both EST/WebCompare value and the volunteer identification of the two pages
are different”, and “EST/WebCompare value of the pages shows same but volunteer
identifies as different”. As shown in Table 4.5, the EST similarity can identify the web page
differences with the precision and accuracy over 90% and 70%, respectively. As the
comparison, WebCompare’s precision and accuracy are all below 50%. This is because the
WebCompare identifies very few identical comparisons, leading to the low TP rate.
Table 4.5 Comparison of Human Perceptions and Calculation Results (Original Web Pages)
TP FP TN FN Precision Accuracy
EST
CL vs. CW 256 5 505 234 0.9808 0.7610
FL vs. FW 263 2 494 241 0.9925 0.7570
CL vs. FL 97 2 799 102 0.9798 0.8960
CW vs. FW 137 1 753 109 0.9928 0.8900
WebCompare
CL vs. CW 13 486 479 22 0.0261 0.4920
FL vs. FW 9 575 400 16 0.0154 0.4090
CL vs. FL 26 444 456 74 0.0553 0.4820
CW vs. FW 25 534 363 78 0.0447 0.3880

112
As mentioned in the previous subsection, two types of dynamic content affect the
results, and the advertisements can be controlled in the experiment. The distribution of the
Ad-free version of the 1000 web pages is illustrated in Figure 4.12. By comparison, Figure
4.11 and Figure 4.12 reveal similar patterns as discussed above. Furthermore, after removing
the advertisements, the EST similarity values become higher. For example, the number of
EST records with value 1.0 in Figure 4.11 is 450, but it increases to 490 in Figure 4.12. The
precisions and accuracies are listed in Table 4.6, which shows similar pattern with Table
4.5, indicating the efficiency evaluation using TP, FP, TN, FN is consistent and stable.
Figure 4.12 Distributions of the Experimental Results for Ad-Free Web Pages
Table 4.6 Comparison of Human Perceptions and Calculation Results (Ad-Free Web Pages)
TP FP TN FN Precision Accuracy
EST
CL vs. CW 270 7 449 274 0.9747 0.7190
FL vs. FW 277 5 450 268 0.9823 0.7270
CL vs. FL 121 1 770 108 0.9918 0.8910
CW vs. FW 139 2 738 121 0.9858 0.8770
WebCompare
CL vs. CW 18 416 546 20 0.0415 0.5640
FL vs. FW 11 409 562 18 0.0262 0.5730
CL vs. FL 32 549 343 76 0.0551 0.3750
CW vs. FW 27 375 522 76 0.0672 0.5490
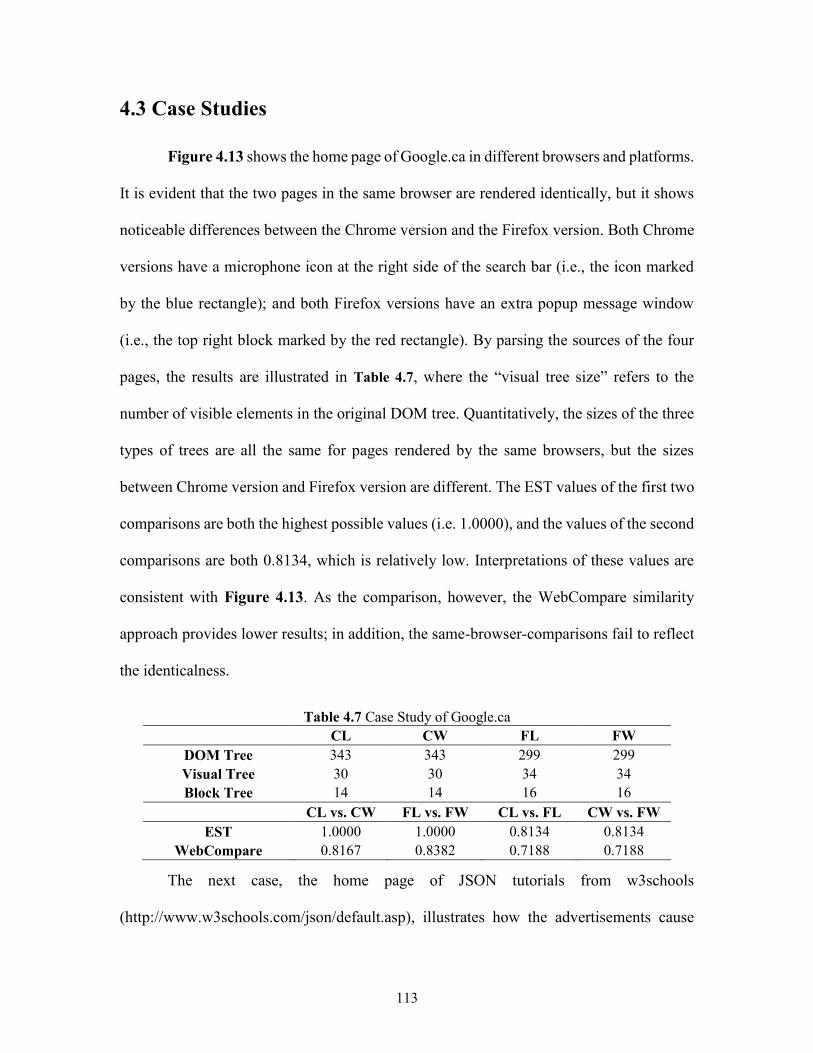
113
4.3 Case Studies
Figure 4.13 shows the home page of Google.ca in different browsers and platforms.
It is evident that the two pages in the same browser are rendered identically, but it shows
noticeable differences between the Chrome version and the Firefox version. Both Chrome
versions have a microphone icon at the right side of the search bar (i.e., the icon marked
by the blue rectangle); and both Firefox versions have an extra popup message window
(i.e., the top right block marked by the red rectangle). By parsing the sources of the four
pages, the results are illustrated in Table 4.7, where the “visual tree size” refers to the
number of visible elements in the original DOM tree. Quantitatively, the sizes of the three
types of trees are all the same for pages rendered by the same browsers, but the sizes
between Chrome version and Firefox version are different. The EST values of the first two
comparisons are both the highest possible values (i.e. 1.0000), and the values of the second
comparisons are both 0.8134, which is relatively low. Interpretations of these values are
consistent with Figure 4.13. As the comparison, however, the WebCompare similarity
approach provides lower results; in addition, the same-browser-comparisons fail to reflect
the identicalness.
Table 4.7 Case Study of Google.ca
CL CW FL FW
DOM Tree 343 343 299 299
Visual Tree 30 30 34 34
Block Tree 14 14 16 16
CL vs. CW FL vs. FW CL vs. FL CW vs. FW
EST 1.0000 1.0000 0.8134 0.8134
WebCompare 0.8167 0.8382 0.7188 0.7188
The next case, the home page of JSON tutorials from w3schools
(http://www.w3schools.com/json/default.asp), illustrates how the advertisements cause

114
cross-browser differences. In Figure 4.14, the screenshots of the original pages are
partially cropped and only the differences are the four pieces of advertisements marked in
red rectangles. Due to this dynamic content, the EST values of the four comparison
scenarios are 0.9368, 0.9343, 0.8988, and 0.8948, respectively; and after the removal of
the advertisements, all the EST values are 1.0000, as shown in Table 4.8. The
WebCompare results show slight increment after the advertisement filtering, however are
still lower than the EST.
Table 4.8 Case Study of W3schools’ JSON Home Page
CL vs. CW FL vs. FW CL vs. FL CW vs. FW
EST (Original) 0.9368 0.9343 0.8988 0.8948
WebCompare (Original) 0.6877 0.6442 0.7470 0.5731
EST (Ad-Free) 1.0000 1.0000 1.0000 1.0000
WebCompare (Ad-Free) 0.6950 0.6467 0.7490 0.5772

115
Figure 4.13 Screenshots of Google.ca in the Four Browser Scenarios
(a) Chrome in Linux (b) Chrome in Windows
(c) Firefox in Linux (d) Firefox in Windows

116
Figure 4.14 Screenshots of W3schools’ JSON Home Page in the Four Browser Scenarios
The third case is the home page of Amazon.ca, which reveals the effects of the
page-related dynamic content. The top search bar, the big poster and the footer sections of
(b) Chrome in Windows
(c) Firefox in Linux (d) Firefox in Windows
(a) Chrome in Linux

117
the four versions are exactly the same, so they are cropped in Figure 4.15. However, the
rest of the pages are different. For simplicity, we name the different blocks with unique
numbers, where identical blocks have the same value. As shown in the figure, there are
totally 21 different blocks in the four pages. Through comparing each pair of pages, it is
concluded that the pages on the same platforms are most similar. That is, subfigure (a) and
(c) are the first similar pair, and subfigure (b) and (d) are the second similar pair. For
example, subfigure (a) has blocks 1 through 13, and subfigure (c) also has these blocks
except block 9. The EST similarity values reveal the same results as well. Specifically, the
EST values are 0.8765, 0.8734, 0.9788 and 0.9156, respectively. The WebCompare results
are 0.6494, 0.7016, 0.6153 and 0.8207, indicating that it is able to identify the differences.
However, it provides a lower similarity value than EST. In addition, the third scenario (CL
vs. FL) is considered as the most similar comparison, however, the corresponding
WebCompare value is smaller than the fourth one, which is viewed as an inconsistency.
The fourth case is the home page of FedEx.com, as shown in Figure 4.16Error!
Reference source not found.. The only visual difference of the four versions is the select
box in the middle: the two Windows versions have a solid white background while the two
Linux versions are gradient gray; besides, the Firefox version in Linux has a larger height
than the other three. The values of EST similarity further reflect the above observations.
More specifically, the value between CL and CW is 0.9003; the values between FL and
FW, CL and FL are both 0.8188; and the value between CW and FW is 1.0. In comparison,
the values of the WebCompare similarity are more than 30% lower than the EST similarity,
namely 0.5345, 0.5079, 0.1767 and 0.1095 for each comparison scenario, respectively.

118
Note that the two browsers in Windows render the web page identically, however
WebCompare shows only 10% of the similarity.
Figure 4.15 Screenshots of Amazon.ca in the Four Browser Scenarios
(b) Chrome in Windows (c) Firefox in Linux (d) Firefox in Windows (a) Chrome in Linux

119
Figure 4.16 Screenshots of FedEx.com in the Four Browser Scenarios
5 Related Work
The area of web page visual analysis is widely adopted by researchers. Michailidou
et al. (2008) investigated the user perception of visual complexity and aesthetic appearance
of web pages. They further proposed the definition of visual complexity for web pages by
empirical experiment using card sorting and triadic elicitation (Harper, et al. 2009). Eraslan
et al. (2016) performed Scanpath trend analysis by clustering users’ eye tracking scanpaths
according to visual elements of a web page. Wu et al. (2016) used the structural SVM and
a multitask fusion learning model to conduct multimodal web aesthetics assessment. These
(a) Chrome in Linux (b) Chrome in Windows
(c) Firefox in Linux (d) Firefox in Windows

120
researchers analyzed web page visual elements to determine whether the visualization a
web page is clear and easy to read. Similarly, in this chapter, we analyze the visual elements
of web pages. However, as stated in the introduction section, we focus on cross-browser
issues from the angle of web page visual similarity. Therefore, we will mainly investigate
the work in the literature related to web page visual similarity, and pay less attention on
behavioral incompatibilities. A number of papers have focussed on the detection of visual
cross-browser issues.
Fu et al. (2006) evaluated web page similarity by using the Earth Mover’s Distance
(EMD) metric. They treated different web pages as pure images, normalized them into
squares with the same size, downgraded the pixel colors with different granularities as the
signature, and finally determined similarity by the signatures. The size matrices in the
chapter included 100*100 and 10*10, which potentially downgraded the precision of the
screenshot images. In our research, we retrieve all visual features while keeping the web
pages in their original resolution, in order to prevent precision loss.
Saar et al. (2014) proposed another detection methodology purely base on image
processing, the Browserbite. The original web pages were first rendered in different
browsers and operating systems so that the precise screenshot images can be retrieved. The
images were then split into segments by pixel-level visual features such as discontinuity or
color changes. Pairwise comparisons were finally conducted among the segments for cross-
browser incompatibility detection. Treating web pages as images ultimately reflects how
people seeing and processing the pages, however it ignores all the structural information
and thus may introduce false identifications. For example, if a logo image of a web site has
both texts and figures, then image processing could split the two components apart. In our

121
research, we determined to preserve the structural information in order to improve the
accuracy of segmentation.
Mesbah and Prasad (2011) proposed an automated testing framework to detect
cross-browser incompatibilities in both visual and behavioral aspects. They defined and
limited the cross-browser compatibility issues in a novel aspect that both human users and
the client-side browsers can find, and conducted detections within this aspect.
Rao and Ali (2015) exploit the speed up robust features (SURF) detector, a
computer vison technique, to extract discriminative feature points of images, to compare
the similarity of suspicious and legitimate web pages. They first create a list of legitimate
web pages as the base pool, compare the suspicious web pages with the web pages in the
base pool, and then updated the base pool based upon the results of the comparison. When
comparing images, the similarity score is calculated for the screenshots of both the
suspicious and legitimate web pages by the SURF algorithm, and a threshold score is used
as a judging standard. This is an interesting method for computing web page similarity, but
the determination of a threshold score is difficult.
Takama and Mitsuhashi (2005) investigate web page visual features, and develop
a method to calculate visual similarity between the top pages of two web sites. In web page
layout processing, they divide each web page into several regions and labeled them as text,
image, or mixture. In the next procedure, they perform graph matching based upon a layout
processing procedure. Finally, visual similarity is calculated according to the graph
matching results. Their primary contribution is considering visual features when
comparing web page similarity and their proposed method works well for this purpose.

122
Unfortunately, they only focus on static images and do not take into account other
multimedia elements found in web pages.
Shi, et al. (2008) investigate text similarity computation and extended the concept
of similarity computation into multimedia elements. They put forward a multi-layer
semantic model by describing each multimedia type in a single layer according to its
characteristics and user demands. A limitation of this model is that it ignores the
relationship among different multi-media content and may lead to inaccuracies of similarity
computation. The image in terms of visual similarity analysis is difficult to handle.
Choudhary et al. (2010) investigated cross-browser issues by the WebDiff
algorithm. They further improved their research by combining the WebDiff with CrossT
to propose new algorithms, namely CrossCheck and X-Pert (2012, 2013). Detection of the
visual incompatibilities from these algorithms were all the same. They identified the
content by cropping the screenshot image with DOM coordinates, and then compared the
similarity based on the color histogram of the cropped sub-images. Screenshots reflect the
final representation of web pages; however, they will potentially raise false positive results.
For example, when a web page defines its text style with a font family such as “serif”
instead of the concrete font, different browsers will interpret this with their own standards
(and actually this standard can also be customized by the user). The users are not concern
with the actual font at all, and many times they do not recognize such differences. In our
research, we avoid using the screenshots of web pages. On contrary, we evaluated all the
CSS values supported by different browsers, which consists of the comparison candidates
of cross-browser visualization incompatibilities.

123
Alpuente and Romero (2009) developed the theory that first extracted web page
content to different categories, namely “grp”, “row”, “col”, and “text”, and then merged
and compressed the DOM tree. The visual similarity was then determined by the
normalized version of the tree edit distance.
6 Conclusion and Future Work
Web applications have pervaded into almost every aspect of our daily life. However,
with the advent of various versions of web browsers, issues abound, i.e., different web
browsers cannot always render web pages and applications correctly. In order to detect
whether web pages and applications are rendered the same across different web browsers,
this chapter starts from the perspective of visual similarity, and develops a visual similarity
measurement to evaluate the visual similarity of a web page or application across different
web browsers.
We notice that the Gestalt laws of grouping are capable of revealing human’s
mechanisms of visual processing; hence, we introduce these laws into the study of web
page visual similarity by translating them into a computer compatible version. During this
process, the measurements of proximity, color similarity, and image similarity are obtained
through experimentation. To represent web pages correctly, we substitute the block tree
from the DOM tree by extracting visual features and combining visible elements through
the Gestalt laws of grouping (the code is available at
https://github.com/MarcoXZh/GestaltBlockTree). The block tree is then employed to
calculate web page visual similarity by the EST model. An experiment is conducted and a
case is studied to use this measurement to detect cross-browser differences among a test
set of 1000 web pages. The experimental data concludes positive results for this solution.

124
Acknowledgment
The authors thank China Scholarship Council (CSC) for financial supports.
References
María Alpuente and Daniel Romero. 2009. A visual technique for web pages comparison.
Electronic Notes in Theoretical Computer Science 235 (2009), 3–18.
Jyotish Chandra Banerjee. 1994. Encyclopaedic Dictionary of psychological terms. MD
Publications Pvt. Ltd., New Delhi.
Teh-Chung Chen, Scott Dick, and James Miller. 2010. Detecting visually similar web
pages: Application to phishing detection. ACM Transactions on Internet Technology (TOIT) 10, 2
(2010), 5.
Shauvik Roy Choudhary, Mukul R Prasad, and Alessandro Orso. 2012. Crosscheck:
Combining crawling and differencing to better detect cross-browser incompatibilities in web
applications. In 2012 IEEE Fifth International Conference on Software Testing, Verification and
Validation. IEEE, 171–180.
Shauvik Roy Choudhary, Mukul R Prasad, and Alessandro Orso. 2013. X-PERT: accurate
identification of cross-browser issues in web applications. In Proceedings of the 2013 International
Conference on Software Engineering. IEEE Press, 702–711.
Shauvik Roy Choudhary, Husayn Versee, and Alessandro Orso. 2010. WEBDIFF:
Automated identification of cross-browser issues in web applications. In Software Maintenance
(ICSM), 2010 IEEE International Conference on. IEEE, 1–10.
Francisco Claude, Antonio Farina, Miguel A. Mart´ınez-Prieto, and Gonzalo Navarro.
2010. Compressed qgram indexing for highly repetitive biological sequences. In BioInformatics
and BioEngineering (BIBE), 2010 IEEE International Conference on. IEEE, 86–91.
Sukru Eraslan, Yeliz Yesilada, and Simon Harper. 2016. Scanpath Trend Analysis on Web
Pag-es: Clustering Eye Tracking Scanpaths. ACM Transactions on the Web (TWEB) 10, 4 (2016),
20.
Anthony Y Fu, Wenyin Liu, and Xiaotie Deng. 2006. Detecting phishing web pages with
visual similarity assessment based on earth mover’s distance (EMD). IEEE transactions on
dependable and secure computing 3, 4 (2006), 301–311.

125
Simon Harper, Eleni Michailidou, and Robert Stevens. 2009. Toward a definition of visual
complexity as an implicit measure of cognitive load. ACM Transactions on Applied Perception
(TAP) 6, 2 (2009), 10.
Alain Hore and Djemel Ziou. 2010. Image quality metrics: PSNR vs. SSIM. In Pattern
Recognition (ICPR), 2010 20th International Conference on. IEEE, 2366–2369.
Daniel P. Huttenlocher, Gregory A. Klanderman, and William J. Rucklidge. 1993.
Comparing images using the Hausdorff distance. Pattern Analysis and Machine Intelligence, IEEE
Transactions on 15, 9 (1993), 850–863.
Kurt Koffka. 2013. Principles of Gestalt psychology. Vol. 44. Routledge.
Ming Li, Xin Chen, Xin Li, Bin Ma, and Paul Vit anyi. 2004. The similarity metric.
Information Theory, IEEE Transactions on 50, 12 (2004), 3250–3264.
M. Ronnier Luo, Guihua Cui, and B. Rigg. 2001. The development of the CIE 2000 colour-
difference formula: CIEDE2000. Color Research & Application 26, 5 (2001), 340–350.
Ali Mesbah and Mukul R. Prasad. 2011. Automated cross-browser compatibility testing.
In Proceedings of the 33rd International Conference on Software Engineering. ACM, 561–570.
Eleni Michailidou, Simon Harper, and Sean Bechhofer. 2008. Visual complexity and
aesthetic perception of web pages. In Proceedings of the 26th annual ACM international conference
on Design of communication. ACM, 215–224.
Adriana Olmos and Frederick A. A. Kingdom. 2004. A biologically inspired algorithm for
the recovery of shading and reflectance images. Perception 33, 12 (2004), 1463–1473.
Mateusz Pawlik and Nikolaus Augsten. 2015. Efficient computation of the tree edit
distance. ACM Transactions on Database Systems (TODS) 40, 1 (2015), 3.
Routhu Srinivasa Rao and Syed Taqi Ali. 2015. A Computer Vision Technique to Detect
Phishing Attacks. In Communication Systems and Network Technologies (CSNT), 2015 Fifth
International Conference on. IEEE, 596–601.
Thiadmer Riemersma. 2008. Colour metric. (2008). Retrieved April 18, 2016 from
http://www.compuphase.com/cmetric.htm
Jeanine Romano, Jeffrey D. Kromrey, Jesse Coraggio, and Jeff Skowronek. 2006.
Appropriate statistics for ordinal level data: Should we really be using t-test and Cohen’s d for
evaluating group differences on the NSSE and other surveys. In annual meeting of the Florida
Association of Institutional Research. 1–33.
Tõnis Saar, Marlon Dumas, Marti Kaljuve, and Nataliia Semenenko. 2015. Browserbite:
cross-browser testing via image processing. Software: Practice and Experience (2015).

126
Ali Shahbazi and James Miller. 2014. Extended subtree: a new similarity function for tree
structured data. Knowledge and Data Engineering, IEEE Transactions on 26, 4 (2014), 864–877.
Peng Shi, Lianhong Ding, and Bingwu Liu. 2008. Similarity computation of Web pages.
In Knowledge Acquisition and Modeling Workshop, 2008. KAM Workshop 2008. IEEE
International Symposium on. IEEE, 777–780.
Herb Stevenson. 2012. Emergence: The Gestalt Approach to Change. (2012). Retrieved
April 18, 2016 from http://www.clevelandconsultinggroup.com/articles/emergence-gestalt-
approach-to-change.php
Yasufumi Takama and Noriaki Mitsuhashi. 2005. Visual similarity comparison for Web
page retrieval. In Web Intelligence, 2005. Proceedings. The 2005 IEEE/WIC/ACM International
Conference on. IEEE, 301–304.
Jeremy M. Wolfe, Keith R. Kluender, Dennis M. Levi, Linda M. Bartoshuk, Rachel S.
Herz, Roberta L. Klatzky, Susan J. Lederman, and Daniel M. Merfeld. 2009. Sensation and Per-
ception (2nd ed.). Sinauer Associates Inc., Massachusetts, MA.
Ou Wu, Haiqiang Zuo, Weiming Hu, and Bing Li. 2016. Multimodal Web Aesthetics
Assessment Based on Structural SVM and Multitask Fusion Learning. IEEE Transactions on
Multimedia 18, 6 (2016), 1062– 1076.
Zhen Xu and James Miller. 2015a. Identifying semantic blocks in Web pages using Gestalt
laws of grouping. World Wide Web (2015), 1–22.
Zhen Xu and James Miller. 2015b. A New Webpage Classification Model Based on Visual
In-formation Using Gestalt Laws of Grouping. In International Conference on Web Infor-mation
Systems Engineering. Springer, 225–232.

127
CHAPTER 5 An Automated Testing Framework
for Cross-Browser Visual Incompatibility
Detection7
Abstract
Due to the rapid evolution of web applications and computer techniques, visual
incompatibility of web pages has become a problem across different browsers and
platforms influencing the functionality of the web applications. At the present, researchers
have made progress to address such issues; in addition, many commercial tools have
emerged as well. However, drawbacks still exist in the existing work, where fully automate
testing at the system level is still not achieved. In this chapter, we attempt to propose a
framework to detect the cross browser visual incompatibilities automatically. Highlights
of the proposed framework include template based case organization, version based
automation, and similarity embedded incompatibilities identification.
Keywords: Automated testing; Visual incompatibility; Visual similarity.
1 Introduction
Web applications have become more and more popular nowadays. Compared with
traditional applications with a client-server architecture, they are cross-platform, fully-
functional, and easier to deploy (ready-to-use and no installation or configuration required).
Developers of web applications, work hard on the goal of providing a universally identical
user experience. However, due to the incompatibilities among browsers (and platforms),
7 Xu, Zhen, and James Miller. “An Automated Testing Framework for Cross-Browser Visual Incompatibility Detection”. Submitted to International Journal of Web Engineering and Technology.

128
this goal is difficult to achieve. Visual differences of a web page rendered across browsers,
in some cases, are expected or acceptable (such as fonts of text). However, in many other
cases, they are incorrect and therefore may cause reading problems (such as missing or
incorrectly presented content). The latter inconsistencies are considered as the cross-
browser visual incompatibility (VI) in this chapter.
The test of a web application to identify such VIs can be conducted manually, by
reading and comparing each page through all the target browsers. This activity is highly
manual and thus cost-intensive, time-consuming, and in many cases error-prone. On the
one hand, a fully functional web application usually contains thousands of web pages,
which makes it impossible to test all of them manually. On the other hand, many of the
web pages are rendered from the same template, hence testing each of these pages is a
repetitive and unnecessary task. In this chapter, we propose an automated testing
framework to solve these problems. The highlights of the framework include:
template based case organization – extract different web pages rendered by the
same source template as a single test case;
version based automation – rerun the test case when changes of the source code are
detected; and
incompatibility identification with similarity estimation – provide both the list of
visual. Incompatibilities and the quantitative similarity score for each pair of
browsers being compared.
The rest of the chapter is organized as follows. Section 2 discusses related work,
including the advantages and limitations of currently existing cross-browser testing tools.
Section 3 describes the automated testing framework. It covers VI detection algorithm and

129
the automation schemes. Section 4 concludes the current progress and presents the future
work.
2 Related Work
In this section, we will review existing research and tools regarding cross browser
testing of web applications and web pages. There are many testing tools related to this area
in the market. We will describe each in detail in this section by pointing out their pros and
cons.
The research papers in the literature, regarding this area, are limited. Mesbah and
Prasad (2011) propose an approach to automatically analyze web applications under
various browsers and present the observed discrepancies on a pairwise basis. The analysis
crawls the target web application first and then analyses the crawled results. Choudhary et
al. (2010) investigate cross browser issues and propose an approach to automatically detect
these issues based on differential testing. They implement their approach in the WebDiff
tool with acceptable number of false positives. Later, they propose a more comprehensive
tool, namely, CrossCheck, based on the WebDiff and the CrossT. The CrossCheck tool
(Choudhary, et al., 2012) combines the benefits of WebDiff and CrossT, and can provide
both visual difference detection and functional difference detection. Subsequently, they
present another tool called X-Pert (2013). The above tools divided the detection of VIs into
three aspects: structure XBI (cross-browser incompatibility) detection, text-content XBI
detection, and visual-content XBI detection. The structure XBI detection employs the
“alignment graph”, which records the hierarchical and geometrical information of each
DOM element (e.g., element 1 is above element 2 and they are left and right aligned). This

130
is a novel idea of XBI detection as it narrows down the numeric coordinates of elements
into a limited number of relations based on the relative position. The text-content XBI
detection compares the text of elements. The potential problem of comparing textual strings
is that in a multi-language web page scenario (e.g., the English and the French version of
Google’s home page), text is not the core content, and thus the pages are similar to
users/developers while the comparison results suggests dissimilar, leading to false positive
results. The visual-content XBI detection takes the screenshot images as the input – the
images of the leaf DOM elements only, to be precise – and compares the color histogram
using 𝜒2 distance. The limitation of it is that leaf elements represent only part, and in many
cases only a small part of the whole page; and using color distribution to determine image
similarity ignores the actual content, thus may also raise false positive results.
Figure 5.1 shows three tools that only support cross-IE incompatibility detections.
The Expression Web SuperPreview (2011) supports only versions of IE 6 and 7 (IE 11 is
in the list, but actually not supported). It provides functions such as side-by-side
comparison, window size customization, and DOM inspection. The side-by-side
comparison enables us to compare web pages with different browsers intuitively and
conveniently on a single screen. The window size customization allows us to change the
width and height of the view port to simulate different devices and screens. With the DOM
inspection function, we can investigate the web pages in a responsive way. This tool returns
error on many web pages (marked by the yellow circle in the figure); and when the page
preview is acquired, it is limited in the current view port. Content outside of the view port
will not be rendered (as shown in the blue circle). IETester (2017) can perform side-by-
side comparison, but lacks in window size customization. With the extension of DebugBar,

131
it can also perform DOM inspection. Although most versions of IE are claimed to be
supported, many return errors. IE NetRenderer (2017) can only draw web pages with the
target version of IE to generate screenshot image. Therefore, it provides no side-by-side
comparison or DOM Inspection. By investigating the tool, we also observe that it does not
support window customization.
Figure 5.1 The Three Tools for Cross-IE Incompatibility Detection
Browsershots (2005), Browsera (2017), BrowserBite (2017), BrowserStack (2017),
and CrossBrowserTesting (2017) are five tools that support multi-browser and multi-
platform detections. This meets the minimum request for VI detection. For the input, only
Browsera can take multiple URLs as the input, while all the other tools allow only one
(a) Expression Web SuperPreview (b) IE NetRenderer
(c) IETester

132
URL per test. Thus, for web application developers to conduct full-site tests, most tasks
will have to be performed manually. Also, Browsershots, BrowserStack and
CrossBrowserTesting provide configurations to customize window size. As for the
detection, Browsershots, BrowserBite and BrowserStack load a web page with all selected
browsers and then simply take all the screenshot images as the results, without doing any
VI detection. On the other hand, Browsera and CrossBrowserTesting provides both
screenshot images and detection reports, as shown in Figure 5.2.
Figure 5.2 Detection Reports of Browsera and CrossBrowserTesting
3 Automated Testing Framework
In our previous work (Xu and Miller, 2015), we developed a method to calculate
the quantitative visual similarity of two web pages. The present chapter extends this
method by adding an extra step to identify different elements between the two pages, and
uses the extended method as the core function of the automated testing framework to detect
VIs.
(a) Browsera
(b) CrossBrowserTesting

133
3.1 Automated Page-Level Detection of VIs
The page-level detection employs the above extended method as the core function
of the proposed testing framework. This method extracts block trees from the web page
rendered by two different browsers, and uses the two block trees to detect VIs.
3.1.1 Block Tree Extraction from Web Page
The DOM tree contains all the information from a web page, but only the visible
elements contribute to the visualization of the web page. Therefore, the first step of the
block tree extraction is to remove invisible DOM elements. The next step is to merge
semantically related elements into blocks. This is done by translating and applying the
Gestalt laws of grouping as follows.
The Gestalt law of simplicity shows people’s tendency to recognize the simplest
representation of objects. To interpret this law, we take each DOM element as the
simplest representation of objects.
The Gestalt law of closure indicates that people are inclined to construct complete
shapes from incomplete ones. A DOM element is often overlapped by its child
DOM elements, leaving the shape incomplete, but people are still able to recognize
it as a complete rectangle. As such, to interpret this law, we treat all DOM elements
as complete rectangular objects.
The Gestalt law of proximity states that people have the tendency to group close
objects and separate distant ones. Therefore, to translate this law, we merge
elements into blocks based on this distance. In the web page scenario, we compare
the distances between each pair of adjacent sibling DOM elements, those with

134
smaller distances are “clustered” into a group, and those with larger distances are
separated into different groups.
The Gestalt law of similarity illustrates that people are prone to regard similar
objects as a group. Here, similarity refers to the visual features related to
background, foreground, and size. If any of a list of sibling DOM elements is
different from others in the above three aspects, we put it into a different group.
The Gestalt law of continuity describes people’s tendency to group aligned objects.
In other words, if any DOM element is not aligned with its siblings, it is put into a
different group.
The Gestalt law of common fate reveals that people are inclined to put objects with
the same motion into the same group. To translate this law, we focus on the
scrolling behaviors when it comes to motion trends. Most DOM elements move
accordingly when the user scrolls a web page, but some other elements may stay
still, or move slower or faster. Such elements that do not move in the same way
with others are place into a different group.
The Gestalt law of symmetry tells us that people tend to perceive symmetric objects
as a single group. Since this law is not common in web pages, we do not consider
it in the present chapter.
The Gestalt law of past experience states that people are prone to rely on past
experience when interpreting objects. Again, we do not consider this law in the
present chapter, because it is beyond the scope of web page analysis.
Figure 5.3 shows an example of the block tree extracted from University of
Alberta’s home page. By applying the Gestalt laws of grouping, the semantically related

135
DOM elements are grouped into blocks. In Figure 5.3b, semantically related elements are
marked with the same background colors. For example, as shown in the yellow circle at
the lower left part, the news items are marked with the same background color. This is
because they refer to the same topic. As a comparison, the three boxes in the middle area
(marked in the black circle) contain image, text and buttons respectively, indicating that
they are semantically non-related, so they are marked with different colors. Figure 5.3c
shows partial of the block tree, where each line denotes a single block. From this figure,
we can find that a) the DOM hierarchy is well maintained in the block tree; b) the root
block consists of the “BODY” element from the DOM tree; and c) some blocks contain only
one DOM element while others merge a group of elements into one block.

136
Figure 5.3 The Example of UAlberta’s Home Page
3.1.2 VI Detection and Similarity Estimation
The two block trees retrieved from two browsers of a web page are compared to
detect VIs. During the comparison, a tree edit distance (TED) based mapping scheme, the
extended subtree model (Shahbazi and Miler, 2014), is employed. An overview of the
model is given below:
Subtree mapping. Regular TED mapping schemes only map tree nodes. However,
in a web page scenario, content elements are stacked up so that lower elements are
(a) Original Page (b) Analyzed Page
[BODY]: left=0,top=0,right=1007,bottom=1588; ... |- [FORM,DIV]: left=-1988,top=-1999,right=1007,bottom=1588; ... | |- [HEADER,DIV,FOOTER]: left=0,top=0,right=1007,bottom=1588; ... | | |- [DIV,DIV,DIV]: left=0,top=0,right=1007,bottom=196; ... | | | |- [DIV]: left=50,top=10,right=956,bottom=50; ... | | | | |- [NAV,DIV]: left=218,top=10,right=956,bottom=48; ... | | | | | |- [UL]: left=276,top=10,right=798,bottom=41; ... | | | | | | |- [LI]: left=276,top=20,right=798,bottom=34; ... | | | | | | | |- [UL]: left=276,top=22,right=798,bottom=34; ... | | | | | | | | |- [A,A,A,A,A,A,A]: left=276,top=22,right=802,bottom=34; ... | | | | | |- [INPUT,BUTTON]: left=802,top=13,right=956,bottom=45; ... | | | |- [DIV]: left=50,top=61,right=956,bottom=151; ... | | | | |- [A,NAV]: left=50,top=87,right=957,bottom=151; ... | | | | | |- [UL]: left=416,top=115,right=957,bottom=144; ... | | | | | | |- [A,A,A,A]: left=436,top=119,right=957,bottom=134; ... | | | |- [NAV]: left=51,top=155,right=956,bottom=195; ... | | | | |- [UL]: left=51,top=155,right=956,bottom=195; ... | | | | | |- [LI]: left=52,top=155,right=956,bottom=195; ...
(c) Partial of the Block Tree

137
always covered by upper elements. Hence, when we see the content of a block in
the web page, it is the content of a subtree that is rooted at the block. Consequently,
the subtree mapping scheme is more accurate approach.
One-time mapping. If two subtrees are mapped, then they will have common
subtrees (if there are subtrees in them). However, to avoid duplications, we do not
map these common subtrees again.
Subtree weight determination. A subtree mapping has a weight that is equal to the
mean value of the weights of the two subtrees. The weight of a subtree is equal to
the number of nodes that take this subtree as their largest subtree.
The mapping of two block trees reflects the visual compatibilities, i.e., are the two
corresponding blocks similar or not. Therefore, the detection of VIs is to locate blocks that
are not in the mapping results. In another word, blocks that are added, deleted or changed
from one tree to the other tree contain VIs. The quantitative similarity of the two block
trees, the extended sub tree (EST) value, is calculated by (5-1):
𝑆∗(𝑋, 𝑌) =√∑ 𝛽𝑘×𝑊(𝑚𝑘)𝛼
𝑚𝑘∈𝑀𝛼
max(|𝑋|,|𝑌|) , (5-1)
where, 𝑋 and 𝑌 are the two trees; |𝑋| and |𝑌| are the sizes of the two trees, which equal to
the numbers of nodes in 𝑋 and 𝑌, respectively; 𝑀 is the mapping results; 𝑊(𝑚𝑘) is the
weight of the mapping 𝑚𝑘; 𝛼 is the coefficient to adjust the relation among mappings with
different subtree sizes; and 𝛽𝑘 is a geometrical parameter to reflect the importance of the
mapping 𝑚𝑘 with respect to the position of block 𝑘 in 𝑋 and 𝑌. 𝛽𝑘 = 1 when the node 𝑥𝑘
of 𝑋 and 𝑦𝑘 of 𝑌 in 𝑚𝑘 have the same depth, otherwise 𝛽𝑘 = 𝛽0, which is a constant in the
range of (0,1).
138
3.2 Automated System-Level Testing for VI Detections
System-level testing is designed to evaluate all the web pages in a web application.
The automated testing framework should be able to discover objective functions, trigger
actions, and report outcomes without human intervention. To achieve this goal, three
modules are proposed to construct the testing framework, namely the source parser, the
schedule builder and the result reporter.
3.2.1 Source Parser
The core task of this module is to discover the objective functions. In the web
application scenario, to detect VIs, the objective functions cover all the web pages because
all of these pages must (ideally) be bug-free. Development of modern web applications
relies on page templates. That is, utilizing one template dynamically generates similar web
pages. Consider Google’s search result page, when a user types in “online shopping”, the
search result page displays dozens of online shopping related links; and when the user types
in “health care”, the page displays another dozens of links, which are similar in the layout
with the previous page except the details. This is because the search result page utilizes a
template that shows different content according to the inputs. To test a web application, it
is useless and impractical to test all possible web pages. Instead, we only need to test one
case for each page template. Consequently, to conduct automated testing, the practical
objective functions should be narrowed down to include only unique page templates.
Consider a typical Django project as an example, each component app of a Django
project contains a source file named “urls.py”, where all the implemented URL entries are
recorded and linked to the corresponding view methods. The view methods are further

139
linked to the page templates that are used for displaying actual content. Therefore, in the
Django project testing practice, the objective functions map to all these URL entries. To
automatically test such projects, the source parser should be able to detect all possible URL
entries. Meanwhile, some of these entries contain parameters, and thus, the source parser
also needs to be able to detect these parameters and assign proper values to them. This may
require accessing data models and querying databases.
3.2.2 Schedule Builder
As the name indicates, the schedule builder manages the schedule of testing
automation. During the development of a web application, the source code keeps changing
constantly, and it is necessary to repeat the tests through out the whole development period.
A straightforward solution to automatically repeat the tests is to set up a schedule
based on the time. The second method we proposed to automatically run the tests is based
on the source code changes. Not all the objective functions change all the time, so we
should only re-test those that have changed and ignore those that have not changed. For
instance, the developer may focus on one app of the web application today and another app
tomorrow, so it is unnecessary to re-run tests on the second app. In this case, the schedule
builder should monitor each template, and automatically triggers the actions to re-run the
corresponding tests based on changes of the template’s source codes (for example, re-test
after a defined number of updates to the source code).
3.2.3 Result Reporter
The automatic testing framework runs without human intervention; therefore, once
the results are produced, it is possible for users to ignore their implications if the framework

140
does not notify the developer. This is acceptable if a test case passes, but when the result
fails, the result reporter module must notify the developer. Content of the notifications
include a true/false assertion (i.e., indicating whether the template page is rendered
identically in the target browsers), a quantitative value of the visual similarity (where 1.0
indicates identical and 0.0 indicates completely different), and a list of differences between
the rendered pages.
Priorities must be added to the notifications automatically, and the result reporter
must display the outputs accordingly. This is because automatic repetitions of the
scheduled tests will generate significant numbers of results, and only those failed results
(i.e., VIs that have been detected) require the developer’s attention. If the objective of a
test is to confirm the template is rendered identically by all browsers, then all the results of
“true”, “1.0”, or an empty list of differences are not important. In this case, the priority of
these results should be set to lowest. As the opposite, the lower the similarity value (or the
larger the difference list is), the higher the priority should be.
The difference list is easier to read if it is combined with the side-by-side display
for locating VIs. Therefore, presentation of VIs must be done by rendering the web page
in all the browsers simultaneously and highlighting the identified differences (for example,
highlight them by changing the background colors or by outlining the borders of the related
blocks).
Figure 5.4 shows the outline of the automated testing framework, where the green
and yellow rectangles indicate the data and components of the framework, respectively;
the green and yellow arrows denote the data and control flow, respectively; and the blue
arrows refer to the notification flow.

141
Figure 5.4 The Automated Testing Framework
The framework accepts both templates of web applications and specific
URLs/HTML code as the input. Although the templates require extra processing by
the source parser, the specific URLs/HTML code can be directly input in the
schedule builder.
The browser controller registers and manages the supported browsers.
The schedule builder manages the automation schedule, either by time, or by
changes to the source code, or by both. According to the schedules, its
subcomponent, the action trigger, conducts the testing process, where the sources
are passed to the VI identifier for VI detection and similarity estimation.

142
The result reporter collects all the test results, filters them by priorities, and notifies
web application developers selectively. By updating the web pages in the browsers
with the difference list, a side-by-side comparison provides fast location of VIs.
4 Automated Testing Tool
To conduction VI detection, the minimum request is that the automated testing tool
must support multiple browsers and/or multiple platforms. The implementation, hence, is
designed as a distributed system, where a central node communicates with and controls all
leaf nodes. The leaf nodes run specific OSes and browsers and therefore consist of the
testing farm, which renders the target web pages and collects the corresponding source data
(i.e., the block trees). The central node deploys the automated testing tool as well as the
target web application, and performs the testing automation. Figure 5.5 shows a sequence
diagram of the tool’s testing process.
4.1 Browser and Platform Registration
During the initialization of the automated testing tool, the supported browsers and
platforms are to be configured. The core thread of this distributed system that is located in
the central node will send queries to all branches for browser detection. The active leaf
nodes will respond to it with the configuration information, including the name and version
of both its own operating system and installed browsers. Hardware configurations of the
machine (either physical or virtual) could also be included if necessary, such as resolutions
of mobile devices. Figure 5.6 shows the two initialization dialogs of the tool, where the
browser registration illustrates examples of local browsers.

143
Figure 5.5 Sequence Diagram of the Automated Testing Tool
Figure 5.6 Initialization Dialogs of the Automated Testing Tool
4.2 Template Based Test Case Organization
The automated testing tool analyzes the source code that encode all the templates
such as the full list of RESTful URLs, and generates test cases for each such template entry.
(a) Browser Registration (b) Project Options

144
As mentioned in the previous section, this task is done by the source parser. If necessary,
the source parser will dig further information (for example dynamic content in the URLs,
such as the user ID “MarcoXZh” in “https://github.com/MarcoXZh/”) from sub apps and
the web application’s database. Note this step is project dependant – different web
applications require different strategies for code analysis.
Figure 5.7 shows example pseudocode of the source parser for Django project
analysis. This algorithm takes a Django project’s project name and root directory as inputs.
It searches the “manage.py” script for configurations of installed apps and databases (Line
6 to 8), and then parses the templates as follows:
1
2
3
4
5
6
7
8
9
10
11
12
13
14
15
16
17
18
19
20
21
22
23
24
25
26
27
28
29
ALGORITHM ParseSource_Django:
INPUT: project name: PN,
root directory PN: RD
OUTPUT: all template URLs: TS
config_script = get_config_script(RD.mangage.py)
apps = get_installed_apps(config_script)
database = get_database(config_script)
connect(database)
TS = [EMPTY_LIST]
FOR EACH app IN apps DO:
FOR EACH url, view IN urlpatterns(app.urls.py) DO:
IF contains_django_variables(url) THEN:
variables = retrieve_variables(url)
model = retrieve_model(view)
sql_table = retrieve_sql_table(app.model)
values = [EMPTY_LIST]
FOR EACH var IN variables DO:
value = query(sql_table, var)
values.append(value)
END FOR
replace_all(url, variables, values)
END IF
TS.append(url)
END FOR
END FOR
close(database)
RETURN TS
END ALGORITHM
Figure 5.7 Extracting Templates from Django Projects

145
1) for each installed app, it checks its “urls.py” script to detect all supported URL
patterns and the corresponding views;
2) for each URL pattern, if it contains variables, then the source parser needs to assign
correct values by querying the view-model-table chain for all the variables (Line
13 to 23);
3) after assigning values to the variables, or if the pattern is a regular URL and
contains no variables, the URL pattern is added to the template list; and
4) the full template list includes all the URL patterns of all the installed apps. Due to
the templates list consisting of URL patterns only extracted from the “urls.py”
script, it will not store duplicated URL entries, and at the same time cover all the
supported URLs of the web application.
4.3 Version Based Automation
Once the templates are extracted from the web application’s source code, the core
thread sends signals to all the leaf nodes according to the predefined schedule for VI
detection. This tool contains both time-driven schedules (i.e., triggers actions after a fixed
time) and change-driven schedules (i.e., triggers actions after a fixed number of changes
being made in the target source codes). Once the predefined time has expired or the
predefined number of code changes has detected, a re-test is triggered. However, if the
target source code remains unchanged (i.e., no changes of source code found by the diff
process, or http response code of the target web page being 304), then the test will be
skipped. Figure 5.8 shows the scheduler builder of the tool, which combines the functions
of template extraction and schedule configuration. Note the three source entries at the right-
side list view are raw HTML code – a regular URL without variables and a variable-

146
included URL. The “`|$1|`”, “`|$2|`”, etc. are the variable names, and the
corresponding values are stored however not displayed. Testing frequency of the schedule
builder can be configured as either change-based or time-based or both. Collection of the
target test cases’ screenshots can be customized, too.
Figure 5.8 Schedule Builder of the Automated Testing Tool
4.4 Case Study
In this chapter, we evaluate the efficiency of the automated testing tool though the
case of University of Alberta’s home page. Comprehensive experiments and result
discussions can be found in (Xu and Miller, 2015). We run the tools to compare the page
in two popular browsers: Google Chrome version 57 and Mozilla Firefox version 52, and
on two platforms: Windows 10 and CentOS 7. By comparing the results of
CrossBrowserTesting and our VI detection, the following conclusions can be derived:

147
1) Both CrossBrowserTesting and our automated testing tool can locate VIs of web
pages among different browsers; and at the same time, both can make the correct
conclusion without raising false positives if two versions of a web page are identical.
2) Results of CrossBrowserTesting contains only VIs, lacking in intuitive conclusions
to determine how similar the two versions of a web page are. Thus, if a test result
contains ten small VIs and another test result contains one big VIs, it is difficult to
figure out the priority for developers to start debugging. As the comparison, our
tool calculates the EST similarity, which enables the priority judgement. Table 5.1
shows the EST values of the evaluation.
Table 5.1 EST Similarity Values of the Cross-Comparisons
Browser1 Windows-Chrome CentOS-Chrome Windows-Chrome Windows-Firefox
Browser 2 Windows-Firefox CentOS-Firefox CentOS-Chrome CentOS-Firefox
EST
Value 1.0000 1.0000 0.9603 0.9603
3) During the tree comparison, our EST model maps sub trees instead of nodes, thus
it can avoid potential duplications of VI detection. As previously shown in Figure
5.2b, CrossBrowserTesting identified four VIs caused by the X coordinates of the
elements. However, the second and the third VIs are child elements of the element
in the first VI. Due to the mismatch of the parent element’s X coordinate from the
two versions of the page, its child elements consequently mismatch, too, Therefore,
the second and the third VIs are actually a duplication of the first VI. Our EST
model, by absorbing comparisons of child elements and mapping subtrees, prevents
such hierarchical false positives from being detected.

148
5 Conclusions
Diversity of present web browsers and platforms have brought cross browser issues
to both web users and developers. To detect cross browser incompatibilities, many
commercial tools have been developed and relevant topics have gained attention among
researchers as well. In this chapter, we target the detection of VIs and attempt to propose a
testing framework to detect these incompatibilities automatically. Three advantages exist
in the automated testing framework. Firstly, the detection of VIs is based on source
templates. By doing so, we narrow down the scale of testing. Second, automation is
achieved by schedules based on both time and changes of the source code, which avoids
human intervention and at the same time this further reduces the test ranges. Finally, the
framework provides both a list of VIs (including a rendered presentation of these
differences) and a quantitative similarity value as the result. This makes it possible to notify
web application developers by priorities.
An automated testing tool is designed according to the framework. This tool allows
the registration of browsers on both local and remote machines, and utilizes all these
registered browsers to conduct VI detection. It extracts the templates depending on the type
of the target web application. A Django example is employed showing that this tool can
extract both plain URLs and URLs with variables, where the extraction of the latter is done
by querying information from the web application’s database. Version base automation of
the tool is achieved by both time-driven and change-driven schedules. A case study is
presented to illustrate the efficiency of the extended subtree model by comparing it with
the CrossBrowserTesting. Conclusions reveal that the quantitative values indicate how
similar the two browser versions of a web page are and serves as a reference to debug these

149
VIs; and the subtree mapping scheme has eliminated duplications of the VI detection
results.
Acknowledgment
The authors would like to thank China Scholarship Council (CSC) for the financial
support.
References
Expression Web SuperPreview, 2011. https://www.microsoft.com/en-
ca/download/details.aspx?id=2020 (accessed 17.03.04).
IETester, 2017. http://www.my-debugbar.com/wiki/IETester/HomePage (accessed
17.03.04).
IE NetRenderer, 2017. https://netrenderer.com/ (accessed 17.03.04).
Browsershots, 2005. http://browsershots.org/ (accessed 17.03.04).
Browsera, 2017. http://www.browsera.com/ (accessed 17.03.04).
BrowserBite, 2017. http://browserbite.com/ (accessed 17.03.04).
BrowserStack, 2017. https://www.browserstack.com/ (accessed 17.03.04).
CrossBrowserTesting, 2017. https://crossbrowsertesting.com/ (accessed 17.03.04).
Ali Mesbah and Mukul R. Prasad. 2011. Automated cross-browser compatibility testing.
In Proceedings of the 33rd International Conference on Software Engineering. ACM, 561–570.
Shauvik Roy Choudhary, Mukul R Prasad, and Alessandro Orso. 2012. Crosscheck:
Combining crawling and differencing to better detect cross-browser incompatibilities in web
applications. In 2012 IEEE Fifth International Conference on Software Testing, Verification and
Validation. IEEE, 171–180.
Shauvik Roy Choudhary, Mukul R Prasad, and Alessandro Orso. 2013. X-PERT: accurate
identification of cross-browser issues in web applications. In Proceedings of the 2013 International
Conference on Software Engineering. IEEE Press, 702–711.
Shauvik Roy Choudhary, Husayn Versee, and Alessandro Orso. 2010. WEBDIFF:
Automated identification of cross-browser issues in web applications. In Software Maintenance
(ICSM), 2010 IEEE International Conference on. IEEE, 1–10.

150
Zhen Xu and James Miller. 2017. Estimating Similarity of Rich Internet Pages Using
Visual Information, International Journal of Web Engineering and Technology.
Ali Shahbazi and James Miller. 2014. Extended subtree: a new similarity function for tree
structured data. Knowledge and Data Engineering, IEEE Transactions on 26, 4 (2014), 864–877.

151
CHAPTER 6 Conclusions
1 Summary of Thesis
The purpose of this thesis is to investigate issues existing in the field of web pages, including
the detection of semantic content, visual similarity, and cross-browser incompatibilities. To address
these issues, we propose four research topics and present them in separate chapters that follow the
introduction chapter. In this section, we will describe the accomplishments within each topic in
both terms of their strengths and limitations.
In Chapter 2, we present our first journal paper, which develops an approach to identify
semantic blocks in web pages. Since traditional methods cannot work well for modern web pages,
we seek to introduce human perception into this topic. To remove the hierarchical inconsistencies
between the visual layout and the DOM tree of web pages, we propose the layer tree. Based on it,
we interpret the Gestalt Laws of grouping by novel measurements such as the normalized Hausdorff
distance, the CIE-Lab color difference, and the normalized compression distance. A classifier is
trained finally to operationalize the interpreted laws. Semantic blocks are extracted by applying the
translated Gestalt laws to the layer tree. For this topic, we have achieved what we proposed in the
introduction chapter. A limitation of the proposed technique is that it cannot work well with large
web pages.
In Chapter 3, we present our second journal paper, which provides a method to detect web
page similarity for modern rich-format web pages. Unlike existing approaches that adopt DOM
trees or images, the new method considers both structural and visual information of the web pages.
Based on the idea of the block tree, we propose a visual similarity measurement that use tree edit
distance to calculate visual similarity between web pages. As stated in the introduction section, we
have succeeded in presenting a way to detect web page similarity. One limitation of the proposed

152
method is that tree edit distance is not the perfect data structure to describe web pages, because its
mapping detection is based on nodes while web pages visualization is based on sub trees.
In Chapter 4, we present our third journal paper, which improves the visual similarity
measurement by conducting empirical experiments to determine the measurements for Gestalt laws
translation and replacing the tree edit distance with extended subtree model. By using this visual
similarity measurement, we conduct experiment to evaluate visual similarity of different web pages.
In this topic, we solved the limitation of the second topic described in the previous paragraph.
Specifically, we introduced extended sub tree concept to represent web pages in order to obtain a
more accurate comparison.
In Chapter 5, we present our fourth journal paper, which focuses on the development of an
automated testing framework to detect cross-browser visual incompatibilities between web pages.
An automated testing tool is designed according to the framework, by using the improved visual
similarity.
2 Publications
1) Papers:
Campbell, Joshua Charles, Chenlei Zhang, Zhen Xu, Abram Hindle, James Miller,
Deficient documentation detection: a methodology to locate deficient project
documentation using topic analysis,” 10th Working Conference on Mining
Software Repositories, pp. 57-60, 2013.
Xu, Zhen, and James Miller. A New Webpage Classification Model Based on
Visual Information Using Gestalt Laws of Grouping. International Conference on
Web Information Systems Engineering. Springer International Publishing, 2015.
2) Posters and Presentations:

153
Zhen Xu, Fadwa Estuka, James Miller. Identifying Semantic Blocks in Web Pages
Using Gestalt Laws of Grouping. 25th Annual International Conference on
Computer Science and Software Engineering.
Zhen Xu, James Miller, Syed Tauhid Zuhori. A New Web Page Classification
Model based on Visual Information using Gestalt Laws of Grouping. 25th Annual
International Conference on Computer Science and Software Engineering.
Zhen Xu, James Miller. An Empirical Metric for Web Page Visual Similarity based
on the Gestalt Laws of Grouping. Consortium fro Software Engineering Research,
2016.
Zhen Xu, James Miller. Cross-Browser Differences Detection based on an
Empirical Metric for Web Page Visual Similarity. 26th Annual International
Conference on Computer Science and Software Engineering.

154
Bibliography
Albrecht, P., M uller, A.-K., Ringelstein, M., Finis, D., Geerling, G., Cohn, E., Aktas, O.,
Hartung, H.-P., Hefter, H., Methner, A., 2013. Retinal neurodegeneration in wilsons disease
revealed by spectral domain optical coherence tomography. In: Neurology. Vol. 80. Lippincott
Williams & Wilkins 530 WALNUT ST, PHILADELPHIA, PA 19106-3621 USA.
Adriana Olmos and Frederick A. A. Kingdom. 2004. A biologically inspired algorithm for
the recovery of shading and reflectance images. Perception 33, 12 (2004), 1463–1473.
Alain Hore and Djemel Ziou. 2010. Image quality metrics: PSNR vs. SSIM. In Pattern
Recognition (ICPR), 2010 20th International Conference on. IEEE, 2366–2369.
Ali Mesbah and Mukul R. Prasad. 2011. Automated cross-browser compatibility testing.
In Proceedings of the 33rd International Conference on Software Engineering. ACM, 561–570.
Ali Shahbazi and James Miller. 2014. Extended subtree: a new similarity function for tree
structured data. Knowledge and Data Engineering, IEEE Transactions on 26, 4 (2014), 864–877.
Anthony Y Fu, Wenyin Liu, and Xiaotie Deng. 2006. Detecting phishing web pages with
visual similarity assessment based on earth mover’s distance (EMD). IEEE transactions on
dependable and secure computing 3, 4 (2006), 301–311.
Baluja, S., 2006. Browsing on small screens: recasting web-page segmentation into an
efficient machine learning framework. In: Proceedings of the 15th international conference on
World Wide Web. ACM, pp. 33–42.
Bennett, C. H., G acs, P., Li, M., Vit anyi, P. M., Zurek, W. H., 1998. Information distance.
IEEE Transactions on information theory 44 (4), 1407–1423.
Browsera, 2017. http://www.browsera.com/ (accessed 17.03.04).
Buttler, D., 2004. A short survey of document structure similarity algorithms. Tech. rep.,
Lawrence Livermore National Laboratory (LLNL), Livermore, CA.
Cai, D., Yu, S., Wen, J.-R., Ma, W.-Y., 2003a. Extracting content structure for web pages
based on visual representation. In: Asia-Pacific Web Conference. Springer, pp. 406–417.
Cai, D., Yu, S., Wen, J.-R., Ma, W.-Y., 2003b. Vips: a vision-based page segmentation
algorithm.
Canny, J., 1986. A computational approach to edge detection. IEEE Transactions on pattern
analysis and machine intelligence (6), 679–698.

155
Cao, J., Mao, B., Luo, J., 2010. A segmentation method for web page analysis using
shrinking and dividing. International Journal of Parallel, Emergent and Distributed Systems 25 (2),
93–104.
Chakrabarti, D., Kumar, R., Punera, K., 2008. A graph-theoretic approach to webpage
segmentation. In: Proceedings of the 17th international conference on World Wide Web. ACM, pp.
377–386.
Chaudhuri, B. B., Rosenfeld, A., 1999. A modified hausdorff distance between fuzzy sets.
Information Sciences 118 (1), 159–171.
Chechik, G., Sharma, V., Shalit, U., Bengio, S., 2010. Large scale online learning of image
similarity through ranking. Journal of Machine Learning Research 11 (Mar), 1109–1135.
Cilibrasi, R. L., et al., 2007. Statistical inference through data compression.
Cohen, J., 1960. A coefficient of agreement for nominal scales. Educational and
psychological measurement 20 (1), 37–46.
Connolly, C., Fleiss, T., 1997. A study of efficiency and accuracy in the transformation
from rgb to cielab color space. IEEE Transactions on Image Processing 6 (7), 1046–1048.
Connor, R., Simeoni, F., Iakovos, M., Moss, R., 2011. A bounded distance metric for
comparing tree structure. Information Systems 36 (4), 748–764.
Cording, P. H., Lyngby, K., 2011. Algorithms for web scraping. PDF] Available:
http://www2. imm. dtu. dk/pubdb/views/publicationdetails. php.
CrossBrowserTesting, 2017. https://crossbrowsertesting.com/ (accessed 17.03.04).
Daniel P. Huttenlocher, Gregory A. Klanderman, and William J. Rucklidge. 1993.
Comparing images using the Hausdorff distance. Pattern Analysis and Machine Intelligence, IEEE
Transactions on 15, 9 (1993), 850–863.
Dorner, D., 1996. The logic of failure: Recognizing and avoiding error in complex
situations. Basic Books.
Dubuisson, M.-P., Jain, A. K., 1994. A modified hausdorff distance for object matching.
In: Pattern Recognition, 1994. Vol. 1-Conference A: Computer Vision & Image Processing.,
Proceedings of the 12th IAPR International Conference on. Vol. 1. IEEE, pp. 566–568.
Eleni Michailidou, Simon Harper, and Sean Bechhofer. 2008. Visual complexity and
aesthetic perception of web pages. In Proceedings of the 26th annual ACM international conference
on Design of communication. ACM, 215–224.
Expression Web SuperPreview, 2011. https://www.microsoft.com/en-
ca/download/details.aspx?id=2020 (accessed 17.03.04).

156
Francisco Claude, Antonio Farina, Miguel A. Mart´ınez-Prieto, and Gonzalo Navarro.
2010. Compressed qgram indexing for highly repetitive biological sequences. In BioInformatics
and BioEngineering (BIBE), 2010 IEEE International Conference on. IEEE, 86–91.
Gupta, S., Kaiser, G., Neistadt, D., Grimm, P., 2003. Dom-based content extraction of html
documents. In: Proceedings of the 12th international conference on World Wide Web. ACM, pp.
207–214.
Gwet, K. L., 2014. Handbook of inter-rater reliability: The definitive guide to measuring
the extent of agreement among raters. Advanced Analytics, LLC.
Hattori, G., Hoashi, K., Matsumoto, K., Sugaya, F., 2007. Robust web page segmentation
for mobile terminal using content-distances and page layout information. In: Proceedings of the
16th international conference on World Wide Web. ACM, pp. 361–370.
Hauzeur, J., Mathy, L., De Maertelaer, V., 1999. Comparison between clinical evaluation
and ultrasonography in detecting hydrarthrosis of the knee. The Journal of rheumatology 26 (12),
2681–2683.
Herb Stevenson. 2012. Emergence: The Gestalt Approach to Change. (2012). Retrieved
April 18, 2016 from http://www.clevelandconsultinggroup.com/articles/emergence-gestalt-
approach-to-change.php
Hern andez, I., Rivero, C. R., Ruiz, D., Corchuelo, R., 2014. Cala: An unsupervised url-
based web page classification system. Knowledge-Based Systems 57, 168–180.
Huttenlocher, D. P., Klanderman, G. A., Rucklidge, W. J., 1993. Comparing images using
the hausdorff distance. IEEE Transactions on pattern analysis and machine intelligence 15 (9), 850–
863.
IE NetRenderer, 2017. https://netrenderer.com/ (accessed 17.03.04).
IETester, 2017. http://www.my-debugbar.com/wiki/IETester/HomePage (accessed
17.03.04).
Jeanine Romano, Jeffrey D. Kromrey, Jesse Coraggio, and Jeff Skowronek. 2006.
Appropriate statistics for ordinal level data: Should we really be using t-test and Cohen’s d for
evaluating group differences on the NSSE and other surveys. In annual meeting of the Florida
Association of Institutional Research. 1–33.
Jeremy M. Wolfe, Keith R. Kluender, Dennis M. Levi, Linda M. Bartoshuk, Rachel S.
Herz, Roberta L. Klatzky, Susan J. Lederman, and Daniel M. Merfeld. 2009. Sensation and Per-
ception (2nd ed.). Sinauer Associates Inc., Massachusetts, MA.
Johnson, G. M., Fairchild, M. D., 2003. A top down description of s-cielab and ciede2000.
Color Research & Application 28 (6), 425–435.

157
Jyotish Chandra Banerjee. 1994. Encyclopaedic Dictionary of psychological terms. MD
Publications Pvt. Ltd., New Delhi.
Kang, J., Yang, J., Choi, J., 2010. Repetition-based web page segmentation by detecting
tag patterns for small-screen devices. IEEE Transactions on Consumer Electronics 56 (2).
Koffka, K., 2013. Principles of Gestalt psychology. Vol. 44. Routledge.
Kohlsch utter, C., Nejdl, W., 2008. A densitometric approach to web page segmentation.
In: Proceedings of the 17th ACM conference on Information and knowledge management. ACM,
pp. 1173–1182.
Kurt Koffka. 2013. Principles of Gestalt psychology. Vol. 44. Routledge.
Kwitt, R., Uhl, A., 2008. Image similarity measurement by kullback-leibler divergences
between complex wavelet subband statistics for texture retrieval. In: Image Processing, 2008. ICIP
2008. 15th IEEE International Conference on. IEEE, pp. 933–936.
Landis, J. R., Koch, G. G., 1977. The measurement of observer agreement for categorical
data. biometrics, 159–174.
Lee, J.-H., Yeh,W.-C., Chuang, M.-C., 2015.Web page classification based on a simplified
swarm optimization. Applied Mathematics and Computation 270, 13–24.
Li, M., Chen, X., Li, X., Ma, B., Vit anyi, P. M., 2004. The similarity metric. IEEE
transactions on Information Theory 50 (12), 3250–3264.
Lin, S.-H., Ho, J.-M., 2002. Discovering informative content blocks from web documents.
In: Proceedings of the eighth ACM SIGKDD international conference on Knowledge discovery
and data mining. ACM, pp. 588–593.
Liu, H. X.,Wu, B., Liu, Y., Huang, M., Xu, Y. F., 2013. A discussion on printing color
difference tolerance by ciede2000 color difference formula. In: Applied Mechanics and Materials.
Vol. 262. Trans Tech Publ, pp. 96–99.
Liu, Z., Lagani`ere, R., 2007. Phase congruence measurement for image similarity
assessment. Pattern Recognition Letters 28 (1), 166–172.
Luo, M. R., Cui, G., Rigg, B., 2001. The development of the cie 2000 colour-diffierence
formula: Ciede2000. Color Research & Application 26 (5), 340–350.
M. Ronnier Luo, Guihua Cui, and B. Rigg. 2001. The development of the CIE 2000 colour-
difference formula: CIEDE2000. Color Research & Application 26, 5 (2001), 340–350.
M uller-Molina, A. J., Hirata, K., Shinohara, T., 2008. A tree distance function based on
multi-sets. In: Pacific-Asia Conference on Knowledge Discovery and Data Mining. Springer, pp.
87–98.

158
María Alpuente and Daniel Romero. 2009. A visual technique for web pages comparison.
Electronic Notes in Theoretical Computer Science 235 (2009), 3–18.
Mateusz Pawlik and Nikolaus Augsten. 2015. Efficient computation of the tree edit
distance. ACM Transactions on Database Systems (TODS) 40, 1 (2015), 3.
McCallum, A., Nigam, K., et al., 1998. A comparison of event models for naive bayes text
classification. In: AAAI-98 workshop on learning for text categorization. Vol. 752. Madison, WI,
pp. 41–48.
Ming Li, Xin Chen, Xin Li, Bin Ma, and Paul Vit anyi. 2004. The similarity metric.
Information Theory, IEEE Transactions on 50, 12 (2004), 3250–3264.
Onan, A., 2016. Classifier and feature set ensembles for web page classification. Journal
of Information Science 42 (2), 150–165.
Ou Wu, Haiqiang Zuo, Weiming Hu, and Bing Li. 2016. Multimodal Web Aesthetics
Assessment Based on Structural SVM and Multitask Fusion Learning. IEEE Transactions on
Multimedia 18, 6 (2016), 1062– 1076.
Palmer, S. E., 1990. Modern theories of gestalt perception. Mind & Language 5 (4), 289–
323.
Peng Shi, Lianhong Ding, and Bingwu Liu. 2008. Similarity computation of Web pages.
In Knowledge Acquisition and Modeling Workshop, 2008. KAM Workshop 2008. IEEE
International Symposium on. IEEE, 777–780.
Pereira, A. C., Eggertsson, H., Martinez-Mier, E. A., Mialhe, F. L., Eckert, G. J., Zero, D.
T., 2009. Validity of caries detection on occlusal surfaces and treatment decisions based on results
from multiple caries-detection methods. European journal of oral sciences 117 (1), 51–57.
Refaeilzadeh, P., Tang, L., Liu, H., 2009. Cross-validation. In: Encyclopedia of database
systems. Springer, pp. 532–538.
Reis, D. d. C., Golgher, P. B., Silva, A. S., Laender, A., 2004. Automatic web news
extraction using tree edit distance. In: Proceedings of the 13th international conference on World
Wide Web. ACM, pp. 502–511.
Rohlfing, T., 2012. Image similarity and tissue overlaps as surrogates for image registration
accuracy: widely used but unreliable. IEEE transactions on medical imaging 31 (2), 153–163.
Roshanbin, N., Miller, J., 2011. Finding homoglyphs-a step towards detecting unicode-
based visual spoofing attacks. Web Information System Engineering–WISE 2011, 1–14.
Routhu Srinivasa Rao and Syed Taqi Ali. 2015. A Computer Vision Technique to Detect
Phishing Attacks. In Communication Systems and Network Technologies (CSNT), 2015 Fifth
International Conference on. IEEE, 596–601.

159
Saar, T., Dumas, M., Kaljuve, M., Semenenko, N., 2016. Browserbite: cross-browser
testing via image processing.
Sampat, M. P., Wang, Z., Gupta, S., Bovik, A. C., Markey, M. K., 2009. Complex wavelet
structural similarity: A new image similarity index. IEEE transactions on image processing 18 (11),
2385–2401.
Shahbazi, A., Miller, J., 2014. Extended subtree: a new similarity function for tree
structured data. IEEE Transactions on knowledge and Data Engineering 26 (4), 864–877.
Sharma, G., Wu, W., Dalal, E. N., 2005. The ciede2000 color-diffierence formula:
Implementation notes, supplementary test data, and mathematical observations. Color Research &
Application 30 (1), 21–30.
Shauvik Roy Choudhary, Husayn Versee, and Alessandro Orso. 2010. WEBDIFF:
Automated identification of cross-browser issues in web applications. In Software Maintenance
(ICSM), 2010 IEEE International Conference on. IEEE, 1–10.
Shauvik Roy Choudhary, Mukul R Prasad, and Alessandro Orso. 2012. Crosscheck:
Combining crawling and differencing to better detect cross-browser incompatibilities in web
applications. In 2012 IEEE Fifth International Conference on Software Testing, Verification and
Validation. IEEE, 171–180.
Shauvik Roy Choudhary, Mukul R Prasad, and Alessandro Orso. 2013. X-PERT: accurate
identification of cross-browser issues in web applications. In Proceedings of the 2013 International
Conference on Software Engineering. IEEE Press, 702–711.
Sim, D.-G., Kwon, O.-K., Park, R.-H., 1999. Object matching algorithms using robust
hausdorff distance measures. IEEE Transactions on image processing 8 (3), 425–429.
Simon Harper, Eleni Michailidou, and Robert Stevens. 2009. Toward a definition of visual
complexity as an implicit measure of cognitive load. ACM Transactions on Applied Perception
(TAP) 6, 2 (2009), 10.
Software: Practice and Experience 46 (11), 1459–1477.
Song, R., Liu, H.,Wen, J.-R., Ma,W.-Y., 2004. Learning block importance models for web
pages. In: Proceedings of the 13th international conference on World Wide Web. ACM, pp. 203–
211.
Sternberg, R. J., Sternberg, K., 2016. Cognitive psychology. Nelson Education.
Stevenson, H., 2012. Emergence: The gestalt approach to change. Unleashing Executive
and Orzanizational Potential. Retrieved 7.

160
Sukru Eraslan, Yeliz Yesilada, and Simon Harper. 2016. Scanpath Trend Analysis on Web
Pag-es: Clustering Eye Tracking Scanpaths. ACM Transactions on the Web (TWEB) 10, 4 (2016),
20.
Tai, K.-C., 1979. The tree-to-tree correction problem. Journal of the ACM (JACM) 26 (3),
422–433.
Teh-Chung Chen, Scott Dick, and James Miller. 2010. Detecting visually similar web
pages: Application to phishing detection. ACM Transactions on Internet Technology (TOIT) 10, 2
(2010), 5.
Terwijn, S. A., Torenvliet, L., Vit anyi, P. M., 2011. Nonapproximability of the normalized
information distance. Journal of Computer and System Sciences 77 (4), 738–742.
Tewarie, P., Balk, L., Costello, F., Green, A., Martin, R., Schippling, S., Petzold, A., 2012.
The oscar-ib consensus criteria for retinal oct quality assessment. PloS one 7 (4), e34823.
Thiadmer Riemersma. 2008. Colour metric. (2008). Retrieved April 18, 2016 from
http://www.compuphase.com/cmetric.htm
Tõnis Saar, Marlon Dumas, Marti Kaljuve, and Nataliia Semenenko. 2015. Browserbite:
cross-browser testing via image processing. Software: Practice and Experience (2015).
Unwin, N., Alberti, K., Bhopal, R., Harland, J., Watson, W., White, M., 1998. Comparison
of the current who and new ada criteria for the diagnosis of diabetes mellitus in three ethnic groups
in the uk. Diabetic medicine 15 (7), 554–557.
Wei, Y., Wang, B., Liu, Y., Lv, F., 2014. Research on webpage similarity computing
technology based on visual blocks. In: Chinese National Conference on Social Media Processing.
Springer, pp. 187–197.
Xu, Z., Miller, J., 2016. Identifying semantic blocks in web pages using gestalt laws of
grouping. World Wide Web. 19 (5), 957–978.
Yasufumi Takama and Noriaki Mitsuhashi. 2005. Visual similarity comparison for Web
page retrieval. In Web Intelligence, 2005. Proceedings. The 2005 IEEE/WIC/ACM International
Conference on. IEEE, 301–304.
Yu, S., Cai, D., Wen, J.-R., Ma, W.-Y., 2003. Improving pseudo-relevance feedback in
web information retrieval using web page segmentation. In: Proceedings of the 12th international
conference on World Wide Web. ACM, pp. 11–18.
Zhai, Y., Liu, B., 2006. Structured data extraction from the web based on partial tree
alignment. IEEE Transactions on Knowledge and Data Engineering 18 (12), 1614–1628. 12
Zhao, C., Shi, W., Deng, Y., 2005. A new hausdorff distance for image matching. Pattern
Recognition Letters 26 (5), 581–586.

161
Zhen Xu and James Miller. 2015a. Identifying semantic blocks in Web pages using Gestalt
laws of grouping. World Wide Web (2015), 1–22.
Zhen Xu and James Miller. 2015b. A New Webpage Classification Model Based on Visual
In-formation Using Gestalt Laws of Grouping. In International Conference on Web Infor-mation
Systems Engineering. Springer, 225–232.
Zhen Xu and James Miller. 2017. Estimating Similarity of Rich Internet Pages Using
Visual Information, International Journal of Web Engineering and Technology.


![Paper Gestalt - GitHub Pages · the “paper gestalt”. To build our system, we use powerful statistical learning techniques [4]. The rest of the paper is laid out as follows. In](https://static.fdocuments.net/doc/165x107/5f65d3f4588a41624d7de0e2/paper-gestalt-github-pages-the-aoepaper-gestalta-to-build-our-system-we-use.jpg)