Visual environment for editing and solving flowsheets ... · duce heat and material balances for...
120
Visual Environment for Editing and Solving Flowsheets Konstantinos Raptis September 2017
-
Upload
phungquynh -
Category
Documents
-
view
217 -
download
0
Transcript of Visual environment for editing and solving flowsheets ... · duce heat and material balances for...

Visual Environment for Editing and
Solving Flowsheets
Konstantinos Raptis
September 2017


Visual Environment for Editing and Solving Flowsheets Design and implementation of a visual environment for editing and solving flowsheets to pro-
duce heat and material balances for urea plant designs
Konstantinos Raptis
Eindhoven University of Technology
Stan Ackermans Institute / Software Technology
Partners
Stamicarbon B.V. Eindhoven University of Technology
Steering Group ir. Rob Faessen (Stamicarbon)
prof. dr. Mark van den Brand (TU/e)
Date
Document Status
September 2017
Public
PDEng report no. 2017/043
The design described in this report has been carried out in accordance with the TU/e Code of Scientific Conduct.

Contact
Address
Eindhoven University of Technology
Department of Mathematics and Computer Science
MF 5.080A, P.O. Box 513, NL-5600 MB, Eindhoven, The Netherlands
+31402474334
Published by Eindhoven University of Technology
Stan Ackermans Institute
Printed by Eindhoven University of Technology
UniversiteitsDrukkerij
PDEng report no. 2017/043
Abstract Urea is an organic compound that is used widely as a fertilizer to increase the crop size and
the yield. Urea is produced from ammonia and carbon dioxide in urea plants. Stamicarbon’s
main activity is designing and licensing urea plants. An important activity of the process
engineers at Stamicarbon consists of the design of the flowsheet and the calculation of the
solution of the heat and material balances for the urea plant. Improving the productivity of
the process engineers and shortening the learning curve of the new process engineers is of
great importance to Stamicarbon. Stamicarbon’s vision is to the change the flowsheet de-
sign from text-based to graphics-based. This project aimed to implement a graphics-based
solution that would increase the comprehension of the structure and the state of the flow-
sheet design. This project also aimed to enable the process engineers to visually merge
plant sections that could be reused in flowsheet designs. Finally, a part of this project in-
volved the integration of the graphics-based editor and the flowsheet solver into one tool.
The three major design criteria are usability, navigability, and extensibility. The main tools
used for the implementation of this project are the Eclipse Modeling Framework (EMF)
and the Eclipse Sirius. The domain model is designed with EMF. The visual representations
are created with Eclipse Sirius. The architecture of the system is plug-in based. The final
prototype is deployed as an RCP outside the Eclipse IDE.
Keywords
Flowsheet, heat and material balances, EMF, Eclipse Sirius, Stamicarbon, TUE, PDEng,
software technology
Preferred
reference
Visual environment for editing and solving flowsheets: Design and implementation of a
visual environment for editing and solving flowsheets to produce heat and material bal-
ances for urea plant designs. PDEng Technical Report, September 2017. (2017/043)

Partnership This project was supported by Eindhoven University of Technology and Stamicarbon.
Disclaimer
Endorsement
Reference herein to any specific commercial products, process, or service by trade name,
trademark, manufacturer, or otherwise, does not necessarily constitute or imply its endorse-
ment, recommendation, or favoring by the Eindhoven University of Technology or Stami-
carbon. The views and opinions of authors expressed herein do not necessarily state or re-
flect those of the Eindhoven University of Technology or Stamicarbon, and shall not be used
for advertising or product endorsement purposes.
Disclaimer
Liability
While every effort will be made to ensure that the information contained within this report
is accurate and up to date, Eindhoven University of Technology makes no warranty, repre-
sentation or undertaking whether expressed or implied, nor does it assume any legal liability,
whether direct or indirect, or responsibility for the accuracy, completeness, or usefulness of
any information.
Trademarks Product and company names mentioned herein may be trademarks and/or service marks of
their respective owners. We use these names without any particular endorsement or with the
intent to infringe the copyright of the respective owners.
Copyright Copyright © 2017. Eindhoven University of Technology. All rights reserved.
No part of the material protected by this copyright notice may be reproduced, modified, or
redistributed in any form or by any means, electronic or mechanical, including photocopy-
ing, recording, or by any information storage or retrieval system, without the prior written
permission of the Eindhoven University of Technology and Stamicarbon.


Foreword Automation is a key driver for improving productivity. Tasks that were performed
manually in the past are currently being executed by machines that get the job done
faster and better and thus cheaper. This is not only the case in industries that produce
tangible artefacts like machines and consumer goods but also in the services sector
where engineering companies like Stamicarbon produce design information. Here the
essence is to instruct a computer to solve a particular engineering problem, which is to
find a design that meets specific requirements within specific design constrains. At
Stamicarbon the end-product is a Process Design Package (PDP) for urea plants. It
contains the necessary information (minimum requirements) for further detailed design
and construction of a urea plant. An essential part of a PDP are Heat and Material
Balances (H&MB).
Creating a H&MB is repetitive task executed by an engineer and supported by a com-
puter which requires flexibility with respect to the specification of requirements and
design constraints. For that purpose Stamicarbon uses an in-house developed software
tool called Tisflo whose origin dates back to the mid 70ties of the last century. This
tool’s strengths are also its weaknesses on two levels: the tool smith’s level and prac-
titioner’s level. The tool smith is confronted with a FORTRAN implementation (par-
ser, domain model, and solver) that is compact and fast but undocumented, ill-struc-
tured and hardly maintainable which hampers modification and extension of the tool.
The practitioner is confronted with an extremely fast flowsheet solver and a very flex-
ible but archaic, hard-to-learn and error-prone low level problem specification lan-
guage with little help on diagnosing specification problems. Productivity gain is only
to be expected when the weaknesses on both levels are addressed: specification on
higher levels of abstraction both of the tool itself as well as the problems to be solved
by the tool.
Model Driven Software Engineering promises to be the perfect candidate for the rede-
sign job of the software. It should get you from A to B fast and good and improve
productivity. This is why Stamicarbon embarked on journey for a step-wise transfor-
mation of Tisflo: a first step (in hind sight a side step) was to wrap the essential
FORTRAN code in C++ wrappers, rewrite the parser (using ANTLR), the domain
model and the solver in C++ and produce a functional kernel. A second more funda-
mental step was the development of an EMF based meta-model for the flowsheet do-
main that allows easy integration with a graphical front and allows for M2M and M2T
transformations serving and increasing both the productivity of the tool smith and the
practitioners. The thesis you are about to read reflects the work done by Konstantinos
Raptis on developing the meta-model and the graphical front-end for Tisflo 2.0 whose
result shows that MDSE is truly bringing value to development and deployment of
real-world engineering tools. We are not there yet but we have taken a first step in the
right direction. On behalf of the colleagues in Stamicarbon I would like to thank Kostas
and his TU/e mentor prof. dr. Mark van den Brand for the efforts they put into the
project. I hope you enjoy reading Kostas’ thesis.
ir. Rob Faessen
August 2017

iii
iv
Preface
This report summarizes the “Visual environment for editing and solving flow-
sheets” project. The project was carried out by Konstantinos Raptis as a final as-
signment for the Professional Doctorate in Engineering (PDEng) program in Soft-
ware Technology (ST). The program is provided by the Stan Ackermans Institute
of the Eindhoven University of Technology. The project was executed over a pe-
riod of a nine-months at the end of the two-year program, under supervision of
Stamicarbon B.V. in Sittard.
This report is primarily intended for a reader with a technical background in differ-
ent disciplines, such as model-based engineering, visual editing, and general soft-
ware engineering.
Chapters 1 to 4 are more suitable for readers with a non-technical background who
are interested in getting an introduction about the project, the problem, and learning
details about process flow diagrams from urea plant designs.
Chapters 6 to 10 are more interesting for readers with a technical background.
These chapters cover the system requirements, the system architecture, the system
implementation, the verification and validation, and the deployment of the project.
Finally, Chapters 2, 5, 11, 12, and 13 cover the project management, conclusions,
and the project retrospective.
Konstantinos Raptis
September 2017

v


vii
Acknowledgements
I would like to express my sincere gratitude to all the people who helped me, guided
me, and supported me during this nine-month project. This project was a great ex-
perience for me and the success would not be possible without them.
First of all, I would like to thank all the people working at Stamicarbon for their
support and the great working atmosphere that they provided me during this pro-
ject. More specifically, I would like to thank my Stamicarbon supervisor, Rob
Faessen, for his guidance, knowledge, and enthusiasm that contributed to the suc-
cess of this project. I would also like to thank Harry Welten for the support and
valuable information that helped me understand the domain. Furthermore, I would
like to thank process engineers, Chuanbo Gao, Gijs de Jong, Hoa Bui, Paz Munoz,
Rahul Patil, Veronica Rivas, and Yuniyono Kho. Finally, I would like to express
my thanks to the Head of the Process Department Harold Borkink.
I also owe the success of this project to my university supervisor, prof. dr. Mark
van den Brand who pinpointed improvements of the project and gave me valuable
feedback. His expertise in model-driven software engineering encouraged me to
explore different angles and views of the project.
Moreover, I would like to thank everyone involved in the PDEng program during
the past two years. More specifically I would to thank our program directors, dr.
Ad Aerts and dr. Yanja Dajsuren PDEng; our secretary, Desiree van Oorschot; and
all the OOTI coaches.
Furthermore, I would like to thank my colleagues from the PDEng program for the
experiences was shared during the past two years. It was a great opportunity for me
to meet people from different cultures and work with them.
Last but not least, I would like to thank my family, friends, and girlfriend for all
the support and trust that they gave me.
Konstantinos Raptis
September 2017

viii

ix
Executive Summary
The world’s population is increasing by more than 1% per year. More than 7.4
billion humans live on earth. This number is expected to be more than 9 billion by
2040 [1]. As the number of humans is increasing, the demand for food is also in-
creasing. Since the area of the world’s agricultural land is expected to be almost
the same in the next 20 years [2] a solution for producing enough food has to come
from somewhere else. Urea can be used to increase the global food production.
Urea is an organic compound that is used widely as a fertilizer to increase the crop
size and the yield. Urea is synthesized in chemical plants from ammonia and carbon
dioxide.
Stamicarbon’s main activity is licensing urea plants. The licensing requires the col-
laboration of people from different engineering disciplines, for example, process
engineers, process control engineers, and mechanical engineers. An important task
of the process engineers at Stamicarbon consists of the design of flowsheet dia-
grams and the calculation of the heat and material balances.
Process engineers at Stamicarbon design flowsheet diagrams with a text editor. The
flowsheet diagrams are specified in text format that has a rigid layout; an extra
space could make the text file invalid. A second tool is used for the calculation of
the heat and material balances. This tool is called Tisflo.
Improving the productivity of the current process engineers and shortening the
learning curve of the new process engineers is of great importance to Stamicarbon.
Stamicarbon’s vision is to the change the flowsheet design from text-based to
graphics-based.
A famous English language proverb says “a picture is worth a thousand words.”
This project aimed to provide a graphics-based solution that would increase the
comprehension of the structure and the state of the flowsheet design. Editable forms
aimed to eliminate the number of errors made because of the rigid layout of the text
files. This project also aimed to enable the process engineers to visually merge
plant parts that could be reused between different designs. Finally, a part of this
project involved the integration of the editor and the solver into one tool.
This report presents the architecture, the design, and the implementation of the
graphical-based Tisflo. The three major design criteria are usability, navigability,
and extensibility. The main tools used for the implementation of this project are the
Eclipse Modeling Framework (EMF) and the Eclipse Sirius. The domain model is
designed with EMF. The visual representations are created with Eclipse Sirius. The
architecture of the system is plug-in based. The final prototype is deployed as an
RCP outside the Eclipse IDE.
In conclusion, the prototype is the first version of the graphical-based Tisflo that
calculates the heat and material balances of urea plant designs. According to the
feedback from the process engineers the prototype achieved the main goals and
aims of the project, although extra functionality needs to be added until it can fully
replace the old tools. The extra functionality is mentioned as a future work in this
report.

x

xi
Table of Contents
Foreword ................................................................................................... ii
Preface ...................................................................................................... iv
Acknowledgements ................................................................................. vii
Executive Summary ................................................................................. ix
Table of Contents ..................................................................................... xi
List of Figures ........................................................................................ xvi
List of Tables ........................................................................................ xviii
1. Introduction ....................................................................................... 1
1.1 About Stamicarbon ....................................................................... 1
1.2 About urea .................................................................................... 1
1.3 Life cycle of a urea plant .............................................................. 2
1.4 Process engineers’ responsibilities .............................................. 3
1.5 Project introduction ..................................................................... 3
1.6 Outline .......................................................................................... 4
2. Stakeholder Analysis ......................................................................... 7
2.1 Stamicarbon ................................................................................. 7
2.2 Eindhoven University of Technology (TU/e) ................................ 7
3. Problem Analysis ............................................................................. 11
3.1 Introduction ................................................................................ 11
3.2 Text files ..................................................................................... 11 3.2.1. Text files example ................................................................... 12
3.3 Text editor .................................................................................. 13 3.3.1. Text editing example ............................................................... 13
3.4 Tisflo ........................................................................................... 13 3.4.1. Tisflo example ......................................................................... 14
3.5 New tool ..................................................................................... 15
3.6 Design Criteria ........................................................................... 15
4. Domain Analysis .............................................................................. 19
4.1 Introduction ................................................................................ 19
4.2 Process flow diagrams ............................................................... 19
4.3 Heat and material balances calculation .................................... 20 4.3.1. Heat and material balances calculation example ..................... 21

xii
5. Feasibility Analysis .......................................................................... 25
5.1 Potential issues and challenges .................................................. 25
5.2 Potential risks ............................................................................. 25
6. System Requirements ...................................................................... 31
6.1 Requirements gathering process ................................................ 31
6.2 High-level requirements and use cases ...................................... 31 6.2.1. Use cases.................................................................................. 31 6.2.2. Technology constraints ............................................................ 34
6.3 Detailed requirements ................................................................ 34 6.3.1. User functional requirements ................................................... 35 6.3.2. System Functional requirements .............................................. 35
6.4 Non-functional requirements ...................................................... 36 6.4.1. Ease of use ............................................................................... 36 6.4.2. Performance ............................................................................. 36 6.4.3. Extensibility ............................................................................. 36
7. System Architecture ........................................................................ 39
7.1 Architecture before this project .................................................. 39
7.2 Architecture decision .................................................................. 40
7.3 Plug-in architecture ................................................................... 40 7.3.1. Eclipse platform plug-in .......................................................... 41 7.3.2. Plug-in architecture advantages ............................................... 41
7.4 Architecture of the project .......................................................... 41 7.4.1. Meta-model plug-in ................................................................. 42 7.4.2. Sirius plug-in ........................................................................... 42 7.4.3. RCP .......................................................................................... 42 7.4.4. Branding plug-in ...................................................................... 43 7.4.5. Back-end components .............................................................. 43 7.4.6. Data files .................................................................................. 43
8. System Design and Implementation ............................................... 45
8.1 Introduction ................................................................................ 45
8.2 Logical view ............................................................................... 46 8.2.1. Meta-model .............................................................................. 46 8.2.2. Synchronization of the model instances with the kernel
instances ............................................................................................ 50 8.2.3. Sirius ........................................................................................ 50
8.3 Process view ............................................................................... 51 8.3.1. Creation of the model instances ............................................... 51 8.3.2. Simulation of a flowsheet ........................................................ 52
8.4 Development view....................................................................... 53 8.4.1. Development view of the Tisflo meta-model plug-in .............. 54 8.4.2. Development view of the Tisflo Sirius plug-in ....................... 57
8.5 Physical view .............................................................................. 57
9. Validation and Verification ............................................................ 59
xiii
9.1 Validation ................................................................................... 59 9.1.1. Survey ...................................................................................... 59
9.2 Verification ................................................................................. 61 9.2.1. Manual testing ......................................................................... 61 9.2.2. Unit testing .............................................................................. 61
9.3 Dynamic program analysis ........................................................ 61
10. Deployment ................................................................................... 65
10.1 Deployment view .................................................................... 65
10.2 How to build and deploy the application ................................ 65 10.2.1. Maven .................................................................................... 65 10.2.2. OSGi ...................................................................................... 66 10.2.3. Tycho ..................................................................................... 66 10.2.4. Tisflo plug-in projects ........................................................... 66 10.2.5. Tisflo feature project ............................................................. 66 10.2.6. Tisflo product project ............................................................ 66 10.2.7. Tisflo parent project .............................................................. 67
11. Conclusions ................................................................................... 69
11.1 Results..................................................................................... 69
11.2 Future work ............................................................................ 69
12. Project Management .................................................................... 73
12.1 Way of working ....................................................................... 73
12.2 Work-Breakdown Structure (WBS) ......................................... 74
12.3 Project Planning ..................................................................... 74 12.3.1. Initial version ......................................................................... 74 12.3.2. Final version .......................................................................... 75
12.4 Project execution .................................................................... 75
13. Project Retrospective ................................................................... 77
13.1 Reflection ................................................................................ 77
13.2 Design criteria revisited ......................................................... 78
Glossary ................................................................................................... 81
Bibliography ............................................................................................ 83
Appendix A: The complete meta-model ............................................... 87
Appendix B: Comparison between textual representations and visual
representations ........................................................................................ 88
About the Author .................................................................................... 93


xv
xvi
List of Figures
Figure 1 Urea plant ....................................................................................... 1 Figure 2 Life cycle of a new urea plant ............................................................ 2 Figure 3 Process flow diagram ....................................................................... 3 Figure 4 Flowsheet diagram with 2 nodes and 4 streams ................................ 12 Figure 5 Textual representation of Figure 4 ................................................... 12 Figure 6 Invalid textual representation of Figure 4 ......................................... 12 Figure 7 Flowsheet diagram with the addition of stream STR5 ........................ 13 Figure 8 Textual representation with the addition of stream STR5 ................... 13 Figure 9 Process flow diagram ..................................................................... 19 Figure 10 Synthesis section .......................................................................... 20 Figure 11 Reactor in a urea process flow diagram ......................................... 20 Figure 12 Streams in a process flow diagram ................................................. 20 Figure 13 Main use cases ............................................................................. 32 Figure 14 Information flow before this project ............................................... 39 Figure 15 Flowsheet solver architecture before this project ............................ 40 Figure 16 Eclipse architecture ...................................................................... 41 Figure 17 High-level architecture of this project ............................................ 42 Figure 18 Information flow of the project ...................................................... 43 Figure 19 4+1 view model ............................................................................ 45 Figure 20 Meta-Object Facility layers example .............................................. 46 Figure 21 Part of the meta-model.................................................................. 47 Figure 22 Sequence diagram representing the creation of the chemical component
instances ............................................................................................. 52 Figure 23 Activity diagram representing the simulation of a flowsheet ............. 53 Figure 24 Deployment view of the Tisflo meta-model plug-in .......................... 54 Figure 25 Deployment view of the Tisflo plug-in (generated code) ................... 54 Figure 26 Deployment view of the Tisflo plug-in (other code) .......................... 55 Figure 27 Deployment view of the Tisflo edit plug-in ...................................... 56 Figure 28 Deployment view of the Tisflo editor plug-in ................................... 56 Figure 29 Deployment view of the Tisflo Sirius plug-in ................................... 57 Figure 30 Unit tests for the JNI functions ...................................................... 61 Figure 31 Deployment view of the application................................................ 65 Figure 32 Part of the Tisflo parent pom.xml ................................................... 67 Figure 33 Agile lifecycle .............................................................................. 73 Figure 34 Work-breakdown structure of the project ........................................ 74 Figure 35 Initial project planning ................................................................. 75 Figure 36 Final project planning .................................................................. 75 Figure 37 The complete meta-model .............................................................. 87 Figure 38 Input and output streams of a section in a textual representation ...... 88 Figure 39 Input and output streams of a section in a visual representation ....... 88 Figure 40 Streams and nodes in textual representation ................................... 89 Figure 41 Streams and nodes in visual representation .................................... 89 Figure 42 Information of the variables of stream 113 in a textual representation
.......................................................................................................... 90 Figure 43 Information of the variables of stream 113 in a visual representation 90

xvii

xviii
List of Tables
Table 1 Stream matrix .................................................................................. 14 Table 2 Stream matrix with chemical components A and B .............................. 14 Table 3 Result of the stream matrix with chemical components A and B ........... 14 Table 4 Stream matrix with a determined problem .......................................... 21 Table 5 Stream matrix with an over-determined problem ................................ 22 Table 6 Stream matrix with an under-determined problem .............................. 22 Table 7 Stream matrix with labels ................................................................. 22 Table 8 Process risks ................................................................................... 27 Table 9 Technical risks ................................................................................ 27 Table 10 Create flowsheet canvas use case specification ................................. 32 Table 11 Load section use case specification.................................................. 32 Table 12 View variables of a section use case specification ............................. 33 Table 13 Modify variable value use case specification .................................... 33 Table 14 Merge sections use case specification .............................................. 33 Table 15 Simulate flowsheet use case specification ......................................... 34 Table 16 User functional requirements .......................................................... 35 Table 17 System Functional Requirements ..................................................... 35 Table 18 Survey questions ............................................................................ 60 Table 19 Survey statements ........................................................................... 60

xix


1
1.Introduction
This chapter introduces Stamicarbon as a company. The project and its context are
briefly mentioned. The outline section at the end of this chapter gives a brief overview
of what is discussed in the following chapters.
1.1 About Stamicarbon Stamicarbon was founded in 1947 and currently is a member of Maire Tecnimont SpA.
Stamicarbon’s main activity is the development and the licensing of urea technology
for the fertilizer industry. More than 250 urea plants around the world are based on
Stamicarbon’s technology to produce urea, which adds nutrients to crops, replenishes
arable land, and increases crop yields [3].
Figure 1 Urea plant
Licensing commercializes the know-how that has been developed and patented over
the years as a result of Research and Development activities and experience gained of
plant operations. Stamicarbon designs have to meet customers’ needs with respect to
safety, product quality and quantity, reliability, emissions, and energy consumption.
1.2 About urea Urea is an organic compound with the chemical formula CO(NH2)2. Since its discovery
in 1773, urea has become the most important nitrogen-based fertilizer in the world.

2
Urea is produced from a mixture of simple inorganic molecules (ammonia and carbon
dioxide); the white crystalline organic compound contains about 46% nitrogen.
The vast majority of urea is used in the agricultural sector as a fertilizer to increase
crop yield and as an additive for animal feed. Urea is also used as a base product in the
manufacture of resins and commercial adhesives. Cosmetics products, for instance,
hair conditioners, tooth-whitening, and facial cleaners might contain urea. Cars and
trucks use urea in the exhaust gas catalysts in order to reduce the NOX emissions.
Urea facts [4]:
Urea is the world's most produced chemical.
Over 190 million tons of urea is produced each year.
Over 80% of urea is used to fertilize crops.
Demand for urea fertilizer is growing at over 3% (faster than the global rise
in population).
1.3 Life cycle of a urea plant Stamicarbon’s main activity is licensing new urea plants, maintaining, upgrading and
optimizing existing plants. Each license requires the collaboration of many people
from different engineering disciplines, for example, process engineers, process control
engineers, and mechanical engineers.
Figure 2 Life cycle of a new urea plant
The life cycle of a project depends on the type of the project and on the customer
requirements. An average time of three years from a concept proposed by a customer
to an actual new plant that produces urea is required. Projects that involve optimization
or upgrade of an existing plant start with a feasibility study; however, this phase is
omitted in projects that involve the creation of a new urea plant. For a new urea plant
projects Stamicarbon delivers a proposal to the customer about the equipment that can
be used, an estimation of the costs of the project, the process flow diagrams, and the
heat and material balances of the plant.
The next stage is the conceptual process engineering phase. At the end of this stage the
customer receives the Process Design Package (PDP). The PDP contains documents

3
with more detailed information about the plant, for instance, the piping and instrumen-
tation diagrams, and equipment datasheets, in addition to the process flow diagrams,
and the heat and material balances with minor changes for tuning purposes.
The next stage is the basic engineering phase. In this phase a company of the Maire
Tecnimont group delivers to the customer and to the constructors the Basic Engineer-
ing Package (BEP). The BEP contains more detailed information about the construc-
tion, for instance, the physical position of the equipment. Finally, Stamicarbon is also
involved during the detailed Engineering, Procurement, and Construction (EPC) phase
of the plant in order to verify if it functions according to its design objectives and
specifications. At the end of a three year period the plant is ready to operate.
1.4 Process engineers’ responsibilities In order to meet customers’ needs for licensing a urea plant, a part of the process en-
gineers’ job is designing process flow diagrams and calculating the heat and material
balances based on the process flow diagram. A process flow diagram is the conceptual
layout of a plant. A process flow diagram indicate the equipment and the main process
streams between the equipment. A process engineer spends a week on the design of a
process flow diagram.
Figure 3 Process flow diagram
A heat and material balance is a document produced by process design engineers. The
heat and material balance document includes operating conditions, composition and
key physical properties of every major process stream on the process flow diagram.
The calculation of the heat and material balances is performed by applying the mass
balance equation and the energy balance equation to each piece of equipment. A pro-
cess engineer spends five weeks on the calculation of the heat and material balances.
1.5 Project introduction The idea behind the project is the utilization of a new tool that the process engineers
could use for creating or editing flowsheet diagrams and calculating the heat and ma-
terial balances.
The process engineers are currently using text files with a rigid layout for storing the
definition of urea plant designs and for specifying what heat and material balances are
calculated. However, the rigid layout could lead to many errors. In order to create or

4
edit a urea plant design and calculate the heat and material balances, the process engi-
neers have to use two different tools.
The first tool is a text editor to create or modify the structure of a urea plant design.
For example, a process engineer can use a text editor for adding a new stream or chang-
ing the name of an existing stream. However, the process engineers have to be very
careful while editing because of the rigid layout that the files have.
The second tool is a flowsheet solver. The process engineers use the flowsheet solver
for calculating the heat and material balances of a urea plant design. However, the
process engineers using the flowsheet solver cannot modify the structure of a urea plant
design.
It is worth mentioning that the process engineers are mostly working on files that con-
tain information of a complete urea plant and not on files that contain different parts
of a urea plant. The main reason for not working on files containing different parts is
again the rigid layout that the files have. Combining all the different plant parts into
one could lead to many errors.
This project focuses on a graphics-based tool that could increase the comprehension of
the structure and the state of the flowsheet design. This project also focuses on a tool
that the process engineers could use for combining different plant sections into one.
The elements contained in the different sections have to be editable and the tool has to
allow the process engineers to simulate the plant sections or the complete plant. In
addition, the new tool has to provide ways to eliminate syntax errors made with the
text editors. Finally, the new tool has to integrate the graphics-based editor and the
flowsheet solver into one tool.
1.6 Outline The next chapter introduces the stakeholders involved in this project as well as their
goals and interests. After the presentation of the stakeholders, the problem analysis is
presented (Chapter 3), which describes the aspects and the expectations of the project.
Next, the domain analysis is presented (Chapter 4), namely urea plant designs.
Chapter 5 presents the feasibility analysis of the problem. Potential issues, challenges,
and risks are identified are presented. After the feasibility analysis, the system require-
ments are presented in Chapter 6. The requirements are presented in two categories the
functions and the non-functional.
Chapter 7 presents the system architecture. Chapter 8 presents the system design and
implementation. Design decisions are also covered on this chapter. Next, Chapter 9,
elaborates on the verification and validation. Chapter 10 depicts the deployment of the
system.
Chapter 11 discusses the results and future work for the project. Chapter 12 reflects on
the project management. Finally, Chapter 13 presents the retrospective of the project
from the author’s point of view.

5


7
2.Stakeholder Analysis
In the previous chapter an introduction about Stamicarbon is given.
This chapter analyzes the stakeholders involved in the project, their interests, and their
goals. The two main parties involved in the project are Stamicarbon and Eindhoven
University of Technology.
2.1 Stamicarbon Stamicarbon is the project owner. Stamicarbon has two interests as their key drivers
for the project. The first interest is to shorten the learning curve for new engineers.
New process engineers receive six month training courses to learn the domain and the
company’s software tools. Stamicarbon is also interested in improving the productivity
of process engineers. Process engineers use two separate text-based environments for
designing urea plants. In order to achieve the aforementioned interests Stamicarbon
envisions a new graphic-based environment for designing urea plants.
The Stamicarbon stakeholders can be grouped in two categories:
1) Process Control and Modelling Department:
Process Control and Modelling Department
Name Role
Rob Faessen
Head of Department
Project supervisor and owner. Member of the Progress
Steering Group. Manages project progress and defines
priorities and requirements. Provides knowledge about
the existing software tools and extends the back-end code.
Harry Welten
Technical Software
Engineer
Provides knowledge about the existing software tools and
is responsible for extending the back-end code.
2) Process Engineering Department:
Process Engineer Department
Name Role
Chuanbo Gao
Gijs de Jong
Hoa Bui
Harold Borkink
Paz Munoz
Rahul Patil
Veronica Rivas
Yuniyono Kho
The actual users of the deliverable of the project. Provide
feedback and request new features.
2.2 Eindhoven University of Technology (TU/e) The Eindhoven University of Technology is responsible for the educational aspect of
the project. The educational aspects of the project are related to the software design
process, project implementation, project management, and risk management. That
means certain standards have to be met.
TU/e Stakeholders
Name Role
Ad Aerts Ensures the quality and the deliverables of the project
that are in line with the program standards.

8
Program Director of
PDEng in Software
Technology
Mark van den Brand
TU/e Supervisor
Ensures quality of the design and the scientific aspect of
the report.
Yanja Dajsuren Program Director of
PDEng in Software
Technology
Ensures the quality and the deliverables of the project
that are in line with the program standards.
Konstantinos Raptis
PDEng Candidate
Responsible for the design and the implementation of the
project. In parallel, responsible for matching project re-
sults with company and university standards.

9


11
3.Problem Analysis
In the previous chapter the stakeholders and their interests are mentioned.
This chapter focuses on the problem that this project is trying to solve. First, there is
an introduction about the project and the problem. Next, there is an introduction and
brief explanation about how the process engineers interact with the text files, the text
editor, and the flowsheet solver. Finally, reasons why a new tool for the process engi-
neers is needed, are given.
3.1 Introduction The flowsheet design of a urea plant is an important step for the calculation of the heat
and material balances that are needed for granting a license. New process engineers
receive six month training courses in order to learn the domain and the company’s
software tools. A process engineer on average can calculate the heat and material bal-
ances in five weeks. Stamicarbon is interested in ways that can shorten the learning
curve of new engineers and improve the productivity of the process engineers.
The information needed for the heat and material balances of a plant is stored in text
files, for instance, in a text file the process engineers specify what heat and material
balances will be calculated. The text files have two big downsides. The first is a rigid
layout. The second is the limited overview that they provide to the process engineers,
for example, the best way for a process engineer to find where a specific artifact is used
is to search for the name of the artifact within the text.
In order to create or edit a urea plant design and calculate the heat and material bal-
ances, the process engineers use two different tools. A text editor is a tool that the
process engineers use for creating or modifying the structure and the state of a urea
plant design. The flowsheet solver is the tool that the process engineers use for calcu-
lating the heat and material balances of a urea plant design. Tisflo is the name of the
flowsheet solver that the process engineers use.
This project aims at designing and implementing a tool that could be used both as an
editor and as a flowsheet solver and it would provide visual representations of the dif-
ferent artifacts. Another aim of the tool is to allow the process engineers to work on
small parts that could be reused between different designs. The tool aims to allow pro-
cess engineers to merge the different parts for the definition of a urea plant design. By
providing a merge functionality, it would possible to allow the process engineers to
work simultaneously on different parts of the same plant. In general, the new tool aims
to improve the productivity and the overview that the process engineers have about the
urea plant designs.
3.2 Text files The text files contain the information needed for the calculation of heat and material
balances. The information required is:
Process definition
Process determination
The definition should include the following specifications:
Chemical components occurring in the process
Nodes involved and how they are linked
The determination consists of:
Specification of known data
12
Requirements
The file extension of the text files is DAT. The text in the file has to follow a strict
syntax and each character should be placed in a specific position. A text editor is a tool
that the process engineers use for creating or editing text files. A process engineer can
load a text file to Tisflo for calculating the heat and material balances.
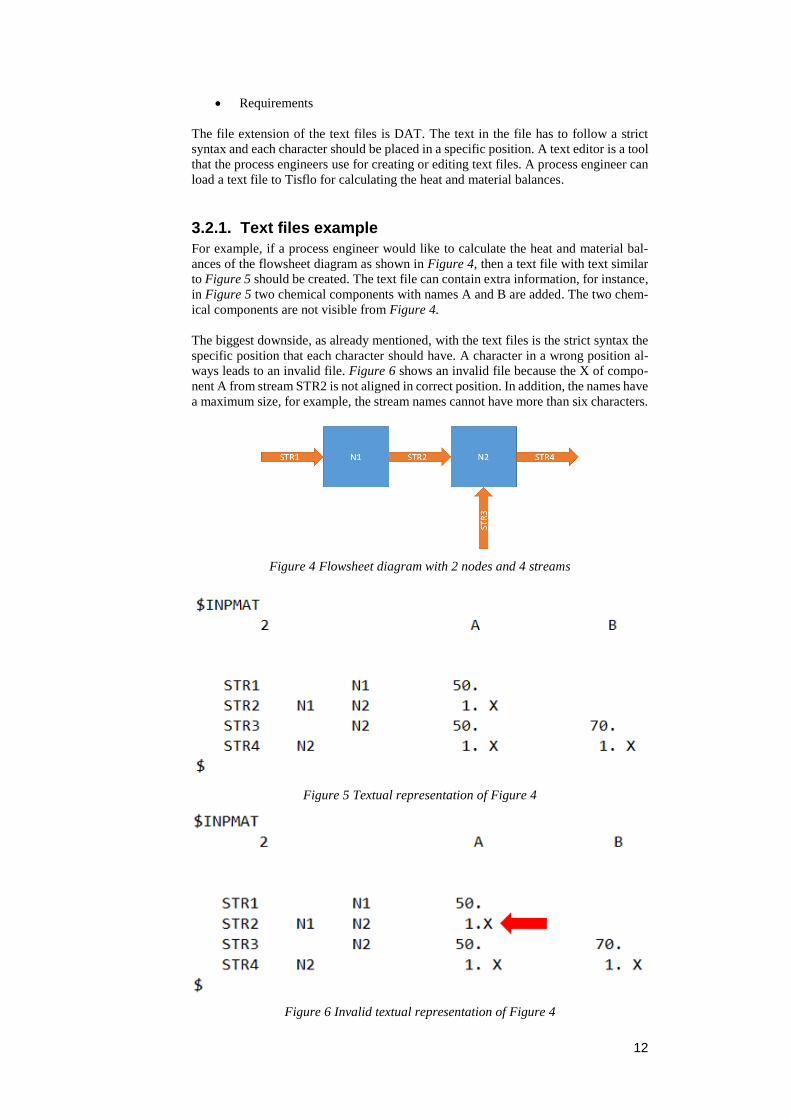
3.2.1. Text files example
For example, if a process engineer would like to calculate the heat and material bal-
ances of the flowsheet diagram as shown in Figure 4, then a text file with text similar
to Figure 5 should be created. The text file can contain extra information, for instance,
in Figure 5 two chemical components with names A and B are added. The two chem-
ical components are not visible from Figure 4.
The biggest downside, as already mentioned, with the text files is the strict syntax the
specific position that each character should have. A character in a wrong position al-
ways leads to an invalid file. Figure 6 shows an invalid file because the X of compo-
nent A from stream STR2 is not aligned in correct position. In addition, the names have
a maximum size, for example, the stream names cannot have more than six characters.
Figure 4 Flowsheet diagram with 2 nodes and 4 streams
Figure 5 Textual representation of Figure 4
Figure 6 Invalid textual representation of Figure 4

13
3.3 Text editor A text editor is a tool that process engineers use for creating or modifying the structure
and the state of urea plant designs. The choice of the text editor is up to the process
engineers. The text editor choice could vary from Notepad to more sophisticated text
editors such as Notepad++ or UltraEdit.
3.3.1. Text editing example
For example, if a process engineer would like to add a new incoming stream with name
STR5 and 25 units of component B to the node N2, then the process engineer has to
open with a text editor a text file that contains text similar to Figure 5 and modify it.
Otherwise the process engineer could create a new text file from scratch.
Figure 7 Flowsheet diagram with the addition of stream STR5
Figure 8 Textual representation with the addition of stream STR5
3.4 Tisflo Tisflo is the software tool used as a flowsheet solver. Tisflo is intended for use by
process engineers for calculating the heat and material balances. The process engineers
have to provide the information needed for Tisflo in a text file.
Tisflo can be used for simulation, balancing of redundant data, and optimization [5].
Simulation: calculation of a system without degrees of freedom. The system
is determined by the combination of given information and requirements. The
number of unknowns is equal to the number of equations.
Balancing: calculation of a system with redundant data (measured data); there
is more information available than is necessary for solving all the equations.
Optimization: calculation of a system with degrees of freedom to which an
object function has been added. In addition, constraints are also incorporated.

14
The program solves the problem in such a way that the conditions of all equa-
tions are satisfied, the constrained variables lie in their allowable range, and
the object function is maximum.
3.4.1. Tisflo example
In this section an example of how Tisflo works is presented. As mentioned, Tisflo can
calculate the heat and material balances according the text files. In the example below
stream matrixes present the information contained in the text files because they are
easier to read. The stream matrix of the flowsheet diagram in Figure 4 is as Table 1
shows.
Table 1 Stream matrix
Stream From Node To Node
STR1 N1
STR2 N1 N2
STR3 N2
STR4 N2
Figure 5 shows that the flowsheet diagram has two chemical components with names
A and B. The amount can represent a quantity in a specific unit, for instance, kg/h;
however, it is omitted. If the amount is unknown an X is added. In the textual repre-
sentation a number before the X is required, although in the stream matrix we could
skip this unnecessary information.
Table 2 Stream matrix with chemical components A and B
Stream From
Node
To
Node
Chemical Component
A
Chemical Component
B
STR1 N1 50
STR2 N1 N2 X
STR3 N2 50 70
STR4 N2 X X
In order to calculate the heat and material balances of Table 2 a process engineer has
to load a text file into Tisflo and run the flowsheet problem.
Table 3 Result of the stream matrix with chemical components A and B
Stream From
Node
To
Node
Chemical Component
A
Chemical Component
B
STR1 N1 50
STR2 N1 N2 50
STR3 N2 50 70
STR4 N2 100 70
Results explanation: Every chemical component that goes into a node has to go out. In
our case the 50 units of A that go into the node N1 from stream STR1 should go out
via the stream STR2. The incoming units to node N2 are 50 units of A from stream
STR2, 50 units of A and 70 units of B from stream STR3. The units that pass through
stream STR4 should be 100 of A and 70 of B.

15
3.5 New tool When a process engineer is working on different plant parts it means that he or she is
working on different text files. A complete plant can be a combination of text files
defining different plant parts. However, different text files might have the same infor-
mation written in a different order. Text files could have a different order for the chem-
ical components. In case of a merge a process engineer decides which order to follow
and modifies the text accordingly. In a merged file the naming of the different elements
should be taken into consideration. A name that appears the same in two files means
that either the name from one file must change or the name must be added only once
in the merged file. The process engineer should also consider the predefined position
of the characters. Errors can appear even with an extra space. Taking into consideration
everything that is mentioned in this paragraph means that merging two text files is not
an easy task, and that is the reason that usually only one process engineer works on a
project.
The text files also limit the overview that the process engineers have about the design.
Having more complex flowsheet diagrams than the diagram shown in Figure 4, for
instance, a diagram with 20 nodes and 100 streams, would require a considerable
amount of time for the process engineers to understand which streams are connected
to which nodes.
Another downside of the current infrastructure is that the process engineers use two
tools, one tool for editing the structure and another tool as a problem solver. If the same
text file is opened with both tools then for every structure change made in text editor
the changes would be reflected in the problem solver only if the file is reloaded.
The original proposal for the new tool was the following:
The new tool should be graphics-based and therefore should increase of the overview
that the process engineers have about design. In order to eliminate the syntax errors
and the errors caused from the predefined position of the characters in the text file the
new tool should have forms that the process engineers could fill. The new tool should
simplify how different plant parts can be merged. There are different designs that could
be reused, for instance, there are four different reactors that the process engineers could
choose for their design. The process engineers could reuse designs or work in parallel
on different parts and decrease their scope if they could easily merge the different plant
parts. Last but not least, the new tool should combine the editing and problem solving
into one tool.
The high level goals were:
Shorten the learning curve of the new engineers
Improve the productivity of engineers
The project aimed to:
Increase the comprehension of the structure and the state of the flowsheet
design
Decrease the number of errors made by the engineers
Allow the process engineers to use predefined reusable sections that can be
merged
Allow the process engineers to work simultaneously on different plant parts
Integrate the editor and the solver into one tool
3.6 Design Criteria In this section we introduce the design criteria that surround the software design of the
project. The criteria are from a high level point of view and based on the problem that
project is trying to solve. The three major criteria for the design are:

16
Usability
The issues discussed in this chapter suggest a need for a tool that can improve process
engineers’ productivity and shorten their learning curve. Usability should be addressed
by means of making the product easy to understand and use.
Navigability
Navigability could improve the overview that the process engineers have about their
design. The way that the process engineers interact with the diagrams and navigate
between the different elements of the diagrams should be taken into consideration.
Extensibility
The design is a unified solution for editing and solving flowsheets. The new tool should
be easily extendable with functionality that the process engineers might require in the
future.
Based on the design, the design criterion that is less applicable is:
Simplicity Version management of visual representations is also more complex than version man-
agement of text because extra information is stored, such as the position, the size, and
the color of the different elements. An experienced process engineer might require
more time to edit visual representations compared to text. Last but not least, in the
software design extra associations between the elements could be used in order to im-
prove the usability and navigability.

17


19
4.Domain Analysis
In the previous chapter the problem analysis is discussed, which revealed the domain
of the project, namely urea plant designs.
This chapter gives a more detailed explanation about the domain and focuses on the
relevant part of the solution of the problem. The following sections give a detailed
view of the urea plant design from the point of view of a process engineer.
4.1 Introduction This chapter describes what a process flow diagram is, what a process flow diagram
contains, and how the process engineers calculate the heat and material balances.
4.2 Process flow diagrams A process flow diagram is the conceptual layout of a plant. A process flow diagram
displays equipment and relationships between the equipment of a plant. It also indi-
cates the general flow of chemical components between equipment in a urea plant de-
sign.
Figure 9 Process flow diagram
A process flow diagram that represents a complete urea plant can be decomposed into
smaller parts that are called sections. Sections are responsible for a specific function
in a urea plant. Some of the most common sections are
Synthesis
Low pressure recycle
Evaporation
Water treatment
Finishing

20
Figure 10 Synthesis section
Each section consists of different equipment. Some of the most common pieces of
equipment are
Reactor
Stripper
Carbamate Condenser
Scrubber
Figure 11 Reactor in a urea process flow diagram
The process flow diagram also displays the relationship between pieces of equipment
of a plant. The relationship is described as stream. A stream contains a mixture of
chemical components flowing from one piece equipment to the other. Stream is an
abstraction of a pipe. Streams are used for structuring and decomposing the problem;
therefore, a pipe in a plant may consist of more than one stream.
Figure 12 Streams in a process flow diagram
4.3 Heat and material balances calculation As described the information needed for the calculation of heat and balances is stored
in text files. A text file may contain the information of a complete plant or a section or

21
a piece of equipment. Streams are responsible for physical property and chemical com-
ponent flow. A stream can be attached to up to two nodes (from node and to node). A
node is a joint point with zero to many input and output streams. A piece of equipment
can be represented as a set of nodes.
The streams are responsible for physical property and chemical component flow.
Examples of chemical components in a urea plant design are:
Urea (CH4N2O)
Ammonia (NH3)
Water (H2O)
Carbon dioxide (CO2)
Examples of physical properties in a urea plant design are:
Temperature
Pressure
Enthalpy
Each stream has variables equal to the number of chemical components and physical
properties. The total number of variables is equal to the number of all the stream vari-
ables. The name of the variable is the stream name plus the chemical component or the
physical property. A variable can be free or fixed. Fixed means that the value of the
variables is given by the process engineers. Free means that the value is not known and
it should be calculated for the problem solution from the flowsheet solver.
A necessary rule for a flowsheet problem to be considered as determined is that the
total number of equations must be equal to the free variables. If the number of variables
is more or less than the number of equations, then the problem is considered as over-
determined or under-determined respectively. In a flowsheet all the chemical compo-
nents that go into a node must go out.
4.3.1. Heat and material balances calculation example
The calculation of the heat and material balances is based on mathematical equations.
The steam matrix of Table 4 has six variables; three are fixed and the other three free.
The problem has three equations:
STR1. H2O = 𝑆𝑇𝑅2.𝐻2𝑂
𝑆𝑇𝑅2. 𝐻2𝑂 + 𝑆𝑇𝑅3.𝐻2𝑂 = 𝑆𝑇𝑅4.𝐻2𝑂
STR3. CO2 = 𝑆𝑇𝑅4. 𝐶𝑂2
The number of equations is equal to the number of free variables and the problem is
determined.
Table 4 Stream matrix with a determined problem
Stream From
Node
To Node H2O CO2
STR1 N1 50
STR2 N1 N2 X
STR3 N2 50 70
STR4 N2 X X
By changing the state of one variable from free to fixed or vice-versa, the problem
would be over-determined or under-determined respectively.

22
Table 5 Stream matrix with an over-determined problem
Stream From
Node
To Node H2O CO2
STR1 N1 50
STR2 N1 N2 X
STR3 N2 50 70
STR4 N2 X 80
Table 6 Stream matrix with an under-determined problem
Stream From
Node
To Node H2O CO2
STR1 N1 X
STR2 N1 N2 X
STR3 N2 50 70
STR4 N2 X X
For the calculation of the heat and material balances the process engineers can specify
the ratio between chemical components or between physical properties by using labels.
For instance, Table 7 is equivalent to Table 4.
Table 7 Stream matrix with labels
Stream From
Node
To
Node
Labels H2O Labels CO2
STR1 N1 50
STR2 N1 N2 X
STR3 N2 LB1 1 LB1 1.4
STR4 N2 X X
Label Value
LB1 50
In the previous examples the equations are linear; however, in real plants non-linear
equations are being used. The process engineers can create their own models or use
existing thermodynamic-models that are available in the flowsheet solver. Each model
contains one or more non-linear equations and a convergence criterion. If the equation
residual value is greater than the value in the convergence criterion then the equation
is not converged. In case the equation is not converged the process engineers may need
to conduct more than one iteration in a simulation until all the non-linear equations are
converged.
Example of a non-linear equation with four variables is
𝐹(𝐴, 𝐵, 𝐶, 𝐷) = (𝐶 ∗ 𝐷) − (2.2 ∗ 𝐴 ∗ 𝐵)
An example of a converge criterion is
0.001 ∗ |𝐶| ∗ |𝐷|
It is possible that an equation will never converge. In this case the process engineers
have to change the initial values of the variables or add extra information to the param-
eters. For instance, the process engineers could add a maximum or a minimum value
of the variable in order facilitate convergence.
Apart from the variables that are related to actual streams and to chemical components
or to physical properties, there are other types of variables that the process engineers

23
can use. Those variables are named as auxiliary variables and are used in the thermo-
dynamic-models for simulation and optimization of the urea plant designs.

24

25
5.Feasibility Analysis
After explaining the problem and domain analysis, a feasibility analysis is performed
in order to identify potential issues and challenges as well as potential risks that may
arise or exist. This chapter describes issues and risks identified and presents their mit-
igation strategies.
5.1 Potential issues and challenges Working on a project that combines more than one domain is challenging. In this pro-
ject, an understanding of the terminology used by process engineers and a basic under-
standing of how a urea plant is designed is required. Domain knowledge can be gained
by reading documents; however, there are cases that the existing documentation is poor
or uses outdated terminology. Another way of gaining the knowledge needed is by
discussing with process engineers, although proper language is required in order to
prevent miscommunication. People from different domains might use the same termi-
nologies for completely different purposes. For example, the word model for a soft-
ware engineer could mean the software model, although for a process engineer could
mean the thermodynamic model.
5.2 Potential risks Several risks are identified within this project. The risk management is applied from
the first months of the project. There are two different types of risk: the process related
risks and the technical related risks. The description of the risks is written together with
their impact on the end result and probability of appearance in the project.
The meaning of the values of the impact on the end result and the probability of ap-
pearance based on relative importance is:
1. Limited
2. Low
3. Moderate
4. High
5. Extreme
The last column of the table is corresponding to the mitigation strategy.


27
Table 8 Process risks
ID Description Impact
(1-5)
Probability
(1-5)
Mitigation Strategy
RP1 Conflicting opinion between the stake-
holders about the end product.
3 4 A demonstration with the progress of end product with all the stakeholder present shall be
made. At the end of the presentation a decision shall be made according to the time given.
RP2 Not all the requirements can be met given
the time constraints.
4 5 Prioritize the requirement with the stakeholders. Requirements with medium or low prior-
ity might be carried on as a future work.
RP3 Stakeholder unavailability 5 3 Organize meetings in advance. Communicate regularly and upfront about the new func-
tionality needed for the project.
RP4 Extension of the back-end API by stake-
holder is slower than expected
5 2 Inform the stakeholder on-time about the new functionality needed. Work on other tasks
from the backlog.
RP5 A file containing a complete urea plant
design suitable for performance test appli-
cation is not given on time
4 3 Performance test of the application with smaller sections shall be made every time a new
functionality is added. Inform the stakeholder on time about the concern.
Table 9 Technical risks
ID Description Impact
(1-5)
Probability
(1-5)
Mitigation Strategy
RT1 Process engineers might prefer textual
based editing instead of graphical-based
editing
3 3 The meta-model shall be easily extendable with textual based editors
RT2 Back-end API does not return expected
values
5 3 Test cases could automate the verification procedure. Inform the stakeholders about the
issues identified.
RT3 New releases of the development environ-
ment
2 5 Read documentation about new features and check whether the new features are could ad-
vocate the development of the project. Check for backwards compatibility before migrat-
ing.

28
RT4 The performance of the new tool on spe-
cific tasks is significant slower than the
previous tools
5 3 Identify the root of the problem. Try to optimize the code of the tool. If the problem exists
because of the technology used inform the community about the issue. Finally try imple-
ment workarounds.

29


31
6.System Requirements
In the previous chapters the problem and the domain are defined.
This chapter describes the functional and non-functional requirements that have to be
satisfied by the project.
6.1 Requirements gathering process The problem and domain analysis revealed core parts that this project aims to imple-
ment. However, in order to narrow the project scope requirements should be defined.
Well defined requirements aim to further decompose the problem into small and trace-
able sub-problems. The requirements phase occurred in parallel with the software de-
velopment activities. There were two main phases in the process:
High-level requirements and use cases: This phase started at the beginning
of the project and lasted for two months. The main focus of this stage was to
define the technology constraints and necessary system use cases.
Detailed requirements: This phase focused on more concrete requirements
according to the previous high-level requirements. The requirements were de-
fined on biweekly iterations during the sprint planning. The agile way of
working aimed at a prototype at the end of each iteration.
The requirements were discussed with the involved stakeholders. The following four
categories are defined as the priority according to the MoSCoW method [6]:
1. Must – A requirement that the project must fulfill
2. Should – A requirement that is important, but the project success does not
rely on it
3. Could – A requirement that is desirable but not necessary
4. Would – A requirement that is the least-critical
6.2 High-level requirements and use cases The high-level requirements and use cases are based on the project aims and goals as
mentioned in Section 3.5 Stamicarbon wants to change the way that the process en-
gineers work from text-based to graphics-based. The new tool should allow process
engineers to load and combine sections in order to gradually construct a complete urea
plant. The new tool should also integrate the editor and the flowsheet solver function-
ality. Finally, the new tool should be a standalone application.
6.2.1. Use cases
Six main use cases are identified from the high-level requirements, namely create flow-
sheet canvas, load section, view section variables, modify section variables, merge sec-
tions, and simulate flowsheet.

32
Figure 13 Main use cases
Table 10 Create flowsheet canvas use case specification
Create flowsheet canvas use case specification
Use Case Name Create flowsheet canvas.
ID UC1
Description A process engineer wants to create a new
flowsheet canvas.
Actors Process engineer
Pre-conditions Application is open.
Basic Flow 1. User selects new Tisflo project.
2. User inserts the project name and
presses finish.
Post-conditions An empty flowsheet canvas is cre-
ated and displayed to the user.
Alternate Flows 2a. Project name exists.
2a1. User has to type another name.
Table 11 Load section use case specification
Load section use case specification
Use Case Name Load section.
ID UC2
Description A process engineer wants to load a sec-
tion in the flowsheet canvas.
Actors Process engineer
Pre-conditions A flowsheet canvas is displayed
to the user.
Basic Flow 1. User selects load section.
2. User selects a DAT file.
Post-conditions A section with all the available
diagrams is created on flowsheet
canvas.
All section elements and their
diagrams are created.
uc Use cases
System
Process Engineer Modify v ariable
v alue
Merge sectionsSimulate flowsheet
Load section
View v ariables of a
section
Create flowsheet
canv as

33
Alternate Flows 1a. User selects load predefined sec-
tion.
2a. User selects a DAT file.
Table 12 View variables of a section use case specification
View variables of a section use case specification
Use Case Name View variables of a section.
ID UC3
Description A process engineer wants to view the var-
iables of a section.
Actors Process engineer
Pre-conditions A flowsheet canvas with one or
more sections is displayed to
the user.
Basic Flow 1. User selects a section.
2. User selects the section varia-
bles diagram.
Post-conditions A table diagram with all the sec-
tion variables is displayed.
Alternate Flows 1a. User selects the flowsheet canvas.
2a. User selects the flowsheet varia-
bles diagram.
2a. User navigates to the section.
Table 13 Modify variable value use case specification
Modify variable value use case specification
Use Case Name Modify variable value.
ID UC4
Description A process engineer wants to modify the
value of a variable.
Actors Process engineer
Pre-conditions A diagram with variable is dis-
played to the user.
Basic Flow 1. User selects the value of a vari-
able from the table diagram.
2. User inserts a new value.
Post-conditions The value of a variable has
changed.
Alternate Flows
Table 14 Merge sections use case specification
Merge sections use case specification
Use Case Name Merge sections.
ID UC5
Description A process engineer wants to merge two
sections.
Actors Process engineer
Pre-conditions A flowsheet canvas with two or
more sections is displayed to the
user.
Basic Flow 1. User selects the stream con-
nector.
2. User selects an output stream of
a section.

34
3. User selects an input stream of
another section.
4. User selects merge sections.
5. User selects the folder that the
merged section will be saved.
6. User inserts a name for the new
section.
Post-conditions Sections are merged and sorted in
a new DAT file.
Alternate Flows
Table 15 Simulate flowsheet use case specification
Simulate flowsheet use case specification
Use Case Name Simulate flowsheet.
ID UC6
Description A process engineer wants to simulate the
flowsheet.
Actors Process engineer
Pre-conditions A flowsheet canvas with one or
more sections is displayed to
the user.
Basic Flow 1. User selects simulate.
2. User inserts number of itera-
tions.
Post-conditions A message if the flowsheet is
converged or not is displayed.
The variable values have
changed.
Alternate Flows
6.2.2. Technology constraints
The technology stack was defined at the beginning of the project by the stakeholders.
Eclipse is the development tool picked by the stakeholders. The usage of two Eclipse
tools was also defined at the beginning of the project. The Eclipse Modeling Frame-
work (EMF) is the first tool that the stakeholders picked for defining the vocabulary
(concept, relations, and properties) of the application. Eclipse Sirius is the second tool
that the stakeholders picked for visual representations of the application. The stake-
holders also envisioned that the product should run as a standalone application outside
Eclipse.
The programming language that the stakeholders picked for the application is Java.
Finally, the Java Native Interface (JNI) picked by the stakeholders in order to enable
Java code to call C++ functions of the kernel.
Stamicarbon implemented a proof of concept of the application before the beginning
of this project using the aforementioned technology stack.
6.3 Detailed requirements This section presents more concrete requirements that were decided during the sprint
planning. The detailed requirements are split in two categories, namely the user func-
tional requirements and the system functional requirements. The user functional re-
quirements are from the process engineer perspective and apply to parts visible to the
end users of the application. The system functional requirements describe the behavior
that the application should satisfy.

35
6.3.1. User functional requirements
Each user functional requirement has and ID, a short description, and an assigned pri-
ority according to the MoSCoW method.
Table 16 User functional requirements
ID Description Priority
UFR1 A user shall be able to create a flowsheet canvas M
UFR2 A user shall be able to load DAT files in a flowsheet
canvas
M
UFR3 A user shall be able to load predefined sections in the
flowsheet canvas
S
UFR4 A user shall be able to view in diagrams all the infor-
mation retrieved from a DAT file
M
UFR5 A user shall be able to modify the variables of a sec-
tion
M
UFR6 A user shall be able to modify the labels of a section M
UFR7 A user shall be able to simulate the flowsheet M
UFR8 A user shall be able to view the simulated results M
UFR9 A user shall be able to specify the number of itera-
tions
S
UFR10 A user shall be able to modify section variables while
the simulation is running
S
UFR11 A user shall be able to merge sections by connecting
streams
M
UFR12 A user shall be able to navigate inside a section M
UFR13 A user shall be able to auto arrange the size and the
position of the elements
W
UFR14 A user shall be able to use hotkeys for merging and
simulating
C
6.3.2. System Functional requirements
Each system functional requirement has an ID, a short description, and an assigned
priority according to the MoSCoW method.
Table 17 System Functional Requirements
ID Description Priority
SFR1 The DAT files shall be identified as sections by the
system
M
SFR2 The system shall generate unique names for each sec-
tion
M
SFR3 The system shall be able to store information, which
is used by process engineers, in a DAT file
M
SFR4 The system shall generate automatically all the visual
representations
M
SFR5 The system shall present the sections with a prede-
fined image according to their type
M
SFR6 The system shall map the kernel instances to the
model instances
M
SFR7 The system shall be able to simulate the flowsheet M
SFR8 The system shall display the streams with different
color according to their flow
S
SFR9 Test cases that verify the returning values of the ker-
nel shall be created
C
SFR10 The system shall be able to run as a standalone appli-
cation
M

36
SFR11 The system shall synchronize the model instances
with the kernel instances
S
SFR12 The system shall track when a variable changes from
free to fixed or the opposite
S
SFR13 The system shall display error and warning messages
to the users
S
6.4 Non-functional requirements In this section, the non-functional requirements of the project are listed. The non-func-
tional requirements derived from the two main goals of the project, namely shorten the
learning curve of the new engineers and improve the productivity of engineers.
6.4.1. Ease of use
In order to shorten the learning curve of the new engineers and improve the productiv-
ity of engineers, the system shall be easy to use. The tool shall be easier to use than the
tools that the process engineers were using before the start of this project. Metrics that
could be used to quantify the ease of use of the tool are:
Time required to learn how to use the tool
Time required to learn all the tool features
Time required to create a new urea plant design
6.4.2. Performance
The system shall respond reasonably fast to the process engineer requests. The perfor-
mance shall be comparable to the tools that the process engineers were using before
the start of this project. Metrics that could be used to quantify the performance of the
tool are:
Time required to create the model instances
Time required to open the diagrams
Time required to edit the model element instances
Time required to simulate a flowsheet
6.4.3. Extensibility
The system shall be open to addition or modification of functionality and features.
Metrics that could be used to quantify the extensibility of the tool are:
Effort required to create or modify visual representations
Effort required to integrate new components or plug-ins

37


39
7.System Architecture
In the previous chapters the problem and the requirements are defined.
This chapter elaborates on the architectural reasoning and relevant decisions based on
the requirements. This chapter also presents a comparison between the envisioned sys-
tem architecture and the old architecture.
7.1 Architecture before this project This section describes how the different components were organized before the start
of this project. As already described in the problem analysis in Chapter 3, before the
beginning of this project, the process engineers were using two applications, a flow-
sheet solver and a text editor.
Figure 14 Information flow before this project
With a text editor it is possible to open a flowsheet definition contained in a DAT file.
A text editor can be used to modify the structure of a flowsheet. A text editor can also
be used to create a flowsheet from scratch.
On the other hand, with the flowsheet solver it is possible to open a flowsheet definition
contained in a DAT file. A flowsheet solver cannot modify the structure of a flowsheet;
however, it can calculate the heat and material balances of a flowsheet.
On the front-end layer of the flowsheet solver, there is a user interface, which is written
in Visual Basic. On the back-end and hidden from the process engineers there are a
kernel and thermodynamic libraries, both written in FORTRAN. The kernel and the
thermodynamic libraries are the components that handle the calculation of the heat and
material balances.
cmp Old Architecture Infromartion Flow
Text editor
«text fi le»
sample.dat
Flowsheet solv er
flowsheet definition
«flow»
creation/modification
«flow»
flowsheet definition
«flow»
solution
«flow»
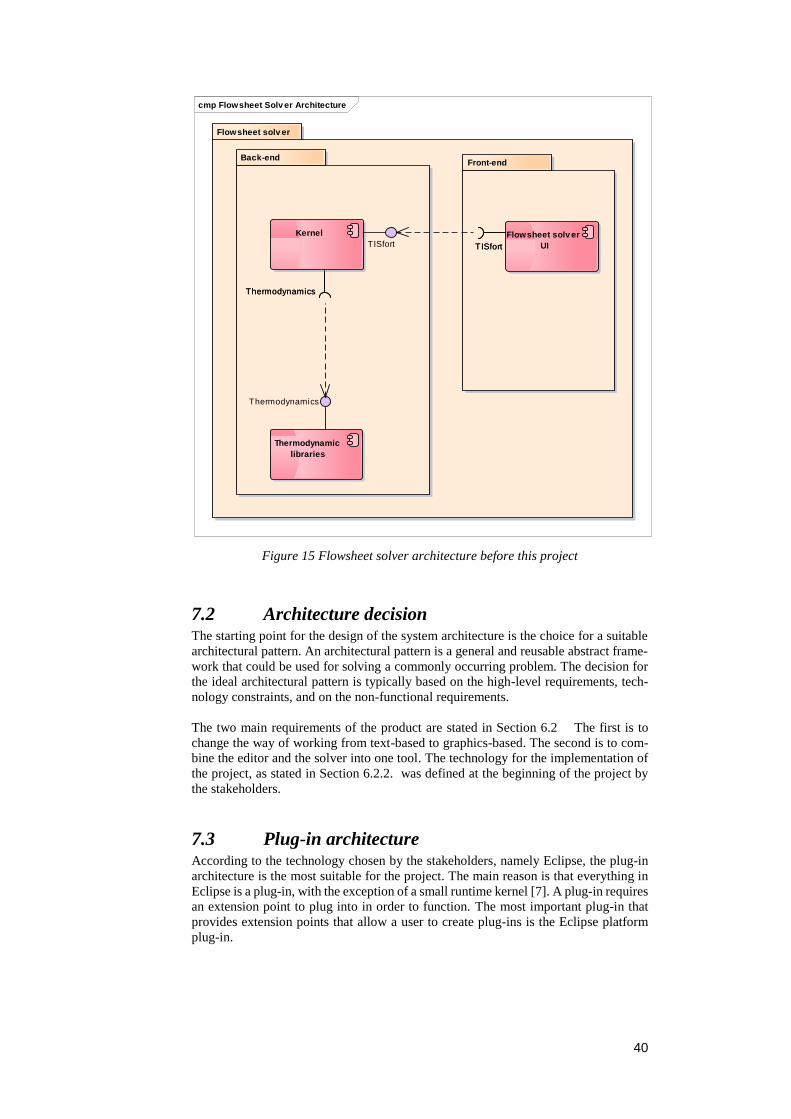
40
Figure 15 Flowsheet solver architecture before this project
7.2 Architecture decision The starting point for the design of the system architecture is the choice for a suitable
architectural pattern. An architectural pattern is a general and reusable abstract frame-
work that could be used for solving a commonly occurring problem. The decision for
the ideal architectural pattern is typically based on the high-level requirements, tech-
nology constraints, and on the non-functional requirements.
The two main requirements of the product are stated in Section 6.2 The first is to
change the way of working from text-based to graphics-based. The second is to com-
bine the editor and the solver into one tool. The technology for the implementation of
the project, as stated in Section 6.2.2. was defined at the beginning of the project by
the stakeholders.
7.3 Plug-in architecture According to the technology chosen by the stakeholders, namely Eclipse, the plug-in
architecture is the most suitable for the project. The main reason is that everything in
Eclipse is a plug-in, with the exception of a small runtime kernel [7]. A plug-in requires
an extension point to plug into in order to function. The most important plug-in that
provides extension points that allow a user to create plug-ins is the Eclipse platform
plug-in.
cmp Flowsheet Solv er Architecture
Flowsheet solv er
Front-endBack-end
Thermodynamics
Kernel
Thermodynamics
TISfort
Thermodynamic
libraries
Thermodynamics
TISfort
Flowsheet solv er
UITISfort

41
7.3.1. Eclipse platform plug-in
The Eclipse platform defines the set of frameworks and common services that collec-
tively make up the infrastructure required to support the use of Eclipse as a component
model, as a Rich Client Platform (RCP) and as a comprehensive tool integration plat-
form. These services and frameworks include a standard workbench user interface
model and portable native widget toolkit [8].
The Workbench component contains extension points that allow the user plug-ins to
extend the Eclipse user interface with menu selections and toolbar buttons, to request
notification of different types of events, and to create new views. The Workspace com-
ponent contains extension points that allow users interact with resources, including
projects and files [7].
The Help component allow users to provide documentation and context-sensitive help
in their application. The help documentation could help the end users of the applica-
tion; however, it does not have essential functionality. The Debug component allow
the user plug-ins to launch a program, interact with the running program, and handle
errors. Finally, the Team component allows Eclipse resources to interact with version
control systems [7].
Figure 16 Eclipse architecture
7.3.2. Plug-in architecture advantages
Plug-in based architectures are ideal for the development of applications that are mod-
ular, customizable, and easily extensible. The different plug-ins in the system provide
a higher level of abstraction and divide the problem into sub-problems. For example,
a plug-in is a separate module that can isolate and solve a specific problem. With a
plug-in based architecture, it is possible to create a different version of an application
without source code modifications. Another advantage of the plug-in based architec-
ture is the development of additional features. New features can be created without any
change on the original application.
7.4 Architecture of the project This section describes the different plug-ins and components of the project. It also pre-
sents the information flow between the application and the data files.

42
Figure 17 High-level architecture of this project
7.4.1. Meta-model plug-in
Eclipse modeling framework (EMF) is the tool picked for the definition of the domain
model. In the case of the project, the flowsheet solving. The domain model contains
the business vocabulary (concept, relations, properties) needed for the application.
EMF is a modeling framework and code generation facility for building tools and ap-
plications based on a structured data model. EMF provides tools and runtime support
to produce a set of Java classes for the model, along with a set of adapter classes that
enable viewing and command-based editing of the model, and a basic editor [9]. The
Tisflo meta-model plug-in is a set of three plug-ins, the Tisflo plug-in, the Tisflo edit
plug-in, and the Tisflo editor plug-in. The Tisflo plug-in contains the meta-model de-
scription. The Tisflo edit plug-in and the Tisflo editor plug-in are automatically gener-
ated according to the meta-model description. Therefore, for simplicity reasons, the
combination of all three plug-ins is identified as the Tisflo meta-model plug-in.
7.4.2. Sirius plug-in
Eclipse Sirius is that tool that the stakeholders picked for visual representations of the
application. Sirius is an Eclipse project, which allows the creation of graphical model-
ing workbenches by leveraging the Eclipse Modeling technologies. A modeling work-
bench created using Sirius is composed of a set of Eclipse editors (diagrams, tables,
and trees), which allow the users to create, edit, and visualize EMF instance models.
The editors are defined by a model, which defines the complete structure of the mod-
eling workbench, its behavior, and all the edition and navigation tools. This description
of a Sirius modeling workbench is dynamically interpreted by a runtime within the
Eclipse IDE [10].
7.4.3. RCP
The stakeholders envisioned that the product should run as a standalone application.
The standalone application must combine the editor and the flowsheet solver function-
ality. In Eclipse in order to fulfill that requirement, a Rich Client Platform (RCP)

43
should be created. As explained, the Eclipse platform is designed to serve as an open
tool platform. It is architected so that its components could be used to build client ap-
plication. The minimal set of plug-ins needed to build a standalone application is col-
lectively known as the Rich Client Platform [11].
7.4.4. Branding plug-in
A RCP based application without branding looks similar to a default Eclipse applica-
tion. By creating a branding plug-in it is possible to change the appearance of the ap-
plication. For example, with a branding plug-in it is possible to change the application
icon and splash screen from the default provided by Eclipse to one that is more relevant
for the application. The branding of the application could also be used for hiding but-
tons or menu options, provided by default from the Eclipse platform, which is more
relevant to software engineers rather than process engineers [12].
7.4.5. Back-end components
The communication interface between the Eclipse plug-ins and the back-end is called
TISjapi. The kernel in the graphical-based Tisflo did not remain the same; the imple-
mentation of the kernel changed from FORTRAN code to C++ code. The functionality
of the kernel remained the same; however, new API calls to extend the kernel were
defined. The design and implementation of the kernel and the thermodynamic libraries
are not part of this project.
7.4.6. Data files
In order to satisfy the requirements the application remained compatible with the DAT
files that are being used on the applications of the previous architecture. In addition to
the DAT files, it is visible in Figure 18 that a new file format, XMI, is also supported.
XMI (XML Metadata Interchange) is a standard for exchanging metadata information
via Extensible Markup Language (XML). The XMI files of the application are auto-
matically generated from the serialization that takes part in the Tisflo meta-model plug-
in and in the Tisflo Sirius plug-in. The information that is stored in the XMI files is a
superset of the information stored in the DAT files. Additional information of the XMI
files is extra associations between elements for easier navigability, information of how
an element is visually represented, and where the element is located on a particular
diagram.
Figure 18 Information flow of the project
cmp Architecture Information Flow
Tisflo RCP
«text fi le»
sample.dat
«xmi»
sample.xmi
creation/modification/combination/solution
«flow»
plant definition
«flow»
plant definition
«flow»
creation/modification/combination/solution
«flow»

44

45
8.System Design and Implemen-
tation
In the previous chapter the high-level architecture of the system is defined.
This chapter decomposes the high-level architecture into a detailed design. This chap-
ter elaborates on the system design and the implementation.
8.1 Introduction The system design is explained by utilizing the 4+1 view model. The 4+1 view model
is designed by Philippe Kruchten [13] and it is being used for describing software-
intensive systems, based on the use of multiple, concurrent views. The views are used
to describe the system from the viewpoint of different stakeholders, such as end-users
and developers. The four views of the model are:
Logical view – Describes the structure (object model) of the design. UML
diagrams to represent the logical view include class diagrams and object dia-
grams. The logical view is mandatory when using the 4+1 views.
Process view – Describes the run-time behavior of the system. UML diagrams
to represent to the process view include activity diagrams and sequence dia-
grams. The process view is optional when using the 4+1 views.
Development view – Describes the static organization of the system. UML
diagrams to represent the development view include component diagrams and
package diagrams. The development view is optional when using the 4+1
views.
Physical view – Describes how the software is mapped to the hardware. The
deployment view is optional when using the 4+1 views.
The fifth view is the use-case or scenario view. The use-case view describes the func-
tionality of the system and its users. The main use-cases of the system were defined in
Section 6.2.1. The use-case view is mandatory when using the 4+1 views.
Figure 19 4+1 view model

46
8.2 Logical view The logical view describes the structure of the design. The logical architecture primar-
ily supports the functional requirements – what the system should provide in terms of
services to its users.
8.2.1. Meta-model
As introduced in the previous chapter, the EMF is a modeling framework and code
generation facility for building tools and applications based on a structured data model.
The meta-model of the EMF is aligned with the Meta-Object Facility. The Meta-Object
Facility (MOF) is an Object Management Group (OMG) standard for Model-driven
engineering (MDE) [14].
Figure 20 Meta-Object Facility layers example
MOF is designed as a four-layered architecture. It provides a meta-meta model at the
top layer, called the M3 layer. This M3-model is the language used by MOF to build
meta-models, called the M2-models. The M2-models describe the elements of the M1-
layer, and therefore M1-models. The last layer is the M0-layer or data layer. It is used
to describe real-world objects.
The meta-model of the system is designed based on the domain analysis in Chapter 4.
The meta-model of the system captures all the elements needed for flowsheet solving.
A model is a concrete instance of the meta-model. The model instances are created
according to the kernel. The kernel is the component that is responsible for the parsing
of the DAT files. The kernel is also responsible for the calculation of the heat and
material balances. A part of the meta-model is presented in Figure 21. The complete
meta-model is presented in Appendix A: The complete meta-model.

47
Figure 21 Part of the meta-model


49
The root class of the meta-model is called a flowsheet. The flowsheet has a name and
a handle. The handle is a transient attribute that stores the memory location of the
flowsheet that is created by the kernel. A transient attribute is not serialized. The oper-
ation createFlowsheetSection has one input parameter. The input parameter is the file
path of the DAT file. The operation createFlowsheetSection calls a JNI function. The
JNI function calls a kernel function that parses a DAT file and creates instances of all
the DAT file elements in the kernel. Next, inside the createFlowsheetSection operation
there are other JNI functions that query the kernel and create the model instances (see
Section 8.3.1. ). This approach was used for the instantiation of the model because:
The application needed to support the DAT files and the kernel already had a
DAT file parsing mechanism.
The kernel handles the calculation of the heat and material balances and there-
fore the kernel should also have instances of the elements of a DAT file.
The kernel does not support functions to create all the elements that are
needed for the calculation of the heat and material balances. Therefore a pars-
ing DAT file mechanism on the Tisflo meta-model plug-in would not work.
The flowsheet instance can contain zero or more sections. For every DAT file that is
loaded in the flowsheet a section is created. Every DAT file is considered as a section.
A section can be a small segment of a plant or even the complete plant. A section has
a name and a type. According to the type a section has different visual representations.
Each section also has a handle. Similarly to the flowsheet class, the handle is a transient
attribute. The handle stores the memory location of the section that is created by the
kernel. The handle is used as an input parameter in the JNI functions in order to query
or set values to the kernel for a section or for elements contained by a section.
On the top part of every DAT file the stream items (the chemical components, the
physical properties, and the total) are defined. The stream items are almost the same in
every DAT file. For reusability reasons the stream items could be contained by the
flowsheet; however, the order (the position) that the stream items are specified in the
DAT file is important. The position of the stream items might differ from DAT file to
DAT file. The kernel cannot merge sections that have the stream items in a different
order, although in the future it is expected that it would. In order to serialize the posi-
tion of the stream items; the stream items are contained by the section class.
Next, in the DAT file, the nodes, the streams, the stream variables, and the labels are
specified. As explained in Chapter 4, a node is a joint point with zero to many input
and output streams. A stream can be connected with one or two nodes. Streams that
are connected with one node are either an input or an output stream of a section. Output
streams of a section can be connected with input streams of another section. In order
to prevent connections between output streams with input streams that do not have
identical stream items, a hash attribute is used. The value of the hash is based on the
items defined in a stream. An output stream can be connected with an input stream
with the same hash. The attribute synchronized on the label class is a transient attribute
and it is used for the synchronization of the model instances with the kernel instances.
More details about the synchronization will be provided later on this chapter.
All the variables have a value and it is specified if it is free or fixed. However, a vari-
able could have additional information, for instance, a step size value, a step size per-
centage, a minimum value, and a minimum percentage. The additional information of
a variable is rarely used. According to the DAT files used while the application was
developed fewer than 5% of the total number of variables have additional information.
Since the majority of the variables do not have additional information in the initial
design there was another class called an additional information and it was contained
by the variable class. With that approach fewer queries to the kernel had to be made
and less information had to be serialized. However, the kernel stores additional infor-
mation for all the variables, for example, if the minimum value of a variable is not
specified in a DAT file, then the kernel stores the lowest value of type double as the
minimum value of that variable. In order to reflect the kernel instances in the model

50
instances all the additional information of a variable is added as attributes of a variable.
Finally, an extra attribute called a synchronized is added in the meta-model. Synchro-
nized is a transient attribute and it is used for the synchronization of the model in-
stances with the kernel instances (see Section 8.2.2.
To sum up, the meta-model represents the different elements of the DAT files. The
model instances are created in a way that they can represent the kernel instances. The
same principles are applied for the rest of the meta-model that is presented in Appendix
A: The complete meta-model.
8.2.2. Synchronization of the model instances with the ker-nel instances
As already explained the instances in the kernel are created by parsing DAT files. The
first time that a section is loaded on the flowsheet the model instance elements are
created by querying the kernel. The model instance and its non-transient attributes are
serialized in XMI files when saving the model instance. Every time that a flowsheet is
reloaded the model instances are created according the information that is available in
the XMI files (without querying the kernel) and the kernel instances are created ac-
cording the information that is serialized in the DAT files.
While the application is running any change made in the model instance is reflected in
the XMI files and in the kernel; however, the DAT files remain the same. A DAT file
is modified when the user of an application decides to save the changes made in a DAT
file. In case that there is a crash on the computer or on the application, or if the user
decide to exit the application without saving the changes in the DAT file, there will be
inconsistency between the DAT file and the XMI file. It is worth to mention that even
if there was a mechanism that auto-updates the DAT files it would not work as a solu-
tion to the problem. The reason is that the kernel cannot serialize all the information
needed in the DAT files.
In order to synchronize the model instances and the kernel instances a monitoring ser-
vice is created. The monitoring service extends the org.eclipse.emf.common.no-
tify.impl.AdapterImpl class. Every time that a flowsheet is reloaded the monitoring
service modifies the kernel instances according to the model instances and sets the
transient attribute synchronized as true. This approach allows the synchronization of
the model instances with the kernel instances; however, it is not possible to change the
naming of the elements or the structure of the flowsheet design. For instance, if the
labels in an XMI file have different names from the labels in a DAT file then the syn-
chronization would not work. It is possible to overcome such a constraint if the kernel
instances are created by parsing the XMI files or if new JNI functions are implemented
that would allow the creation of all the kernel instances.
8.2.3. Sirius
Sirius is an Eclipse project which allows the creation of graphical modeling work-
benches by leveraging EMF. Sirius allows users to specify representation for their do-
main models. Representation can be diagrams, tables, matrices (cross-tables) or hier-
archies (trees). Representation can be organized in viewpoints. Viewpoints are defined
in Viewpoint Specification Models and they are specified as models inside Viewpoint
Specification Projects. Viewpoint Specification Projects (VSPs) are Eclipse plug-in
projects, which contain one or more *.odesign files (the extension used for Viewpoint
Specification Model). By convention, the VSM (or VSMs) defined in a project are
stored inside a folder called a description [15].
In this project the visual representations created with Sirius involve the UI that the
users of the application interact with. In the Tisflo Sirius plug-in one VSP and one
VSM are created. Representations for the flowsheet, the sections, the streams, and the

51
auxiliary streams are created. The main diagram where process engineer can load and
view sections is called a flowsheet canvas.
In order to increase the navigability options and to provide all the necessary infor-
mation in the diagrams, extra associations are added in the meta-model. For example,
in the meta-model there is a bi-directional reference between the stream variable and
the label. The flowsheet solving domain could be captured with a simple reference
from the stream variable to the label; however, in order to provide more detailed dia-
grams to the process engineers a bi-directional reference is added. With this approach
the process engineers can view a diagram with all the stream variables that are attached
to a label. Such a diagram is not required for the flowsheet solving, although it in-
creases the navigability options and the overview about the flowsheet design.
8.3 Process view The process view describes how the run-time system is structured as a set of elements
that have run-time behavior and interactions. The process architecture takes into ac-
count some non-functional requirements, such as performance and availability. The
process view is typically explained through sequence and activity diagrams.
8.3.1. Creation of the model instances
In the application all the model instances, apart from the root instance, are created
automatically when a user initiate an action and loads a DAT file on the flowsheet
canvas. The initial name of a section is equal to the name of the DAT file. The kernel
can simulate a flowsheet only if the section names are unique. Therefore a function
that generates unique section names is implemented.
After a unique name for the section is generated the system calls the JNI function cre-
ateFlowsheet. The function createFlowsheet can create a flowsheet or a section in-
stance in the kernel (in the kernel there is no distinction between a flowsheet and a
section). The memory location of the kernel instance is returned. Next, a function with
name loadFlowsheetProblem sends the location of the DAT file to the kernel. The ker-
nel parses the file and creates the kernel instances. Afterwards, there are JNI functions
that query the kernel and create the model instance elements of a section.
The model instance elements can have associations between each other. For instance,
a stream variable is associated with zero or one stream item and with zero or one label.
In order to associate the instance elements with each other two approaches can be fol-
lowed. The first approach implies that each stream variable shall query all the section
stream items and all the section labels, until it finds the desired one. The second ap-
proach implies that every time that an instance element (that may have association with
other instance elements) is created is added in a HashMap. In the second approach the
association can be made by getting the desired object from the HashMap according to
its name. The first approach uses less memory than the second, the second approach
uses less CPU cycles than the first. The second approach is implemented in this system.
The sequence diagram in Figure 22 represents how the chemical component model
instance elements of a section are created. In the class TISjapiCreate there are other
functions similar to the addChemicalComponents that create all the other model in-
stance elements contained by a section.

52
Figure 22 Sequence diagram representing the creation of the chemical component
instances
8.3.2. Simulation of a flowsheet
The activity diagrams can present a higher level picture of the behavior of the system
compared to the sequence diagrams. The activity diagram in Figure 23 displays the
simulation of a flowsheet. Three tiers are involved in the communication. The process
engineer initiates the start of the action by pressing the simulate flowsheet button. An
action is triggered in the Tisflo RCP and send a simulation request to the kernel. The
simulation is handled in the kernel. After the simulation is finished the Tisflo RCP
starts the update of the model instances. For every section the stream variable and the
label values are updated by querying the kernel. Next, the Tisflo RCP sends a request
to the kernel to verify whether or not the flowsheet is converged. Finally, a message
that indicates if the flowsheet is converged or not is displayed to the process engineer.

53
Figure 23 Activity diagram representing the simulation of a flowsheet
From the activity diagram it is visible that there is a delay from the time that a process
engineer presses a button that simulates the flowsheet until the time that the final mes-
sage is displayed. The delay is caused from the processing that needs to be done in the
kernel and in the Tisflo RCP.
8.4 Development view The development view focuses on the static organization of the system. The software
is packaged in small chunks – program libraries, or subsystems – that can be developed
or extended. This view is primarily intended for developers.

54
8.4.1. Development view of the Tisflo meta-model plug-in
As described in the previous chapter, the Tisflo meta-model plug-in is a set of three
plug-ins, the Tisflo plug-in, the Tisflo edit plug-in, and the Tisflo editor plug-in. The
Tisflo plug-in contains the meta-model description. The Tisflo edit plug-in and the
Tisflo editor plug-in are automatically generated according to the meta-model descrip-
tion.
Figure 24 Deployment view of the Tisflo meta-model plug-in
The Tisflo plug-in contains two main packages, the tisflo and the com. The tisflo pack-
age contains code generated (with modifications) from the meta-model description.
The com package contains extra code that is needed for the application.
Figure 25 Deployment view of the Tisflo plug-in (generated code)
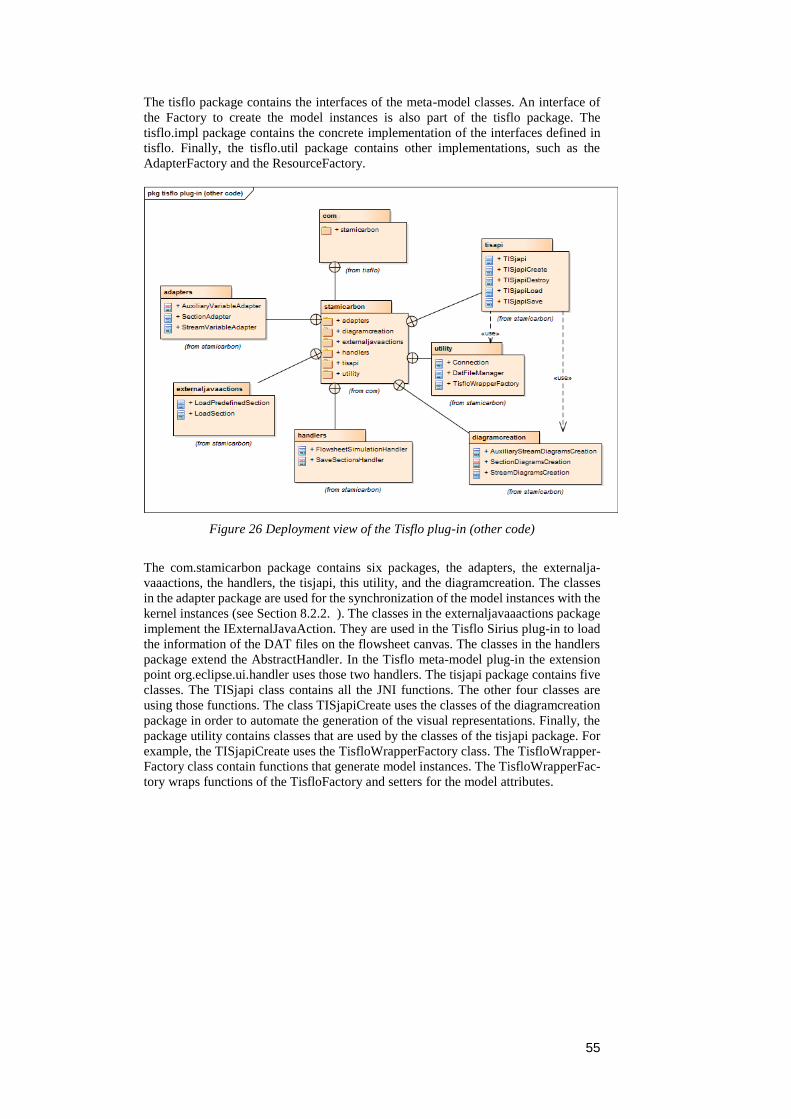
55
The tisflo package contains the interfaces of the meta-model classes. An interface of
the Factory to create the model instances is also part of the tisflo package. The
tisflo.impl package contains the concrete implementation of the interfaces defined in
tisflo. Finally, the tisflo.util package contains other implementations, such as the
AdapterFactory and the ResourceFactory.
Figure 26 Deployment view of the Tisflo plug-in (other code)
The com.stamicarbon package contains six packages, the adapters, the externalja-
vaaactions, the handlers, the tisjapi, this utility, and the diagramcreation. The classes
in the adapter package are used for the synchronization of the model instances with the
kernel instances (see Section 8.2.2. ). The classes in the externaljavaaactions package
implement the IExternalJavaAction. They are used in the Tisflo Sirius plug-in to load
the information of the DAT files on the flowsheet canvas. The classes in the handlers
package extend the AbstractHandler. In the Tisflo meta-model plug-in the extension
point org.eclipse.ui.handler uses those two handlers. The tisjapi package contains five
classes. The TISjapi class contains all the JNI functions. The other four classes are
using those functions. The class TISjapiCreate uses the classes of the diagramcreation
package in order to automate the generation of the visual representations. Finally, the
package utility contains classes that are used by the classes of the tisjapi package. For
example, the TISjapiCreate uses the TisfloWrapperFactory class. The TisfloWrapper-
Factory class contain functions that generate model instances. The TisfloWrapperFac-
tory wraps functions of the TisfloFactory and setters for the model attributes.
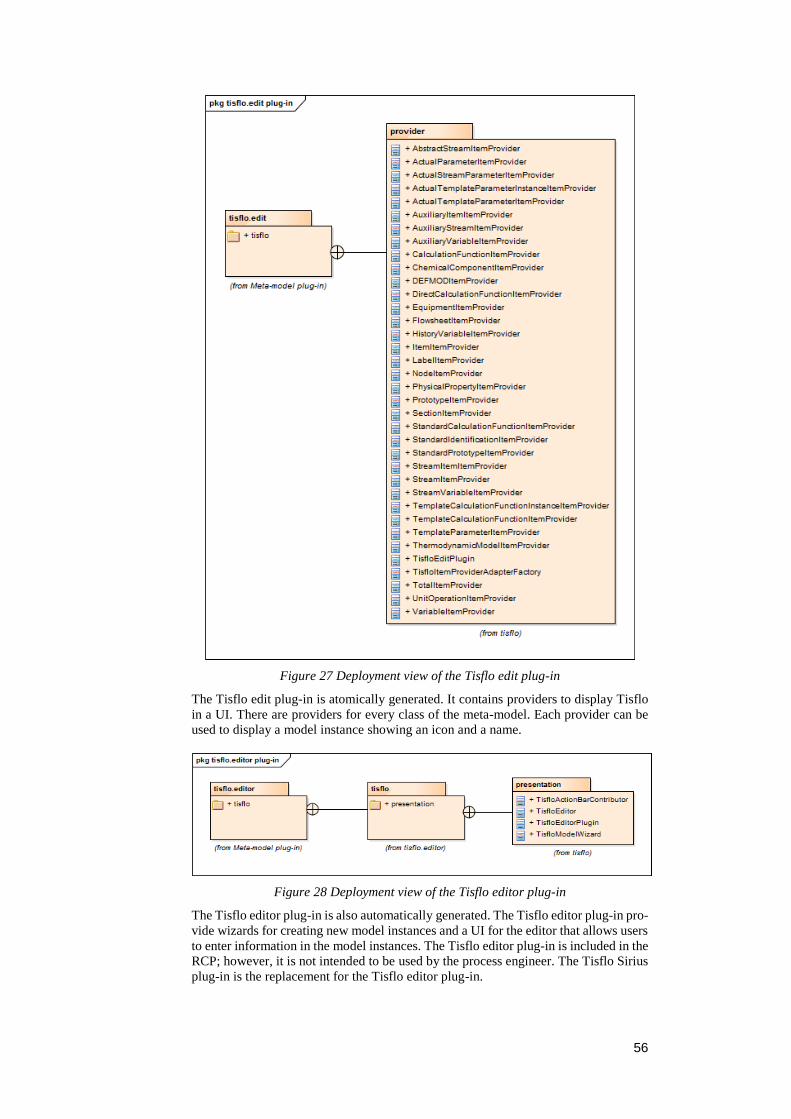
56
Figure 27 Deployment view of the Tisflo edit plug-in
The Tisflo edit plug-in is atomically generated. It contains providers to display Tisflo
in a UI. There are providers for every class of the meta-model. Each provider can be
used to display a model instance showing an icon and a name.
Figure 28 Deployment view of the Tisflo editor plug-in
The Tisflo editor plug-in is also automatically generated. The Tisflo editor plug-in pro-
vide wizards for creating new model instances and a UI for the editor that allows users
to enter information in the model instances. The Tisflo editor plug-in is included in the
RCP; however, it is not intended to be used by the process engineer. The Tisflo Sirius
plug-in is the replacement for the Tisflo editor plug-in.

57
8.4.2. Development view of the Tisflo Sirius plug-in
In Figure 29 the development view of the Tisflo Sirius plug-in is presented.
Figure 29 Deployment view of the Tisflo Sirius plug-in
The Tisflo Sirius plug-in contains two packages, the tisflo.design package and the
tisflo.wizards package. Inside the tisflo.design package there are two classes, the Ac-
tivator and the Services. The Activator class controls the plug-in life cycle. The class
Services contains Java methods that can be transparently invoked from interpreted ex-
pressions in Sirius. Inside the tisflo.wizards package there is a wizard that simplifies
the creation of a new Tisflo project for the process engineers. Every time that a new
project is created an instance of a Flowsheet (the root element) is created, Sirius dia-
grams corresponding the Flowsheet instance are created on the background, and a
flowsheet canvas is displayed to the process engineers.
8.5 Physical view The physical or deployment view describes how the software is mapped to the hard-
ware. An extended description about the deployment view is presented in Chapter 10.

58
59
9.Validation and Verification
In the previous chapter the design and implementation of the product is defined.
This chapter presents the validation and verification techniques used in order to con-
firm that the right system is being build.
9.1 Validation The software validation gives an answer to the question: Are we building the right
product? Building the right product implies the creation of the requirement specifica-
tion that contains the needs and the goals of the stakeholders. As presented in Chapter
6, the high-level requirements and goals of the system were known since the first two
months of the project. Additional and more concrete requirements were derived from
the high-level requirements and were defined on the sprint meetings.
The sprint meetings and the project steering group meetings resulted in a continuously
and iterative validation process by the stakeholders. The feedback that the stakeholders
provided during those meetings facilitated on the completeness and correctness of the
product.
As a part of the validation, a survey was created. The survey was given to the process
engineers at a late stage of the project. The survey aimed on an evaluation of the prod-
uct by the actual users.
9.1.1. Survey
At a late stage of the project one-hour meetings with four process engineers individu-
ally were conducted. During those meetings a live demonstration of prototype was
given to the process engineers. In addition, the process engineers were able to create
their own use cases and interact with the application on their laptops. Moreover, during
those meetings the process engineers gave feedback related to missing functionality of
the application. Their feedback is included as a future work and it is presented in Sec-
tion 11.2 Finally, at the end of each meeting a survey was given to the process engi-
neers. The survey is split in two parts: the questions and the statements. The questions
are shown in Table 18 and they are based on the non-functional requirements. The
statements are shown in Table 19 and they are based on the project goals and aims.
The answers represent the average grade from all the answers collected from the sur-
vey.
Table 18 grading system:
1. N/A (not applicable, not available, or no answer)
2. Bad
3. Not good
4. Good
5. Very good
6. Excellent

60
Table 18 Survey questions
Question 1 2 3 4 5 6
How do you grade the time required to learn how
to use the tool? X
How do you grade the time required to create a
flowsheet? X
How do you grade the appearance of the dia-
grams? X
How do you grade the piece of information that
displayed in the diagrams? X
How do you grade the loading time of a plant part
definition? X
How do you grade the loading time of a complete
plant definition? X
How do you grade the time required for a simula-
tion? X
How do you grade overall the application? X
Table 19 grading system:
1. N/A (not applicable, not available, or no answer)
2. Strongly disagree
3. Disagree
4. Neither agree nor disagree
5. Agree
6. Strongly Agree
Table 19 Survey statements
Statement 1 2 3 4 5 6
The new application will shorten the learning
curve of the new engineers. X
The new application will improve the productivity
of new engineers. X
The new application will improve the productivity
of experienced engineers. X
The diagrams in the new application increase the
overview of the flowsheet design. X
The new application simplifies the editing of the
flowsheet design. X
The predefined sections that can be merged will
simplify the flowsheet design. X
The merging functionality will enable the parallel
work of the process engineers on the same project. X
The new application will reduce the time required
for a design. X
The answers in the survey feature a general satisfactory of the process engineers about
the application. The process engineers showed great enthusiasm about the predefined
sections that can be merged. On the other hand, the appearance of the diagrams is one
of the weakest points of the application. Improvement points are presented as a future
work in Section 11.2

61
9.2 Verification The software verification gives an answer to the question: Are we building the product
right? The verification process involves the evaluation on whether the software con-
forms to the requirement specification or not. The software verification aims on the
design and implementation of the product. The verification of the application is per-
formed by software testing. The testing conducted with two different approaches: the
manual testing and the unit testing.
9.2.1. Manual testing
The manual testing was conducted on the model and on the user interface.
The manual testing of the model covered
The creation of the model instances
The initialization and modification of the attributes of the model instances
The serialization
The synchronization
The manual testing of the user interface covered
The creation of a new urea plant design project
The functionality of each button
The appearance of the icons
The appearance of the diagrams
9.2.2. Unit testing
The unit testing is a software testing method in which individual parts of the source
code, called units, are tested. The unit testing was performed on the JNI functions. The
unit tests covered 70% of the total JNI functions. 59 test cases were implemented.
Figure 30 Unit tests for the JNI functions
9.3 Dynamic program analysis The dynamic program analysis is the analysis that is performed while the application
is being executed. In order to measure the space (memory) and the time complexity
and identify possible bottlenecks of an application, software profiling can be con-
ducted. In this project two different profilers were used. The first profiler was the Sirius
profiler. The Sirius profiler is a profiler that measures the time complexity of specific
parts of Sirius. The second profiler was the VisualVM, which is a Java profiler that is
able to provide more in depth information about the time and space usage of the appli-
cation. In addition to the profilers, the Eclipse debugger was also used in order to op-
timize the source code. A result of the dynamic program analysis is that the model

62
instance elements are created and presented to the end-users in one eighth of the initial
time. The performance improvement is achieved by not serializing automatically the
sections when they are created.

63


65
10. Deployment
This chapter elaborates on the deployment view of the application, the technologies
used for the build of the application, and how to build and deploy newer versions of
the application.
10.1 Deployment view The application can run on any Windows machine that supports the x86 architecture.
The Windows machine must have a Java Virtual Machine (JVM) installed. A JVM
version 8 update 121 or newer is advised, because the Java Development Kit (JDK)
version 8 update 121 is used for the development of the application. The application
consists of an RCP that runs outside the Eclipse IDE. The RCP depends on the kernel
and the thermodynamic libraries that are contained in the TISjapi.dll. The application
is portable and it can be used without any installation.
Figure 31 Deployment view of the application
10.2 How to build and deploy the application In this section there is an introduction about the technologies used for the build of the
project. Next, there is information about how the application can be built and deployed.
10.2.1. Maven
Maven is a build automation tool used primarily for Java projects. In Yiddish, the word
maven means "accumulator of knowledge" [16]. Maven projects are configured using
a Project Object Model (POM), which is stored in a pom.xml file [17]. The XML file
describes the software project being built, its dependencies on other external modules
and components, the build order, directories, and required plug-ins. It comes with pre-

66
defined targets for performing certain well-defined tasks such as compilation of code
and its packaging.
Maven dynamically downloads Java libraries and Maven plug-ins from one or more
repositories, such as the Maven 2 Central Repository, and stores them in a local cache.
This local cache of downloaded artifacts can also be updated with artifacts created by
local projects.
10.2.2. OSGi
OSGi (Open Service Gateway Initiative) is a Java framework for developing and de-
ploying modular software programs and libraries. Each bundle is a tightly coupled,
dynamically loadable collection of classes, jars, and configuration files that explicitly
declare their external dependencies [18].
10.2.3. Tycho
Tycho is focused on a Maven-centric, manifest-first approach to building Eclipse plug-
ins, features, update sites, RCP applications and OSGi bundles. Tycho is a set of Ma-
ven plug-ins and extensions for building Eclipse plug-ins and OSGi bundles with Ma-
ven. Tycho uses native metadata for Eclipse plug-ins and OSGi bundles and uses the
POM to configure and drive the build. Tycho supports bundles, fragments, features,
update site projects and RCP applications. Tycho also knows how to run JUnit test
plug-ins using OSGi run-time.
Tycho use OSGi metadata and OSGi rules to calculate project dependencies dynami-
cally and injects them into the Maven project model at build time. Tycho supports all
attributes supported by the Eclipse OSGi resolver. Tycho uses proper classpath access
rules during compilation. One important design goal in Tycho is to make sure there is
no duplication of metadata between POM and OSGi metadata [19]. Tycho also enables
Maven to understand package types such as eclipse-plugin, eclipse-feature, and
eclipse-repository [20].
10.2.4. Tisflo plug-in projects
The Tisflo plug-in projects are the Tisflo meta-model plug-in, the Tisflo Sirius plug-
in, and the Tisflo branding plug-in. The package type of the Tisflo plug-ins is eclipse-
plugin. Each plug-in has a Maven based configuration file, the pom.xml, which is used
for the Tycho build.
10.2.5. Tisflo feature project
An Eclipse feature project contains features. A feature describes a list of plug-ins and
other features which can be seen as a logical unit. A feature has a name, a version
number, and in most cases license information assigned to it. Instead of having many
individual plug-ins it is possible to group the plug-ins using features. Grouping the
plug-ins into logical units improves the system structure. The Tisflo feature contains
all the Tisflo plug-ins. The feature project has package type eclipse-feature and it has
Maven based configuration file, the pom.xml, which is used for the Tycho build.
10.2.6. Tisflo product project
The Tisflo product contains a product configuration file and a Maven based configu-
ration file, the pom.xml. The product configuration file defines the configuration of an
Eclipse application. The configuration of an Eclipse application includes icons, splash
screen, and the plug-ins or features. The Tisflo product contains the Tisflo feature pro-
ject and the Eclipse platform. The Tisflo product has a package type eclipse-repository.

67
10.2.7. Tisflo parent project
The Tisflo parent project contains only a Maven-based configuration file, the pom.xml.
The packaging type of the Tisflo parent is pom. The pom.xml of the Tisflo parent con-
tains general configurations that are inherited by all the other projects. The general
configurations include the Tycho version, the build environment, and a repository
where Tycho can find and download the dependencies of the projects.
Figure 32 Part of the Tisflo parent pom.xml
The build environments that are specified on the parent pom.xml are independent of
the development environment. For instance, Eclipse Neon and a 64-bit version of Win-
dows can be used for the development; however, the build could be based on the
Eclipse Oxygen and the application could run on a 32-bit Linux machine or on a 32-
bit Windows machine.

68

69
11. Conclusions
This chapter elaborates on the results achieved by this project. The value that this pro-
ject added to the stakeholders is also presented. Finally, this chapter also presents fu-
ture work related to the project.
11.1 Results The flowsheet design and the calculation of the heat and material balances is an im-
portant task that the process engineers have on every project. The main goal of this
project was to improve the productivity of the process engineers. In order to improve
the productivity of the process engineers the project aimed to: increase the comprehen-
sion of the structure and the state of the flowsheet design, decrease the number of er-
rors, allow the process engineers to use predefined reusable sections that can be
merged, allow the process engineers to work simultaneously on different plant parts,
and integrate the editor and the solver into one tool.
According to the results of the survey in Section 9.1.1. the end product is very prom-
ising. More specifically, the process engineers agree that the new application will re-
duce the time required for the flowsheet design. The predefined sections that can be
merged is the feature that adds the most value in the application according to the pro-
cess engineers. Furthermore, the process engineers can use for the first time the same
tool to edit and solve flowsheets. On the other hand, one of the weakest points of the
application is the appearance of the diagrams and the visual representations. The ap-
pearance of the diagrams and the visual representations was a deliverable of the end
product, although this deliverable is related more with graphic designing rather than
software engineering. A comparison between the textual representations and the visual
representations is presented in Appendix B: Comparison between textual representa-
tions and visual representations.
From the software design point of view, the system demonstrates usability, navigabil-
ity, and extensibility. A reflection based on the design criteria is presented in Section
13.2
11.2 Future work This section elaborates on future possibilities and improvements, as well as on features
that were not designed or implemented in this project due to various constraints such
as time and lack of knowledge.
Possible extensions are:
Sirius provides functionality that can auto-arrange the elements of a diagram.
The auto-arrange was not always ideal especially for diagrams with many el-
ements. A customized auto-arrange function could be implemented.
The streams are aligned in a default position that Sirius defines. The default
position is not always the desired. The functionality about the default posi-
tioning could be overridden.
All the streams have the same visual representation. The streams could have
a different visual representation according to their items.

70
The predefined sections are created on the flowsheet canvas by selecting them
from the file system. Icons that represent each predefined section could be
added to the palette of the flowsheet canvas.
The history variable instances are used to display variable changes from free
to fixed, or the opposite. The deletion of a history variable instance does not
revert the changes. In order to revert the changes a new functionality could be
implemented.
The application logs the return values of limited kernel functions. The only
messages that originate from the kernel and appear on the application screen
are about the convergence of the simulation. As a future work a logging sys-
tem and an error reporting system to the process engineers could be imple-
mented.
In order to save and load the structure and the state of a flowsheet design, a
version control system could be added.
The RCP can run in any major operating system (Windows, macOS, Linux)
in both x86 and x64 architecture. However, the kernel can run only on Win-
dows machines with x86 architecture. A kernel version that could run on the
x64 architecture could improve the application performance.
The RCP is based on the Eclipse platform, therefore menu items and toolbar
buttons that are more useful for developers rather than process engineer exist.
In order to simplify the UI it is recommended that a newer version of the RCP
would hide those menu items and toolbar buttons.
The application performance when opening a diagram for first time that con-
tain a large piece of information is not ideal. For example, opening a diagram
for first time that contains all the section variables of a complete plant varies
from 7 to 14 seconds, depending on the information. As a part of this project
performance issues related to the diagrams are mentioned as a bug in Eclipse
Sirius. A workaround could be achieved by splitting the information into
more diagrams with less information.
The application is missing functionality that the previous flowsheet solver
has. For instance, modify the step size of all the variables, the linstep, the
damping factor, the case study, and the optima mode are missing.
The kernel can only merge and simulate sections, which they have the stream
items on the same position. As a future work a kernel which can merge and
simulate section with stream item on different position is advised.
The kernel instances are created by parsing a DAT file. The instances of the
model are created by querying the kernel and the non-transient attributes are
serialized in XMI files. As already explained in a previous chapter there is a
synchronization mechanism for the kernel and the model instances. The syn-
chronization mechanism will be omitted if the kernel instances will be created
from the same XMI files that describe the model instances.
The API of the kernel does not support functions that can reflect the creation
of a model instance to a kernel instance. For instance, there is no JNI function
that would reflect the creation of a node or a stream instance from the model
to the kernel. In the current product it is not possible to create a flowsheet

71
diagram from scratch, a DAT file should always be used. As a future work
function calls that would reflect the creation of all the model instances to the
kernel is advised.
The API of the kernel currently supports setters for the attributes of the label,
stream variable, and auxiliary stream variable instances. Any change made in
any other model instance, for example, in a calculation function instance, will
not be reflected in the kernel. Any change that is not reflected in the kernel is
not taken into consideration in the simulation. As a future work new API calls
that would allow the modification of all the attributes of kernel instances is
advised.
The test cases that implemented in this project cover only the JNI functions.
Test cases for the model and the visual presentations is left as a future work.

72

73
12. Project Management
This chapter elaborates on the project management process that was conducted during
the lifetime of the project.
12.1 Way of working The system was developed under the agile methodology. The agile methodology sug-
gests iterative and incremental development. Each iteration is called a sprint. The du-
ration of each sprint for this project was two weeks. At the end of each sprint a deliv-
erable had to be produced. The different phases of the sprint involve: the plan, the
design, the development, a prototype with the new functionality, and the evaluation of
the progress.
Figure 33 Agile lifecycle
The definition or the refinement and the prioritization of the requirements was held
during the planning phase of each sprint. The next two sprint phases involved the soft-
ware design and the software development of the application. The next phase involved
a prototype and a new version of the product. The last phase involved the evaluation
and the feedback about the sprint.
act Agile
Sprint
Project StartPlan
Design
Dev elopment
Prototype
Ev aluation/Feedback
Final Product
Project End
[nextSprint][else]

74
12.2 Work-Breakdown Structure (WBS) The work-breakdown structure is presented on this section. The WBS is the way in
which the project has been decomposed. The project is divided into four main activities
as follows:
Domain research: Research and study about the elements used in the flow-
sheet diagrams for the calculation of the heat and material balances.
Technology research: Research about the technologies picked by stakehold-
ers for the project.
Design and implementation: Usage of the research and study of the previous
two activities in order to build the software solution of the project.
Figure 34 Work-breakdown structure of the project
12.3 Project Planning According to the work-breakdown structure a project plan was formulated. The initial
version of the project plan was formulated during the first weeks of the project. Ad-
justments were introduced during the whole period of the project, as the knowledge
and the understanding about the project deepened.
12.3.1. Initial version
The initial version of the project plan involved four activities: the domain analysis, the
design and implementation, the technical report, and the final presentation. As it is
visible in Figure 35 there is overlapping between the activities.
The domain analysis activity involves the domain research, the technology research,
and the requirements. The domain analysis was expected to last until the first week of
April.
The design and implementation was expected to last from mid-January to mid-August.
The design of EMF, the design of Sirius and the integration with the kernel was ex-
pected to last from mid-January to late-May.
The writing of the technical report and the preparation for the final presentation were
expected to last from mid-May until the end of the project.

75
Figure 35 Initial project planning
12.3.2. Final version
The final version of the project plan displays what actually happened during the pro-
ject. The only activities that remain the same or almost the same are the writing of the
technical report and the preparation for the final presentation.
In the domain analysis phase, the domain research lasted less than expected; however,
new requirements were introduced in June. The new requirements affected the design
and implementation of the project. More specifically, because of the new requirements,
the design of the EMF and the design of Sirius lasted longer. In addition, a new activity
called a performance check added in the project plan. The integration with kernel also
lasted longer than what was initially expected.
Finally, it is worth mentioning that the testing was developed and applied iteratively
in different time periods. This incremental-iterative development approach is better
aligned with the agile way of working that the approach planned in the initial project
plan.
Figure 36 Final project planning
12.4 Project execution The execution of the project followed a structured path based on the project planning.
The first days of the project involved meetings with the stakeholders in order to famil-
iarize the PDEng trainee with the domain and the high-level requirements. The agile
way of working aimed on a prototype that it is iterative and incremental implemented.
The domain analysis and the design and implementation of project have been executed
simultaneously.
Every three weeks a Project Steering Group (PSG) meeting was held. The project pro-
gress and a live demonstration of the prototype was presented by the PDEng trainee
during the PSG meetings. The prototype allowed the stakeholders to have a clear view
of the project progress. During these meetings the stakeholders were giving feedback
about the project and the product. The feedback worked as a method of validation about
the product and advocated on keeping track of the project direction.
The prioritization of the requirements at the end of each iteration was the main reason
that the project execution was significantly different from the initial project plan.

76

77
13. Project Retrospective
This chapter presents a reflection of the project based on the candidate’s perspective.
At the end of the chapter a reflection is presented based on the design criteria set in
Chapter 3.
13.1 Reflection In the project conducted over the past nine months I faced several challenges from both
technical and non-technical perspective. For me as a software engineer it was a great
experience and it helped to improve my technical and soft skills.
At the beginning of the project I had two main concerns regarding to the project. The
first concern was related to the project domain and the second was related to the tech-
nology constraints of the project. About the first concern, my knowledge about chem-
ical engineering and more specifically about the flowsheet solving was zero prior to
this project. I was able to gain the domain knowledge from the user manual of the old
flowsheet simulator and from my stakeholders. Luckily for me most of the times it was
easy to arrange a meeting with my stakeholders and I could gain the needed infor-
mation for my project. About the second concern, I had low to zero experience with
the technology constraints. My knowledge about Eclipse Modeling Framework was
limited. During my first year as a PDEng trainee I participated in a one week workshop
about model driven software engineering. However, this was the first and last experi-
ence that I ever had with EMF prior to this project. In addition, I had no experience
with Eclipse Sirius, although I found the tool relatively easy to use. Finally, I had no
knowledge about what an RCP is and how could I build one.
The tasks that required the most time was the design of the EMF meta-model and the
kernel integration. The design of the EMF meta-model was probably the most crucial
task of the project. The majority of the code is automatically generated from the meta-
model. The model instances have to reflect the kernel instances, although I had no
access in the kernel. I was using the user manual of the flowsheet simulator as a refer-
ence to understand elements needed for the heat and material balances calculations.
However, there were some inconsistences between the user manual and the kernel. For
instance, the kernel adds additional information for all the variables, although accord-
ing the user manual only a specific number of variables have additional information. I
was able to bypass such a problem by communicating with my stakeholders. About the
kernel integration it is mentioned that he API of the kernel was extended in parallel
with my project. The return values of the new API functions were not always correct.
That was the main reason that I spent more time on kernel integration than I expected.
The extra time was spent mostly on debugging.
At a late stage of my project I identified performance issues in the application. The
issues were related to the creation of new sections and to the simulation of the flow-
sheet. The performance issues were noticeable in the creation and the simulation of a
complete urea plant. In order to optimize the application I used the Eclipse debugger,
two profilers, and I contacted the Eclipse Sirius community. Thanks to their help I
managed to solve the performance issues. In order to contribute back to the community
I created a video tutorial about how to create an Eclipse Sirius based RCP1. In this
project I managed to create the RCP and automate the build of the RCP in a week. I
believe that if there was a tutorial similar to the one that I created I would have achieved
the task in one or two days.
1 https://www.youtube.com/watch?v=ZmUrTlzqCXcv

78
Apart from the project design and implementation, the project management was an-
other important part of the project that I had to satisfy. I was responsible for updating
the requirement list and estimating the time needed for each requirement. Although the
initial project plan differed significantly from the final plan, my sort-term time estima-
tions for the tasks were quite accurate. In addition to project management, I was also
responsible for the organization of the majority of the meetings, for instance, the meet-
ings with the process engineers and the project steering group meetings. All those
meetings helped me to improve my soft skills, for example, my presentation and or-
ganization skills.
In conclusion, this project was a great experience. I had the opportunity to gain expe-
rience in a new domain. The Eclipse modeling tools that I used (EMF and Sirius)
broaden my experience and knowledge about model driven software engineering. On
top of that, the cooperation with the stakeholders and the project management respon-
sibilities helped me to improve my soft skills.
13.2 Design criteria revisited This section presents a reflection of the project based on the design criteria that were
introduced in Section 3.6
Usability
Usability should be addressed by means of making the product easy to understand and
use. Functionality that could reduce the steps that a process engineer needs in order to
perform an action is implemented. A wizard that simplifies the creation of a new urea
plant project is implemented. With the wizard the number of clicks required in order
to create a new project, create a root instance of the model in the project, select the
viewpoints for the project, and create the representations for the root instance, reduced
from more than 40 to 7. In addition to the wizard, functionality that automatically gen-
erates diagrams is implemented. For example, in a complete urea plant design more
than a hundred diagrams are generated automatically.
Navigability
In the previous tools the process engineers had to scroll and search for keywords in the
text files in order to find the desired piece of information, in the new application all the
information is structured in diagrams. In order to increase the navigability options and
to provide all the necessary information in the diagrams, extra associations are added
in the meta-model. An example is given in Section 8.2.3. In addition, the diagrams
provide information that wasn’t available with the previous tools, for instance, the his-
tory tracking of the free and fixed variables.
Extensibility
The plug-in based architecture that is used in this project is ideal for an extensible
application. New diagrams can easily be created by modifying the Tisflo Sirius plug-
in. The domain model can be extended by modifying the Tisflo meta-model plug-in.
New plug-ins that contain other domain models or functionality could simply be added
on the Tisflo feature project and be deployed in a future version of the RCP.

79


81
Glossary This chapter presents the terminologies used in this report.
Term Definition
API Application Programming Interface
BEP Basic Engineering Package
DAT File extension of the text files that the process engineers
are storing the information needed for urea plant designs
DLL File extension of dynamic-link library files
Eclipse IDE Eclipse Integrated Development Environment
EMF Eclipse Modeling Framework
EPC Engineering, Procurement, and Construction
H&MB Heat and Material Balances
JDK Java Development Kit
JNI Java Native Interface
JVM Java Virtual Machine
MDE Model-driven engineering
MOF Meta-Object Facility
MoSCoW The framework for prioritizing requirements by four
groups: Must, Should, Could, Would
OMG Object Management Group
OSGi Open Service Gateway Initiative
PDEng Professional Doctorate in Engineering
PDP Process Design Package
POM Project Object Model
PSG Project Steering Group
RCP Rich Client Platform
Sirius Eclipse plug-in for creating visual representations
ST Software Technology
Stamicarbon The company name
Tisflo The software program name of the flowsheet solver
TU/e Eindhoven University of Technology
UI User Interface
UML Unified Modeling Language
VSM Viewpoint Specification Model
VSP Viewpoint Specification Project
WBS Work-Breakdown Structure
XMI XML Metadata Interchange
XML Extensible Markup Language

82
83
Bibliography
[1] M. Roser and E. Ortiz-Ospina, "World Population Growth," Our World in
Data, [Online]. Available: https://ourworldindata.org/world-population-
growth/. [Accessed 11 August 2017].
[2] M. Roser and H. Ritchie, "Land Use in Agriculture," Our World in Data,
[Online]. Available: https://ourworldindata.org/land-use-in-agriculture/.
[Accessed 11 August 2017].
[3] "Stamicarbon," Stamicarbon, [Online]. Available:
https://www.stamicarbon.com/. [Accessed 11 August 2017].
[4] "Urea Facts," Stamicarbon, [Online]. Available:
https://www.stamicarbon.com/urea-facts. [Accessed 11 August 2017].
[5] "TISFLO Flowsheet Simulation User Manual," Stamicarbon, Geleen, 1992.
[6] "MoSCoW method," Wikipedia, [Online]. Available:
https://en.wikipedia.org/wiki/MoSCoW_method. [Accessed 11 August 2017].
[7] D. Gallardo, "Developing Eclipse plug-ins," IBM, 01 December 2002.
[Online]. Available: https://www.ibm.com/developerworks/library/os-
ecplug/index.html. [Accessed 11 August 2017].
[8] "Eclipse Platform," Eclipse Platform, [Online]. Available:
https://projects.eclipse.org/projects/eclipse.platform. [Accessed 11 August
2017].
[9] "Eclipse Modeling Framework (EMF)," Eclipse EMF, [Online]. Available:
https://www.eclipse.org/modeling/emf/. [Accessed 11 August 2017].
[10] "Eclipse Sirius Overview," Eclipse Sirius, [Online]. Available:
https://eclipse.org/sirius/overview.html. [Accessed 11 August 2017].
[11] "Rich Client Platform," Eclipse RCP, [Online]. Available:
https://wiki.eclipse.org/Rich_Client_Platform. [Accessed 11 August 2017].
[12] A. Eidsness and P. Rapicault, "Branding Your Application," Eclipse and IBM
OTI Labs, 16 September 2004. [Online]. Available:
https://eclipse.org/articles/Article-Branding/branding-your-application.html.
[Accessed 11 August 2017].
[13] P. Kruchten, "Architectural Blueprints—The “4+1” View," IEEE Software,
vol. 12, no. 6, pp. 42-50, November 1995.
[14] "MetaObject Facility," Object Management Group, [Online]. Available:
http://www.omg.org/mof/. [Accessed 11 August 2017].
[15] "Specifying Viewpoints," Eclipse Sirius, [Online]. Available:
https://www.eclipse.org/sirius/doc/specifier/general/Specifying_Viewpoints.h
tml. [Accessed 11 August 2017].
[16] "What is Maven," Apache Maven, [Online]. Available:
https://maven.apache.org/what-is-maven.html. [Accessed 11 August 2017].
[17] "Introduction to the POM," Apache Maven, [Online]. Available:
https://maven.apache.org/guides/introduction/introduction-to-the-pom.html.
[Accessed 11 August 2017].
[18] "OSGi," OSGi Alliance, [Online]. Available:
https://en.wikipedia.org/wiki/OSGi. [Accessed 11 August 2017].
[19] "Tycho - Building Eclipse plug-ins with maven," Eclipse Tycho, [Online].
Available: https://eclipse.org/tycho/. [Accessed 11 August 2017].
[20] L. Vogel and S. Scholz, "Eclipse Tycho for building Eclipse Plug-ins, OSGi
bundles and RCP applications - Tutorial," Vogella, 31 March 2016. [Online].
Available: http://www.vogella.com/tutorials/EclipseTycho/article.html.
[Accessed 11 August 2017].

84

85


87
Appendix A: The complete meta-model
Figure 37 The complete meta-model

88
Appendix B: Comparison be-
tween textual representations
and visual representations
Figure 38 Input and output streams of a section in a textual representation
Figure 39 Input and output streams of a section in a visual representation

89
Figure 40 Streams and nodes in textual representation
Figure 41 Streams and nodes in visual representation
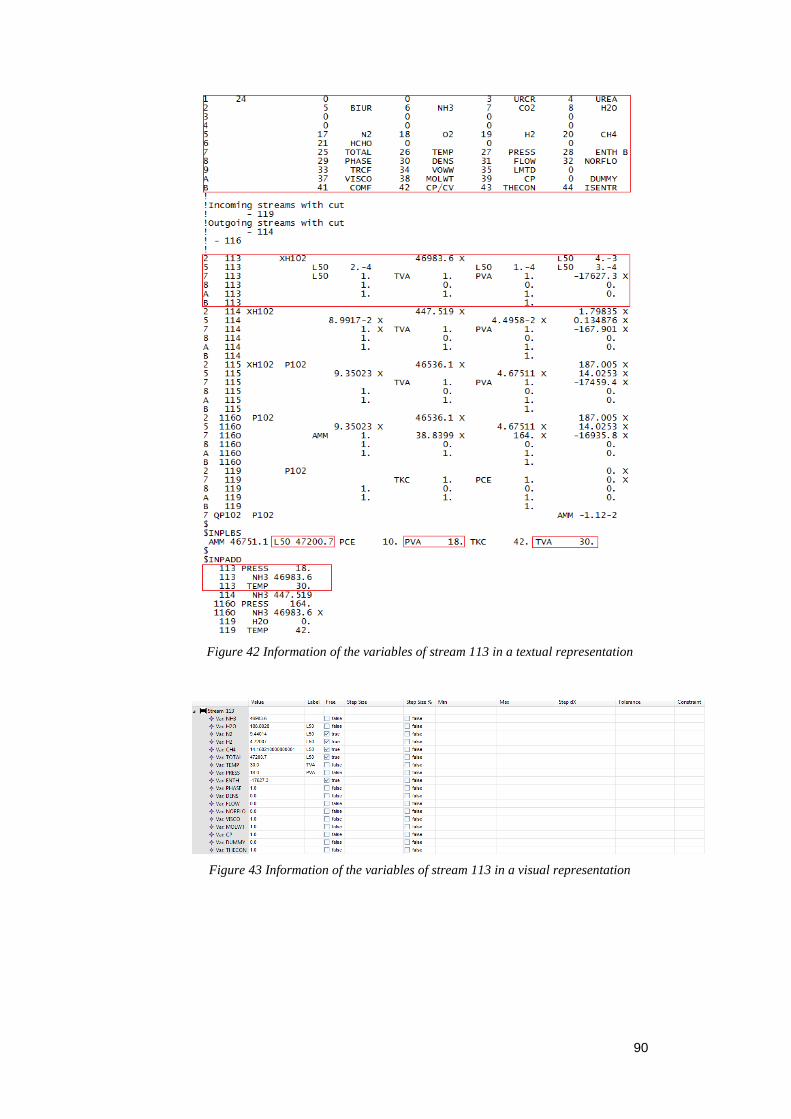
90
Figure 42 Information of the variables of stream 113 in a textual representation
Figure 43 Information of the variables of stream 113 in a visual representation

91


93
About the Author
Konstantinos Raptis received his diploma in Electrical
and Computer Engineering from the Aristotle Univer-
sity of Thessaloniki, Greece in 2015. During his stud-
ies, he focused on Software Technology and Computer
Science. He is also interested in Game Theory and he
has won many poker and sports tipster competitions.
His diploma thesis is titled “Real-time Online Betting
Analysis – The THMMY Case-Study.” In his thesis, he
created an interactive Ruby on Rails betting platform
with a MySQL database that encompasses a sophisti-
cated algorithm for real-time betting analysis on the
dynamic calculation of profit margins. He invited the
students to bet on what they thought that the average
grade in a course would be.
From September 2015 until September 2017, he
worked at the Eindhoven University of Technology as
a PDEng trainee of the Software Technology program
from the 4TU.Stan Ackermans Institute. During his
graduation project, he worked at Stamicarbon on a pro-
ject focused on visual editing and solving flowsheet
models.

94