visitor insights 2016 - ecotourism.org.au · Surf Coast Data Regions 3 Maps 3 ... marketing for the...
20
VISITOR INSIGHTS 2016
Transcript of visitor insights 2016 - ecotourism.org.au · Surf Coast Data Regions 3 Maps 3 ... marketing for the...

visitor insights
2016

2
Purpose of Report 3
Surf Coast Data Regions 3
Maps 3
ExEcutivE Summary 4
Summary of Total Visitation to Surf Coast 5
total viSitation and viSitor nightS 5
Total Visitation and Visitor Nights – 5 year trend 5
Surf Coast Visitation by Quarter 6
Market Share of Great Ocean Road Visitation 7
top rEgional dEStinationS 8
Top 30 Regional destinations in VIC/NSW 8
Top 20 Regional Destinations Victoria 8
viSitor information cEntrES 9
Surf coaSt domEStic ovErnight viSitor profilE 10
Total Nights 10
Purpose of Visit to the Surf Coast 10
Accommodation 11
Origin 11
Age 11
Travel Party 11
Activities and Accommodation Types 11
Surf coaSt day viSitor profilE 12
Surf coaSt intErnational viSitor profilE 12
Surf coaSt Sub-rEgion profilES 13
Total Visitation 13
Domestic Overnight Visitors 13
Domestic Visitor Nights 13
Visitation by Quarter 14
Stop Overs 14
Activities 15
Room Occupancy Rate 16
Key Attractions Being Visited in the Region 17
Surf coaSt EvEntS 18
futurE viSitation 19
table of contents
Note: This report presents key statistics and information about the number and type of visitors to Surf Coast Shire in 2015/16. Previous years’ data has also been presented in some cases to enable a longer term trend to be considered.

3s u r f c o a s t s h i r e v i s i t o r i n s i g h t s 2 0 1 5 / 1 6
PurPose of rePort
surf coast Data regions
This report presents key statistics and information about the number and type of visitors to Surf Coast Shire in 2015/16. Previous years’ data has also been presented in some cases to enable a longer term trend to be considered.
Surf Coast Shire Visitor Insights benchmarks the areas of Surf Coast Shire, Lorne - Anglesea and Torquay’s performance in comparison to other regional destinations in Victoria and N.S.W.
Data is provided by Tourism Research Australia, a branch of Austrade. Tourism Research Australia is Australia’s leading provider of quality tourism intelligence across both international and domestic markets and provides statistics, research and analysis to support industry development, policy development and marketing for the Australian tourism industry.
Data will change every year as provided by Tourism Research Australia. Data has also been sourced from the Australian Bureau of Statistics (ABS).
This publication can be used to provide information to businesses to assist in the development of plans, the community, investors and developers on the current tourism capacity in Surf Coast Shire and to identify opportunities for investment in the municipality.
Statistics presented in this document are based on areas determined as Statistical Area Level 2 (SA2) and Statistical Area Level 3 (SA3), by Australian Statistical Geography Standards (ASGS). SA2s and SA3’s are the geographical areas utilised by Tourism Research Australia as well as ABS.
The ASGS brings all the regions for which the ABS publishes statistics to one framework and is used for the collection and dissemination of geographically classified statistics. It provides a common framework of statistical geography and enables the production of statistics which are comparable.
Specific data sets used include:
• Torquay (SA2)
• Winchelsea (SA2)
• Lorne - Anglesea (SA2)
• Western (SA3)
• Due to changes to the National Visitor Survey (NVS) methodology (to include mobile phone interviewing and new estimated resident population projections from January 2014), care should be taken when comparing year ending September 2014 survey results with those from previous years. These changes represent a break in the time series.
• From 2014, the NVS has moved to a dual frame sample methodology. This means one portion of the sample is now interviewed on residential fixed-lines and another on mobile phones.
• Tourism Research Australia started using the Australian Bureau of Statistics’ new projections of estimated resident population (ERP) from March quarter 2014.
• The ERP projections for those aged 15 years or more are used as an input to the NVS weighting. Therefore, changes to ERP projections will impact NVS results from 2014 onwards.
map of torquay, lornE - anglESEa, WinchElSEa (Sa2 arEaS)
For more information on the methodology changes please go to www.tra.gov.au / News & Media / Fact-sheet-2014-Updates-to-the-IVS/NVS

surf coast shire: tourism engine room of the great ocean roaD
The Surf Coast Shire, with its beaches, National Parks and rural environment, is located in south-western Victoria, 1.5 hours from Melbourne’s CBD and 20 minutes south of Geelong’s CBD. With its rich agricultural and aesthetic attributes, the hinterland is increasingly contributing to the shire’s economic development, particularly via local food and niche tourism opportunities.
Worth over $1 billion annually, Surf Coast Shire’s economy continues to experience strong growth. As a distinctly different economy to that of Geelong and surrounding regions, with the tourism and surfing sectors playing a key role. Surfing represents almost 27% of all jobs (more than 2,000) and 26.6% of all value add activity. Strong population growth will see a need to create approximately 3,000 additional jobs by 2031 in a shire where some 87 per cent of all businesses employ four or less people.
Tourism also plays a vital role, with more than 2.1 million visitors directly expending over $430m during 2015/16. It is estimated that over $42 million in wages and salaries is attributed to tourism in Surf Coast each year. After factoring in all other forms of indirect expenditure, over $683 million were injected by tourism into the local economy. In terms of value add activity the Tourism sector contributes over $90 million annually to Surf Coast Shire while accounting for 15.2% of total employment (Surf Coast’s largest employment sector).
Surf Coast Shire is home to nine distinct townships: Aireys Inlet, Anglesea, Deans Marsh, Fairhaven, Jan Juc, Lorne, Moriac, Torquay and Winchelsea. These townships and the rural hinterland support over 3,000 businesses which drive an economy estimated to be over $1 billion annually.
ExEcutivE Summary
4

5s u r f c o a s t s h i r e v i s i t o r i n s i g h t s 2 0 1 5 / 1 6
The Surf Coast region received an estimated 2.1 million total visitors to the financial year ending June 2016 (Table 1). The region received over 2.3 million overnight visitor nights during the same period with a direct expenditure of $432 million. Annual visitation to Surf Coast Shire contributes $683 million to the local economy.
Domestic overnight visitors stayed 3 nights on average, and spent the most money per day ($134). International visitors by comparison stayed 2.1 nights on average and spent $92 per day.
Domestic Overnight Visitors also generated the most direct expenditure ($299.7 million), followed by Domestic Day-Trippers ($124.5 million) and International Visitors ($8.2 million).
Surf coaSt WElcomEd ovEr 2.1 million viSitorS Who contributEd a total of ovEr $683 million to thE Economy in 2015/16.
Surf Coast Visitor Type
Visitor Numbers
Visitor Nights
Average Visitor Nights
Average Expenditure Per Day*
Visitor Impact ($) Direct
Total Visitor Impact (Direct & Indirect)
Domestic Day Visitors 1,339,000 NA NA $93 $124,527,000 $221,658,060
Domestic Overnight Visitors
780,000 2,237,000 3.0 ave $134 $299,758,000 $449,637,000
International Visitors 42,052 90,014 2.1 ave $92 $8,281,288 $12,421,932
Total 2,161,052 2,327,014 $432,566,288 $683,716,992
*Source: Western Region & Surf Coast Data, Regional Expenditure, December 2016, Tourism Research Australia.
summary of total visitation to surf coast
total visitation anD visitor nights– 5 year trenD
Table 1: Summary of Surf Coast Visitor Data
Figure 1 shows that the 61.9% of all visitors to the Surf Coast were day visitors, followed by overnight visitors (36.1%) and international visitors (1.9%).
visi
tOR
tYPE
(%)
viSitor typES
Total Visitation and Visitor Nights – Trend Figure 1 shows that the 61.9% of all visitors to the Surf Coast were day visitors, followed by overnight visitors (36.1%) and international visitors (1.9%).
Figure 1: Surf Coast visitor by type (%)
More than half of all visitors are day trippers
0%
10%
20%
30%
40%
50%
60%
70%
80%
90%
100%
2011/12 2012/13 2013/14 2014/15 2015/16
Visitor Types
International Domestic Overnight Domestic Daytrip
100%
90%
80%
70%
60%
50%
40%
30%
20%
10%
0%2011/12 2012/13 2013/14 2014/15 2015/16
Total Visitation and Visitor Nights – Trend Figure 1 shows that the 61.9% of all visitors to the Surf Coast were day visitors, followed by overnight visitors (36.1%) and international visitors (1.9%).
Figure 1: Surf Coast visitor by type (%)
More than half of all visitors are day trippers
0%
10%
20%
30%
40%
50%
60%
70%
80%
90%
100%
2011/12 2012/13 2013/14 2014/15 2015/16
Visitor Types
International Domestic Overnight Domestic Daytrip
international
Overnights
Day-trippers
More than half of all
visitors are day trippers
total viSitation and viSitor nightS

In 2015/16, the total visitation to the Surf Coast was 2,161,052 which is the highest visitation in the past five years. There has been an average annual growth of 7.5% during this period.
2011/12 2012/13 2013/14 2014/15 2015/16Series1 1504332 1388179 1897828 1729837 2161052
0
500000
1000000
1500000
2000000
2500000
2011/12 2012/13 2013/14 2014/15 2015/161890641 2030815 3107080 2579597 2327014
0
50
100
150
200
250
300
350
X 10
000
Total Visitor Nights
total visitation anD visitor nights– 5 year trenDtotal viSitation 2011/12 to 2015/16
day tripS pEr quartEr - 4 yEar avEragE
total viSitor nightS 2011/12 to 2015/162,500 3,500
3,000
2,500
2,000
1,500
1,000
500
2,000
1,500
1,000
500
In 2015/16, the total visitation to the Surf Coast was 2,161,052 people which is the highest level of visitation in the past five years. There has been an average annual growth of 7.5% during this period.
Since 2011/12, the average annual growth rate in visitor nights is 4.2%. While total visitation has been growing, this has been driven by an increased number of day-trippers. The total number of overnight visitors has decreased. These visitors are now spending less per day than in previous years, and are staying for less time. This has resulted in lower yield in the sector.
surf coast visitation by quarterThe March quarter (Summer) was the most popular time for visitors with 41% of visitation, generating the most visitor nights. The second most popular quarter was December (Spring) at 28%. The June quarter shows a 10% increase in total visitation in 2015/16, and a 3.9% increase in visitor nights compared to a five year average. The September quarter had a 14% decline in visitor nights compared to the five year average.
41%
17%13%
28%
0%
5%
10%
15%
20%
25%
30%
35%
40%
45%
March quarter June quarter Septemberquarter
December quarter
35%
21%
10%
35%
41%
17%13%
28%
40%
20%16%
24%
0%
5%
10%
15%
20%
25%
30%
35%
40%
45%
March quarter June quarter September quarter December quarter
Visitor Nights per quarter
International Daytrip Domestic overnight
suMMer and spring are the Most popular tiMes to visit
6
2011/121504332
2012/131388179
2013/141897828
2014/151729837
2015/162161052
2011/121890641
2012/132030815
2013/143107080
2014/152579597
2015/162327014
visi
tORs
(tho
usan
ds)
NiG
Hts
(th
ousa
nds)

7s u r f c o a s t s h i r e v i s i t o r i n s i g h t s 2 0 1 5 / 1 6
surf coast market share of great ocean roaD visitationOver 5.1 million visitors visited the Great Ocean Road region with the Surf Coast Shire welcoming over 2 million of those visitors.
viSitor typE pEr quartEr
41%
17%13%
28%
0%
5%
10%
15%
20%
25%
30%
35%
40%
45%
March quarter June quarter Septemberquarter
December quarter
35%
21%
10%
35%
41%
17%13%
28%
40%
20%16%
24%
0%
5%
10%
15%
20%
25%
30%
35%
40%
45%
March quarter June quarter September quarter December quarter
Visitor Nights per quarter
International Daytrip Domestic overnight
Great Ocean Road Surf Coast Region
Domestic Day Visitors 2,989,362 1,339,000
Domestic Overnight Visitors 1,934,896 780,000
International Visitors 206,009 42,052
Total 5,130,266 2,161,052
Surf coaSt markEt SharE %
Surf Coast Shire42%
Great Ocean Road Region
58%
The Surf Coast receives 42% of all visitors to the Great Ocean Road - 40% of all domestic overnight and 45% of all day visitors. Only 20% of total international visitors come to the Surf Coast.
the surf coast receives 42% of the 5.1 Million visitors to the
great ocean road region

8
top 20 victorian rEgional daytripS
Lorne-Anglesea is the 7th most visited destination in regional Victoria, Torquay is the 15th
Peak Overnight Population It is estimated that the population of Surf Coast on a peak holiday night (such as New Year’s Eve) could swell to 85,409, a 206% increase or triple the permanent population. (Source: Economic Indicators Bulletin, Enterprise Geelong 2013)
Permanent Population 2013
Population Holiday Homes
Population Caravan Parks, Cabins & Camping Sites
Population Hotels, Motels, Apartments, Units & B&Bs
Peak Overnight Population
Total Geelong & The Bellarine 220554 78506 25895 3960 328915 Surf Coast Shire
Aireys Inlet/Fairhaven/Moggs Creek 1037 6432 415 290 8173 Anglesea 2520 10341 1795 85 14741 Deans Marsh 302 418 75 10 806 Jan Juc 3680 3053 1440 60 8233
1,91
9
1,68
0
1,26
4
1,15
1
912
871
738
725
722
671
627
614
588
578
551
513
502
493
473
451
0
500
1,000
1,500
2,000
2,500
Top 20 Victorian Regional Daytrips
Within Victoria both Lorne – Anglesea and Torquay are in Victoria’s top 20 regional destinations for daytrips visitors. Both destinations have also had an increased number of domestic overnight visitor trips from 2014/15.
toP 20 regional Day triP Destinations victoria
lorne-anglesea is the 7th Most
visited destination in regional
victoria, torquay is the 15th
DAY
tRiP
s (t
hous
ands
)
Both Lorne and Torquay are in the top 30 regional destinations for Victoria and New South Wales combined for overnight visitors.
toP 30 regional overnight Destinations in vic/nsW
Top 20 Regional Destinations Victoria Within Victoria both Lorne – Anglesea and Torquay are in Victoria’s top 20 regional destinations for daytrips visitors. Both destinations have also had an increased number of domestic overnight visitor trips than 2014/15.
1064
663
646
619
581
558
550
544
521
475
474
465
456
442
441
384
379
370
370
363
339
337
327
318
315
300
293
292
290
290
0
200
400
600
800
1000
1200
Domestic Overnight Visitors 15/16
top rEgional dEStinationS
lorne-anglesea is the 10th Most visited regional
destination in victoria and nsW, torquay
is the 29th
NiG
Hts
(th
ousa
nds)

viSitor information cEntrES (vics)
9s u r f c o a s t s h i r e v i s i t o r i n s i g h t s 2 0 1 5 / 1 6s u r f c o a s t s h i r e v i s i t o r i n s i g h t s 2 0 1 5 / 1 6
In 2015/16, the Surf Coast Visitor Information Centres assisted 259,296 people. The Lorne Visitor Centre answered 60% of all enquiries, followed by Torquay (33%), Anglesea (6%) and Winchelsea (less than 1%).
The Lorne Visitor Information centre is also home to The Great Ocean Road Story, a permanent exhibition telling the story of the construction of the Great Ocean Road.
The story of the construction of the Great Ocean Road captures a unique time in Australia’s and the world’s history when the Great Ocean Road itself was built over a 13 year period by more than 3,000 Australian ex-servicemen and other individuals whose toil, sweat, blisters, hardships, heat, cold and adversity resulted in a breathtaking memorial to those who fought for Australia during World War One.
Now also available to add to this exhibition is the recently published “Historical drivers guide to the Great Ocean Road” the publication features local history and maps, points of interest and interpretive plaques, available for purchase at the centres.
Torquay VIC33.4%
Anglesea VIC5.7%
Winchelsea VIC0.4%
Lorne VIC 60.5%
viSitor information cEntrE EnquiriES
torquay viSitor information cEntrE
lornE viSitor information cEntrE
the great ocean roaD story
9
10
PurPose of visit to the surf coast
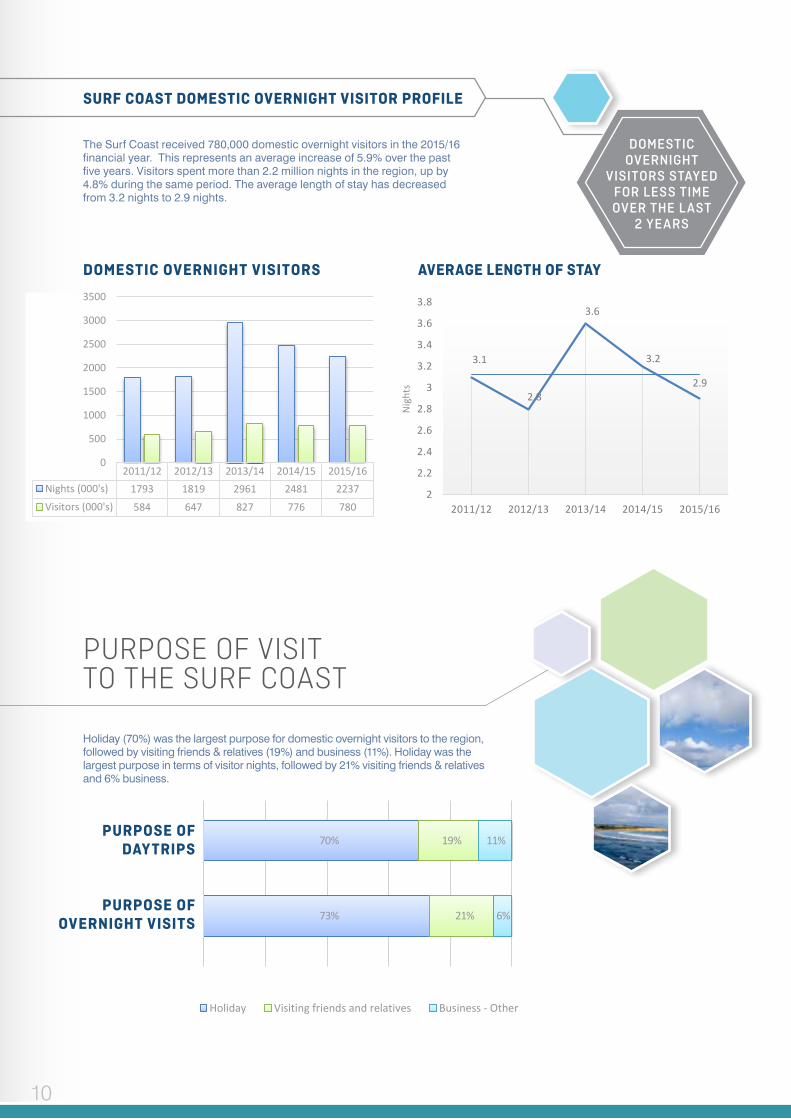
Holiday (70%) was the largest purpose for domestic overnight visitors to the region, followed by visiting friends & relatives (19%) and business (11%). Holiday was the largest purpose in terms of visitor nights, followed by 21% visiting friends & relatives and 6% business.
The Surf Coast received 780,000 domestic overnight visitors in the 2015/16 financial year. This represents an average increase of 5.9% over the past five years. Visitors spent more than 2.2 million nights in the region, up by 4.8% during the same period. The average length of stay has decreased from 3.2 nights to 2.9 nights.
domEStic ovErnight viSitorS avEragE lEngth of Stay
doMestic overnight
visitors stayed for less tiMe over the last
2 years
2.8
Surf Coast Domestic Overnight Visitor Profile
Total Nights The Surf Coast received nearly 780,000 domestic overnight visitors in the 2015/16 financial year. This represents an average increase of 5.9% over the past five years. Visitors spent more than 2.3 million nights in the region, up by 4.8% during the same period. The average length of stay has decreased from 3.2 nights to 2.9 nights.
Purpose of visit to the Surf Coast Holiday (70%) was the largest purpose for domestic overnight visitors to the region, followed by visiting friends & relatives (19%) and business (11%). Holiday was the largest purpose in terms of visitor nights, followed by 21% visiting friends & relatives and 6% business.
2011/12 2012/13 2013/14 2014/15 2015/16Nights (000's) 1793 1819 2961 2481 2237Visitors (000's) 584 647 827 776 780
0
500
1000
1500
2000
2500
3000
3500
3.1
2.8
3.6
3.2
2.9
2
2.2
2.4
2.6
2.8
3
3.2
3.4
3.6
3.8
2011/12 2012/13 2013/14 2014/15 2015/16
Surf coaSt domEStic ovErnight viSitor profilE
Nig
hts
purpoSE of daytripS
purpoSE of ovErnight viSitS
Would like to show these two graphs above side by side in a bar – couldn’t work out how to do it in excel
0% 20% 40% 60% 80% 100%
1
Purpose of Daytrips
Holiday Visiting friends and relatives Business - Other
0% 20% 40% 60% 80% 100%
4 year average
Purpose of Overnight Visits
Holiday Visiting friends and relatives Business - Other
70%
73%
19%
21%
11%
6%

11s u r f c o a s t s h i r e v i s i t o r i n s i g h t s 2 0 1 5 / 1 6
accommoDation ‘Hotel/resort/motel’ was the most popular commercial accommodation option (23%) followed by caravan park (13%). In 2015/16, over 52% of overnight visitors stayed at a friends or relatives property or their own holiday house.
originThe region received 88.42% of visitors and 84.63% of nights from within Victoria. The majority (63%) of these visitors came from Melbourne.
Interstate visitation contributed 11.58% of total domestic overnight visitors with NSW as the primary source market (39%) followed by South Australia (22%).
ageThe most common type of domestic overnight visitor to the Surf Coast in 2015/16 was aged 55+ (31%).
travel PartyMost domestic overnight visitors (55%) were friends or family travelling together. 30% were adult couples.
Friends or relatives property
34%
Own Property18%
Hotel/Resort/Motel or Motor Inn
23%
Rented house/apartment/flat
or unit13%
Caravan park or commercial
camping ground12%
accommodation typE
moSt popular daytrip activitiES
Activities and accommodation types The most popular activity for day trip visitors in 2015/16 was to go to the beach (31%), followed closely by shopping (12%) and eating out (24%).
31%
12% 12%
24% 22%
0%
5%
10%
15%
20%
25%
30%
35%
Go to the beach Visit friends &relatives
Go shopping forpleasure
Eat out / dine at arestaurant and/or
cafe
Other Activities
Most Popular Daytrip Activities
activities anD accommoDation tyPesThe most popular activity for day trip visitors in 2015/16 was to go to the beach (31%), followed closely by eating out (24%) and shopping (12%).
agE of domEStic ovErnight
viSitor 55+ years31%
45 to 5415%
15 to 24 years22%
25 to 34 years16%
35 to 4416%
Friends or relatives travelling together
31%
Travelling alone13%
Adult couple30%
Family group -
parents and children
24%
Other 2%
travEl party
20%
14%
22%
32%12%
United Kingdom
Europe
New Zealand
United states of America - Canada
Other Countries
origin
the rental of private
accoMModation greW by 8.7% in 2016.there are 560 airbnb
listings in surf coast shire.
tourism and hotel market outlook, deloitte 2017
12
day trip viSitorS
intErnational viSitorS
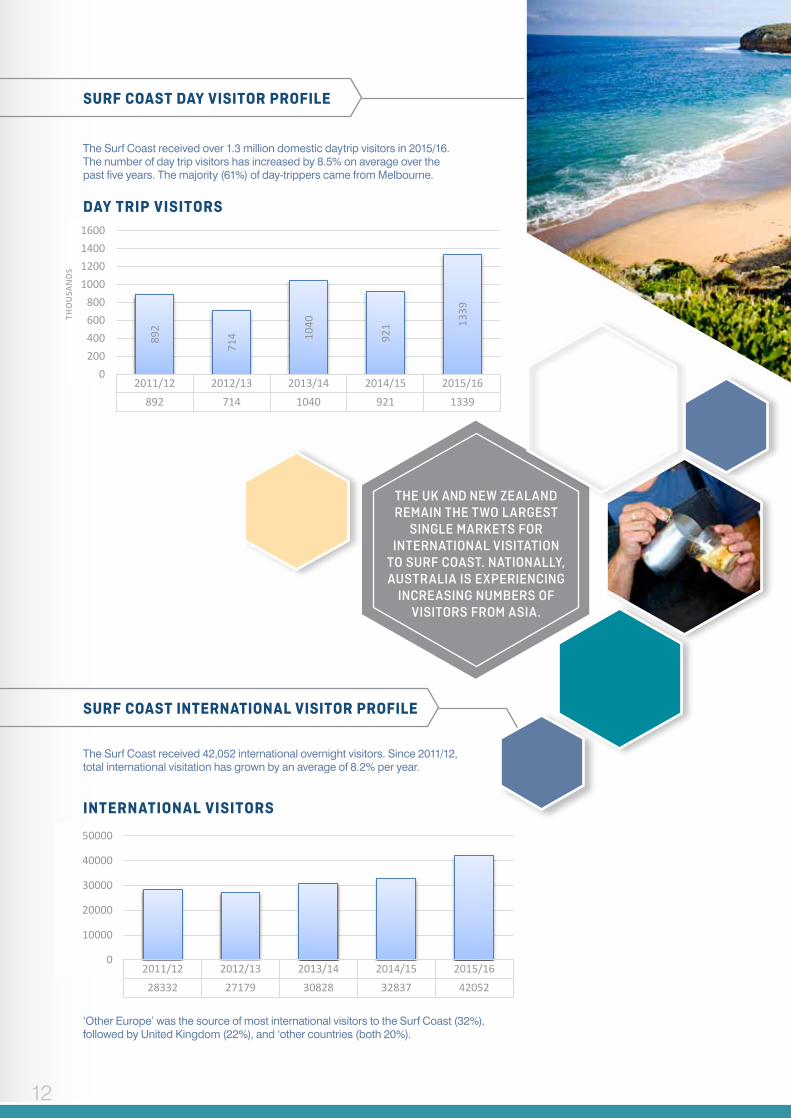
The Surf Coast received over 1.3 million domestic daytrip visitors in 2015/16. The number of day trip visitors has increased by 8.5% on average over the past five years. The majority (61%) of day-trippers came from Melbourne.
The Surf Coast received 42,052 international overnight visitors. Since 2011/12, total international visitation has grown by an average of 8.2% per year.
‘Other Europe’ was the source of most international visitors to the Surf Coast (32%), followed by United Kingdom (22%), and ‘other countries (both 20%).
Surf Coast Day Visitor Profile The Surf Coast received over 1.3 million domestic daytrip visitors in 2015/16. The number of day trip visitors has increased by 8.5% on average over the past five years. The majority (61%) of day-trippers came from Melbourne
2011/12 2012/13 2013/14 2014/15 2015/16Day Trip Visitors 892 714 1040 921 1339
892
714 10
40
921 13
39
0200400600800
1000120014001600
THO
USA
NDS
Day Trip Visitors
thO
usa
ND
s
Surf Coast International Visitor Profile The Surf Coast received 42,052 international overnight visitors. Although it is a significant increase from last year, the total international visitation over the past five years has increased by 8.2% a year over the last five years.
‘Other Europe’ was the source of most international visitors to the Surf Coast (32%), followed by United Kingdom (22%), and ‘other countries (both 20%).
2011/12 2012/13 2013/14 2014/15 2015/16Series1 28332 27179 30828 32837 42052
0
10000
20000
30000
40000
50000
International Visitors
22%
32%12%
14%
20%
Origin of International Visitors
United Kingdom Europe New Zealand United States of America - Canada Other Countries
Surf coaSt day viSitor profilE
Surf coaSt intErnational viSitor profilE
the uK and neW Zealand reMain the tWo largest
single MarKets for international visitation
to surf coast. nationally, australia is experiencing
increasing nuMbers of visitors froM asia.

13s u r f c o a s t s h i r e v i s i t o r i n s i g h t s 2 0 1 5 / 1 6
viSitor numbErS
Sub-rEgion total viSitation
The following section compares a visitor profile using specific data sets for Torquay and Lorne – Anglesea. Data is less reliable on a smaller area and in some cases; the statistics are gained from an average of a four year profile. Where possible data is used from financial year end 2015/16. The data for Winchelsea is not available as it was not statistically significant or available from Tourism Research Australia.
Surf Coast Visitor Type Torquay Lorne - Anglesea
Domestic Day Visitors 551,000 738,000
Domestic Overnight Visitors 290,000 475,000
International Visitors 16,442 25,693
Total 857,442 1,238,693
in 2015/16, lorne-anglesea received a total of 1,238,693
visitors and torquay received a total of
857,442 visitors
sub region Domestic overnight visitorsThe number of domestic overnight visitors to Torquay has increased at an average rate of 3.33% over the past five years. Lorne domestic overnight visitors has increased by 4.6% on average over the same period.
sub region Domestic visitor nightsLorne received over 1.24 million visitor nights in 2015/16 and Torquay received 847,000.
The average length of stay in Lorne-Anglesea has decreased from 2.8 nights in 2010/11 to 2.6 nights in 2015/16. The average length of stay in Torquay has decreased from 2.3 nights to 1.9 nights over the same period.
domEStic ovErnight viSitorS
Sub region Domestic Overnight Visitors
The number of domestic overnight visitors to Torquay has increased at an average rate of 3.33% over the past five years. Lorne domestic overnight visitors has increased by 4.6% on average over the same period.
Sub Region Domestic Visitor Nights Lorne received over 1.24 million visitor nights in 2014 and Torquay received 847,000.
The average length of stay in Lorne-Anglesea has decreased from 2.8 nights in 2010/11 to 2.6 nights in 2015/. The average length of stay in Torquay has decreased from 2.3 nights to 1.9 nights over the same period.
380 383413
453 468 475
245
194220
351
307290
10-11 11-12 12-13 13-14 14-15 15-16
No.
Vis
itors
000
's
Lorne - Anglesea Torquay
torquay & lornE-anglESEa Sub-rEgion profilES

14
sub region visitation by quarter
sub region stoPovers
the March quarter Was the
Most popular tiMe of year for
overnight visitors to torquay and lorne-anglesea.
viSitation by quartEr
Sub Region Visitation by Quarter The March quarter was the most popular time of year for overnight visitors to Torquay and Lorne-Anglesea.
Sub Region Stop Overs Over 85% of all visitors to both destinations had a single stopover during their trip.
37%
22%18%
23%
43%
19%14%
24%
0%
10%
20%
30%
40%
50%
March quarter June quarter September quarter December quarter
Visitation by Quarter
Torquay Lorne - Anglesea
85%
6% 9%
89%
5% 6%
0.00%
20.00%
40.00%
60.00%
80.00%
100.00%
1 Stopover 2 Stopovers 3 or more stopovers
Overnight Stopovers
Torquay Lorne - Anglesea
ovErnight StopovErS
100%
80%
60%
40%
20%
0%
Sub Region Visitation by Quarter The March quarter was the most popular time of year for overnight visitors to Torquay and Lorne-Anglesea.
Sub Region Stop Overs Over 85% of all visitors to both destinations had a single stopover during their trip.
37%
22%18%
23%
43%
19%14%
24%
0%
10%
20%
30%
40%
50%
March quarter June quarter September quarter December quarter
Visitation by Quarter
Torquay Lorne - Anglesea
85%
6% 9%
89%
5% 6%
0.00%
20.00%
40.00%
60.00%
80.00%
100.00%
1 Stopover 2 Stopovers 3 or more stopovers
Overnight Stopovers
Torquay Lorne - Anglesea
over 85% of all visitors to both
destinations had a single
stopover during their trip.

15s u r f c o a s t s h i r e v i s i t o r i n s i g h t s 2 0 1 5 / 1 6
sub region activitiesThe most popular activities in Torquay are going to the beach (68%), eating out (66%) and visiting friends or relatives (39%).
The most popular activities in Lorne are going to the beach (75%), eating out (64%) and sightseeing (39%).
torquay top activitiES
lornE top activitiES
Sub region activities The most popular activities in Torquay are going to the beach (68%), eating out (66%) and visiting friends or relatives (39%).
The most popular activities in Lorne are going to the beach (75%), eating out (64%) and sightseeing (39%)
68% 66%
39% 35% 32%21% 17% 15% 13% 11% 10%
0%10%20%30%40%50%60%70%80%
Torquay Top Activities
75%64%
39% 34% 26% 25% 24% 21% 17% 11% 10%0%
10%20%30%40%50%60%70%80%
Lorne Top Activities

16
room occuPancy rate
occupancy ratE
Room Occupancy Rate
37.7
34.7
46.7 51
.7 55.4
56.5 62
.7
62.2
54.3
55.4
35.3
34.139
.4 45.6 49
.3
50.5
62.1 64.8 69
.3
69.1
59.4
52.4
37.6 45
.8
44.142.9
49.5
58.1 58.559.2
64.0 64.462.1
58.4
46.243.2
0
10
20
30
40
50
60
70
80
Jul-15 Aug-15 Sep-15 Oct-15 Nov-15 Dec-15 Jan-16 Feb-16 Mar-16 Apr-16 May-16 Jun-16
% ETAR YCNAP
UCCO
MO
OR
Occupancy Rate
Lorne - Anglesea Torquay Western (TR)
takings Per room night
avEragE takingS pEr room
Takings per room night
$130.13 $130.00$137.55 $139.48
$147.91
$175.97
$195.10
$155.48$161.12
$144.95$135.12
$128.64
$164.03$154.18
$186.89$178.47
$185.19
$207.10
$254.67
$192.65 $193.02
$174.50
$158.59 $158.82
$94.49
$111.44$105.38
$133.32$138.65
$158.93$168.55
$134.39 $138.36
$122.26
$91.62$100.75
$0.00
$50.00
$100.00
$150.00
$200.00
$250.00
$300.00
July 2015 August 2015 September 2015
October 2015
November 2015
December 2015
January 2016
February 2016
March 2016 April 2016 May 2016 June 2016
Western (TR) Lorne - Anglesea Torquay

17s u r f c o a s t s h i r e v i s i t o r i n s i g h t s 2 0 1 5 / 1 6
key attractions being visiteD in the region
it is estiMated that up to
500,000 people visit ersKine
falls each year!
the dressMaKer costuMe exhibition
held in 2016 attracted over 22,000 visitors to the barWon parK
Mansion in Winchelsea.
shopping at surf city is a
popular activity, attracting over 1 Million visitors
each year!
each year over 54,000
people enjoy a World class WalKing destination offering inspiring landscapes
along the surf coast WalK
18
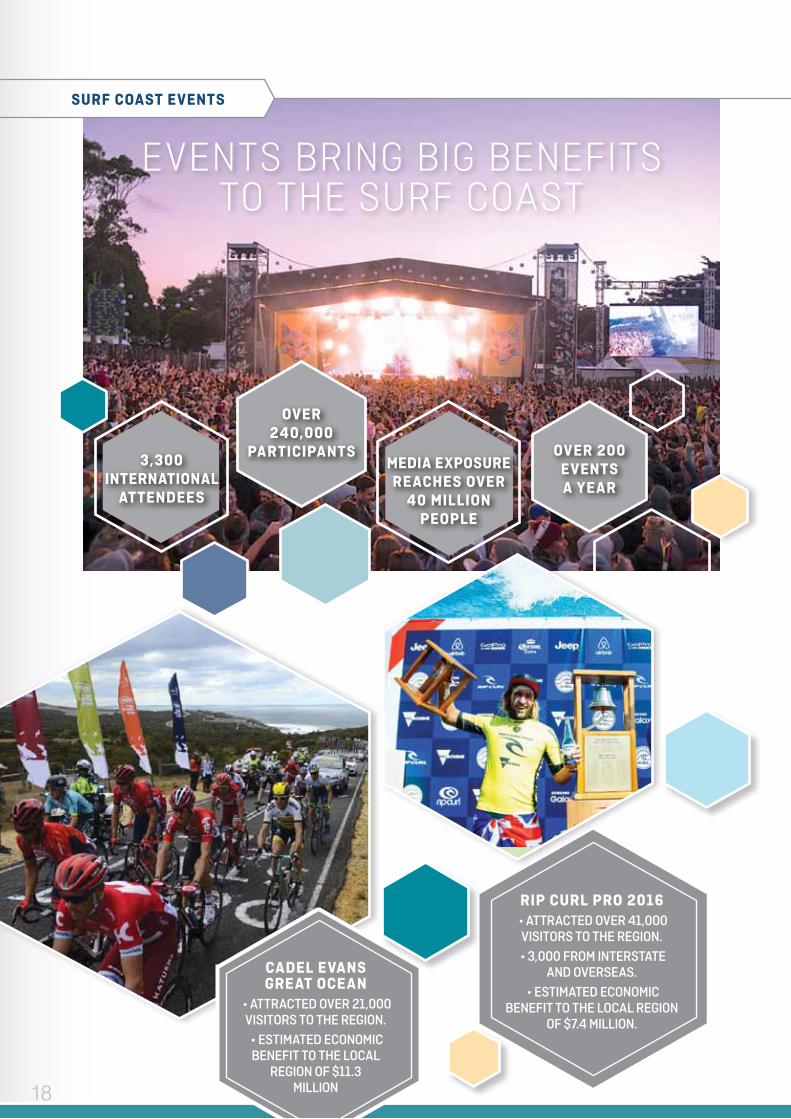
Surf coaSt EvEntS
events bring big benefits to the surf coast
ovEr 240,000
participantSmEdia ExpoSurE rEachES ovEr
40 million pEoplE
3,300 intErnational
attEndEES
ovEr 200 EvEntS a yEar
cadEl EvanS grEat ocEan
• AttrActed over 21,000 visitors to the region. • estimAted economic benefit to the local
region of $11.3 Million
rip curl pro 2016 • AttrActed over 41,000 visitors to the region.
• 3,000 from interstAte and overseas.
• estimAted economic benefit to the local region
of $7.4 Million.

19s u r f c o a s t s h i r e v i s i t o r i n s i g h t s 2 0 1 5 / 1 6
In 2014, Great Ocean Road Regional Tourism as part of the ‘Strategic Master Plan for The Great Ocean Road Region Visitor Economy 2015 – 2025’ projected various visitation scenarios for the coming decade. Forecasting for a low to moderate level of annual growth (1.7%pa), visitation to Surf Coast Shire was 217,341 visitors above forecast, and a 422,951 increase from the ending June 2015 to the year ending June 2016. This change has been driven by strong growth of domestic day trippers and residents located outside the municipality visiting Surf Coast Shire.
viSitation forEcaSt 2014 – 2023
Future Visitation
In 2014, Great Ocean Road Regional Tourism as part of the ‘Strategic Master Plan for The Great Ocean Road Region Visitor Economy 2015 – 2025’ projected various visitation scenarios for the coming decade. Forecasting for a low to moderate level of annual growth (1.7%pa), visitation to Surf Coast Shire was 217,341 visitors above forecast, and a 422,951 increase from the ending June 2015 to the year ending June 2016. This change has been driven by strong growth of domestic day trippers and residents located outside the municipality visiting Surf Coast Shire.
1,717,639
2,140,590
0
500000
1000000
1500000
2000000
2500000
2014 2015 2016 2017 2018 2019 2020 2021 2022 2023
Visitation Forecast 2014 - 2023
Forecast Visitation Actual Visitation
futurE viSitation
1,886,635
amy’S gran fondo • AttrActed over 18,000 visitors to the region.
• 3,000 from interstAte And overseas.
• estimAted economic benefit to the local region
of $15.2 Million.

EnquiriESAll enquiries about this report should be directed to the Economic Development Unit at Surf Coast Shire on (03) 5261 0600.
contact dEtailSSurf Coast ShireIn person: 1 Merrijig Drive Torquay Victoria 3228Post: PO Box 350, Torquay, VIC 3228Phone: (03) 5261 0600Email: [email protected]: www.surfcoast.vic.gov.au
Council’s Economic Development & Tourism Unit has collated a range of statistics to assist businesses in making strategic decisions about expanding or relocating to the Surf Coast including:• Economic Snapshot• Surf Industry Mapping• Visitor Insights• Economic Impact of Events
Contact us for more information and advice.
visitor insights
2015/16