Visit our online Annual Report at Target.com/annualreport · 2016 Annual Report 2016 Annual Report...
77
2016 Annual Report 2016 Annual Report
Transcript of Visit our online Annual Report at Target.com/annualreport · 2016 Annual Report 2016 Annual Report...

2016 Annual R
eport
2016Annual Report
Visit our online Annual Report at Target.com/annualreport
1000 Nicollet Mall, Minneapolis, MN 55403612.304.6073
Welcome to our 2016 Annual ReportTo explore key stories of the past yearand find out more about what’s in store,visit Target.com/abullseyeview. You canalso view our Annual Report online atTarget.com/annualreport.
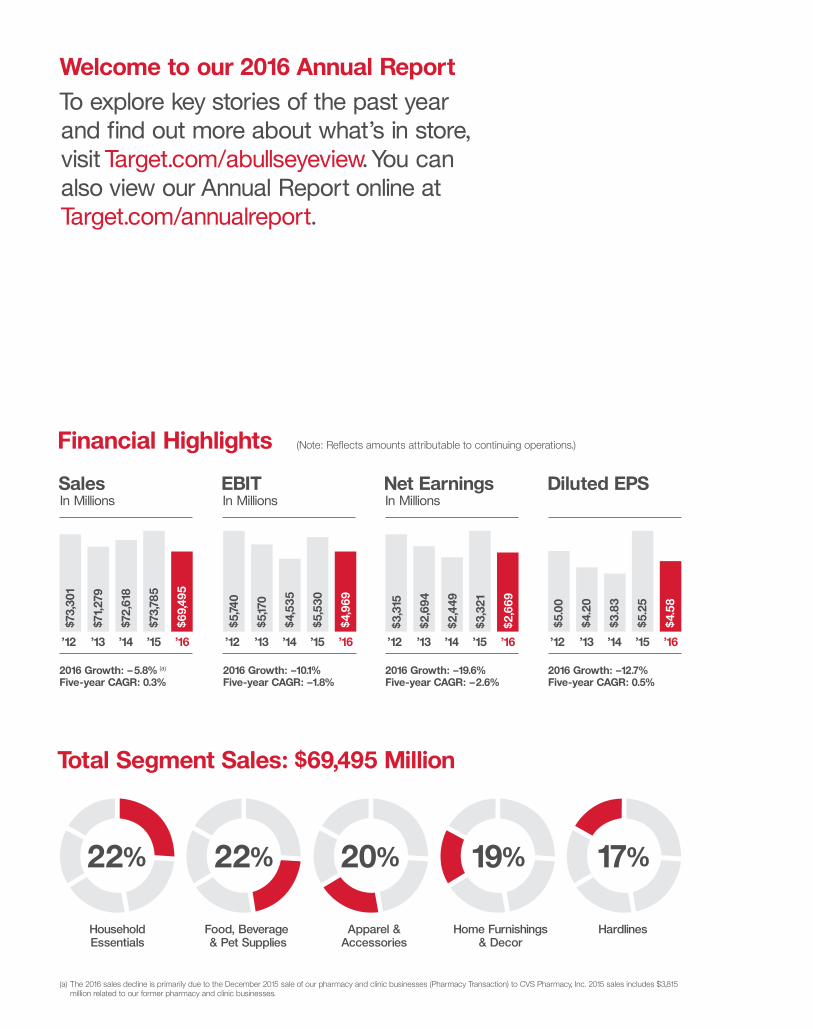
Financial Highlights (Note: Reflects amounts attributable to continuing operations.)
Total Segment Sales: $69,495 Million
SalesIn Millions
’12 ’13 ’14 ’15 ’16
2016 Growth: –5.8% (a)
Five-year CAGR: 0.3%
HouseholdEssentials
22%
Food, Beverage & Pet Supplies
Apparel &Accessories
Home Furnishings& Decor
Hardlines
’12 ’13 ’14 ’15 ’16
2016 Growth: –10.1%Five-year CAGR: –1.8%
’12 ’13 ’14 ’15 ’16
2016 Growth: –19.6%Five-year CAGR: –2.6%
’12 ’13 ’14 ’15 ’16
2016 Growth: –12.7%Five-year CAGR: 0.5%
EBITIn Millions
Net EarningsIn Millions
Diluted EPS
22% 20% 19% 17%
$73,
301
$71,
279
$72,
618
$73,
785
$69,
495
$5,74
0
$5,17
0
$4,5
35
$5,5
30
$4,9
69
$3,3
15
$2,6
94
$2,4
49
$3,3
21
$2,6
69
$5.0
0
$4.2
0
$3.8
3
$5.2
5
$4.5
8
(a) The 2016 sales decline is primarily due to the December 2015 sale of our pharmacy and clinic businesses (Pharmacy Transaction) to CVS Pharmacy, Inc. 2015 sales includes $3,815 million related to our former pharmacy and clinic businesses.

2016 marked a significant year of transition at Target. Two years ago, we laid out an ambitious, multi-year strategy to put our company back on the path to long term profitable growth and create lasting shareholder value.
We said this work would be a journey. And we knew it would take time to reimagine our operating model, reposition our asset base and build a new company that is prepared to compete and win in this new era of retail.
I am pleased to report that in 2016, we made significant progress on our goals:
• Signature categories, including Style and Kids, gained market share, growing approximately three percentage points faster than our total comparable sales.
• Our digital channel sales have consistently outpaced the industry averages, with annual growth of nearly 30% over the last two years.
• Our small formats, which bring our brand to new guests in urban neighborhoods and college campuses, are producing outstanding results, generating much stronger sales productivity, healthy profit margins and return on investment.
• We introduced two new blockbuster brands for kids—Cat & Jack and Pillowfort—that have consistently generated double digit comp sales increases since they launched.
• Our supply chain investments are beginning to bear fruit, driving efficiency for Target and elevating the shopping experience for our guests by offering greater choice, speed, ease and convenience.
• And we’ve done all this while taking more than $2 billion in expense and cost of goods out of our business during the past two years.
Taken together, these efforts have produced strong bottom-line results. Our 2016 GAAP earnings per share (EPS) from continuing operations reached $4.58, and our Adjusted EPS reached $5.01, representing a nine percent average annual growth rate in Adjusted EPS since we embarked on this strategy two years ago. And during that same period, we returned nearly $10 billion to our shareholders through dividends and share repurchase.
Yet, despite this progress, we haven’t seen the growth we expected on the top line. Significant changes in consumer behavior are creating real challenges across our industry. Combine this change with an acceleration in the channel shift into digital shopping, and instead of building momentum in our
business, we’ve seen a slowdown. Many of our competitors are struggling to compete in this environment, closing stores and exiting business lines.
At Target, we are taking a fundamentally different approach. While others are exiting businesses and cutting investments, we are confidently investing in our future, creating a growth engine that we expect to drive consistent, sustainable, profitable growth, and market-share gains for many years to come.
And we are, by no means, starting from scratch. The progress we made in 2016 was a direct result of a very deliberate strategy to align our teams behind several key priorities. And looking ahead for 2017, those priorities will not change. What will change is our pace.
Beginning in 2017, we are embarking on capital investments of more than $7 billion during the next three years to advance and elevate our digital capabilities, open more than 100 new small format stores in priority markets, reimagine and reposition more than 600 existing stores, accelerate enterprise data and analytics capabilities, unveil more than a dozen new exclusive brands and continue to transform our supply chain into a smart network that leverages our inherent structural advantages in terms of proximity and scale. To support these changes and give our teams greater flexibility, we’re planning to invest about $1 billion of our operating profits this year, which will enable us to grow faster over time.
Given the headwinds facing our industry and the scale and depth of our investments, it will take time to realize share gains. We could make different choices—shut down stores, reduce payroll or service levels—in an effort to prop up our P&L in the short term, but that would be the wrong approach for Target.
We are playing the long game. Investing to grow and investing to win. We have a strong balance sheet. A talented team. And we are asking shareholders to make a meaningful investment in our future, so we can build a new company that will produce greater value for our guests and our shareholders for many years to come.
Brian Cornell, Chairman and CEO
Target 2016 Annual Report
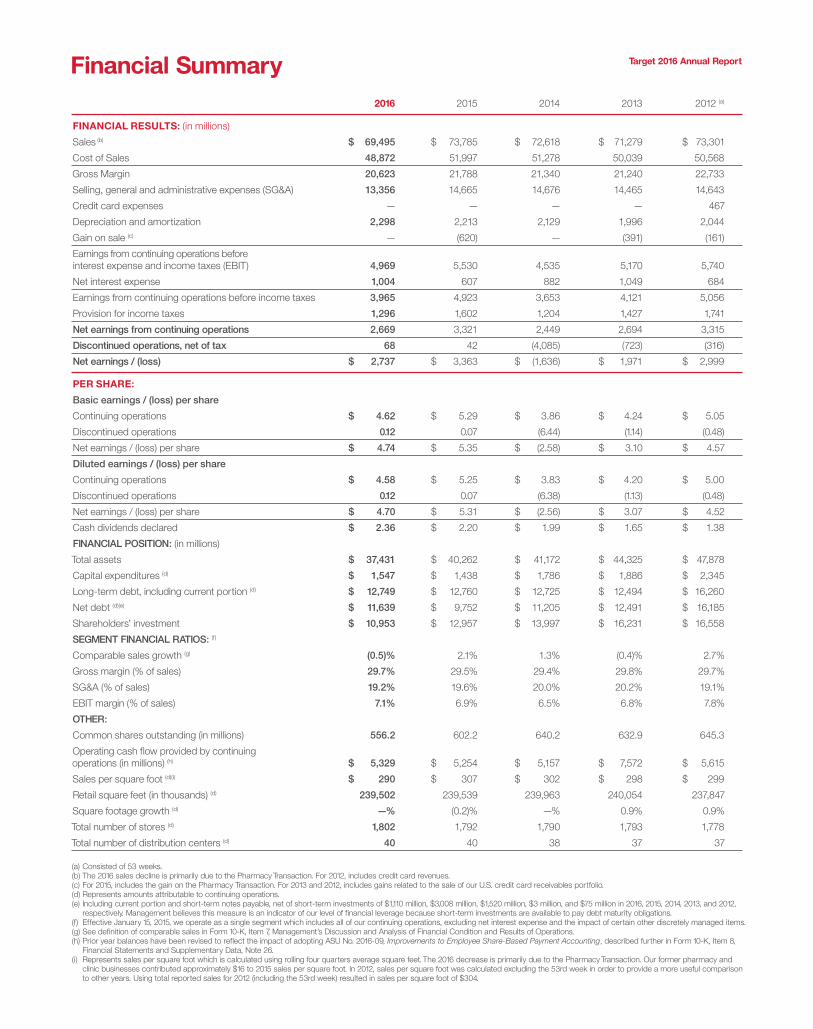
Financial Summary Target 2016 Annual Report
2016 2015 2014 2013 2012 (a)
FINANCIAL RESULTS: (in millions)
Sales (b) $ 69,495 $ 73,785 $ 72,618 $ 71,279 $ 73,301
Cost of Sales 48,872 51,997 51,278 50,039 50,568
Gross Margin 20,623 21,788 21,340 21,240 22,733
Selling, general and administrative expenses (SG&A) 13,356 14,665 14,676 14,465 14,643
Credit card expenses — — — — 467
Depreciation and amortization 2,298 2,213 2,129 1,996 2,044
Gain on sale (c) — (620) — (391) (161)
Earnings from continuing operations before interest expense and income taxes (EBIT) 4,969 5,530 4,535 5,170 5,740
Net interest expense 1,004 607 882 1,049 684
Earnings from continuing operations before income taxes 3,965 4,923 3,653 4,121 5,056
Provision for income taxes 1,296 1,602 1,204 1,427 1,741
Net earnings from continuing operations 2,669 3,321 2,449 2,694 3,315
Discontinued operations, net of tax 68 42 (4,085) (723) (316)
Net earnings / (loss) $ 2,737 $ 3,363 $ (1,636) $ 1,971 $ 2,999
PER SHARE:
Basic earnings / (loss) per share
Continuing operations $ 4.62 $ 5.29 $ 3.86 $ 4.24 $ 5.05
Discontinued operations 0.12 0.07 (6.44) (1.14) (0.48)
Net earnings / (loss) per share $ 4.74 $ 5.35 $ (2.58) $ 3.10 $ 4.57
Diluted earnings / (loss) per share
Continuing operations $ 4.58 $ 5.25 $ 3.83 $ 4.20 $ 5.00
Discontinued operations 0.12 0.07 (6.38) (1.13) (0.48)
Net earnings / (loss) per share $ 4.70 $ 5.31 $ (2.56) $ 3.07 $ 4.52
Cash dividends declared $ 2.36 $ 2.20 $ 1.99 $ 1.65 $ 1.38
FINANCIAL POSITION: (in millions)
Total assets $ 37,431 $ 40,262 $ 41,172 $ 44,325 $ 47,878
Capital expenditures (d) $ 1,547 $ 1,438 $ 1,786 $ 1,886 $ 2,345
Long-term debt, including current portion (d) $ 12,749 $ 12,760 $ 12,725 $ 12,494 $ 16,260
Net debt (d)(e) $ 11,639 $ 9,752 $ 11,205 $ 12,491 $ 16,185
Shareholders’ investment $ 10,953 $ 12,957 $ 13,997 $ 16,231 $ 16,558
SEGMENT FINANCIAL RATIOS: (f)
Comparable sales growth (g) (0.5)% 2.1% 1.3% (0.4)% 2.7%
Gross margin (% of sales) 29.7% 29.5% 29.4% 29.8% 29.7%
SG&A (% of sales) 19.2% 19.6% 20.0% 20.2% 19.1%
EBIT margin (% of sales) 7.1% 6.9% 6.5% 6.8% 7.8%
OTHER:
Common shares outstanding (in millions) 556.2 602.2 640.2 632.9 645.3
Operating cash flow provided by continuing operations (in millions) (h) $ 5,329 $ 5,254 $ 5,157 $ 7,572 $ 5,615
Sales per square foot (d)(i) $ 290 $ 307 $ 302 $ 298 $ 299
Retail square feet (in thousands) (d) 239,502 239,539 239,963 240,054 237,847
Square footage growth (d) —% (0.2)% —% 0.9% 0.9%
Total number of stores (d) 1,802 1,792 1,790 1,793 1,778
Total number of distribution centers (d) 40 40 38 37 37
(a) Consisted of 53 weeks.(b) The 2016 sales decline is primarily due to the Pharmacy Transaction. For 2012, includes credit card revenues.(c) For 2015, includes the gain on the Pharmacy Transaction. For 2013 and 2012, includes gains related to the sale of our U.S. credit card receivables portfolio.(d) Represents amounts attributable to continuing operations.(e) Including current portion and short-term notes payable, net of short-term investments of $1,110 million, $3,008 million, $1,520 million, $3 million, and $75 million in 2016, 2015, 2014, 2013, and 2012,
respectively. Management believes this measure is an indicator of our level of financial leverage because short-term investments are available to pay debt maturity obligations.(f) Effective January 15, 2015, we operate as a single segment which includes all of our continuing operations, excluding net interest expense and the impact of certain other discretely managed items.(g) See definition of comparable sales in Form 10-K, Item 7, Management’s Discussion and Analysis of Financial Condition and Results of Operations.(h) Prior year balances have been revised to reflect the impact of adopting ASU No. 2016-09, Improvements to Employee Share-Based Payment Accounting, described further in Form 10-K, Item 8,
Financial Statements and Supplementary Data, Note 26.(i) Represents sales per square foot which is calculated using rolling four quarters average square feet. The 2016 decrease is primarily due to the Pharmacy Transaction. Our former pharmacy and
clinic businesses contributed approximately $16 to 2015 sales per square foot. In 2012, sales per square foot was calculated excluding the 53rd week in order to provide a more useful comparison to other years. Using total reported sales for 2012 (including the 53rd week) resulted in sales per square foot of $304.
UNITED STATESSECURITIES AND EXCHANGE COMMISSION
Washington, D.C. 20549
FORM 10-K(Mark One)
x ANNUAL REPORT PURSUANT TO SECTION 13 OR 15(d) OF THE SECURITIES EXCHANGE ACTOF 1934
For the fiscal year ended January 28, 2017OR
o TRANSITION REPORT PURSUANT TO SECTION 13 OR 15(d) OF THE SECURITIES EXCHANGEACT OF 1934
For the transition period from toCommission file number 1-6049
TARGET CORPORATION(Exact name of registrant as specified in its charter)
Minnesota(State or other jurisdiction ofincorporation or organization)
41-0215170(I.R.S. EmployerIdentification No.)
1000 Nicollet Mall, Minneapolis, Minnesota(Address of principal executive offices)
55403(Zip Code)
Registrant's telephone number, including area code: 612/304-6073Securities Registered Pursuant To Section 12(B) Of The Act:
Title of Each Class Name of Each Exchange on Which RegisteredCommon Stock, par value $0.0833 per share New York Stock Exchange
Securities registered pursuant to Section 12(g) of the Act: None
Indicate by check mark if the registrant is a well-known seasoned issuer, as defined in Rule 405 of the Securities Act. Yes x No oIndicate by check mark if the registrant is not required to file reports pursuant to Section 13 or Section 15(d) of the Act. Yes o No xNote – Checking the box above will not relieve any registrant required to file reports pursuant to Section 13 or 15(d) of the Exchange Act from theirobligations under those Sections.Indicate by check mark whether the registrant (1) has filed all reports required to be filed by Section 13 or 15(d) of the Securities Exchange Act of1934 during the preceding 12 months (or for such shorter period that the registrant was required to file such reports), and (2) has been subject tosuch filing requirements for the past 90 days. Yes x No oIndicate by checkmark whether the registrant has submitted electronically and posted on its corporate Website, if any, every Interactive Data Filerequired to be submitted and posted pursuant to Rule 405 of Regulation S-T (§232.405 of this chapter) during the preceding 12 months (or for suchshorter period that the registrant was required to submit and post such files). Yes x No oIndicate by check mark if disclosure of delinquent filers pursuant to Item 405 of Regulation S-K (§229.405 of this chapter) is not contained herein,and will not be contained, to the best of registrant's knowledge, in definitive proxy or information statements incorporated by reference in Part III ofthis Form 10-K or any amendment to this Form 10-K. xIndicate by check mark whether the registrant is a large accelerated filer, an accelerated filer, a non-accelerated filer, or a smaller reporting company(as defined in Rule 12b-2 of the Act). See the definitions of "large accelerated filer," "accelerated filer" and "smaller reporting company" in Rule126-2 of the Exchange Act.
Large accelerated filer x Accelerated filer o Non-accelerated filer o (Do not check if a smaller reporting company)
Smaller reporting company o
Indicate by check mark whether the registrant is a shell company (as defined in Rule 12b-2 of the Act). Yes o No xThe aggregate market value of the voting stock held by non-affiliates of the registrant as of July 30, 2016 was $43,242,921,133, based on theclosing price of $75.33 per share of Common Stock as reported on the New York Stock Exchange Composite Index.Indicate the number of shares outstanding of each of registrant's classes of Common Stock, as of the latest practicable date. Total shares of CommonStock, par value $0.0833, outstanding at March 2, 2017 were 552,675,341.
DOCUMENTS INCORPORATED BY REFERENCEPortions of Target's Proxy Statement to be filed on or about May 1, 2017 are incorporated into Part III.
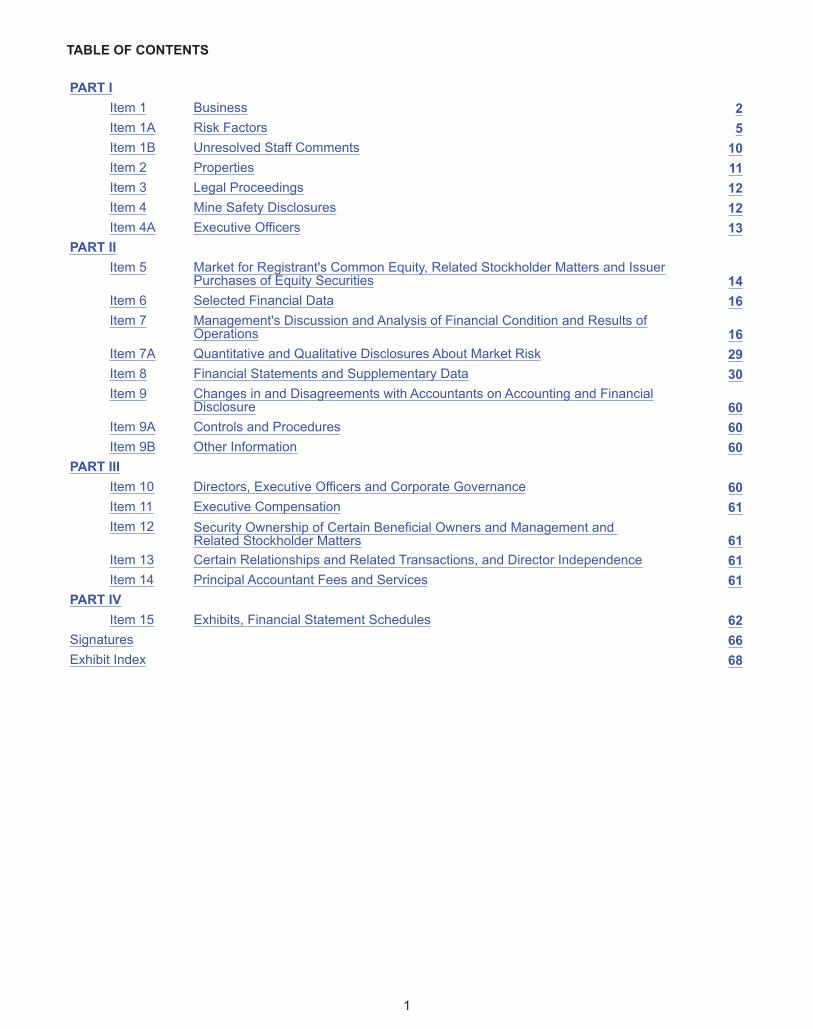
TABLE OF CONTENTS
PART IItem 1 Business 2Item 1A Risk Factors 5Item 1B Unresolved Staff Comments 10Item 2 Properties 11Item 3 Legal Proceedings 12Item 4 Mine Safety Disclosures 12Item 4A Executive Officers 13
PART IIItem 5 Market for Registrant's Common Equity, Related Stockholder Matters and Issuer
Purchases of Equity Securities 14Item 6 Selected Financial Data 16Item 7 Management's Discussion and Analysis of Financial Condition and Results of
Operations 16Item 7A Quantitative and Qualitative Disclosures About Market Risk 29Item 8 Financial Statements and Supplementary Data 30Item 9 Changes in and Disagreements with Accountants on Accounting and Financial
Disclosure 60Item 9A Controls and Procedures 60Item 9B Other Information 60
PART IIIItem 10 Directors, Executive Officers and Corporate Governance 60Item 11 Executive Compensation 61Item 12 Security Ownership of Certain Beneficial Owners and Management and
Related Stockholder Matters 61Item 13 Certain Relationships and Related Transactions, and Director Independence 61Item 14 Principal Accountant Fees and Services 61
PART IVItem 15 Exhibits, Financial Statement Schedules 62
Signatures 66Exhibit Index 68
1
PART I
2
Item 1. Business
General
Target Corporation (Target, the Corporation or the Company) was incorporated in Minnesota in 1902. We offer ourcustomers, referred to as "guests," everyday essentials and fashionable, differentiated merchandise at discountedprices. Our ability to deliver a preferred shopping experience to our guests is supported by our supply chain andtechnology, our devotion to innovation, our loyalty offerings such as REDcard Rewards and Cartwheel, and ourdisciplined approach to managing our business and investing in future growth. We operate as a single segment designedto enable guests to purchase products seamlessly in stores or through our digital channels. Since 1946, we have given5 percent of our profit to communities.
We perform account servicing and primary marketing functions for, and earn a substantial portion of the profits generatedby, the Target Credit Card and Target MasterCard consumer receivables portfolio, which is underwritten, funded, andowned by TD Bank Group (TD). Refer to Note 9 of the Consolidated Financial Statements included in Item 8, FinancialStatements and Supplementary Data (the Financial Statements) for more information on the credit card profit sharing.
Prior to January 15, 2015, we operated a Canadian Segment. On January 15, 2015, we announced our exit from theCanadian market, and Target Canada Co. and certain other wholly owned subsidiaries of Target filed for protection(the Filing) in Canada under the Companies' Creditors Arrangement Act (CCAA) with the Ontario Superior Court ofJustice in Toronto (the Court). Following the Filing, we no longer consolidate our former Canadian retail operation.Canadian financial results prior to the Filing are included in our financial statements and classified within discontinuedoperations. See Item 7, Management's Discussion and Analysis of Financial Condition and Results of Operations(MD&A) and Note 7 of the Financial Statements for more information.
Prior to December 16, 2015, we operated 1,672 pharmacies and 79 clinics in our stores. On December 16, 2015, wesold our pharmacy and clinic businesses (Pharmacy Transaction) to CVS Pharmacy, Inc. (CVS). CVS now operatesthe pharmacy and clinic businesses in our stores under a perpetual operating agreement, subject to termination inlimited circumstances. See MD&A and Note 6 of the Financial Statements for more information.
Discontinued operations in this Annual Report on Form 10-K refers only to our discontinued Canadian operations.
Financial Highlights
For information on key financial highlights and segment financial information, see the items referenced in Item 6,Selected Financial Data, MD&A, and Note 30 of the Financial Statements.
Seasonality
A larger share of annual revenues and earnings traditionally occurs in the fourth quarter because it includes the peakholiday sales period of November and December.
Merchandise
We sell a wide assortment of general merchandise and food. The majority of our general merchandise stores offer anedited food assortment, including perishables, dry grocery, dairy, and frozen items. Nearly all of our stores larger than170,000 square feet offer a full line of food items comparable to traditional supermarkets. Our small, flexible formatstores, generally smaller than 50,000 square feet, offer curated general merchandise and food assortments. Our digitalchannels include a wide assortment of general merchandise, including many items found in our stores, along with acomplementary assortment such as additional sizes and colors sold only online.
A significant portion of our sales is from national brand merchandise. Approximately one-third of 2016 sales related toour owned and exclusive brands, including but not limited to the following:
Owned BrandsArcher Farms® Market Pantry® Sutton & Dodge®Art Class™ Merona® Threshold™Ava & Viv® Pillowfort™ up & up®Boots & Barkley® Room Essentials® Wine Cube®Cat & Jack™ Simply Balanced™ Wondershop™Embark® Smith & Hawken® Xhilaration®Gilligan & O'Malley® Sonia Kashuk®Knox Rose™ Spritz™
Exclusive BrandsC9 by Champion® Hand Made Modern® Mossimo®DENIZEN® from Levi's® Just One You® made by carter's® Nate Berkus for TargetFieldcrest® Kid Made Modern® Oh Joy!® for TargetGenuine Kids® from OshKosh® Liz Lange® for Target
We also sell merchandise through periodic exclusive design and creative partnerships and generate revenue from in-store amenities such as Target Café and Target Photo, and leased or licensed departments such as Target Optical,Starbucks, and other food service offerings. The majority of our stores also have a CVS pharmacy from which we willgenerate ongoing annual, inflation adjusted occupancy-related income (see MD&A and Note 6 of the FinancialStatements for more information).
Distribution
The vast majority of merchandise is distributed to our stores through our network of 40 distribution centers. Commoncarriers ship general merchandise to and from our distribution centers. Vendors or third party distributors ship certainfood items and other merchandise directly to our stores. Merchandise sold through our digital channels is distributedto our guests via common carriers from our distribution centers, from vendors or third party distributors, from our storesor through guest pick-up at our stores. Using our stores as fulfillment points allows improved product availability anddelivery times and also reduces shipping costs.
Employees
At January 28, 2017, we employed approximately 323,000 full-time, part-time and seasonal employees, referred toas "team members." During the 2016 holiday sales period our employment levels peaked at approximately 373,000team members. We offer a broad range of company-paid benefits to our team members. Eligibility for and the level ofbenefits vary depending on team members' full-time or part-time status, compensation level, date of hire, and/or lengthof service. Company-paid benefits include a 401(k) plan, medical and dental plans, disability insurance, paid vacation,tuition reimbursement, various team member assistance programs, life insurance, a pension plan (closed to newparticipants, with limited exceptions), and merchandise and other discounts. We believe our team member relationsare good.
Working Capital
Our working capital needs are greater in the months leading up to the holiday sales period, which we typically financewith cash flow provided by operations and short-term borrowings. Additional details are provided in the Liquidity andCapital Resources section in MD&A.
Effective inventory management is key to our ongoing success, and we use various techniques including demandforecasting and planning and various forms of replenishment management. We achieve effective inventorymanagement by staying in-stock in core product offerings, maintaining positive vendor relationships, and carefullyplanning inventory levels for seasonal and apparel items to minimize markdowns.
3
Competition
We compete with traditional and internet retailers, including off-price general merchandise retailers, apparel retailers,wholesale clubs, category specific retailers, drug stores, supermarkets, and other forms of retail commerce. Our abilityto positively differentiate ourselves from other retailers and provide a compelling value proposition largely determinesour competitive position within the retail industry.
Intellectual Property
Our brand image is a critical element of our business strategy. Our principal trademarks, including Target, SuperTargetand our "Bullseye Design," have been registered with the U.S. Patent and Trademark Office. We also seek to obtainand preserve intellectual property protection for our owned brands.
Geographic Information
Virtually all of our revenues are generated within the United States. The vast majority of our long-lived assets arelocated within the United States.
Available Information
Our Annual Report on Form 10-K, quarterly reports on Form 10-Q, current reports on Form 8-K, and amendments tothose reports filed or furnished pursuant to Section 13(a) or 15(d) of the Exchange Act are available free of charge atinvestors.target.com as soon as reasonably practicable after we file such material with, or furnish it to, the U.S. Securitiesand Exchange Commission (SEC). Our Corporate Governance Guidelines, Business Conduct Guide, Corporate SocialResponsibility Report, and the charters for the committees of our Board of Directors are also available free of chargein print upon request or at investors.target.com.
4
Item 1A. Risk Factors
Our business is subject to many risks. Set forth below are the material risks we face. Risks are listed in the categorieswhere they primarily apply, but other categories may also apply.
Competitive and Reputational Risks
Our continued success is dependent on positive perceptions of Target which, if eroded, could adversely affectour business and our relationships with our guests and team members.
We believe that one of the reasons our guests prefer to shop at Target, our team members choose Target as a placeof employment and our vendors choose to do business with us is the reputation we have built over many years forserving our four primary constituencies: guests, team members, shareholders, and the communities in which weoperate. To be successful in the future, we must continue to preserve Target's reputation. Reputational value is basedin large part on perceptions, and broad access to social media makes it easy for anyone to provide public feedbackthat can influence perceptions of Target. It may be difficult to control negative publicity, regardless of whether it isaccurate. While reputations may take decades to build, any negative incidents can quickly erode trust and confidence,particularly if they result in negative mainstream and social media publicity, governmental investigations, or litigation.Negative incidents could lead to tangible adverse effects on our business, including consumer boycotts, lost sales,loss of new store and technology development opportunities, or team member retention and recruiting difficulties. Inaddition, vendors and others with whom we choose to do business may affect our reputation. For example, CVSoperates clinics and pharmacies within our stores, and our guests’ perceptions of and experiences with CVS mayimpact our reputation.
If we are unable to positively differentiate ourselves from other retailers, our results of operations could beadversely affected.
In the past, we have been able to compete successfully by differentiating our guests’ shopping experience through acareful combination of price, merchandise assortment, store environment, convenience, guest service, loyalty programsand marketing efforts. Our ability to create a personalized guest experience through the collection and use of accurateand relevant guest data is important to our ability to differentiate from other retailers. Guest perceptions regarding thecleanliness and safety of our stores, the functionality, reliability, and speed of our digital channels and fulfillment options,our in-stock levels, the effectiveness of our promotions, the attractiveness of our third party offerings, such as theclinics and pharmacies owned and operated by CVS, and other factors also affect our ability to compete. No singlecompetitive factor is dominant, and actions by our competitors on any of these factors or the failure of our strategiescould have an adverse effect on our sales, gross margins, and expenses.
We sell many products under our owned and exclusive brands. These brands are an important part of our businessbecause they differentiate us from other retailers, generally carry higher margins than equivalent national brand productsand represent a significant portion of our overall sales. If we are unable to successfully develop and support our ownedand exclusive brands, if one or more of these brands experiences a loss of consumer acceptance or confidence, or ifwe are unable to successfully protect our intellectual property rights in these brands, our sales and gross marginscould be adversely affected.
The continuing migration and evolution of retailing to digital channels has increased our challenges in differentiatingourselves from other retailers. In particular, consumers are able to quickly and conveniently comparison shop anddetermine real-time product availability using digital tools, which can lead to decisions based solely on price, thefunctionality of the digital tools or a combination of those and other factors. We must compete by offering a consistentand convenient shopping experience for our guests regardless of the ultimate sales channel. We must provide ourguests and team members digital tools that have the right features and are reliable and easy to use. Failures toeffectively execute in these efforts, actions by our competitors in response to these efforts, or failures of our vendorsto manage their own channels, content and technology systems could hurt our ability to differentiate ourselves fromother retailers and, as a result, have an adverse effect on sales, gross margins, and expenses.
If we are unable to successfully provide a relevant and reliable experience for our guests, regardless of whereour guest demand is ultimately fulfilled, our sales, results of operations and reputation could be adverselyaffected.
Our business has evolved from an in-store experience to interaction with guests across multiple channels (in-store,online, mobile and social media, among others). Our guests are using computers, tablets, mobile phones and other
5
devices to shop in our stores and online and provide feedback and public commentary about all aspects of our business.We must anticipate and meet changing guest expectations and counteract new developments and technologyinvestments by our competitors. Our evolving retailing efforts include implementing new technology, software andprocesses to be able to fulfill guest orders directly from our vendors and from any point within our system of storesand distribution centers. Providing flexible fulfillment options is complex and may not meet guest expectations foraccurate order fulfillment, faster and guaranteed delivery times, and low-price or free shipping. If we are unable toattract and retain team members or contract with third parties having the specialized skills needed to support theseefforts, implement improvements to our guest‑facing technology in a timely manner, collect accurate, relevant, andusable guest data to support our personalization efforts, allow real-time and accurate visibility to product availabilitywhen guests are ready to purchase, quickly and efficiently fulfill our guests orders using the fulfillment and paymentmethods they demand, or provide a convenient and consistent experience for our guests across all sales channels,our ability to compete and our results of operations could be adversely affected. In addition, if Target.com and ourother guest‑facing technology systems do not appeal to our guests, reliably function as designed, integrate across allsales channels, or maintain the privacy of guest data we may experience a loss of guest confidence and lost sales,which could adversely affect our reputation and results of operations.
If we fail to anticipate and respond quickly to changing consumer preferences, our sales, gross margins andprofitability could suffer.
A large part of our business is dependent on our ability to make trend‑right decisions and effectively manage ourinventory in a broad range of merchandise categories, including apparel, accessories, home décor, electronics, toys,seasonal offerings, food and other merchandise. For example, our apparel and home décor assortment is continuallyevolving and in other areas of our product assortment, including food, we are supporting guest wellness goals andoffering more items that appeal to local cultural and demographic tastes. Failure to obtain accurate and relevant dataon guest preferences, predict changing consumer tastes, preferences, spending patterns and other lifestyle decisions,emphasize the correct categories, implement effective promotions, and personalize our offerings to our guests mayresult in lost sales, spoilage, and increased inventory markdowns, which would lead to a deterioration in our resultsof operations by hurting our sales, gross margins, and profitability.
Technology Investments and Infrastructure Risks
If our capital investments in technology, supply chain, new stores and remodeling existing stores do notachieve appropriate returns, our competitive position, financial condition and results of operations may beadversely affected.
Our business is becoming increasingly reliant on technology investments, and the returns on these investments canbe less predictable than building new stores and remodeling existing stores. We are currently making, and will continueto make, significant technology investments to provide a consistent and improved guest experience across all saleschannels and improve our supply chain and inventory management systems. These technology initiatives might notprovide the anticipated benefits or desired return or may provide them on a delayed schedule or at a higher cost. Ourbusiness also depends, in part, on our ability to build new stores and remodel existing stores in a manner that achievesappropriate returns on our capital investment. We compete with other retailers and businesses for suitable locationsfor our stores. Many of our expected new store sites are smaller and non-standard footprints located in fully developedmarkets, which require changes to our supply chain practices and are generally more time-consuming, expensive anduncertain undertakings than expansion into undeveloped suburban and ex-urban markets. Targeting the wrongtechnology or store opportunities, failing to make the best investments, being unable to make new concepts scalableor making an investment commitment significantly above or below our needs could result in the loss of our competitiveposition and adversely impact our financial condition or results of operations.
A significant disruption in our computer systems and our inability to adequately maintain and update thosesystems could adversely affect our operations and our ability to maintain guest confidence.
We rely extensively on our computer systems to manage and account for inventory, process guest transactions, manageand maintain the privacy of guest data, communicate with our vendors and other third parties, service REDcardaccounts, and summarize and analyze results. We also rely on continued and unimpeded access to the Internet touse our computer systems. Our systems are subject to damage or interruption from power outages, telecommunicationsfailures, computer viruses, malicious attacks, security breaches, and catastrophic events. If our systems are damagedor fail to function properly or reliably, we may incur substantial repair or replacement costs, experience data loss ortheft and impediments to our ability to manage inventories or process guest transactions, engage in additional
6
promotional activities to retain our guests, and encounter lost guest confidence, which could adversely affect our resultsof operations.
We continually make significant technology investments that are intended to help maintain and update our existingcomputer systems. Implementing significant system changes increases the risk of computer system disruption. Thepotential problems and interruptions associated with implementing technology initiatives could disrupt or reduce ouroperational efficiency, and could negatively impact guest experience and guest confidence.
Data Security and Privacy Risks
If our efforts to protect the security of information about our guests, team members and vendors areunsuccessful, we may face additional costly government enforcement actions and private litigation, and oursales and reputation could suffer.
We regularly receive and store information about our guests, team members, and vendors. We have programs in placeto detect, contain and respond to data security incidents. However, because the techniques used to obtain unauthorizedaccess, disable or degrade service, or sabotage systems change frequently and may be difficult to detect for longperiods of time, we may be unable to anticipate these techniques or implement adequate preventive measures. Inaddition, hardware, software, or applications we develop or procure from third parties may contain defects in designor manufacture or other problems that could unexpectedly compromise information security. Unauthorized parties mayalso attempt to gain access to our systems or facilities, or those of third parties with whom we do business, throughfraud, trickery, or other forms of deceiving our team members, contractors, vendors, and temporary staff.
Until the data breach we experienced in the fourth quarter of 2013, all incidents we encountered were insignificant.The data breach we experienced in 2013 was significant and went undetected for several weeks. Both we and ourvendors had data security incidents subsequent to the 2013 data breach; however, to date these other incidents havenot been material to our consolidated financial statements. Based on the prominence and notoriety of the 2013 databreach, even minor additional data security incidents could draw greater scrutiny. If we, our vendors, or other thirdparties with whom we do business experience additional significant data security breaches or fail to detect andappropriately respond to significant data security breaches, we could be exposed to additional government enforcementactions and private litigation. In addition, our guests could lose confidence in our ability to protect their information,which could cause them to discontinue using our REDcards or loyalty programs, or stop shopping with us altogether.
Supply Chain and Third Party Risks
Changes in our relationships with our vendors, changes in tax policy or trade relations, interruptions in oursupply chain or increased commodity or supply chain costs could adversely affect our results of operations.
We are dependent on our vendors to supply merchandise to our distribution centers, stores and guests. As we continueto add capabilities, our fulfillment network becomes increasingly complex and operating it becomes more challenging.If our fulfillment network does not operate properly or if a vendor fails to deliver on its commitments, we could experiencemerchandise out-of-stocks, delivery delays or increased delivery costs, which could lead to lost sales and decreasedguest confidence, and adversely affect our results of operations.
A large portion of our merchandise is sourced, directly or indirectly, from outside the United States, with China as oursingle largest source. The results of the recent United States elections may signal a change in trade policy betweenthe United States and other countries. Because a large portion of our merchandise is sourced, directly or indirectly,from outside the United States, major changes in tax policy or trade relations, such as the disallowance of tax deductionsfor imported merchandise or the imposition of additional tariffs or duties on imported products, could adversely affectour business, results of operations, effective income tax rate, liquidity and net income.
Political or financial instability, currency fluctuations, changes in trade policy, trade restrictions, tariffs or duties, theoutbreak of pandemics, labor unrest, transport capacity and costs, port security, weather conditions, natural disastersor other events that could slow or disrupt port activities and affect foreign trade are beyond our control and couldmaterially disrupt our supply of merchandise, increase our costs, and/or adversely affect our results of operations.There have been periodic labor disputes impacting the United States ports that have caused us to make alternativearrangements to continue the flow of inventory, and if these types of disputes recur, worsen, or occur in other countriesthrough which we source products, it may have a material impact on our costs or inventory supply. Changes in thecosts of procuring commodities used in our merchandise or the costs related to our supply chain, including vendorcosts, labor, fuel, tariffs, duties, currency exchange rates, and supply chain transparency initiatives, could have an
7
adverse effect on gross margins, expenses, and results of operations. Changes in our relationships with our vendorsalso have the potential to increase our expenses and adversely affect results of operations.
A disruption in relationships with third party service providers could adversely affect our operations.
We rely on third parties to support our business, including portions of our technology development and support, ourdigital platforms and fulfillment operations, credit and debit card transaction processing, extensions of credit for our5% REDcard Rewards loyalty program, the clinics and pharmacies operated by CVS within our stores, the infrastructuresupporting our guest contact centers, and aspects of our food offerings. If we are unable to contract with third partieshaving the specialized skills needed to support those strategies or integrate their products and services with ourbusiness, if we fail to properly manage those third parties, if they fail to meet our performance standards andexpectations, including with respect to data security, then our reputation, sales, and results of operations could beadversely affected. In addition, we could face increased costs associated with finding replacement providers or hiringand retaining team members to provide these services in-house. An example of our reliance on third parties is ourrelationship with CVS. If our guests do not react favorably to CVS’s operations or if our relationship with CVS isineffective, our ability to discontinue the relationship is limited and our results of operations may be adversely affected.In addition, if we wish to have clinics and pharmacies in any new stores, those clinics and pharmacies must be ownedand operated by CVS, which limits our flexibility in designing and operating new stores and new store concepts.
Legal, Regulatory, Global and Other External Risks
Our earnings are highly susceptible to the state of macroeconomic conditions and consumer confidence inthe United States.
Virtually all of our sales are in the United States, making our results highly dependent on United States consumerconfidence and the health of the United States economy. In addition, a significant portion of our total sales is derivedfrom stores located in five states: California, Texas, Florida, Minnesota and Illinois, resulting in further dependence onlocal economic conditions in these states. Deterioration in macroeconomic conditions or consumer confidence couldnegatively affect our business in many ways, including slowing sales growth, reducing overall sales, and reducinggross margins.
These same considerations impact the success of our credit card program. Although we no longer own a consumercredit card receivables portfolio, we share in the economic performance of the credit card program with TD, whichowns the receivables generated by our proprietary credit cards. Deterioration in macroeconomic conditions couldadversely affect the volume of new credit accounts, the amount of credit card program balances and the ability of creditcard holders to pay their balances. These conditions could result in us receiving lower profit‑sharing payments.
Uncharacteristic or significant weather conditions, alone or together with natural disasters, could adverselyaffect our operations.
Uncharacteristic or significant weather conditions can affect consumer shopping patterns, particularly in apparel andseasonal items, which could lead to lost sales or greater than expected markdowns and adversely affect our short-term results of operations. In addition, our three largest states by total sales are California, Texas and Florida, areaswhere natural disasters are more prevalent. Natural disasters in those states or in other areas where our sales areconcentrated could result in significant physical damage to or closure of one or more of our stores, distribution centersor key vendors, and cause delays in the distribution of merchandise from our vendors to our distribution centers, stores,and directly to guests, which could adversely affect our results of operations by increasing our costs and lowering oursales.
We rely on a large, global and changing workforce of team members, contractors and temporary staffing. Ifwe do not effectively manage our workforce and the concentration of work in certain global locations, ourlabor costs and results of operations could be adversely affected.
With over 300,000 team members, our workforce costs represent our largest operating expense, and our businessand regulatory compliance is dependent on our ability to attract, train, and retain the appropriate mix of qualified teammembers, contractors, and temporary staffing and effectively organize and manage those resources as our businessand strategic priorities change. Many team members are in entry-level or part-time positions with historically highturnover rates. Our ability to meet our changing labor needs while controlling our costs is subject to external factorssuch as labor laws and regulations, unemployment levels, prevailing wage rates, collective bargaining efforts, health
8
care and other benefit costs, changing demographics, and our reputation and relevance within the labor market. If weare unable to attract and retain adequate numbers and an appropriate mix of qualified team members, contractorsand temporary staffing, our operations, guest service levels, support functions, and competitiveness could suffer. Thosefactors, together with increasing wage and benefit costs, could adversely affect our results of operations. We areperiodically subject to labor organizing efforts. If we become subject to one or more collective bargaining agreementsin the future, it could adversely affect our labor costs and how we operate our business.
We maintain a headquarters location in India and sourcing offices in China where there has generally been greaterpolitical, financial, environmental and health instability than the United States. An extended disruption of our operationsin India or offices in China could adversely affect certain operations supporting stability and maintenance of our digitalchannels, information technology development, and sourcing operations.
Failure to address product safety and sourcing concerns could adversely affect our sales and results ofoperations.
If our merchandise offerings do not meet applicable safety standards or Target's or our guests’ expectations regardingsafety, supply chain transparency and integrity of sources of supply, we could experience lost sales and increasedcosts and be exposed to legal and reputational risk. All of our vendors must comply with applicable product safetylaws, and we are dependent on them to ensure that the products we buy comply with all safety standards. Events thatgive rise to actual, potential or perceived product safety concerns, including food or drug contamination, could exposeus to government enforcement action or private litigation and result in costly product recalls and other liabilities. All ofour vendors must also comply with our Standards of Vendor Engagement, which cover a variety of expectations acrossmultiple areas of social compliance, including supply chain transparency and sources of supply. We have a socialcompliance audit process, but we are also dependent on our vendors to ensure that the products we buy comply withour standards. Negative guest perceptions regarding the safety of the products we sell and events that give rise toactual, potential or perceived social compliance concerns could hurt our reputation and result in lost sales. For example,we recently terminated a relationship with a vendor that supplied us with cotton sheets that were represented to be100 percent Egyptian cotton after we discovered that the vendor substituted non-Egyptian cotton. If that event or ifsimilar events in the future cause our guests to seek alternative sources for their needs, we could lose sales and itmay be difficult and costly for us to regain the confidence of our guests.
Our failure to comply with federal, state, local, and international laws, or changes in these laws could increaseour costs, reduce our margins, and lower our sales.
Our business is subject to a wide array of laws and regulations in the United States and other countries in which weoperate. Significant workforce-related legislative changes could increase our expenses and adversely affect ouroperations. Examples of possible workforce-related legislative changes include changes to an employer's obligationto recognize collective bargaining units, the process by which collective bargaining agreements are negotiated orimposed, minimum wage requirements, advance scheduling notice requirements, and health care mandates. Inaddition, changes in the regulatory environment affecting privacy and information security, product safety, paymentmethods and related fees, responsible sourcing, supply chain transparency, or environmental protection, among others,could cause our expenses to increase without an ability to pass through any increased expenses through higher prices.In addition, if we fail to comply with other applicable laws and regulations, including wage and hour laws, the ForeignCorrupt Practices Act and local anti-bribery laws, we could be subject to legal risk, including government enforcementaction and class action civil litigation, which could adversely affect our results of operations by increasing our costs,reducing our margins, and lowering our sales.
Financial Risks
Changes in our effective income tax rate could adversely affect our business, results of operations, liquidity,and net income.
A number of factors influence our effective income tax rate, including changes in tax law, tax treaties, interpretation ofexisting laws, and our ability to sustain our reporting positions on examination. Changes in any of those factors couldchange our effective tax rate, which could adversely affect our net income. In addition, our operations outside of theUnited States may cause greater volatility in our effective tax rate.
9
If we are unable to access the capital markets or obtain bank credit, our financial position, liquidity, and resultsof operations could suffer.
We are dependent on a stable, liquid, and well-functioning financial system to fund our operations and capitalinvestments. In particular, we have historically relied on the public debt markets to fund portions of our capitalinvestments and the commercial paper market and bank credit facilities to fund seasonal needs for working capital.Our continued access to these markets depends on multiple factors including the condition of debt capital markets,our operating performance, and maintaining strong credit ratings. If rating agencies lower our credit ratings, it couldadversely impact our ability to access the debt markets, our cost of funds, and other terms for new debt issuances.Each of the credit rating agencies reviews its rating periodically, and there is no guarantee our current credit rating willremain the same. In addition, we use a variety of derivative products to manage our exposure to market risk, principallyinterest rate and equity price fluctuations. Disruptions or turmoil in the financial markets could reduce our ability tomeet our capital requirements or fund our working capital needs, and lead to losses on derivative positions resultingfrom counterparty failures, which could adversely affect our financial position and results of operations.
10
Item 1B. Unresolved Staff Comments
Not applicable.
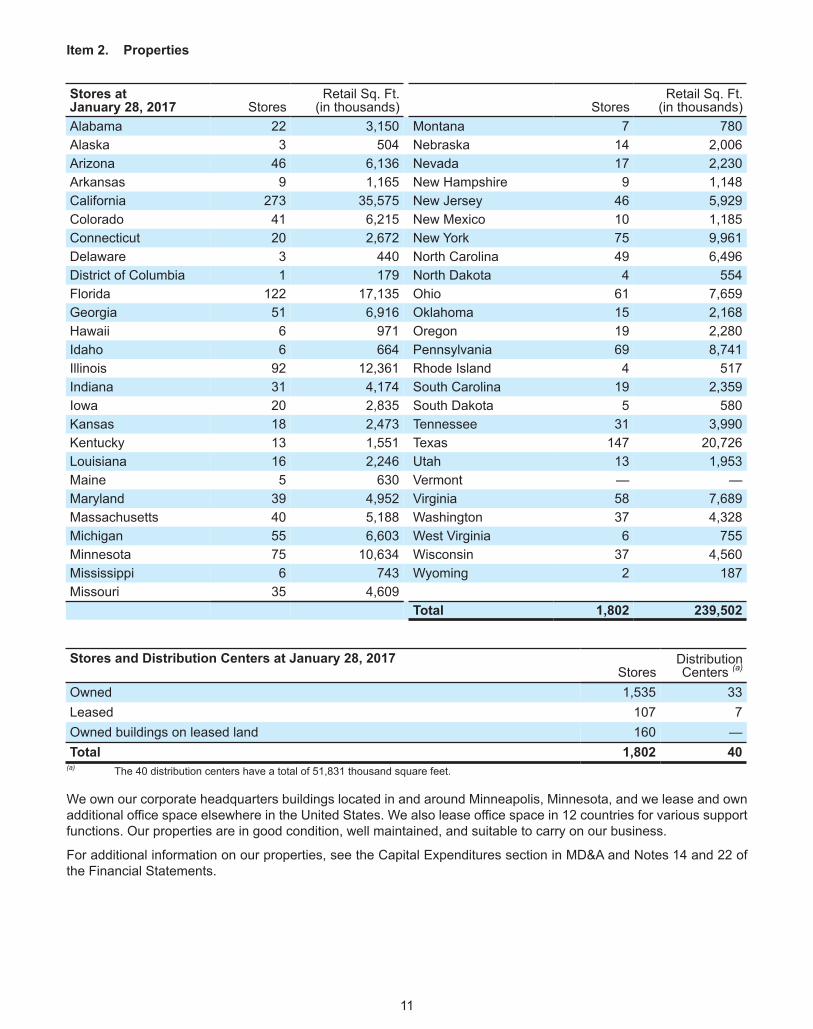
Item 2. Properties
Stores at January 28, 2017 Stores
Retail Sq. Ft.(in thousands) Stores
Retail Sq. Ft.(in thousands)
Alabama 22 3,150 Montana 7 780Alaska 3 504 Nebraska 14 2,006Arizona 46 6,136 Nevada 17 2,230Arkansas 9 1,165 New Hampshire 9 1,148California 273 35,575 New Jersey 46 5,929Colorado 41 6,215 New Mexico 10 1,185Connecticut 20 2,672 New York 75 9,961Delaware 3 440 North Carolina 49 6,496District of Columbia 1 179 North Dakota 4 554Florida 122 17,135 Ohio 61 7,659Georgia 51 6,916 Oklahoma 15 2,168Hawaii 6 971 Oregon 19 2,280Idaho 6 664 Pennsylvania 69 8,741Illinois 92 12,361 Rhode Island 4 517Indiana 31 4,174 South Carolina 19 2,359Iowa 20 2,835 South Dakota 5 580Kansas 18 2,473 Tennessee 31 3,990Kentucky 13 1,551 Texas 147 20,726Louisiana 16 2,246 Utah 13 1,953Maine 5 630 Vermont — —Maryland 39 4,952 Virginia 58 7,689Massachusetts 40 5,188 Washington 37 4,328Michigan 55 6,603 West Virginia 6 755Minnesota 75 10,634 Wisconsin 37 4,560Mississippi 6 743 Wyoming 2 187Missouri 35 4,609
Total 1,802 239,502
Stores and Distribution Centers at January 28, 2017Stores
DistributionCenters (a)
Owned 1,535 33Leased 107 7Owned buildings on leased land 160 —Total 1,802 40
(a) The 40 distribution centers have a total of 51,831 thousand square feet.
We own our corporate headquarters buildings located in and around Minneapolis, Minnesota, and we lease and ownadditional office space elsewhere in the United States. We also lease office space in 12 countries for various supportfunctions. Our properties are in good condition, well maintained, and suitable to carry on our business.
For additional information on our properties, see the Capital Expenditures section in MD&A and Notes 14 and 22 ofthe Financial Statements.
11

Item 3. Legal Proceedings
The following proceedings are being reported pursuant to Item 103 of Regulation S-K:
Federal Securities Law Class Actions
On May 17, 2016 and May 24, 2016, Target Corporation and certain present and former officers were namedas defendants in two purported federal securities law class actions filed in the United States District Court forthe District of Minnesota. The actions subsequently were consolidated under the caption In re: TargetCorporation Securities Litigation, Case No. 0:16-cv-01315-JNE-BRT. The plaintiffs filed a ConsolidatedAmended Class Action Complaint (Consolidated Complaint) on November 14, 2016, alleging violations ofSections 10(b) and 20(a) of the Securities Exchange Act of 1934, as amended, and Rule 10b-5 relating tocertain prior disclosures of Target about its expansion of retail operations into Canada (CanadaDisclosure).Target, its former chief executive officer, its present chief operating officer, and the former presidentof Target Canada are named as defendants in the Consolidated Complaint. The plaintiff seeks to represent aclass consisting of all purchasers of Target common stock between March 20, 2013 and August 4, 2014. Theplaintiff seeks damages and other relief, including attorneys’ fees, based on allegations that the defendantsmisled investors about the performance and prospects of Target Canada and that such conduct affected thevalue of Target common stock. On February 10, 2017, Target and the other defendants moved to dismiss theConsolidated Complaint. That motion has not yet been heard or decided. Target intends to vigorously defendthis consolidated action.
ERISA Class Actions
On July 12, 2016 and July 15, 2016, Target Corporation, the Plan Investment Committee and Target’s currentchief operating officer were named as defendants in two purported Employee Retirement Income Security Actof 1974 (ERISA) class actions filed in the United States District Court for the District of Minnesota. The actionssubsequently were consolidated under the caption In re: Target Corporation ERISA Litigation, Case No. 0:16-cv-02400-JNE-BRT. The plaintiffs filed an Amended Class Action Complaint (Amended Complaint) onDecember 14, 2016, alleging violations of Sections 404 and 405 of ERISA relating to the Canada Disclosure.Target, the Plan Investment Committee, and seven present or former officers are named as defendants in theAmended Complaint. The plaintiffs seek to represent a class consisting of all persons who were participantsin or beneficiaries of the Target Corporation 401(k) Plan or the Target Corporation Ventures 401(k) Plan(collectively, the Plans) at any time between February 27, 2013 and May 19, 2014 and whose Plan accountsincluded investments in Target stock. The plaintiffs seek damages, an injunction and other unspecified equitablerelief, and attorneys’ fees, expenses, and costs, based on allegations that the defendants breached theirfiduciary duties by failing to take action to prevent Plan participants from continuing to purchase Target stockduring the class period at prices that allegedly were artificially inflated. On February 24, 2017, Target and theother defendants moved to dismiss the Amended Complaint. That motion has not yet been heard or decided.Target intends to vigorously defend this consolidated action.
The following governmental enforcement proceedings relating to environmental matters are reported pursuant toinstruction 5(C) of Item 103 of Regulation S-K because they involve potential monetary sanctions in excess of $100,000:
On February 27, 2015, the California Attorney General sent us a letter alleging, based on a series of compliancechecks, that we have not achieved compliance with California’s environmental laws and the provisions of theinjunction that was part of a settlement reached in 2011. Representatives of Target have had a series ofmeetings with representatives of the Attorney General’s Office and certain California District Attorneys’ Officesto discuss the allegations and attempt to resolve the matter. No formal legal action has been commenced, norhas any specific relief been sought, to date.
For a description of other legal proceedings, see Note 19 of the Financial Statements.
12
Item 4. Mine Safety Disclosures
Not applicable.
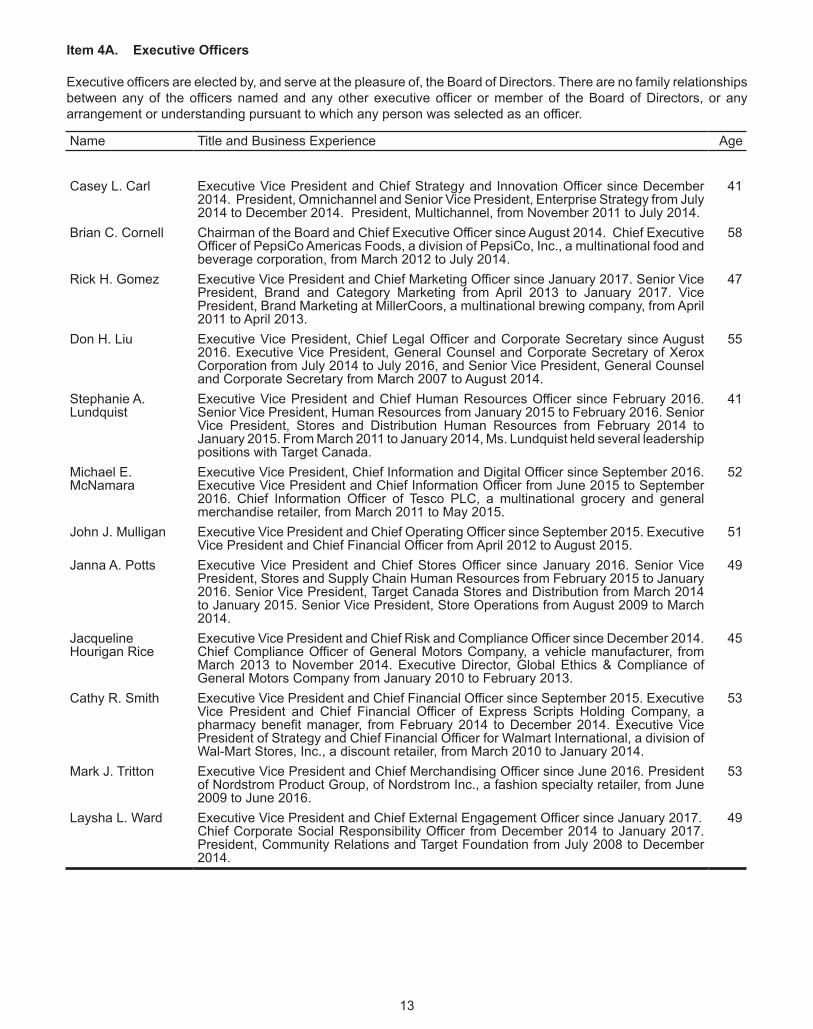
Item 4A. Executive Officers
Executive officers are elected by, and serve at the pleasure of, the Board of Directors. There are no family relationshipsbetween any of the officers named and any other executive officer or member of the Board of Directors, or anyarrangement or understanding pursuant to which any person was selected as an officer.
Name Title and Business Experience Age
Casey L. Carl Executive Vice President and Chief Strategy and Innovation Officer since December2014. President, Omnichannel and Senior Vice President, Enterprise Strategy from July2014 to December 2014. President, Multichannel, from November 2011 to July 2014.
41
Brian C. Cornell Chairman of the Board and Chief Executive Officer since August 2014. Chief ExecutiveOfficer of PepsiCo Americas Foods, a division of PepsiCo, Inc., a multinational food andbeverage corporation, from March 2012 to July 2014.
58
Rick H. Gomez Executive Vice President and Chief Marketing Officer since January 2017. Senior VicePresident, Brand and Category Marketing from April 2013 to January 2017. VicePresident, Brand Marketing at MillerCoors, a multinational brewing company, from April2011 to April 2013.
47
Don H. Liu Executive Vice President, Chief Legal Officer and Corporate Secretary since August2016. Executive Vice President, General Counsel and Corporate Secretary of XeroxCorporation from July 2014 to July 2016, and Senior Vice President, General Counseland Corporate Secretary from March 2007 to August 2014.
55
Stephanie A.Lundquist
Executive Vice President and Chief Human Resources Officer since February 2016.Senior Vice President, Human Resources from January 2015 to February 2016. SeniorVice President, Stores and Distribution Human Resources from February 2014 toJanuary 2015. From March 2011 to January 2014, Ms. Lundquist held several leadershippositions with Target Canada.
41
Michael E.McNamara
Executive Vice President, Chief Information and Digital Officer since September 2016.Executive Vice President and Chief Information Officer from June 2015 to September2016. Chief Information Officer of Tesco PLC, a multinational grocery and generalmerchandise retailer, from March 2011 to May 2015.
52
John J. Mulligan Executive Vice President and Chief Operating Officer since September 2015. ExecutiveVice President and Chief Financial Officer from April 2012 to August 2015.
51
Janna A. Potts Executive Vice President and Chief Stores Officer since January 2016. Senior VicePresident, Stores and Supply Chain Human Resources from February 2015 to January2016. Senior Vice President, Target Canada Stores and Distribution from March 2014to January 2015. Senior Vice President, Store Operations from August 2009 to March2014.
49
JacquelineHourigan Rice
Executive Vice President and Chief Risk and Compliance Officer since December 2014.Chief Compliance Officer of General Motors Company, a vehicle manufacturer, fromMarch 2013 to November 2014. Executive Director, Global Ethics & Compliance ofGeneral Motors Company from January 2010 to February 2013.
45
Cathy R. Smith Executive Vice President and Chief Financial Officer since September 2015. ExecutiveVice President and Chief Financial Officer of Express Scripts Holding Company, apharmacy benefit manager, from February 2014 to December 2014. Executive VicePresident of Strategy and Chief Financial Officer for Walmart International, a division ofWal-Mart Stores, Inc., a discount retailer, from March 2010 to January 2014.
53
Mark J. Tritton Executive Vice President and Chief Merchandising Officer since June 2016. Presidentof Nordstrom Product Group, of Nordstrom Inc., a fashion specialty retailer, from June2009 to June 2016.
53
Laysha L. Ward Executive Vice President and Chief External Engagement Officer since January 2017. Chief Corporate Social Responsibility Officer from December 2014 to January 2017.President, Community Relations and Target Foundation from July 2008 to December2014.
49
13
PART II
14
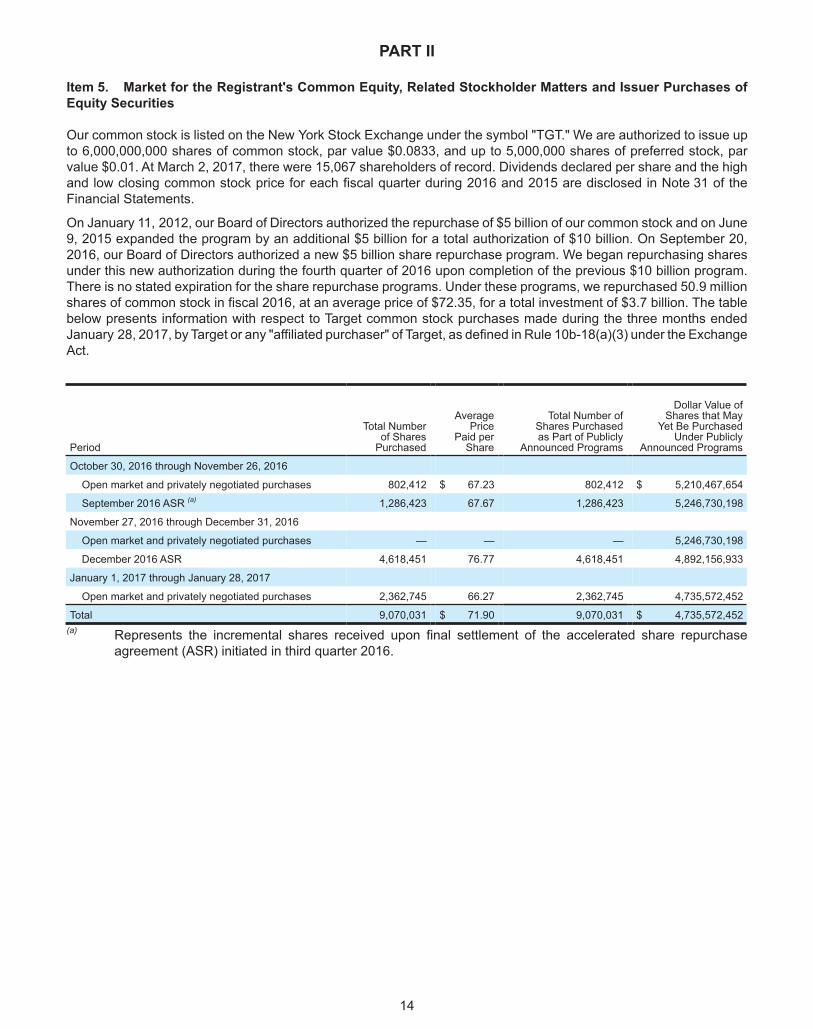
Item 5. Market for the Registrant's Common Equity, Related Stockholder Matters and Issuer Purchases ofEquity Securities
Our common stock is listed on the New York Stock Exchange under the symbol "TGT." We are authorized to issue upto 6,000,000,000 shares of common stock, par value $0.0833, and up to 5,000,000 shares of preferred stock, parvalue $0.01. At March 2, 2017, there were 15,067 shareholders of record. Dividends declared per share and the highand low closing common stock price for each fiscal quarter during 2016 and 2015 are disclosed in Note 31 of theFinancial Statements.
On January 11, 2012, our Board of Directors authorized the repurchase of $5 billion of our common stock and on June9, 2015 expanded the program by an additional $5 billion for a total authorization of $10 billion. On September 20,2016, our Board of Directors authorized a new $5 billion share repurchase program. We began repurchasing sharesunder this new authorization during the fourth quarter of 2016 upon completion of the previous $10 billion program.There is no stated expiration for the share repurchase programs. Under these programs, we repurchased 50.9 millionshares of common stock in fiscal 2016, at an average price of $72.35, for a total investment of $3.7 billion. The tablebelow presents information with respect to Target common stock purchases made during the three months endedJanuary 28, 2017, by Target or any "affiliated purchaser" of Target, as defined in Rule 10b-18(a)(3) under the ExchangeAct.
Period
Total Numberof Shares
Purchased
AveragePrice
Paid perShare
Total Number ofShares Purchasedas Part of Publicly
Announced Programs
Dollar Value ofShares that May
Yet Be PurchasedUnder Publicly
Announced Programs
October 30, 2016 through November 26, 2016
Open market and privately negotiated purchases 802,412 $ 67.23 802,412 $ 5,210,467,654
September 2016 ASR (a) 1,286,423 67.67 1,286,423 5,246,730,198
November 27, 2016 through December 31, 2016
Open market and privately negotiated purchases — — — 5,246,730,198
December 2016 ASR 4,618,451 76.77 4,618,451 4,892,156,933
January 1, 2017 through January 28, 2017
Open market and privately negotiated purchases 2,362,745 66.27 2,362,745 4,735,572,452
Total 9,070,031 $ 71.90 9,070,031 $ 4,735,572,452(a) Represents the incremental shares received upon final settlement of the accelerated share repurchase
agreement (ASR) initiated in third quarter 2016.
Fiscal Years EndedJanuary 28,
2012February 2,
2013February 1,
2014January 31,
2015January 30,
2016January 28,
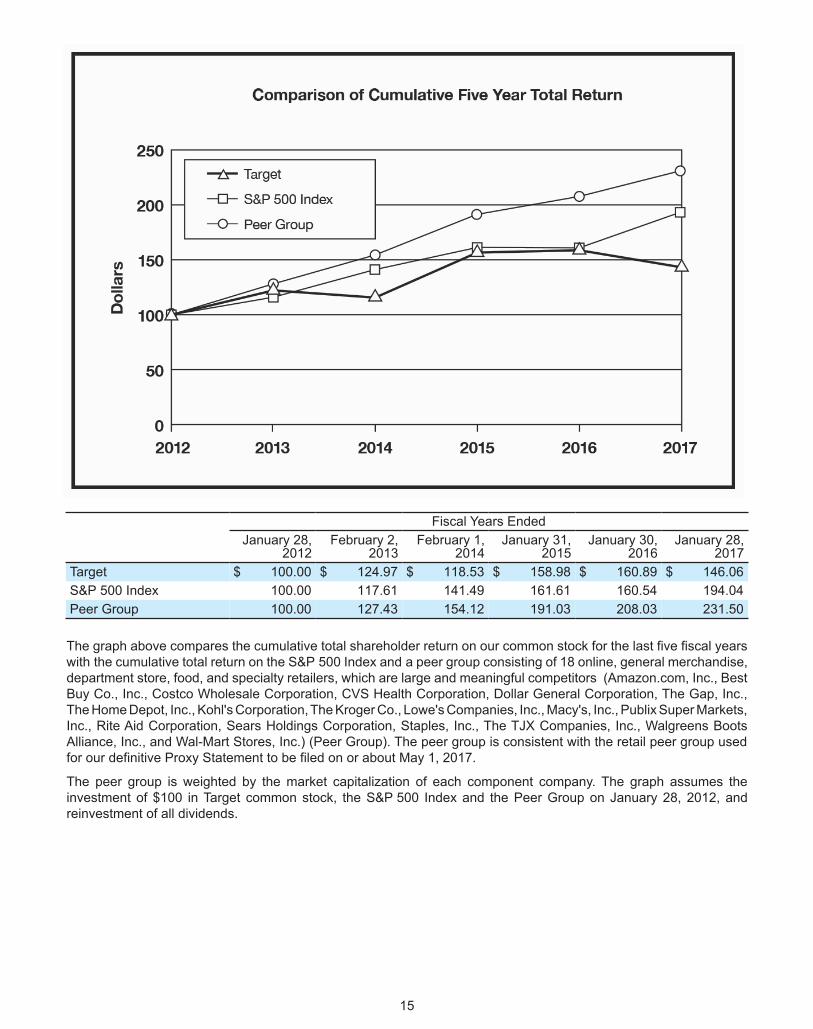
2017Target $ 100.00 $ 124.97 $ 118.53 $ 158.98 $ 160.89 $ 146.06S&P 500 Index 100.00 117.61 141.49 161.61 160.54 194.04Peer Group 100.00 127.43 154.12 191.03 208.03 231.50
The graph above compares the cumulative total shareholder return on our common stock for the last five fiscal yearswith the cumulative total return on the S&P 500 Index and a peer group consisting of 18 online, general merchandise,department store, food, and specialty retailers, which are large and meaningful competitors (Amazon.com, Inc., BestBuy Co., Inc., Costco Wholesale Corporation, CVS Health Corporation, Dollar General Corporation, The Gap, Inc.,The Home Depot, Inc., Kohl's Corporation, The Kroger Co., Lowe's Companies, Inc., Macy's, Inc., Publix Super Markets,Inc., Rite Aid Corporation, Sears Holdings Corporation, Staples, Inc., The TJX Companies, Inc., Walgreens BootsAlliance, Inc., and Wal-Mart Stores, Inc.) (Peer Group). The peer group is consistent with the retail peer group usedfor our definitive Proxy Statement to be filed on or about May 1, 2017.
The peer group is weighted by the market capitalization of each component company. The graph assumes theinvestment of $100 in Target common stock, the S&P 500 Index and the Peer Group on January 28, 2012, andreinvestment of all dividends.
15
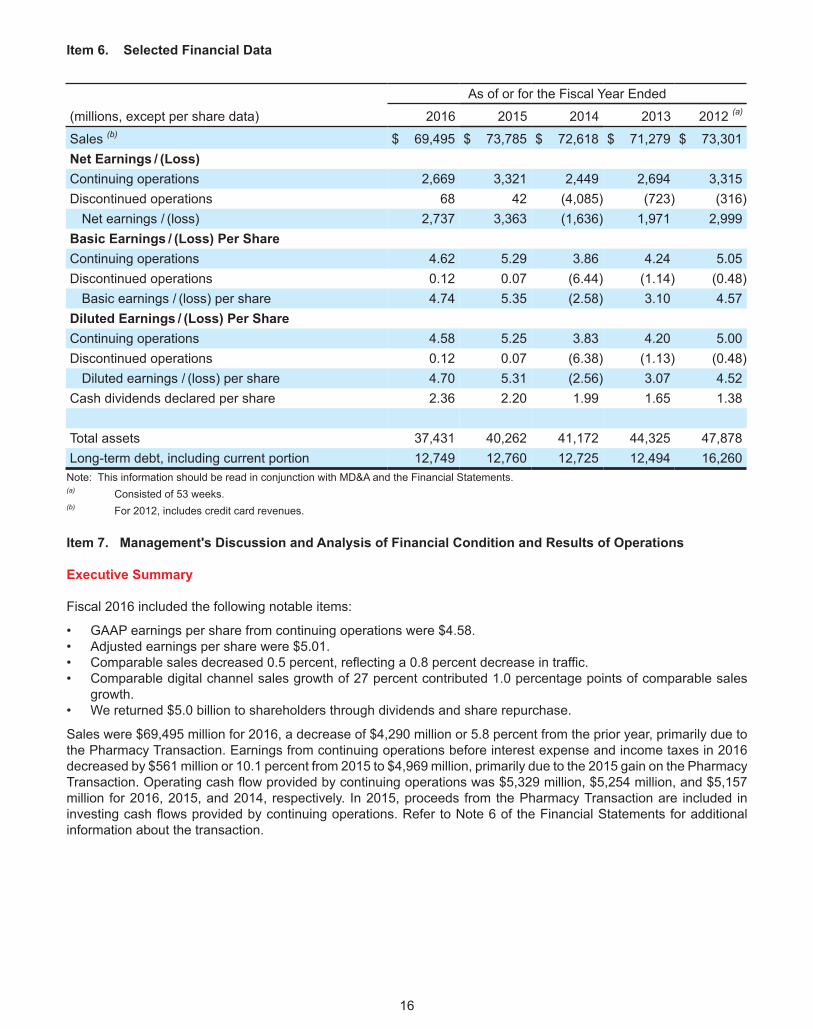
Item 6. Selected Financial Data
As of or for the Fiscal Year Ended
(millions, except per share data) 2016 2015 2014 2013 2012 (a)
Sales (b) $ 69,495 $ 73,785 $ 72,618 $ 71,279 $ 73,301Net Earnings / (Loss)Continuing operations 2,669 3,321 2,449 2,694 3,315Discontinued operations 68 42 (4,085) (723) (316)
Net earnings / (loss) 2,737 3,363 (1,636) 1,971 2,999Basic Earnings / (Loss) Per ShareContinuing operations 4.62 5.29 3.86 4.24 5.05Discontinued operations 0.12 0.07 (6.44) (1.14) (0.48)
Basic earnings / (loss) per share 4.74 5.35 (2.58) 3.10 4.57Diluted Earnings / (Loss) Per ShareContinuing operations 4.58 5.25 3.83 4.20 5.00Discontinued operations 0.12 0.07 (6.38) (1.13) (0.48)
Diluted earnings / (loss) per share 4.70 5.31 (2.56) 3.07 4.52Cash dividends declared per share 2.36 2.20 1.99 1.65 1.38
Total assets 37,431 40,262 41,172 44,325 47,878Long-term debt, including current portion 12,749 12,760 12,725 12,494 16,260
Note: This information should be read in conjunction with MD&A and the Financial Statements.(a) Consisted of 53 weeks.(b) For 2012, includes credit card revenues.
16
Item 7. Management's Discussion and Analysis of Financial Condition and Results of Operations
Executive Summary
Fiscal 2016 included the following notable items:
• GAAP earnings per share from continuing operations were $4.58.• Adjusted earnings per share were $5.01.• Comparable sales decreased 0.5 percent, reflecting a 0.8 percent decrease in traffic. • Comparable digital channel sales growth of 27 percent contributed 1.0 percentage points of comparable sales
growth.• We returned $5.0 billion to shareholders through dividends and share repurchase.
Sales were $69,495 million for 2016, a decrease of $4,290 million or 5.8 percent from the prior year, primarily due tothe Pharmacy Transaction. Earnings from continuing operations before interest expense and income taxes in 2016decreased by $561 million or 10.1 percent from 2015 to $4,969 million, primarily due to the 2015 gain on the PharmacyTransaction. Operating cash flow provided by continuing operations was $5,329 million, $5,254 million, and $5,157million for 2016, 2015, and 2014, respectively. In 2015, proceeds from the Pharmacy Transaction are included ininvesting cash flows provided by continuing operations. Refer to Note 6 of the Financial Statements for additionalinformation about the transaction.
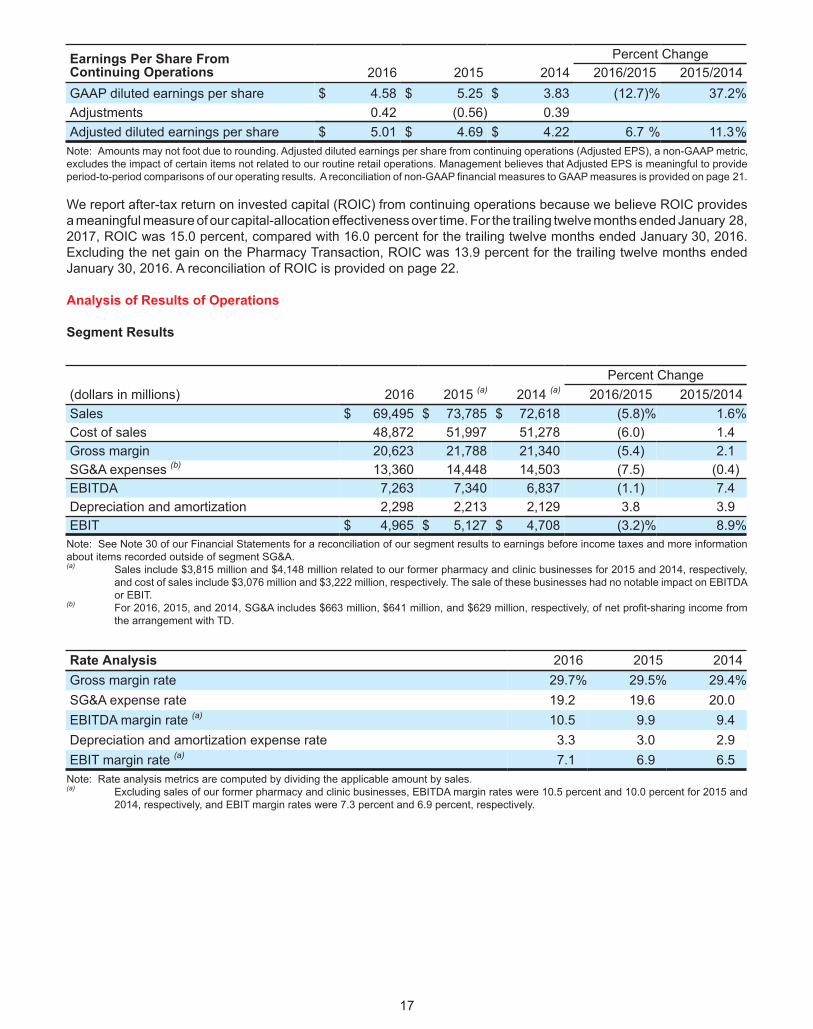
Earnings Per Share From Continuing Operations
Percent Change2016 2015 2014 2016/2015 2015/2014
GAAP diluted earnings per share $ 4.58 $ 5.25 $ 3.83 (12.7)% 37.2%Adjustments 0.42 (0.56) 0.39Adjusted diluted earnings per share $ 5.01 $ 4.69 $ 4.22 6.7 % 11.3%
Note: Amounts may not foot due to rounding. Adjusted diluted earnings per share from continuing operations (Adjusted EPS), a non-GAAP metric,excludes the impact of certain items not related to our routine retail operations. Management believes that Adjusted EPS is meaningful to provideperiod-to-period comparisons of our operating results. A reconciliation of non-GAAP financial measures to GAAP measures is provided on page 21.
We report after-tax return on invested capital (ROIC) from continuing operations because we believe ROIC providesa meaningful measure of our capital-allocation effectiveness over time. For the trailing twelve months ended January 28,2017, ROIC was 15.0 percent, compared with 16.0 percent for the trailing twelve months ended January 30, 2016.Excluding the net gain on the Pharmacy Transaction, ROIC was 13.9 percent for the trailing twelve months endedJanuary 30, 2016. A reconciliation of ROIC is provided on page 22.
17
Analysis of Results of Operations
Segment Results
Percent Change(dollars in millions) 2016 2015 (a) 2014 (a) 2016/2015 2015/2014Sales $ 69,495 $ 73,785 $ 72,618 (5.8)% 1.6%Cost of sales 48,872 51,997 51,278 (6.0) 1.4Gross margin 20,623 21,788 21,340 (5.4) 2.1SG&A expenses (b) 13,360 14,448 14,503 (7.5) (0.4)EBITDA 7,263 7,340 6,837 (1.1) 7.4Depreciation and amortization 2,298 2,213 2,129 3.8 3.9EBIT $ 4,965 $ 5,127 $ 4,708 (3.2)% 8.9%
Note: See Note 30 of our Financial Statements for a reconciliation of our segment results to earnings before income taxes and more informationabout items recorded outside of segment SG&A.(a) Sales include $3,815 million and $4,148 million related to our former pharmacy and clinic businesses for 2015 and 2014, respectively,
and cost of sales include $3,076 million and $3,222 million, respectively. The sale of these businesses had no notable impact on EBITDAor EBIT.
(b) For 2016, 2015, and 2014, SG&A includes $663 million, $641 million, and $629 million, respectively, of net profit-sharing income fromthe arrangement with TD.
Rate Analysis 2016 2015 2014Gross margin rate 29.7% 29.5% 29.4%SG&A expense rate 19.2 19.6 20.0EBITDA margin rate (a) 10.5 9.9 9.4Depreciation and amortization expense rate 3.3 3.0 2.9EBIT margin rate (a) 7.1 6.9 6.5
Note: Rate analysis metrics are computed by dividing the applicable amount by sales.(a) Excluding sales of our former pharmacy and clinic businesses, EBITDA margin rates were 10.5 percent and 10.0 percent for 2015 and
2014, respectively, and EBIT margin rates were 7.3 percent and 6.9 percent, respectively.
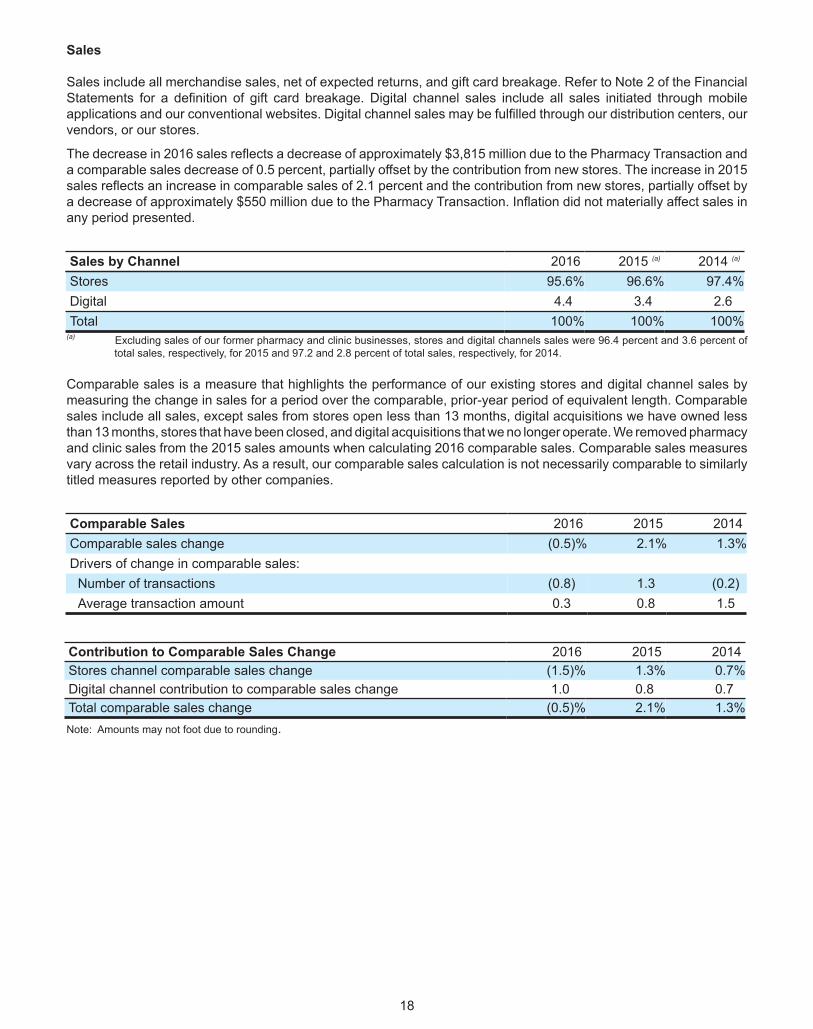
Sales
Sales include all merchandise sales, net of expected returns, and gift card breakage. Refer to Note 2 of the FinancialStatements for a definition of gift card breakage. Digital channel sales include all sales initiated through mobileapplications and our conventional websites. Digital channel sales may be fulfilled through our distribution centers, ourvendors, or our stores.
The decrease in 2016 sales reflects a decrease of approximately $3,815 million due to the Pharmacy Transaction anda comparable sales decrease of 0.5 percent, partially offset by the contribution from new stores. The increase in 2015sales reflects an increase in comparable sales of 2.1 percent and the contribution from new stores, partially offset bya decrease of approximately $550 million due to the Pharmacy Transaction. Inflation did not materially affect sales inany period presented.
Sales by Channel 2016 2015 (a) 2014 (a)
Stores 95.6% 96.6% 97.4%Digital 4.4 3.4 2.6Total 100% 100% 100%
(a) Excluding sales of our former pharmacy and clinic businesses, stores and digital channels sales were 96.4 percent and 3.6 percent oftotal sales, respectively, for 2015 and 97.2 and 2.8 percent of total sales, respectively, for 2014.
Comparable sales is a measure that highlights the performance of our existing stores and digital channel sales bymeasuring the change in sales for a period over the comparable, prior-year period of equivalent length. Comparablesales include all sales, except sales from stores open less than 13 months, digital acquisitions we have owned lessthan 13 months, stores that have been closed, and digital acquisitions that we no longer operate. We removed pharmacyand clinic sales from the 2015 sales amounts when calculating 2016 comparable sales. Comparable sales measuresvary across the retail industry. As a result, our comparable sales calculation is not necessarily comparable to similarlytitled measures reported by other companies.
Comparable Sales 2016 2015 2014Comparable sales change (0.5)% 2.1% 1.3%Drivers of change in comparable sales:
Number of transactions (0.8) 1.3 (0.2)Average transaction amount 0.3 0.8 1.5
Contribution to Comparable Sales Change 2016 2015 2014Stores channel comparable sales change (1.5)% 1.3% 0.7%Digital channel contribution to comparable sales change 1.0 0.8 0.7Total comparable sales change (0.5)% 2.1% 1.3%Note: Amounts may not foot due to rounding.
18
Sales by Product Category Percentage of Sales2016 2015 2014
Household essentials (a) 22% 26% 25%Food, beverage, and pet supplies (b) 22 21 21Apparel and accessories (c) 20 19 19Home furnishings and décor (d) 19 17 17Hardlines (e) 17 17 18Total 100% 100% 100%
(a) Includes pharmacy, beauty, personal care, baby care, cleaning, and paper products. Pharmacy represented 5 percent and 6 percent in2015 and 2014, respectively.
(b) Includes dry grocery, dairy, frozen food, beverages, candy, snacks, deli, bakery, meat, produce, and pet supplies.(c) Includes apparel for women, men, boys, girls, toddlers, infants and newborns, as well as intimate apparel, jewelry, accessories, and
shoes.(d) Includes furniture, lighting, kitchenware, small appliances, home décor, bed and bath, home improvement, automotive, and seasonal
merchandise such as patio furniture and holiday décor.(e) Includes electronics (including video game hardware and software), music, movies, books, computer software, sporting goods, and toys.
Further analysis of sales metrics is infeasible due to the collective interaction of a broad array of macroeconomic,competitive, and consumer behavioral factors, as well as sales mix and transfer of sales to new stores.
TD offers credit to qualified guests through Target-branded credit cards: the Target Credit Card and the TargetMasterCard Credit Card (Target Credit Cards). Additionally, we offer a branded proprietary Target Debit Card.Collectively, we refer to these products as REDcards®. Guests receive a 5 percent discount on virtually all purchasesand free shipping at Target.com when they use a REDcard. We monitor the percentage of sales that are paid for usingREDcards (REDcard Penetration) because our internal analysis has indicated that a meaningful portion of incrementalpurchases on our REDcards are also incremental sales for Target.
REDcard Penetration 2016 2015 2014Target Debit Card 12.8% 12.1% 11.2%Target Credit Cards 11.2 10.1 9.7Total REDcard Penetration 24.0% 22.3% 20.9%
Note: Excluding pharmacy and clinic sales, total REDcard penetration would have been 23.2 percent and 21.9 percent for 2015 and 2014,respectively. The sum of Target Credit Cards and Target Debit Card penetration may not equal Total REDcard Penetration due to rounding.
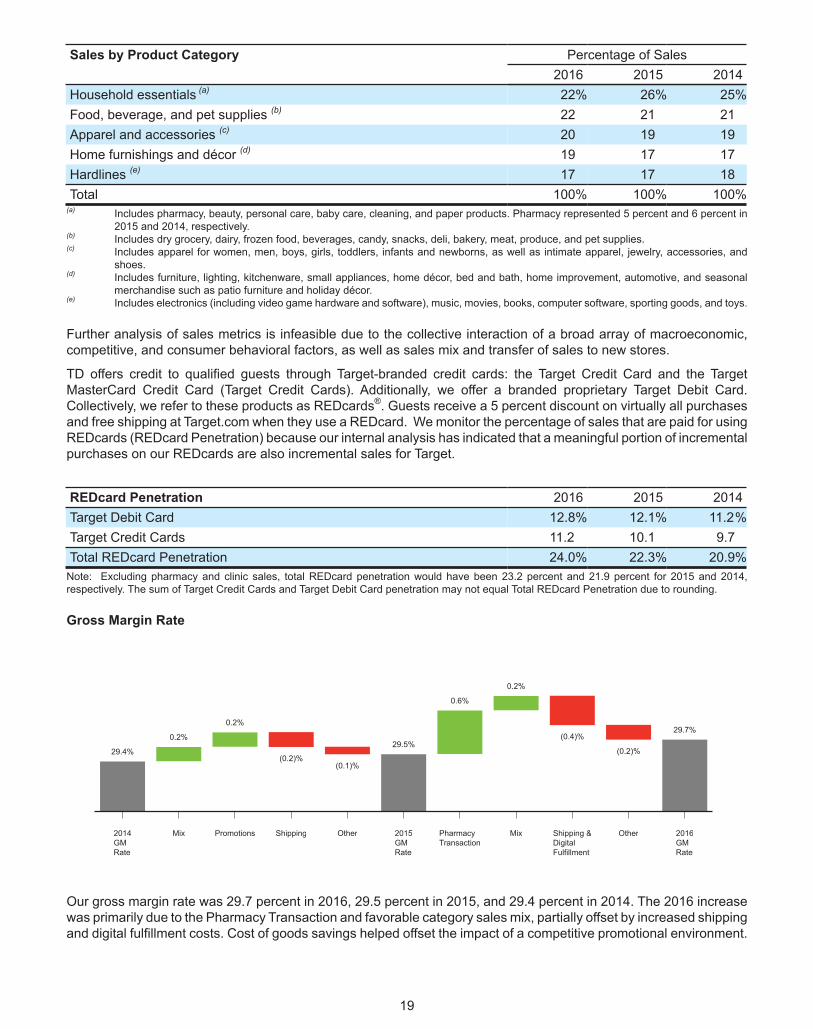
Gross Margin Rate
2014GMRate
Mix Promotions Shipping Other 2015GMRate
PharmacyTransaction
Mix Shipping &DigitalFulfillment
Other 2016GMRate
29.4%
0.2%
0.2%
(0.2)%(0.1)%
29.5%
0.6%
0.2%
(0.4)%
(0.2)%
29.7%
Our gross margin rate was 29.7 percent in 2016, 29.5 percent in 2015, and 29.4 percent in 2014. The 2016 increasewas primarily due to the Pharmacy Transaction and favorable category sales mix, partially offset by increased shippingand digital fulfillment costs. Cost of goods savings helped offset the impact of a competitive promotional environment.
19
The 2015 increase was primarily due to favorable category sales mix and lower promotional activity relative to thehighly promotional period in 2014 following the 2013 data breach, partially offset by the impact of increased digitalchannel sales.
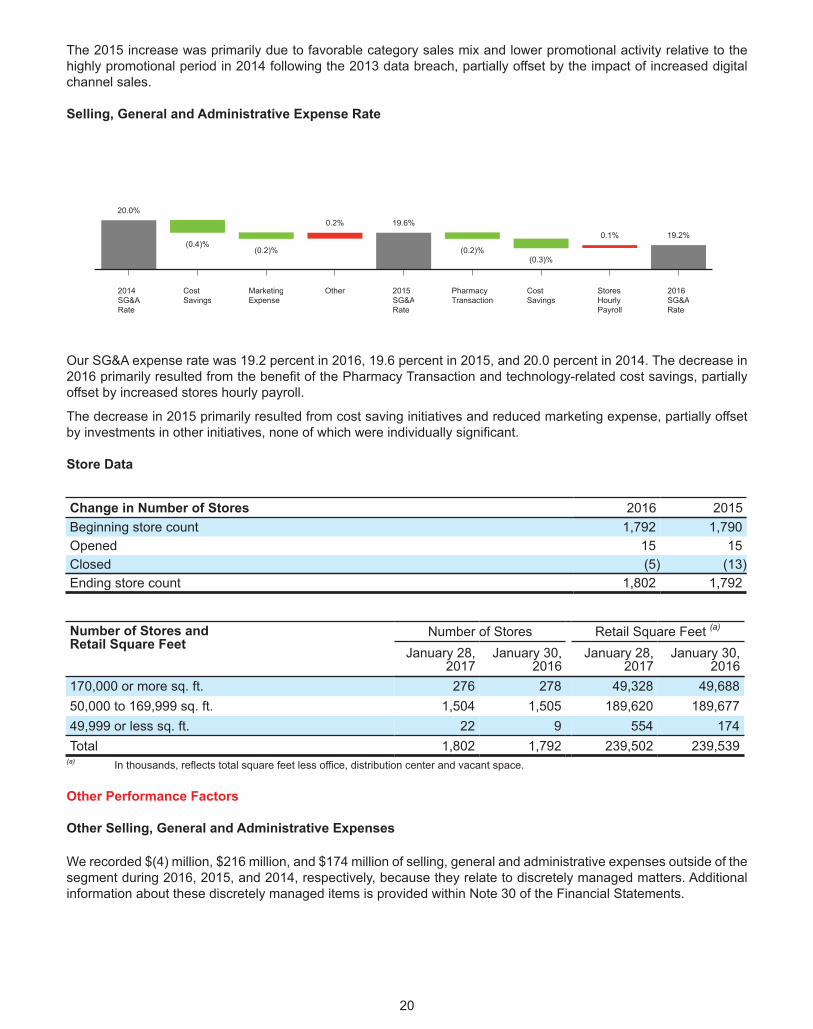
Selling, General and Administrative Expense Rate
2014SG&ARate
CostSavings
MarketingExpense
Other 2015SG&ARate
PharmacyTransaction
CostSavings
StoresHourlyPayroll
2016SG&ARate
20.0%
(0.4)%(0.2)%
0.2% 19.6%
(0.2)%(0.3)%
0.1% 19.2%
Our SG&A expense rate was 19.2 percent in 2016, 19.6 percent in 2015, and 20.0 percent in 2014. The decrease in2016 primarily resulted from the benefit of the Pharmacy Transaction and technology-related cost savings, partiallyoffset by increased stores hourly payroll.
The decrease in 2015 primarily resulted from cost saving initiatives and reduced marketing expense, partially offsetby investments in other initiatives, none of which were individually significant.
Store Data
Change in Number of Stores 2016 2015Beginning store count 1,792 1,790Opened 15 15Closed (5) (13)Ending store count 1,802 1,792
Number of Stores andRetail Square Feet
Number of Stores Retail Square Feet (a)
January 28,2017
January 30,2016
January 28,2017
January 30,2016
170,000 or more sq. ft. 276 278 49,328 49,68850,000 to 169,999 sq. ft. 1,504 1,505 189,620 189,67749,999 or less sq. ft. 22 9 554 174Total 1,802 1,792 239,502 239,539
(a) In thousands, reflects total square feet less office, distribution center and vacant space.
Other Performance Factors
Other Selling, General and Administrative Expenses
We recorded $(4) million, $216 million, and $174 million of selling, general and administrative expenses outside of thesegment during 2016, 2015, and 2014, respectively, because they relate to discretely managed matters. Additionalinformation about these discretely managed items is provided within Note 30 of the Financial Statements.
20
Net Interest Expense
Net interest expense from continuing operations was $1,004 million, $607 million, and $882 million for 2016, 2015,and 2014, respectively. Net interest expense for 2016 and 2014 included a loss on early retirement of debt of $422million and $285 million, respectively.
Provision for Income Taxes
Our 2016 effective income tax rate from continuing operations increased to 32.7 percent, from 32.5 percent in 2015,driven primarily by the 2015 rate impact of the $112 million tax benefit from releasing the valuation allowance on acapital loss. This comparative rate impact was partially offset by $27 million of excess tax benefit in 2016 related toshared-based payments after the adoption of Accounting Standards Update (ASU) No. 2016-09, Improvements toEmployee Share-Based Payment Accounting, and lower pretax earnings. Note 23 of the Financial Statements providesa tax rate reconciliation.
Our 2015 effective income tax rate from continuing operations decreased to 32.5 percent, from 33.0 percent in 2014,driven primarily by the $112 million tax benefit from releasing the valuation allowance on a capital loss. This benefitwas partially offset by a year-over-year decrease in the favorable resolution of various income tax matters and therate impact of higher pretax earnings. The resolution of various income tax matters reduced tax expense by $8 millionand $35 million in 2015 and 2014, respectively.
Discontinued Operations
See Note 7 of the Financial Statements for information about our Canada exit.
Reconciliation of Non-GAAP Financial Measures to GAAP Measures
To provide additional transparency, we have disclosed non-GAAP adjusted diluted earnings per share from continuingoperations (Adjusted EPS). This metric excludes certain items presented below. We believe this information is usefulin providing period-to-period comparisons of the results of our continuing operations. This measure is not in accordancewith, or an alternative to, generally accepted accounting principles in the United States (GAAP). The most comparableGAAP measure is diluted earnings per share from continuing operations. Adjusted EPS should not be considered inisolation or as a substitution for analysis of our results as reported under GAAP. Other companies may calculateAdjusted EPS differently than we do, limiting the usefulness of the measure for comparisons with other companies.
2016 2015 2014
(millions, except per share data) PretaxNet of
Tax
PerShare
Amounts PretaxNet of
Tax
PerShare
Amounts PretaxNet of
Tax
PerShare
AmountsGAAP diluted earnings per share fromcontinuing operations $ 4.58 $ 5.25 $ 3.83Adjustments
Loss on early retirement of debt $ 422 $ 257 $ 0.44 $ — $ — $ — $ 285 $ 173 $ 0.27Gain on sale (a) — — — (620) (487) (0.77) — — —Restructuring costs (b) — — — 138 87 0.14 — — —Data breach-related costs, net of
insurance (c) — — — 39 28 0.04 145 94 0.15Other (d) (4) (2) — 39 29 0.05 29 18 0.03Resolution of income tax matters — (7) (0.01) — (8) (0.01) — (35) (0.06)
Adjusted diluted earnings per sharefrom continuing operations $ 5.01 $ 4.69 $ 4.22
Note: Amounts may not foot due to rounding.(a) Refer to Note 6 of the Financial Statements. (b) Refer to Note 8 of the Financial Statements.(c) Refer to Note 19 of the Financial Statements.(d) For 2016, represents items related to the Pharmacy Transaction. For 2015, represents impairments related to our decision to wind down
certain noncore operations, as described in Note 16 of the Financial Statements. The 2014 amounts include impairments of $16 millionrelated to undeveloped land in the U.S. and $13 million of expense related to converting co-branded card program to MasterCard.
21
We have also disclosed after-tax return on invested capital for continuing operations (ROIC), which is a ratio basedon GAAP information, with the exception of adjustments made to capitalize operating leases. Operating leases arecapitalized as part of the ROIC calculation to control for differences in capital structure between us and our competitors.We believe this metric provides a meaningful measure of the effectiveness of our capital allocation over time. Othercompanies may calculate ROIC differently than we do, limiting the usefulness of the measure for comparisons withother companies.
After-Tax Return on Invested Capital
Numerator Trailing Twelve Months
(dollars in millions)January 28,
2017January 30,
2016Earnings from continuing operations before interest expense andincome taxes $ 4,969 $ 5,530+ Operating lease interest (a)(b) 71 87Adjusted earnings from continuing operations before interest expense
and income taxes 5,040 5,617- Income taxes (c) 1,648 1,827Net operating profit after taxes $ 3,392 $ 3,790
Denominator(dollars in millions)
January 28, 2017
January 30, 2016
January 31, 2015
Current portion of long-term debt and other borrowings $ 1,718 $ 815 $ 91+ Noncurrent portion of long-term debt 11,031 11,945 12,634+ Shareholders' equity 10,953 12,957 13,997+ Capitalized operating lease obligations (b)(d) 1,187 1,457 1,490- Cash and cash equivalents 2,512 4,046 2,210- Net assets of discontinued operations 62 226 1,479Invested capital $ 22,315 $ 22,902 $ 24,523Average invested capital (e) $ 22,608 $ 23,713
After-tax return on invested capital 15.0% 16.0% (f)
(a) Represents the add-back to operating income driven by the hypothetical interest expense we would incur if the property under our operatingleases were owned or accounted for as capital leases, using eight times our trailing twelve months rent expense and an estimated interestrate of six percent.
(b) See the following Reconciliation of Capitalized Operating Leases table for the adjustments to our GAAP total rent expense to obtain thehypothetical capitalization of operating leases and related operating lease interest.
(c) Calculated using the effective tax rate for continuing operations, which was 32.7 percent and 32.5 percent for the trailing twelve monthsended January 28, 2017 and January 30, 2016. For the twelve months ended January 28, 2017 and January 30, 2016, includes tax effectof $1,624 million and $1,799 million, respectively, related to EBIT and $23 million and $28 million, respectively, related to operating leaseinterest.
(d) Calculated as eight times our trailing twelve months rent expense. (e) Average based on the invested capital at the end of the current period and the invested capital at the end of the prior period.(f) Excluding the net gain on the Pharmacy Transaction, ROIC was 13.9 percent for the trailing twelve months ended January 30, 2016.
Capitalized operating lease obligations and operating lease interest are not in accordance with, or an alternative for,GAAP. The most comparable GAAP measure is total rent expense. Capitalized operating lease obligations andoperating lease interest should not be considered in isolation or as a substitution for analysis of our results as reportedunder GAAP.
22
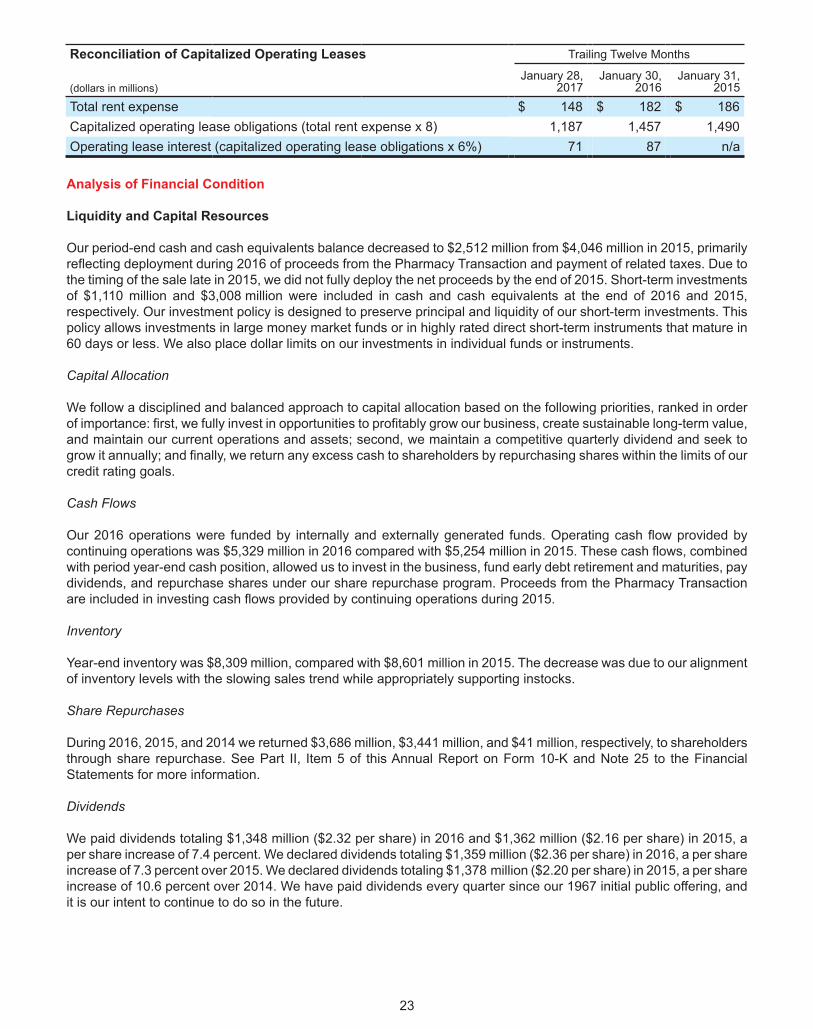
Reconciliation of Capitalized Operating Leases Trailing Twelve Months
(dollars in millions)January 28,
2017January 30,
2016January 31,
2015Total rent expense $ 148 $ 182 $ 186Capitalized operating lease obligations (total rent expense x 8) 1,187 1,457 1,490Operating lease interest (capitalized operating lease obligations x 6%) 71 87 n/a
23
Analysis of Financial Condition
Liquidity and Capital Resources
Our period-end cash and cash equivalents balance decreased to $2,512 million from $4,046 million in 2015, primarilyreflecting deployment during 2016 of proceeds from the Pharmacy Transaction and payment of related taxes. Due tothe timing of the sale late in 2015, we did not fully deploy the net proceeds by the end of 2015. Short-term investmentsof $1,110 million and $3,008 million were included in cash and cash equivalents at the end of 2016 and 2015,respectively. Our investment policy is designed to preserve principal and liquidity of our short-term investments. Thispolicy allows investments in large money market funds or in highly rated direct short-term instruments that mature in60 days or less. We also place dollar limits on our investments in individual funds or instruments.
Capital Allocation
We follow a disciplined and balanced approach to capital allocation based on the following priorities, ranked in orderof importance: first, we fully invest in opportunities to profitably grow our business, create sustainable long-term value,and maintain our current operations and assets; second, we maintain a competitive quarterly dividend and seek togrow it annually; and finally, we return any excess cash to shareholders by repurchasing shares within the limits of ourcredit rating goals.
Cash Flows
Our 2016 operations were funded by internally and externally generated funds. Operating cash flow provided bycontinuing operations was $5,329 million in 2016 compared with $5,254 million in 2015. These cash flows, combinedwith period year-end cash position, allowed us to invest in the business, fund early debt retirement and maturities, paydividends, and repurchase shares under our share repurchase program. Proceeds from the Pharmacy Transactionare included in investing cash flows provided by continuing operations during 2015.
Inventory
Year-end inventory was $8,309 million, compared with $8,601 million in 2015. The decrease was due to our alignmentof inventory levels with the slowing sales trend while appropriately supporting instocks.
Share Repurchases
During 2016, 2015, and 2014 we returned $3,686 million, $3,441 million, and $41 million, respectively, to shareholdersthrough share repurchase. See Part II, Item 5 of this Annual Report on Form 10-K and Note 25 to the FinancialStatements for more information.
Dividends
We paid dividends totaling $1,348 million ($2.32 per share) in 2016 and $1,362 million ($2.16 per share) in 2015, aper share increase of 7.4 percent. We declared dividends totaling $1,359 million ($2.36 per share) in 2016, a per shareincrease of 7.3 percent over 2015. We declared dividends totaling $1,378 million ($2.20 per share) in 2015, a per shareincrease of 10.6 percent over 2014. We have paid dividends every quarter since our 1967 initial public offering, andit is our intent to continue to do so in the future.
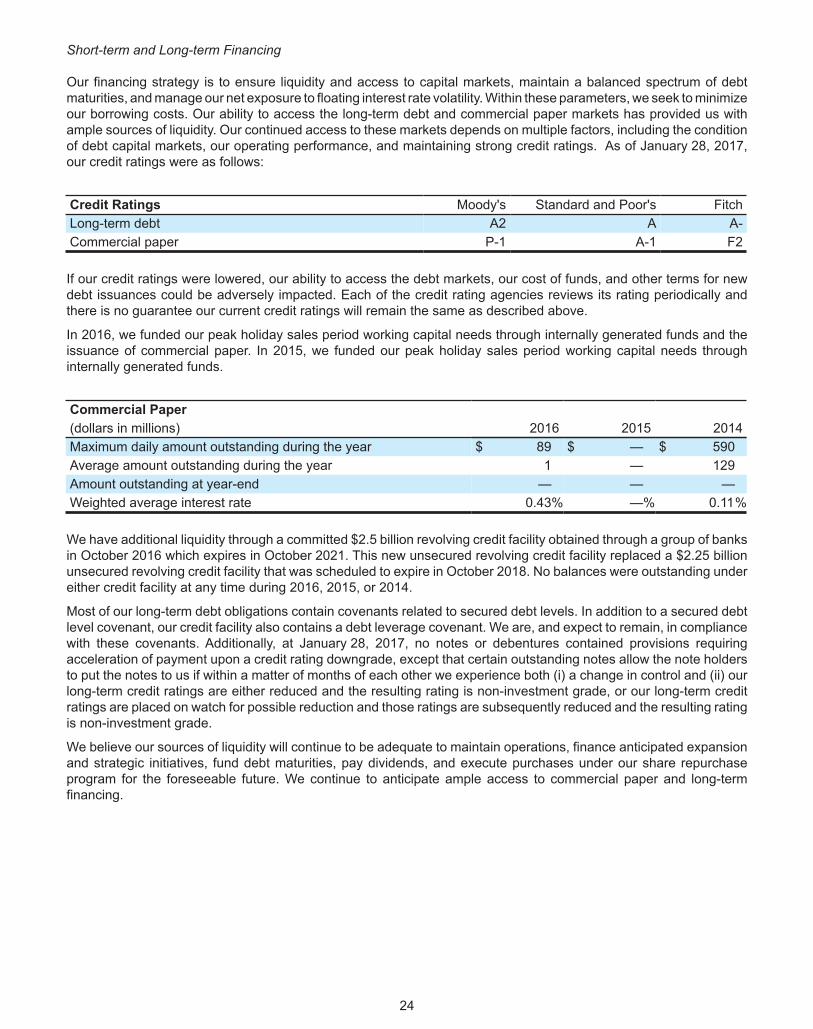
Short-term and Long-term Financing
Our financing strategy is to ensure liquidity and access to capital markets, maintain a balanced spectrum of debtmaturities, and manage our net exposure to floating interest rate volatility. Within these parameters, we seek to minimizeour borrowing costs. Our ability to access the long-term debt and commercial paper markets has provided us withample sources of liquidity. Our continued access to these markets depends on multiple factors, including the conditionof debt capital markets, our operating performance, and maintaining strong credit ratings. As of January 28, 2017,our credit ratings were as follows:
Credit Ratings Moody's Standard and Poor's FitchLong-term debt A2 A A-Commercial paper P-1 A-1 F2
If our credit ratings were lowered, our ability to access the debt markets, our cost of funds, and other terms for newdebt issuances could be adversely impacted. Each of the credit rating agencies reviews its rating periodically andthere is no guarantee our current credit ratings will remain the same as described above.
In 2016, we funded our peak holiday sales period working capital needs through internally generated funds and theissuance of commercial paper. In 2015, we funded our peak holiday sales period working capital needs throughinternally generated funds.
Commercial Paper(dollars in millions) 2016 2015 2014Maximum daily amount outstanding during the year $ 89 $ — $ 590Average amount outstanding during the year 1 — 129Amount outstanding at year-end — — —Weighted average interest rate 0.43% —% 0.11%
We have additional liquidity through a committed $2.5 billion revolving credit facility obtained through a group of banksin October 2016 which expires in October 2021. This new unsecured revolving credit facility replaced a $2.25 billionunsecured revolving credit facility that was scheduled to expire in October 2018. No balances were outstanding undereither credit facility at any time during 2016, 2015, or 2014.
Most of our long-term debt obligations contain covenants related to secured debt levels. In addition to a secured debtlevel covenant, our credit facility also contains a debt leverage covenant. We are, and expect to remain, in compliancewith these covenants. Additionally, at January 28, 2017, no notes or debentures contained provisions requiringacceleration of payment upon a credit rating downgrade, except that certain outstanding notes allow the note holdersto put the notes to us if within a matter of months of each other we experience both (i) a change in control and (ii) ourlong-term credit ratings are either reduced and the resulting rating is non-investment grade, or our long-term creditratings are placed on watch for possible reduction and those ratings are subsequently reduced and the resulting ratingis non-investment grade.
We believe our sources of liquidity will continue to be adequate to maintain operations, finance anticipated expansionand strategic initiatives, fund debt maturities, pay dividends, and execute purchases under our share repurchaseprogram for the foreseeable future. We continue to anticipate ample access to commercial paper and long-termfinancing.
24
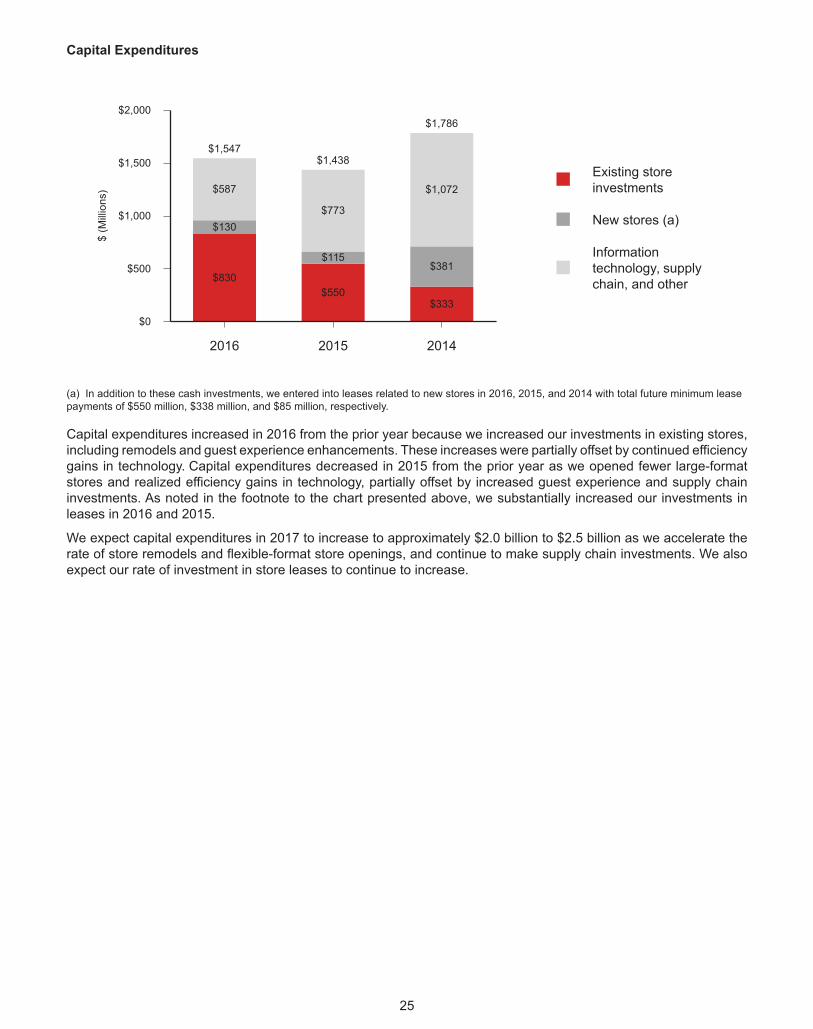
Capital Expenditures
Existing storeinvestments
New stores (a)
Informationtechnology, supplychain, and other
$2,000
$1,500
$1,000
$500
$0
$(M
illio
ns)
2016 2015 2014
$830$550
$333
$130
$115$381
$587
$1,547
$773
$1,438
$1,072
$1,786
(a) In addition to these cash investments, we entered into leases related to new stores in 2016, 2015, and 2014 with total future minimum leasepayments of $550 million, $338 million, and $85 million, respectively.
Capital expenditures increased in 2016 from the prior year because we increased our investments in existing stores,including remodels and guest experience enhancements. These increases were partially offset by continued efficiencygains in technology. Capital expenditures decreased in 2015 from the prior year as we opened fewer large-formatstores and realized efficiency gains in technology, partially offset by increased guest experience and supply chaininvestments. As noted in the footnote to the chart presented above, we substantially increased our investments inleases in 2016 and 2015.
We expect capital expenditures in 2017 to increase to approximately $2.0 billion to $2.5 billion as we accelerate therate of store remodels and flexible-format store openings, and continue to make supply chain investments. We alsoexpect our rate of investment in store leases to continue to increase.
25
Commitments and Contingencies
Contractual Obligations as of Payments Due by PeriodJanuary 28, 2017 Less than 1-3 3-5 After 5(millions) Total 1 Year Years Years YearsRecorded contractual obligations:
Long-term debt (a) $ 11,814 $ 1,683 $ 1,203 $ 2,150 $ 6,778Capital lease obligations (b) 1,963 82 174 178 1,529Deferred compensation (c) 515 56 114 121 224Real estate liabilities (d) 52 52 — — —Tax contingencies (e) — — — — —
Unrecorded contractual obligations:Interest payments – long-term debt 6,308 510 819 710 4,269Operating leases (b) 3,876 198 398 364 2,916Purchase obligations (f) 1,762 609 814 107 232Real estate obligations (g) 216 185 31 — —Future contributions to retirement plans (h) — — — — —
Contractual obligations $ 26,506 $ 3,375 $ 3,553 $ 3,630 $ 15,948(a) Represents principal payments only. See Note 20 of the Financial Statements for further information.(b) These payments also include $348 million and $269 million of legally binding minimum lease payments for stores that are expected to
open in 2017 or later for capital and operating leases, respectively. See Note 22 of the Financial Statements for further information.(c) The timing of deferred compensation payouts is estimated based on payments currently made to former employees and retirees, forecasted
investment returns, and the projected timing of future retirements.(d) Real estate liabilities include costs incurred but not paid related to the construction or remodeling of real estate and facilities.(e) Estimated tax contingencies of $222 million, including interest and penalties and primarily related to continuing operations, are not included
in the table above because we are not able to make reasonably reliable estimates of the period of cash settlement. See Note 23 of theFinancial Statements for further information.
(f) Purchase obligations include all legally binding contracts such as firm minimum commitments for inventory purchases, merchandiseroyalties, equipment purchases, marketing-related contracts, software acquisition/license commitments, and service contracts. We issueinventory purchase orders in the normal course of business, which represent authorizations to purchase that are cancelable by theirterms. We do not consider purchase orders to be firm inventory commitments; therefore, they are excluded from the table above. If wechoose to cancel a purchase order, we may be obligated to reimburse the vendor for unrecoverable outlays incurred prior to cancellation.We also issue trade letters of credit in the ordinary course of business, which are excluded from this table as these obligations areconditioned on terms of the letter of credit being met.
(g) Real estate obligations include commitments for the purchase, construction, or remodeling of real estate and facilities.(h) We have not included obligations under our pension plans in the contractual obligations table above because no additional amounts are
required to be funded as of January 28, 2017. Our historical practice regarding these plans has been to contribute amounts necessaryto satisfy minimum pension funding requirements, plus periodic discretionary amounts determined to be appropriate.
Off Balance Sheet Arrangements: Other than the unrecorded contractual obligations noted above, we do not haveany arrangements or relationships with entities that are not consolidated into the financial statements.
Critical Accounting Estimates
Our consolidated financial statements are prepared in accordance with GAAP, which requires us to make estimatesand apply judgments that affect the reported amounts. In the Notes to Consolidated Financial Statements, we describethe significant accounting policies used in preparing the consolidated financial statements. Our management hasdiscussed the development, selection, and disclosure of our critical accounting estimates with the Audit & FinanceCommittee of our Board of Directors. The following items require significant estimation or judgment:
Inventory and cost of sales: Our inventory is valued at the lower of cost or market. We reduce inventory for estimatedlosses related to shrink and markdowns. Our shrink estimate is based on historical losses verified by physical inventorycounts. Historically, our actual physical inventory count results have shown our estimates to be reliable. Marketadjustments for markdowns are recorded when the salability of the merchandise has diminished. We believe the riskof inventory obsolescence is largely mitigated because our inventory typically turns in less than three months. Inventorywas $8,309 million and $8,601 million at January 28, 2017 and January 30, 2016, respectively, and is further describedin Note 12 of the Financial Statements.
26
Vendor income: We receive various forms of consideration from our vendors (vendor income), principally earned asa result of volume rebates, markdown allowances, promotions, and advertising allowances. Substantially all vendorincome is recorded as a reduction of cost of sales.
We establish a receivable for vendor income that is earned but not yet received. Based on the agreements in place,this receivable is computed by estimating when we have completed our performance and when the amount is earned.The majority of the year-end vendor income receivables are collected within the following fiscal quarter, and we donot believe there is a reasonable likelihood that the assumptions used in our estimate will change significantly.Historically, adjustments to our vendor income receivable have not been material. Vendor income receivable was $385million and $384 million at January 28, 2017 and January 30, 2016, respectively. Vendor income is described furtherin Note 4 of the Financial Statements.
Long-lived assets: Long-lived assets are reviewed for impairment whenever events or changes in circumstancesindicate that the carrying amounts may not be recoverable. The evaluation is performed at the lowest level of identifiablecash flows independent of other assets. An impairment loss would be recognized when estimated undiscounted futurecash flows from the operation and/or disposition of the assets are less than their carrying amount. Measurement ofan impairment loss would be based on the excess of the carrying amount of the asset group over its fair value. Fairvalue is measured using discounted cash flows or independent opinions of value, as appropriate. We recordedimpairments of $43 million, $54 million, and $124 million in 2016, 2015, and 2014, respectively, which are describedfurther in Note 14 of the Financial Statements.
Insurance/self-insurance: We retain a substantial portion of the risk related to certain general liability, workers'compensation, property loss, and team member medical and dental claims. However, we maintain stop-loss coverageto limit the exposure related to certain risks. Liabilities associated with these losses include estimates of both claimsfiled and losses incurred but not yet reported. We use actuarial methods which consider a number of factors to estimateour ultimate cost of losses. General liability and workers' compensation liabilities are recorded at our estimate of theirnet present value; other liabilities referred to above are not discounted. Our workers' compensation and general liabilityaccrual was $447 million and $498 million at January 28, 2017 and January 30, 2016, respectively. We believe thatthe amounts accrued are appropriate; however, our liabilities could be significantly affected if future occurrences orloss developments differ from our assumptions. For example, a five percent increase or decrease in average claimcosts would impact our self-insurance expense by $22 million in 2016. Historically, adjustments to our estimates havenot been material. Refer to Item 7A, Quantitative and Qualitative Disclosures About Market Risk, for further disclosureof the market risks associated with these exposures. We maintain insurance coverage to limit our exposure to certainevents, including network security matters.
Income taxes: We pay income taxes based on the tax statutes, regulations, and case law of the various jurisdictionsin which we operate. Significant judgment is required in determining the timing and amounts of deductible and taxableitems, and in evaluating the ultimate resolution of tax matters in dispute with tax authorities. The benefits of uncertaintax positions are recorded in our financial statements only after determining it is likely the uncertain tax positions wouldwithstand challenge by taxing authorities. We periodically reassess these probabilities and record any changes in thefinancial statements as appropriate. Liabilities for uncertain tax positions, including interest and penalties, were$222 million and $215 million at January 28, 2017 and January 30, 2016, respectively, and primarily relate to continuingoperations. We believe the resolution of these matters will not have a material adverse impact on our consolidatedfinancial statements. Income taxes are described further in Note 23 of the Financial Statements.
Pension accounting: We maintain a funded qualified, defined benefit pension plan, as well as several smaller andunfunded nonqualified plans for certain current and retired team members. The costs for these plans are determinedbased on actuarial calculations using the assumptions described in the following paragraphs. Eligibility and the levelof benefits varies depending on team members' full-time or part-time status, date of hire, age, and/or length of service.The benefit obligation and related expense for these plans are determined based on actuarial calculations usingassumptions about the expected long-term rate of return, the discount rate, and compensation growth rates. Theassumptions, with adjustments made for any significant plan or participant changes, are used to determine the period-end benefit obligation and establish expense for the next year.
Our 2016 expected long-term rate of return on plan assets of 6.8 percent is determined by the portfolio composition,historical long-term investment performance, and current market conditions. A one percentage point decrease in ourexpected long-term rate of return would increase annual expense by $37 million.
The discount rate used to determine benefit obligations is adjusted annually based on the interest rate for long-termhigh-quality corporate bonds, using yields for maturities that are in line with the duration of our pension liabilities. Our
27
benefit obligation and related expense will fluctuate with changes in interest rates. A 0.5 percentage point decreaseto the weighted average discount rate would increase annual expense by $30 million.
Based on our experience, we use a graduated compensation growth schedule that assumes higher compensationgrowth for younger, shorter-service pension-eligible team members than it does for older, longer-service pension-eligible team members.
Pension benefits are further described in Note 28 of the Financial Statements.
Legal and other contingencies: We believe the accruals recorded in our consolidated financial statements properlyreflect loss exposures that are both probable and reasonably estimable. We do not believe any of the currently identifiedclaims or litigation may materially affect our results of operations, cash flows, or financial condition. However, litigationis subject to inherent uncertainties, and unfavorable rulings could occur. If an unfavorable ruling were to occur, it maycause a material adverse impact on the results of operations, cash flows, or financial condition for the period in whichthe ruling occurs, or future periods. Refer to Note 19 of the Financial Statements for further information on contingencies.
28
New Accounting Pronouncements
Refer to Note 2 and Note 22 of the Financial Statements for a description of new accounting pronouncements relatedto revenues and leases, respectively. We do not expect any other recently issued accounting pronouncements willhave a material effect on our financial statements.
Forward-Looking Statements
This report contains forward-looking statements, which are based on our current assumptions and expectations. Thesestatements are typically accompanied by the words "expect," "may," "could," "believe," "would," "might," "anticipates,"or words of similar import. The principal forward-looking statements in this report include: our financial performance,statements regarding the adequacy of and costs associated with our sources of liquidity, the expected impact of thePharmacy Transaction on our financial performance, the continued execution of our share repurchase program, ourexpected capital expenditures and new lease commitments, the impact of changes in the expected effective incometax rate on net income, the expected compliance with debt covenants, the expected impact of new accountingpronouncements, our intentions regarding future dividends, contributions and payments related to our pension plan,the expected returns on pension plan assets, the expected timing and recognition of compensation expenses, theeffects of macroeconomic conditions, the adequacy of our reserves for general liability, workers' compensation andproperty loss, the expected outcome of, and adequacy of our reserves for investigations, inquiries, claims and litigation,including those related to the 2013 data breach, expected changes to our contractual obligations and liabilities, theexpected ability to recognize deferred tax assets and liabilities and the timing of such recognition, the process, timingand effects of discontinuing our Canadian operations, the resolution of tax matters, changes in our assumptions andexpectations, and the expected benefits of restructuring activities.
All such forward-looking statements are intended to enjoy the protection of the safe harbor for forward-lookingstatements contained in the Private Securities Litigation Reform Act of 1995, as amended. Although we believe thereis a reasonable basis for the forward-looking statements, our actual results could be materially different. The mostimportant factors which could cause our actual results to differ from our forward-looking statements are set forth onour description of risk factors in Item 1A to this Form 10-K, which should be read in conjunction with the forward-lookingstatements in this report. Forward-looking statements speak only as of the date they are made, and we do not undertakeany obligation to update any forward-looking statement.
Item 7A. Quantitative and Qualitative Disclosures About Market Risk
At January 28, 2017, our exposure to market risk was primarily from interest rate changes on our debt obligations,some of which are at a LIBOR-plus floating-rate. Our interest rate exposure is primarily due to differences betweenour floating rate debt obligations compared to our floating rate short term investments. At January 28, 2017, our floatingrate debt exceeded our floating rate short-term investments by approximately $140 million. Based on our balancesheet position at January 28, 2017, the annualized effect of a 0.1 percentage point increase in floating interest rateson our floating rate debt obligations, net of our floating rate short-term investments, would not be significant. In general,we expect our floating rate debt to exceed our floating rate short-term investments over time, but that may vary indifferent interest rate environments. See further description of our debt and derivative instruments in Notes 20 and21 to the Financial Statements.
We record our general liability and workers' compensation liabilities at net present value; therefore, these liabilitiesfluctuate with changes in interest rates. Based on our balance sheet position at January 28, 2017, the annualizedeffect of a 0.5 percentage point decrease in interest rates would be to decrease earnings before income taxes by$7 million.
In addition, we are exposed to market return fluctuations on our qualified defined benefit pension plans. The value ofour pension liabilities is inversely related to changes in interest rates. A 0.5 percentage point decrease to the weightedaverage discount rate would increase annual expense by $30 million. To protect against declines in interest rates, wehold high-quality, long-duration bonds and interest rate swaps in our pension plan trust. At year-end, we had hedged55 percent of the interest rate exposure of our funded status.
As more fully described in Notes 15 and 27 to the Financial Statements, we are exposed to market returns onaccumulated team member balances in our nonqualified, unfunded deferred compensation plans. We control the riskof offering the nonqualified plans by making investments in life insurance contracts and prepaid forward contracts onour own common stock that offset a substantial portion of our economic exposure to the returns on these plans. Theannualized effect of a one percentage point change in market returns on our nonqualified defined contribution plans(inclusive of the effect of the investment vehicles used to manage our economic exposure) would not be significant.
There have been no other material changes in our primary risk exposures or management of market risks since theprior year.
29
Item 8. Financial Statements and Supplementary Data
Report of Management on the Consolidated Financial Statements
Management is responsible for the consistency, integrity, and presentation of the information in the Annual Report. The consolidatedfinancial statements and other information presented in this Annual Report have been prepared in accordance with accountingprinciples generally accepted in the United States and include necessary judgments and estimates by management.
To fulfill our responsibility, we maintain comprehensive systems of internal control designed to provide reasonable assurance thatassets are safeguarded and transactions are executed in accordance with established procedures. The concept of reasonableassurance is based upon recognition that the cost of the controls should not exceed the benefit derived. We believe our systemsof internal control provide this reasonable assurance.
The Board of Directors exercised its oversight role with respect to the Corporation's systems of internal control primarily throughits Audit Committee, which is comprised of independent directors. The Committee oversees the Corporation's systems of internalcontrol, accounting practices, financial reporting and audits to assess whether their quality, integrity, and objectivity are sufficientto protect shareholders' investments.
In addition, our consolidated financial statements have been audited by Ernst & Young LLP, independent registered public accountingfirm, whose report also appears on this page.
Brian C. CornellChairman and Chief Executive OfficerMarch 8, 2017
Cathy R. SmithExecutive Vice President andChief Financial Officer
Report of Independent Registered Public Accounting Firm on Consolidated Financial Statements
The Board of Directors and ShareholdersTarget Corporation
We have audited the accompanying consolidated statements of financial position of Target Corporation and subsidiaries (theCorporation) as of January 28, 2017 and January 30, 2016, and the related consolidated statements of operations, comprehensiveincome, cash flows, and shareholders' investment for each of the three years in the period ended January 28, 2017. These financialstatements are the responsibility of the Corporation's management. Our responsibility is to express an opinion on these financialstatements based on our audits.
We conducted our audits in accordance with the standards of the Public Company Accounting Oversight Board (United States).Those standards require that we plan and perform the audit to obtain reasonable assurance about whether the financial statementsare free of material misstatement. An audit includes examining, on a test basis, evidence supporting the amounts and disclosuresin the financial statements. An audit also includes assessing the accounting principles used and significant estimates made bymanagement, as well as evaluating the overall financial statement presentation. We believe that our audits provide a reasonablebasis for our opinion.
In our opinion, the financial statements referred to above present fairly, in all material respects, the consolidated financial positionof Target Corporation and subsidiaries at January 28, 2017 and January 30, 2016, and the consolidated results of their operationsand their cash flows for each of the three years in the period ended January 28, 2017, in conformity with U.S. generally acceptedaccounting principles.
We also have audited, in accordance with the standards of the Public Company Accounting Oversight Board (United States), theCorporation's internal control over financial reporting as of January 28, 2017, based on criteria established in Internal Control—Integrated Framework issued by the Committee of Sponsoring Organizations of the Treadway Commission (2013 Framework), andour report dated March 8, 2017, expressed an unqualified opinion thereon.
Minneapolis, MinnesotaMarch 8, 2017
30
Report of Management on Internal Control over Financial Reporting
Our management is responsible for establishing and maintaining adequate internal control over financial reporting, as such termis defined in Exchange Act Rules 13a-15(f). Under the supervision and with the participation of our management, including our chiefexecutive officer and chief financial officer, we assessed the effectiveness of our internal control over financial reporting as ofJanuary 28, 2017, based on the framework in Internal Control—Integrated Framework (2013), issued by the Committee ofSponsoring Organizations of the Treadway Commission (2013 framework). Based on our assessment, we conclude that theCorporation's internal control over financial reporting is effective based on those criteria.
Our internal control over financial reporting as of January 28, 2017, has been audited by Ernst & Young LLP, the independentregistered public accounting firm who has also audited our consolidated financial statements, as stated in their report which appearson this page.
Brian C. CornellChairman and Chief Executive OfficerMarch 8, 2017
Cathy R. SmithExecutive Vice President andChief Financial Officer
Report of Independent Registered Public Accounting Firm on Internal Control over Financial Reporting
The Board of Directors and ShareholdersTarget Corporation
We have audited Target Corporation and subsidiaries' (the Corporation) internal control over financial reporting as of January 28,2017, based on criteria established in Internal Control—Integrated Framework issued by the Committee of Sponsoring Organizationsof the Treadway Commission (2013 Framework) (the COSO criteria). The Corporation's management is responsible for maintainingeffective internal control over financial reporting, and for its assessment of the effectiveness of internal control over financial reportingincluded in the accompanying Report of Management on Internal Control over Financial Reporting. Our responsibility is to expressan opinion on the Corporation's internal control over financial reporting based on our audit.
We conducted our audit in accordance with the standards of the Public Company Accounting Oversight Board (United States).Those standards require that we plan and perform the audit to obtain reasonable assurance about whether effective internal controlover financial reporting was maintained in all material respects. Our audit included obtaining an understanding of internal controlover financial reporting, assessing the risk that a material weakness exists, testing and evaluating the design and operatingeffectiveness of internal control based on the assessed risk, and performing such other procedures as we considered necessaryin the circumstances. We believe that our audit provides a reasonable basis for our opinion.
A company's internal control over financial reporting is a process designed to provide reasonable assurance regarding the reliabilityof financial reporting and the preparation of financial statements for external purposes in accordance with generally acceptedaccounting principles. A company's internal control over financial reporting includes those policies and procedures that (1) pertainto the maintenance of records that, in reasonable detail, accurately and fairly reflect the transactions and dispositions of the assetsof the company; (2) provide reasonable assurance that transactions are recorded as necessary to permit preparation of financialstatements in accordance with generally accepted accounting principles, and that receipts and expenditures of the company arebeing made only in accordance with authorizations of management and directors of the company; and (3) provide reasonableassurance regarding prevention or timely detection of unauthorized acquisition, use or disposition of the company's assets thatcould have a material effect on the financial statements.
Because of its inherent limitations, internal control over financial reporting may not prevent or detect misstatements. Also, projectionsof any evaluation of effectiveness to future periods are subject to the risk that controls may become inadequate because of changesin conditions or that the degree of compliance with the policies or procedures may deteriorate.
In our opinion, the Corporation maintained, in all material respects, effective internal control over financial reporting as of January 28,2017, based on the COSO criteria.
We also have audited, in accordance with the standards of the Public Company Accounting Oversight Board (United States), theconsolidated statements of financial position of Target Corporation and subsidiaries as of January 28, 2017 and January 30, 2016,and the related consolidated statements of operations, comprehensive income, cash flows and shareholders' investment for eachof the three years in the period ended January 28, 2017, and our report dated March 8, 2017, expressed an unqualified opinionthereon.
Minneapolis, MinnesotaMarch 8, 2017
31
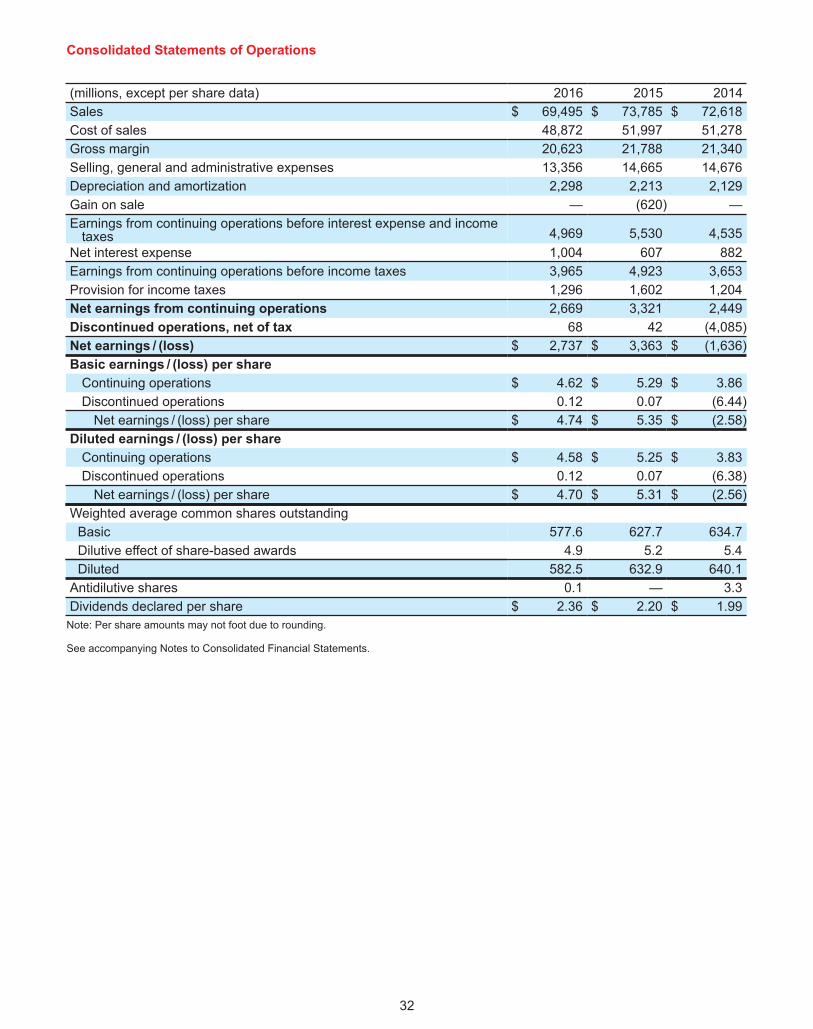
Consolidated Statements of Operations
(millions, except per share data) 2016 2015 2014Sales $ 69,495 $ 73,785 $ 72,618Cost of sales 48,872 51,997 51,278Gross margin 20,623 21,788 21,340Selling, general and administrative expenses 13,356 14,665 14,676Depreciation and amortization 2,298 2,213 2,129Gain on sale — (620) —Earnings from continuing operations before interest expense and income
taxes 4,969 5,530 4,535Net interest expense 1,004 607 882Earnings from continuing operations before income taxes 3,965 4,923 3,653Provision for income taxes 1,296 1,602 1,204Net earnings from continuing operations 2,669 3,321 2,449Discontinued operations, net of tax 68 42 (4,085)Net earnings / (loss) $ 2,737 $ 3,363 $ (1,636)Basic earnings / (loss) per share
Continuing operations $ 4.62 $ 5.29 $ 3.86Discontinued operations 0.12 0.07 (6.44)
Net earnings / (loss) per share $ 4.74 $ 5.35 $ (2.58)Diluted earnings / (loss) per share
Continuing operations $ 4.58 $ 5.25 $ 3.83Discontinued operations 0.12 0.07 (6.38)
Net earnings / (loss) per share $ 4.70 $ 5.31 $ (2.56)Weighted average common shares outstanding
Basic 577.6 627.7 634.7Dilutive effect of share-based awards 4.9 5.2 5.4Diluted 582.5 632.9 640.1
Antidilutive shares 0.1 — 3.3Dividends declared per share $ 2.36 $ 2.20 $ 1.99
Note: Per share amounts may not foot due to rounding.
See accompanying Notes to Consolidated Financial Statements.
32
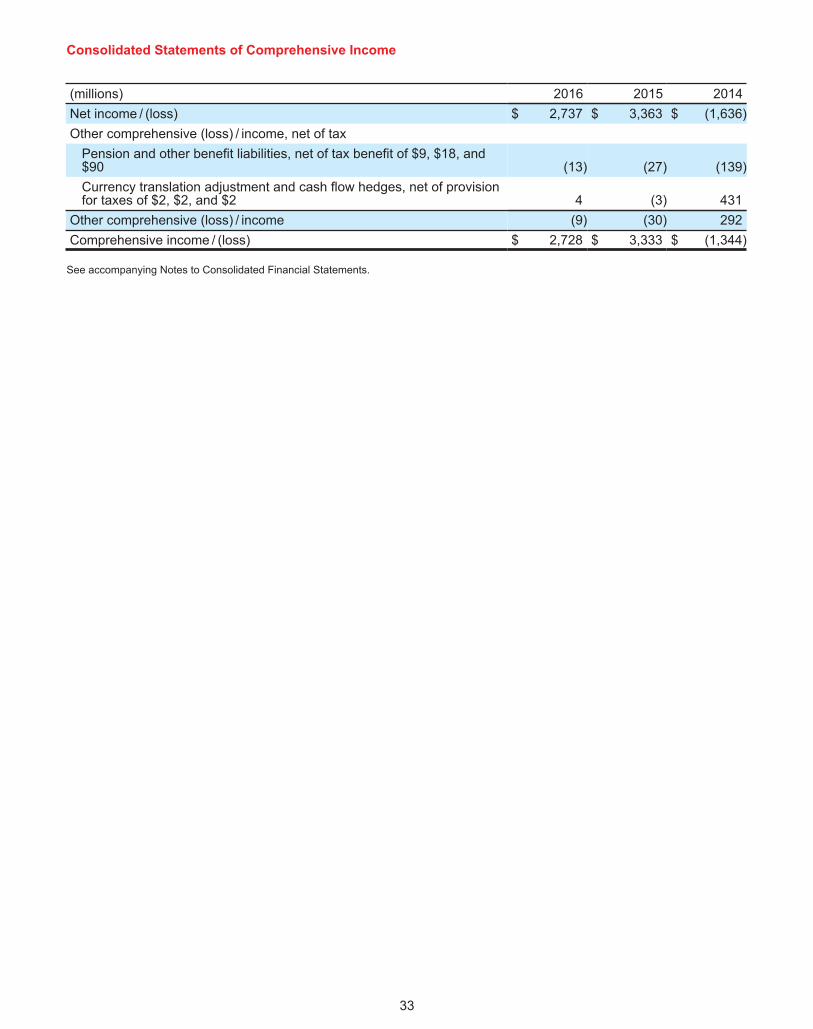
Consolidated Statements of Comprehensive Income
(millions) 2016 2015 2014Net income / (loss) $ 2,737 $ 3,363 $ (1,636)Other comprehensive (loss) / income, net of tax
Pension and other benefit liabilities, net of tax benefit of $9, $18, and$90 (13) (27) (139)Currency translation adjustment and cash flow hedges, net of provisionfor taxes of $2, $2, and $2 4 (3) 431
Other comprehensive (loss) / income (9) (30) 292Comprehensive income / (loss) $ 2,728 $ 3,333 $ (1,344)
See accompanying Notes to Consolidated Financial Statements.
33
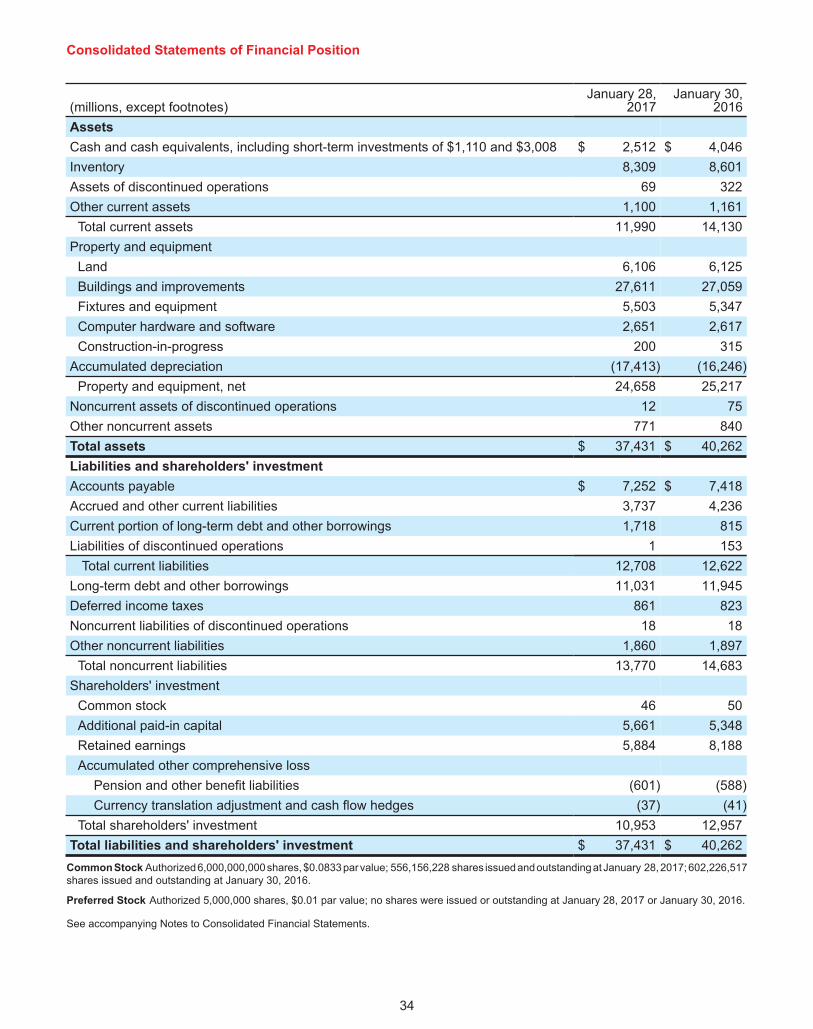
Consolidated Statements of Financial Position
(millions, except footnotes)January 28,
2017January 30,
2016AssetsCash and cash equivalents, including short-term investments of $1,110 and $3,008 $ 2,512 $ 4,046Inventory 8,309 8,601Assets of discontinued operations 69 322Other current assets 1,100 1,161
Total current assets 11,990 14,130Property and equipment
Land 6,106 6,125Buildings and improvements 27,611 27,059Fixtures and equipment 5,503 5,347Computer hardware and software 2,651 2,617Construction-in-progress 200 315
Accumulated depreciation (17,413) (16,246)Property and equipment, net 24,658 25,217
Noncurrent assets of discontinued operations 12 75Other noncurrent assets 771 840Total assets $ 37,431 $ 40,262Liabilities and shareholders' investmentAccounts payable $ 7,252 $ 7,418Accrued and other current liabilities 3,737 4,236Current portion of long-term debt and other borrowings 1,718 815Liabilities of discontinued operations 1 153
Total current liabilities 12,708 12,622Long-term debt and other borrowings 11,031 11,945Deferred income taxes 861 823Noncurrent liabilities of discontinued operations 18 18Other noncurrent liabilities 1,860 1,897
Total noncurrent liabilities 13,770 14,683Shareholders' investment
Common stock 46 50Additional paid-in capital 5,661 5,348Retained earnings 5,884 8,188Accumulated other comprehensive loss
Pension and other benefit liabilities (601) (588)Currency translation adjustment and cash flow hedges (37) (41)
Total shareholders' investment 10,953 12,957Total liabilities and shareholders' investment $ 37,431 $ 40,262
Common Stock Authorized 6,000,000,000 shares, $0.0833 par value; 556,156,228 shares issued and outstanding at January 28, 2017; 602,226,517shares issued and outstanding at January 30, 2016.
Preferred Stock Authorized 5,000,000 shares, $0.01 par value; no shares were issued or outstanding at January 28, 2017 or January 30, 2016.
See accompanying Notes to Consolidated Financial Statements.
34
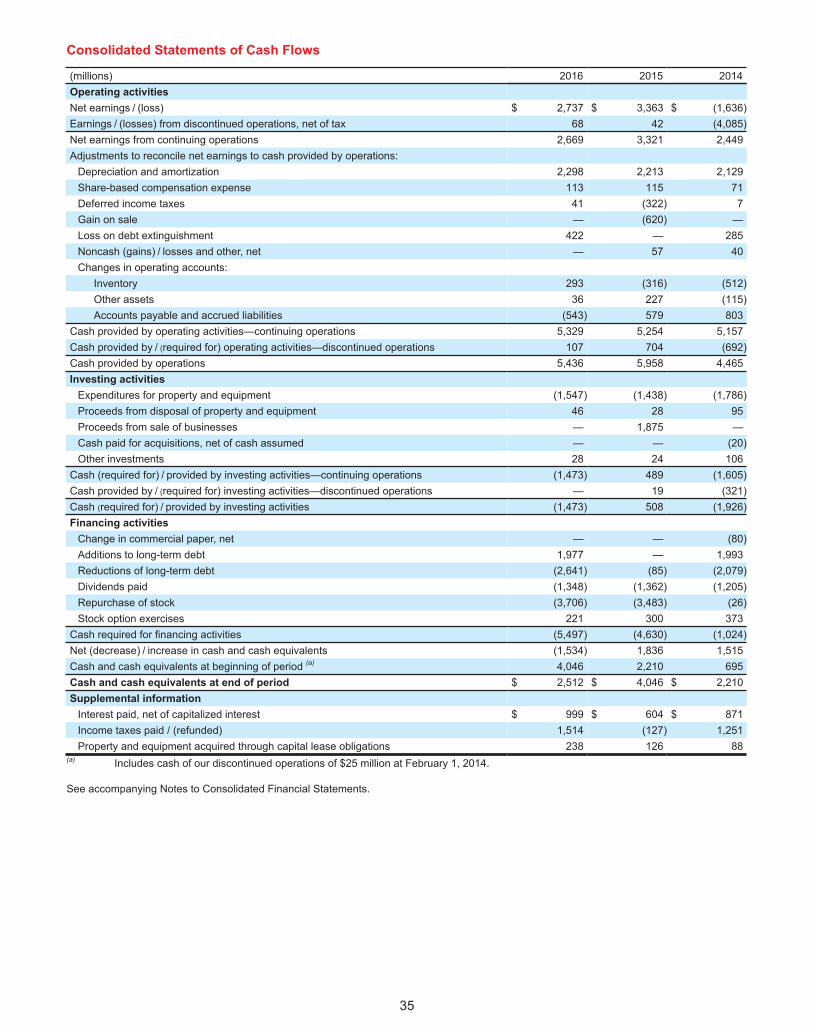
Consolidated Statements of Cash Flows
(millions) 2016 2015 2014Operating activitiesNet earnings / (loss) $ 2,737 $ 3,363 $ (1,636)Earnings / (losses) from discontinued operations, net of tax 68 42 (4,085)Net earnings from continuing operations 2,669 3,321 2,449Adjustments to reconcile net earnings to cash provided by operations:
Depreciation and amortization 2,298 2,213 2,129Share-based compensation expense 113 115 71Deferred income taxes 41 (322) 7Gain on sale — (620) —Loss on debt extinguishment 422 — 285Noncash (gains) / losses and other, net — 57 40Changes in operating accounts:
Inventory 293 (316) (512)Other assets 36 227 (115)Accounts payable and accrued liabilities (543) 579 803
Cash provided by operating activities—continuing operations 5,329 5,254 5,157Cash provided by / (required for) operating activities—discontinued operations 107 704 (692)Cash provided by operations 5,436 5,958 4,465Investing activities
Expenditures for property and equipment (1,547) (1,438) (1,786)Proceeds from disposal of property and equipment 46 28 95Proceeds from sale of businesses — 1,875 —Cash paid for acquisitions, net of cash assumed — — (20)Other investments 28 24 106
Cash (required for) / provided by investing activities—continuing operations (1,473) 489 (1,605)Cash provided by / (required for) investing activities—discontinued operations — 19 (321)Cash (required for) / provided by investing activities (1,473) 508 (1,926)Financing activities
Change in commercial paper, net — — (80)Additions to long-term debt 1,977 — 1,993Reductions of long-term debt (2,641) (85) (2,079)Dividends paid (1,348) (1,362) (1,205)Repurchase of stock (3,706) (3,483) (26)Stock option exercises 221 300 373
Cash required for financing activities (5,497) (4,630) (1,024)Net (decrease) / increase in cash and cash equivalents (1,534) 1,836 1,515Cash and cash equivalents at beginning of period (a) 4,046 2,210 695Cash and cash equivalents at end of period $ 2,512 $ 4,046 $ 2,210Supplemental information
Interest paid, net of capitalized interest $ 999 $ 604 $ 871Income taxes paid / (refunded) 1,514 (127) 1,251Property and equipment acquired through capital lease obligations 238 126 88
(a) Includes cash of our discontinued operations of $25 million at February 1, 2014.
See accompanying Notes to Consolidated Financial Statements.
35
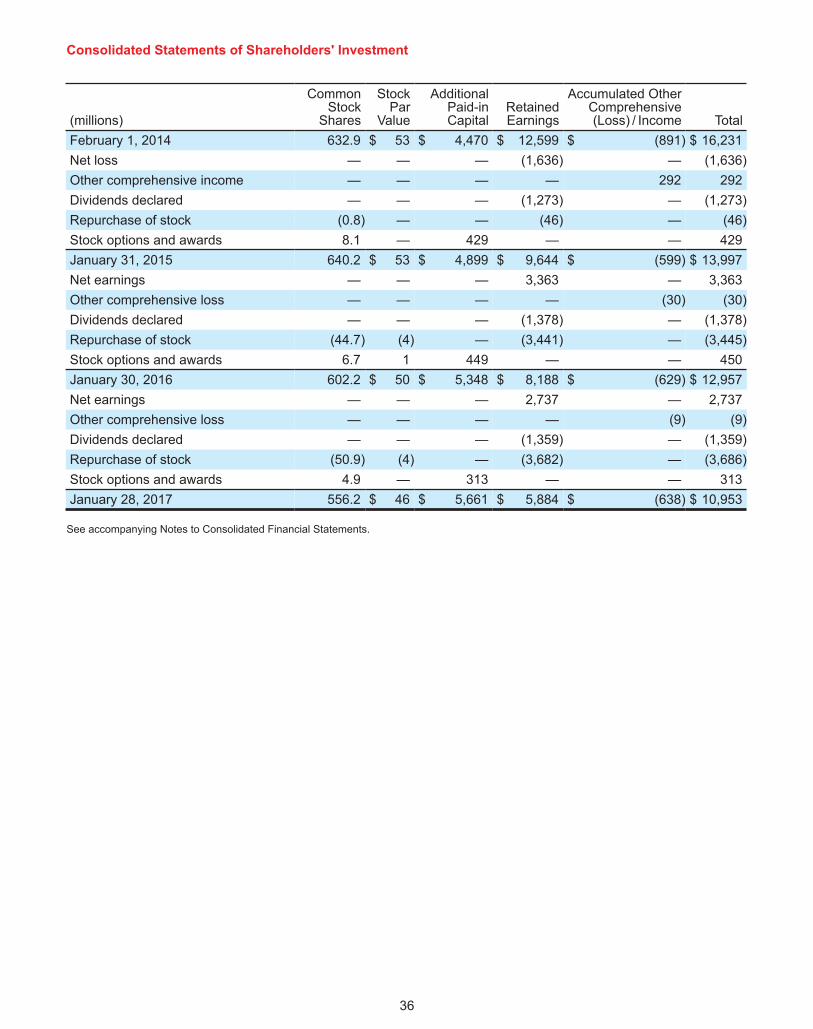
Consolidated Statements of Shareholders' Investment
(millions)
CommonStock
Shares
StockPar
Value
AdditionalPaid-inCapital
RetainedEarnings
Accumulated OtherComprehensive(Loss) / Income Total
February 1, 2014 632.9 $ 53 $ 4,470 $ 12,599 $ (891) $ 16,231Net loss — — — (1,636) — (1,636)Other comprehensive income — — — — 292 292Dividends declared — — — (1,273) — (1,273)Repurchase of stock (0.8) — — (46) — (46)Stock options and awards 8.1 — 429 — — 429January 31, 2015 640.2 $ 53 $ 4,899 $ 9,644 $ (599) $ 13,997Net earnings — — — 3,363 — 3,363Other comprehensive loss — — — — (30) (30)Dividends declared — — — (1,378) — (1,378)Repurchase of stock (44.7) (4) — (3,441) — (3,445)Stock options and awards 6.7 1 449 — — 450January 30, 2016 602.2 $ 50 $ 5,348 $ 8,188 $ (629) $ 12,957Net earnings — — — 2,737 — 2,737Other comprehensive loss — — — — (9) (9)Dividends declared — — — (1,359) — (1,359)Repurchase of stock (50.9) (4) — (3,682) — (3,686)Stock options and awards 4.9 — 313 — — 313January 28, 2017 556.2 $ 46 $ 5,661 $ 5,884 $ (638) $ 10,953
See accompanying Notes to Consolidated Financial Statements.
36
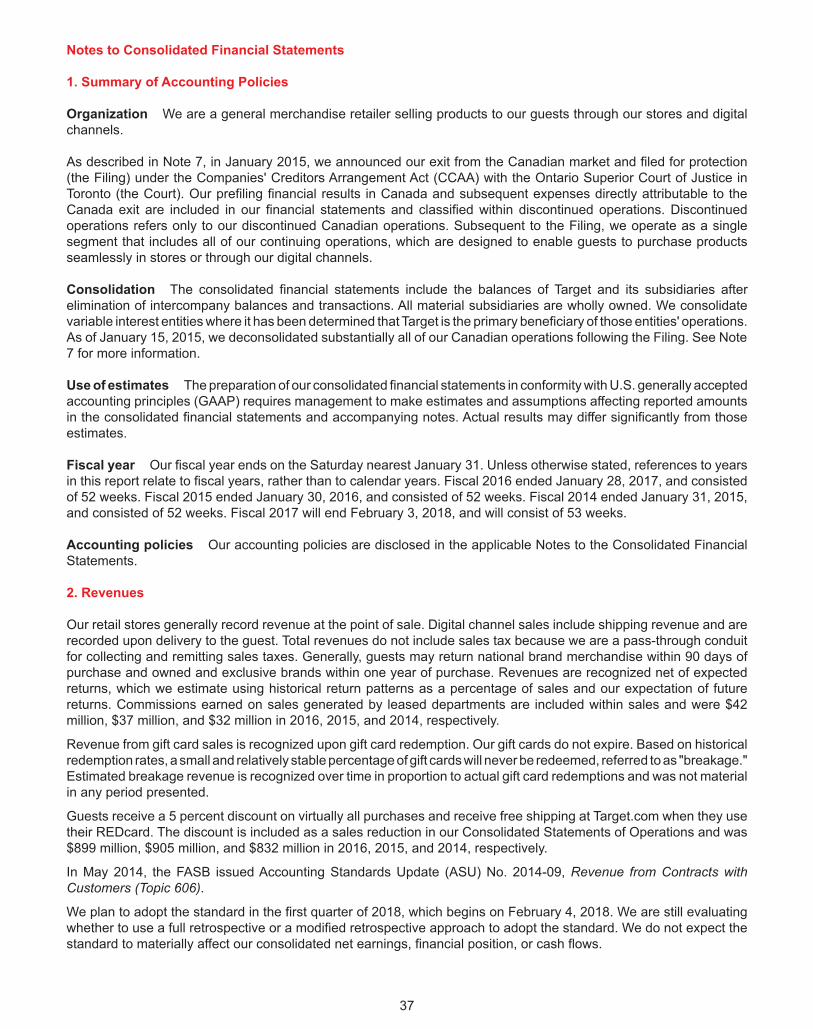
Notes to Consolidated Financial Statements
37
1. Summary of Accounting Policies
Organization We are a general merchandise retailer selling products to our guests through our stores and digitalchannels.
As described in Note 7, in January 2015, we announced our exit from the Canadian market and filed for protection(the Filing) under the Companies' Creditors Arrangement Act (CCAA) with the Ontario Superior Court of Justice inToronto (the Court). Our prefiling financial results in Canada and subsequent expenses directly attributable to theCanada exit are included in our financial statements and classified within discontinued operations. Discontinuedoperations refers only to our discontinued Canadian operations. Subsequent to the Filing, we operate as a singlesegment that includes all of our continuing operations, which are designed to enable guests to purchase productsseamlessly in stores or through our digital channels.
Consolidation The consolidated financial statements include the balances of Target and its subsidiaries afterelimination of intercompany balances and transactions. All material subsidiaries are wholly owned. We consolidatevariable interest entities where it has been determined that Target is the primary beneficiary of those entities' operations.As of January 15, 2015, we deconsolidated substantially all of our Canadian operations following the Filing. See Note7 for more information.
Use of estimates The preparation of our consolidated financial statements in conformity with U.S. generally acceptedaccounting principles (GAAP) requires management to make estimates and assumptions affecting reported amountsin the consolidated financial statements and accompanying notes. Actual results may differ significantly from thoseestimates.
Fiscal year Our fiscal year ends on the Saturday nearest January 31. Unless otherwise stated, references to yearsin this report relate to fiscal years, rather than to calendar years. Fiscal 2016 ended January 28, 2017, and consistedof 52 weeks. Fiscal 2015 ended January 30, 2016, and consisted of 52 weeks. Fiscal 2014 ended January 31, 2015,and consisted of 52 weeks. Fiscal 2017 will end February 3, 2018, and will consist of 53 weeks.
Accounting policies Our accounting policies are disclosed in the applicable Notes to the Consolidated FinancialStatements.
2. Revenues
Our retail stores generally record revenue at the point of sale. Digital channel sales include shipping revenue and arerecorded upon delivery to the guest. Total revenues do not include sales tax because we are a pass-through conduitfor collecting and remitting sales taxes. Generally, guests may return national brand merchandise within 90 days ofpurchase and owned and exclusive brands within one year of purchase. Revenues are recognized net of expectedreturns, which we estimate using historical return patterns as a percentage of sales and our expectation of futurereturns. Commissions earned on sales generated by leased departments are included within sales and were $42million, $37 million, and $32 million in 2016, 2015, and 2014, respectively.
Revenue from gift card sales is recognized upon gift card redemption. Our gift cards do not expire. Based on historicalredemption rates, a small and relatively stable percentage of gift cards will never be redeemed, referred to as "breakage."Estimated breakage revenue is recognized over time in proportion to actual gift card redemptions and was not materialin any period presented.
Guests receive a 5 percent discount on virtually all purchases and receive free shipping at Target.com when they usetheir REDcard. The discount is included as a sales reduction in our Consolidated Statements of Operations and was$899 million, $905 million, and $832 million in 2016, 2015, and 2014, respectively.
In May 2014, the FASB issued Accounting Standards Update (ASU) No. 2014-09, Revenue from Contracts withCustomers (Topic 606).
We plan to adopt the standard in the first quarter of 2018, which begins on February 4, 2018. We are still evaluatingwhether to use a full retrospective or a modified retrospective approach to adopt the standard. We do not expect thestandard to materially affect our consolidated net earnings, financial position, or cash flows.
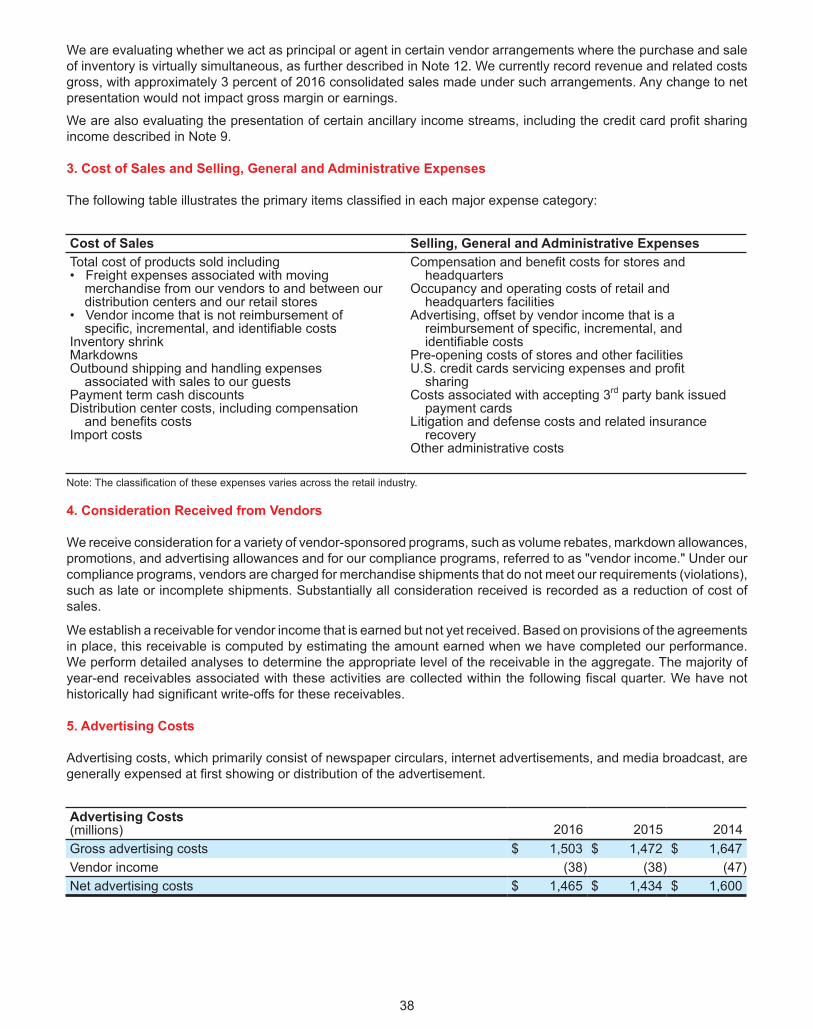
We are evaluating whether we act as principal or agent in certain vendor arrangements where the purchase and saleof inventory is virtually simultaneous, as further described in Note 12. We currently record revenue and related costsgross, with approximately 3 percent of 2016 consolidated sales made under such arrangements. Any change to netpresentation would not impact gross margin or earnings.
We are also evaluating the presentation of certain ancillary income streams, including the credit card profit sharingincome described in Note 9.
38
3. Cost of Sales and Selling, General and Administrative Expenses
The following table illustrates the primary items classified in each major expense category:
Cost of Sales Selling, General and Administrative ExpensesTotal cost of products sold including• Freight expenses associated with moving merchandise from our vendors to and between our distribution centers and our retail stores• Vendor income that is not reimbursement of specific, incremental, and identifiable costsInventory shrinkMarkdownsOutbound shipping and handling expenses associated with sales to our guestsPayment term cash discountsDistribution center costs, including compensation and benefits costsImport costs
Compensation and benefit costs for stores and headquartersOccupancy and operating costs of retail and headquarters facilitiesAdvertising, offset by vendor income that is a reimbursement of specific, incremental, and identifiable costsPre-opening costs of stores and other facilitiesU.S. credit cards servicing expenses and profit sharingCosts associated with accepting 3rd party bank issued payment cardsLitigation and defense costs and related insurance recoveryOther administrative costs
Note: The classification of these expenses varies across the retail industry.
4. Consideration Received from Vendors
We receive consideration for a variety of vendor-sponsored programs, such as volume rebates, markdown allowances,promotions, and advertising allowances and for our compliance programs, referred to as "vendor income." Under ourcompliance programs, vendors are charged for merchandise shipments that do not meet our requirements (violations),such as late or incomplete shipments. Substantially all consideration received is recorded as a reduction of cost ofsales.
We establish a receivable for vendor income that is earned but not yet received. Based on provisions of the agreementsin place, this receivable is computed by estimating the amount earned when we have completed our performance.We perform detailed analyses to determine the appropriate level of the receivable in the aggregate. The majority ofyear-end receivables associated with these activities are collected within the following fiscal quarter. We have nothistorically had significant write-offs for these receivables.
5. Advertising Costs
Advertising costs, which primarily consist of newspaper circulars, internet advertisements, and media broadcast, aregenerally expensed at first showing or distribution of the advertisement.
Advertising Costs (millions) 2016 2015 2014Gross advertising costs $ 1,503 $ 1,472 $ 1,647Vendor income (38) (38) (47)Net advertising costs $ 1,465 $ 1,434 $ 1,600
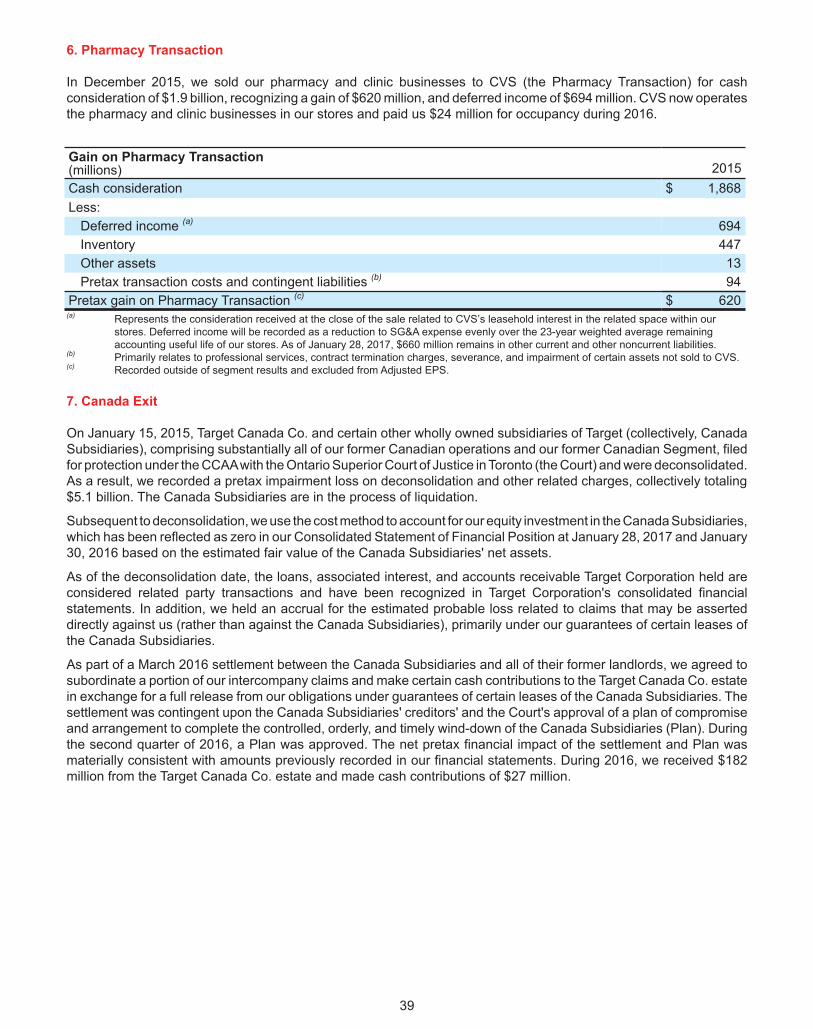
6. Pharmacy Transaction
In December 2015, we sold our pharmacy and clinic businesses to CVS (the Pharmacy Transaction) for cashconsideration of $1.9 billion, recognizing a gain of $620 million, and deferred income of $694 million. CVS now operatesthe pharmacy and clinic businesses in our stores and paid us $24 million for occupancy during 2016.
Gain on Pharmacy Transaction(millions) 2015Cash consideration $ 1,868Less:
Deferred income (a) 694Inventory 447Other assets 13Pretax transaction costs and contingent liabilities (b) 94
Pretax gain on Pharmacy Transaction (c) $ 620(a) Represents the consideration received at the close of the sale related to CVS’s leasehold interest in the related space within our
stores. Deferred income will be recorded as a reduction to SG&A expense evenly over the 23-year weighted average remainingaccounting useful life of our stores. As of January 28, 2017, $660 million remains in other current and other noncurrent liabilities.
(b) Primarily relates to professional services, contract termination charges, severance, and impairment of certain assets not sold to CVS.(c) Recorded outside of segment results and excluded from Adjusted EPS.
39
7. Canada Exit
On January 15, 2015, Target Canada Co. and certain other wholly owned subsidiaries of Target (collectively, CanadaSubsidiaries), comprising substantially all of our former Canadian operations and our former Canadian Segment, filedfor protection under the CCAA with the Ontario Superior Court of Justice in Toronto (the Court) and were deconsolidated.As a result, we recorded a pretax impairment loss on deconsolidation and other related charges, collectively totaling$5.1 billion. The Canada Subsidiaries are in the process of liquidation.
Subsequent to deconsolidation, we use the cost method to account for our equity investment in the Canada Subsidiaries,which has been reflected as zero in our Consolidated Statement of Financial Position at January 28, 2017 and January30, 2016 based on the estimated fair value of the Canada Subsidiaries' net assets.
As of the deconsolidation date, the loans, associated interest, and accounts receivable Target Corporation held areconsidered related party transactions and have been recognized in Target Corporation's consolidated financialstatements. In addition, we held an accrual for the estimated probable loss related to claims that may be asserteddirectly against us (rather than against the Canada Subsidiaries), primarily under our guarantees of certain leases ofthe Canada Subsidiaries.
As part of a March 2016 settlement between the Canada Subsidiaries and all of their former landlords, we agreed tosubordinate a portion of our intercompany claims and make certain cash contributions to the Target Canada Co. estatein exchange for a full release from our obligations under guarantees of certain leases of the Canada Subsidiaries. Thesettlement was contingent upon the Canada Subsidiaries' creditors' and the Court's approval of a plan of compromiseand arrangement to complete the controlled, orderly, and timely wind-down of the Canada Subsidiaries (Plan). Duringthe second quarter of 2016, a Plan was approved. The net pretax financial impact of the settlement and Plan wasmaterially consistent with amounts previously recorded in our financial statements. During 2016, we received $182million from the Target Canada Co. estate and made cash contributions of $27 million.
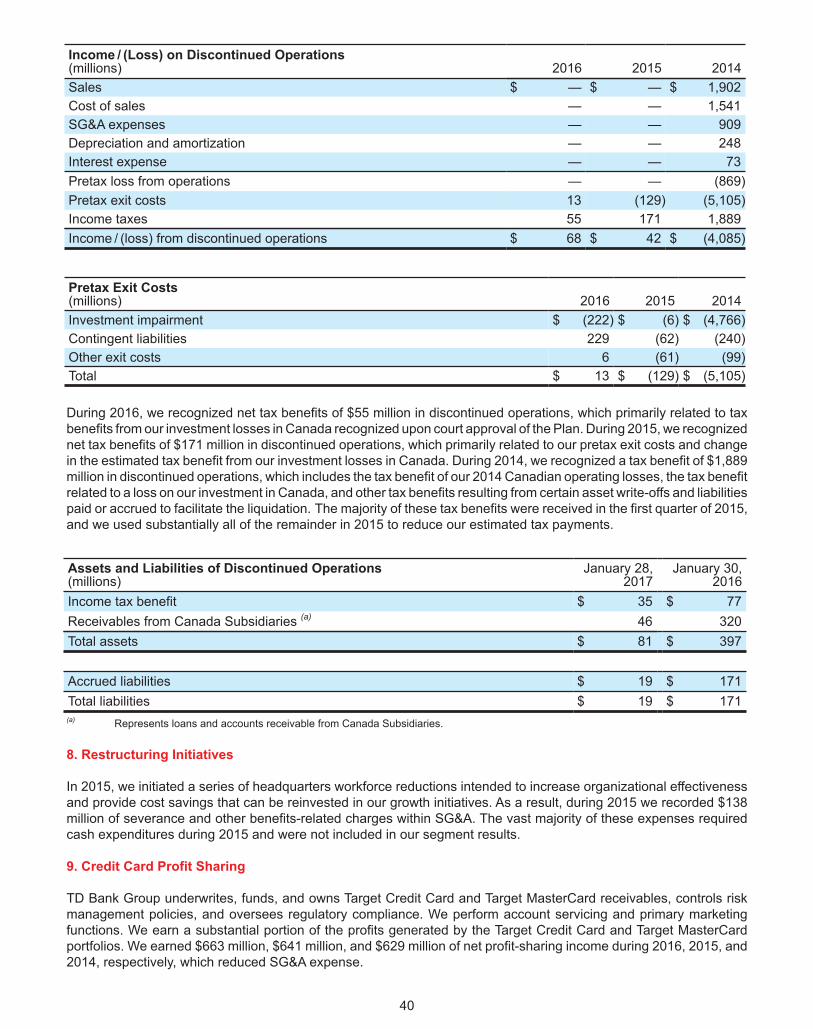
Income / (Loss) on Discontinued Operations(millions) 2016 2015 2014Sales $ — $ — $ 1,902Cost of sales — — 1,541SG&A expenses — — 909Depreciation and amortization — — 248Interest expense — — 73Pretax loss from operations — — (869)Pretax exit costs 13 (129) (5,105)Income taxes 55 171 1,889Income / (loss) from discontinued operations $ 68 $ 42 $ (4,085)
Pretax Exit Costs(millions) 2016 2015 2014Investment impairment $ (222) $ (6) $ (4,766)Contingent liabilities 229 (62) (240)Other exit costs 6 (61) (99)Total $ 13 $ (129) $ (5,105)
During 2016, we recognized net tax benefits of $55 million in discontinued operations, which primarily related to taxbenefits from our investment losses in Canada recognized upon court approval of the Plan. During 2015, we recognizednet tax benefits of $171 million in discontinued operations, which primarily related to our pretax exit costs and changein the estimated tax benefit from our investment losses in Canada. During 2014, we recognized a tax benefit of $1,889million in discontinued operations, which includes the tax benefit of our 2014 Canadian operating losses, the tax benefitrelated to a loss on our investment in Canada, and other tax benefits resulting from certain asset write-offs and liabilitiespaid or accrued to facilitate the liquidation. The majority of these tax benefits were received in the first quarter of 2015,and we used substantially all of the remainder in 2015 to reduce our estimated tax payments.
Assets and Liabilities of Discontinued Operations(millions)
January 28, 2017
January 30, 2016
Income tax benefit $ 35 $ 77Receivables from Canada Subsidiaries (a) 46 320Total assets $ 81 $ 397
Accrued liabilities $ 19 $ 171Total liabilities $ 19 $ 171(a) Represents loans and accounts receivable from Canada Subsidiaries.
40
8. Restructuring Initiatives
In 2015, we initiated a series of headquarters workforce reductions intended to increase organizational effectivenessand provide cost savings that can be reinvested in our growth initiatives. As a result, during 2015 we recorded $138million of severance and other benefits-related charges within SG&A. The vast majority of these expenses requiredcash expenditures during 2015 and were not included in our segment results.
9. Credit Card Profit Sharing
TD Bank Group underwrites, funds, and owns Target Credit Card and Target MasterCard receivables, controls riskmanagement policies, and oversees regulatory compliance. We perform account servicing and primary marketingfunctions. We earn a substantial portion of the profits generated by the Target Credit Card and Target MasterCardportfolios. We earned $663 million, $641 million, and $629 million of net profit-sharing income during 2016, 2015, and2014, respectively, which reduced SG&A expense.
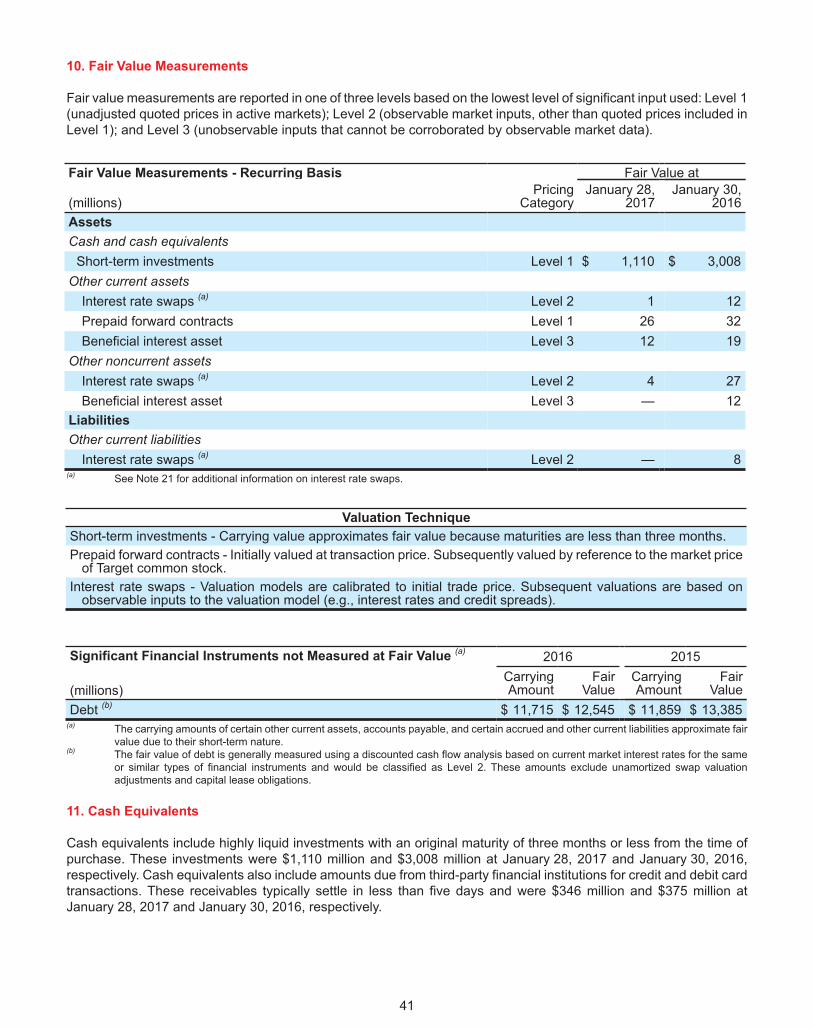
41
10. Fair Value Measurements
Fair value measurements are reported in one of three levels based on the lowest level of significant input used: Level 1(unadjusted quoted prices in active markets); Level 2 (observable market inputs, other than quoted prices included inLevel 1); and Level 3 (unobservable inputs that cannot be corroborated by observable market data).
Fair Value Measurements - Recurring Basis Fair Value at
(millions)Pricing
CategoryJanuary 28,
2017January 30,
2016AssetsCash and cash equivalents
Short-term investments Level 1 $ 1,110 $ 3,008Other current assets
Interest rate swaps (a) Level 2 1 12Prepaid forward contracts Level 1 26 32Beneficial interest asset Level 3 12 19
Other noncurrent assetsInterest rate swaps (a) Level 2 4 27Beneficial interest asset Level 3 — 12
LiabilitiesOther current liabilities
Interest rate swaps (a) Level 2 — 8(a) See Note 21 for additional information on interest rate swaps.
Valuation TechniqueShort-term investments - Carrying value approximates fair value because maturities are less than three months.Prepaid forward contracts - Initially valued at transaction price. Subsequently valued by reference to the market price
of Target common stock.Interest rate swaps - Valuation models are calibrated to initial trade price. Subsequent valuations are based on
observable inputs to the valuation model (e.g., interest rates and credit spreads).
Significant Financial Instruments not Measured at Fair Value (a)
(millions)
2016 2015CarryingAmount
FairValue
CarryingAmount
FairValue
Debt (b) $ 11,715 $ 12,545 $ 11,859 $ 13,385(a) The carrying amounts of certain other current assets, accounts payable, and certain accrued and other current liabilities approximate fair
value due to their short-term nature.(b) The fair value of debt is generally measured using a discounted cash flow analysis based on current market interest rates for the same
or similar types of financial instruments and would be classified as Level 2. These amounts exclude unamortized swap valuationadjustments and capital lease obligations.
11. Cash Equivalents
Cash equivalents include highly liquid investments with an original maturity of three months or less from the time ofpurchase. These investments were $1,110 million and $3,008 million at January 28, 2017 and January 30, 2016,respectively. Cash equivalents also include amounts due from third-party financial institutions for credit and debit cardtransactions. These receivables typically settle in less than five days and were $346 million and $375 million atJanuary 28, 2017 and January 30, 2016, respectively.
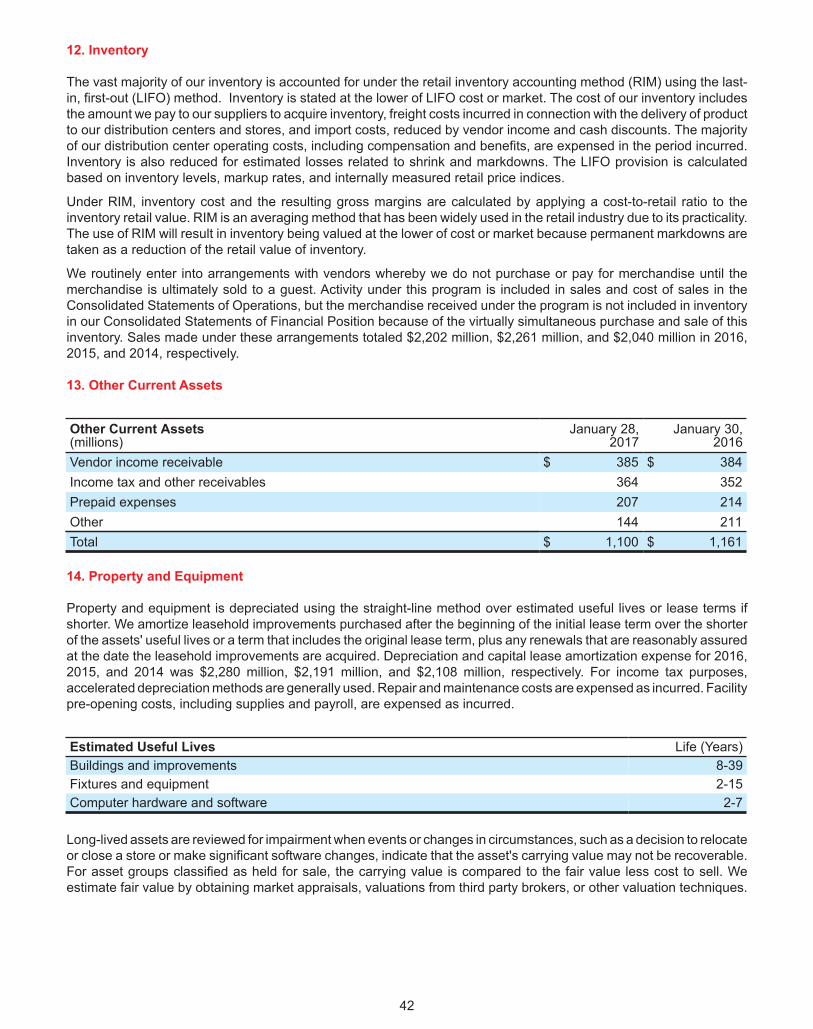
12. Inventory
The vast majority of our inventory is accounted for under the retail inventory accounting method (RIM) using the last-in, first-out (LIFO) method. Inventory is stated at the lower of LIFO cost or market. The cost of our inventory includesthe amount we pay to our suppliers to acquire inventory, freight costs incurred in connection with the delivery of productto our distribution centers and stores, and import costs, reduced by vendor income and cash discounts. The majorityof our distribution center operating costs, including compensation and benefits, are expensed in the period incurred.Inventory is also reduced for estimated losses related to shrink and markdowns. The LIFO provision is calculatedbased on inventory levels, markup rates, and internally measured retail price indices.
Under RIM, inventory cost and the resulting gross margins are calculated by applying a cost-to-retail ratio to theinventory retail value. RIM is an averaging method that has been widely used in the retail industry due to its practicality.The use of RIM will result in inventory being valued at the lower of cost or market because permanent markdowns aretaken as a reduction of the retail value of inventory.
We routinely enter into arrangements with vendors whereby we do not purchase or pay for merchandise until themerchandise is ultimately sold to a guest. Activity under this program is included in sales and cost of sales in theConsolidated Statements of Operations, but the merchandise received under the program is not included in inventoryin our Consolidated Statements of Financial Position because of the virtually simultaneous purchase and sale of thisinventory. Sales made under these arrangements totaled $2,202 million, $2,261 million, and $2,040 million in 2016,2015, and 2014, respectively.
42
13. Other Current Assets
Other Current Assets(millions)
January 28, 2017
January 30, 2016
Vendor income receivable $ 385 $ 384Income tax and other receivables 364 352Prepaid expenses 207 214Other 144 211Total $ 1,100 $ 1,161
14. Property and Equipment
Property and equipment is depreciated using the straight-line method over estimated useful lives or lease terms ifshorter. We amortize leasehold improvements purchased after the beginning of the initial lease term over the shorterof the assets' useful lives or a term that includes the original lease term, plus any renewals that are reasonably assuredat the date the leasehold improvements are acquired. Depreciation and capital lease amortization expense for 2016,2015, and 2014 was $2,280 million, $2,191 million, and $2,108 million, respectively. For income tax purposes,accelerated depreciation methods are generally used. Repair and maintenance costs are expensed as incurred. Facilitypre-opening costs, including supplies and payroll, are expensed as incurred.
Estimated Useful Lives Life (Years)Buildings and improvements 8-39Fixtures and equipment 2-15Computer hardware and software 2-7
Long-lived assets are reviewed for impairment when events or changes in circumstances, such as a decision to relocateor close a store or make significant software changes, indicate that the asset's carrying value may not be recoverable.For asset groups classified as held for sale, the carrying value is compared to the fair value less cost to sell. Weestimate fair value by obtaining market appraisals, valuations from third party brokers, or other valuation techniques.
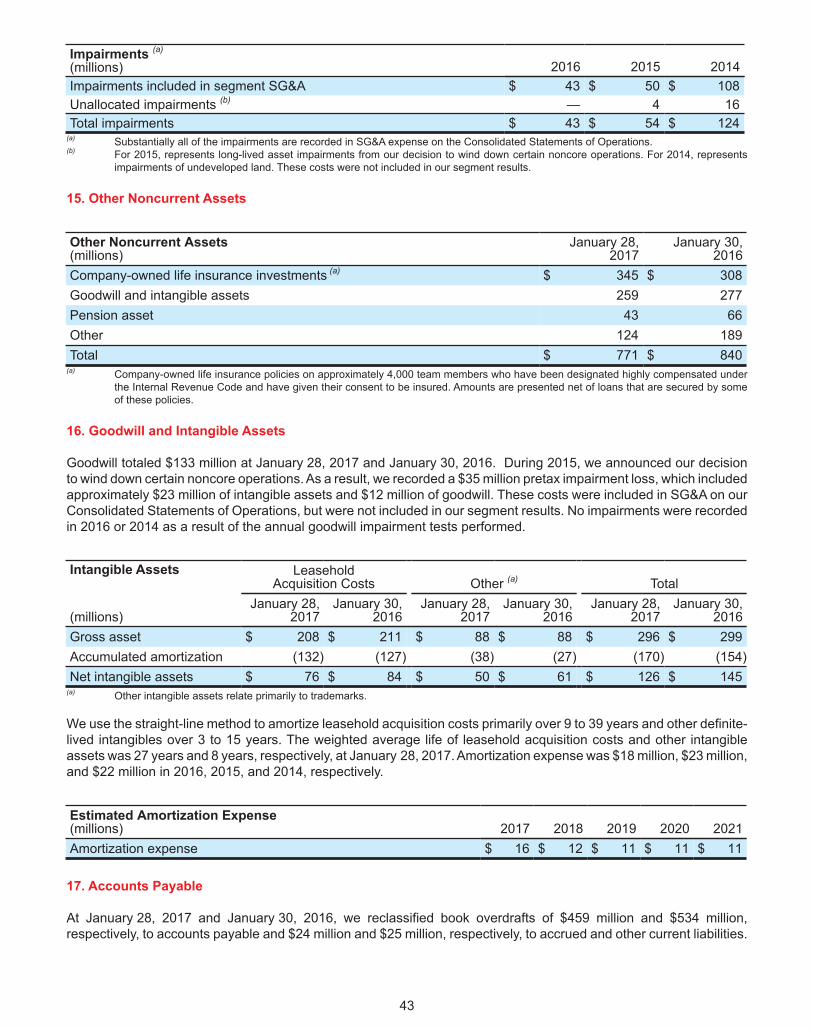
Impairments (a)
(millions) 2016 2015 2014Impairments included in segment SG&A $ 43 $ 50 $ 108Unallocated impairments (b) — 4 16Total impairments $ 43 $ 54 $ 124
(a) Substantially all of the impairments are recorded in SG&A expense on the Consolidated Statements of Operations.(b) For 2015, represents long-lived asset impairments from our decision to wind down certain noncore operations. For 2014, represents
impairments of undeveloped land. These costs were not included in our segment results.
43
15. Other Noncurrent Assets
Other Noncurrent Assets(millions)
January 28, 2017
January 30, 2016
Company-owned life insurance investments (a) $ 345 $ 308Goodwill and intangible assets 259 277Pension asset 43 66Other 124 189Total $ 771 $ 840
(a) Company-owned life insurance policies on approximately 4,000 team members who have been designated highly compensated underthe Internal Revenue Code and have given their consent to be insured. Amounts are presented net of loans that are secured by someof these policies.
16. Goodwill and Intangible Assets
Goodwill totaled $133 million at January 28, 2017 and January 30, 2016. During 2015, we announced our decisionto wind down certain noncore operations. As a result, we recorded a $35 million pretax impairment loss, which includedapproximately $23 million of intangible assets and $12 million of goodwill. These costs were included in SG&A on ourConsolidated Statements of Operations, but were not included in our segment results. No impairments were recordedin 2016 or 2014 as a result of the annual goodwill impairment tests performed.
Intangible Assets LeaseholdAcquisition Costs Other (a) Total
(millions)January 28,
2017January 30,
2016January 28,
2017January 30,
2016January 28,
2017January 30,
2016Gross asset $ 208 $ 211 $ 88 $ 88 $ 296 $ 299Accumulated amortization (132) (127) (38) (27) (170) (154)Net intangible assets $ 76 $ 84 $ 50 $ 61 $ 126 $ 145
(a) Other intangible assets relate primarily to trademarks.
We use the straight-line method to amortize leasehold acquisition costs primarily over 9 to 39 years and other definite-lived intangibles over 3 to 15 years. The weighted average life of leasehold acquisition costs and other intangibleassets was 27 years and 8 years, respectively, at January 28, 2017. Amortization expense was $18 million, $23 million,and $22 million in 2016, 2015, and 2014, respectively.
Estimated Amortization Expense(millions) 2017 2018 2019 2020 2021Amortization expense $ 16 $ 12 $ 11 $ 11 $ 11
17. Accounts Payable
At January 28, 2017 and January 30, 2016, we reclassified book overdrafts of $459 million and $534 million,respectively, to accounts payable and $24 million and $25 million, respectively, to accrued and other current liabilities.
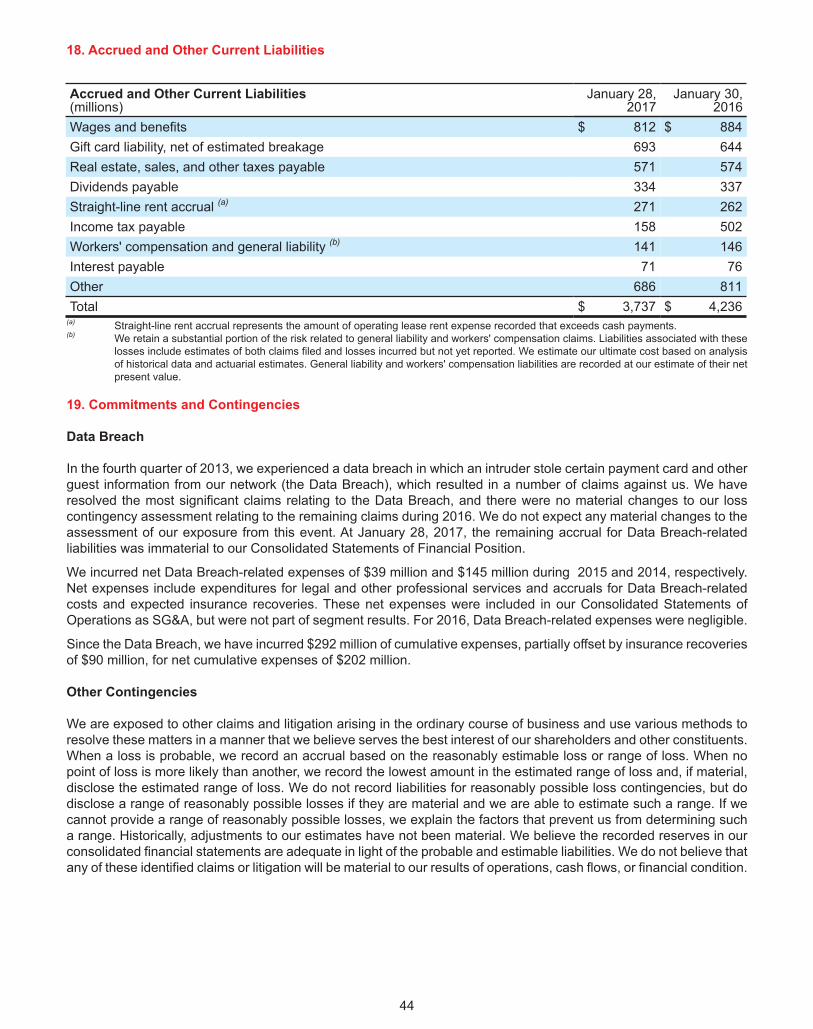
18. Accrued and Other Current Liabilities
Accrued and Other Current Liabilities(millions)
January 28, 2017
January 30, 2016
Wages and benefits $ 812 $ 884Gift card liability, net of estimated breakage 693 644Real estate, sales, and other taxes payable 571 574Dividends payable 334 337Straight-line rent accrual (a) 271 262Income tax payable 158 502Workers' compensation and general liability (b) 141 146Interest payable 71 76Other 686 811Total $ 3,737 $ 4,236
(a) Straight-line rent accrual represents the amount of operating lease rent expense recorded that exceeds cash payments. (b) We retain a substantial portion of the risk related to general liability and workers' compensation claims. Liabilities associated with these
losses include estimates of both claims filed and losses incurred but not yet reported. We estimate our ultimate cost based on analysisof historical data and actuarial estimates. General liability and workers' compensation liabilities are recorded at our estimate of their netpresent value.
44
19. Commitments and Contingencies
Data Breach
In the fourth quarter of 2013, we experienced a data breach in which an intruder stole certain payment card and otherguest information from our network (the Data Breach), which resulted in a number of claims against us. We haveresolved the most significant claims relating to the Data Breach, and there were no material changes to our losscontingency assessment relating to the remaining claims during 2016. We do not expect any material changes to theassessment of our exposure from this event. At January 28, 2017, the remaining accrual for Data Breach-relatedliabilities was immaterial to our Consolidated Statements of Financial Position.
We incurred net Data Breach-related expenses of $39 million and $145 million during 2015 and 2014, respectively.Net expenses include expenditures for legal and other professional services and accruals for Data Breach-relatedcosts and expected insurance recoveries. These net expenses were included in our Consolidated Statements ofOperations as SG&A, but were not part of segment results. For 2016, Data Breach-related expenses were negligible.
Since the Data Breach, we have incurred $292 million of cumulative expenses, partially offset by insurance recoveriesof $90 million, for net cumulative expenses of $202 million.
Other Contingencies
We are exposed to other claims and litigation arising in the ordinary course of business and use various methods toresolve these matters in a manner that we believe serves the best interest of our shareholders and other constituents.When a loss is probable, we record an accrual based on the reasonably estimable loss or range of loss. When nopoint of loss is more likely than another, we record the lowest amount in the estimated range of loss and, if material,disclose the estimated range of loss. We do not record liabilities for reasonably possible loss contingencies, but dodisclose a range of reasonably possible losses if they are material and we are able to estimate such a range. If wecannot provide a range of reasonably possible losses, we explain the factors that prevent us from determining sucha range. Historically, adjustments to our estimates have not been material. We believe the recorded reserves in ourconsolidated financial statements are adequate in light of the probable and estimable liabilities. We do not believe thatany of these identified claims or litigation will be material to our results of operations, cash flows, or financial condition.
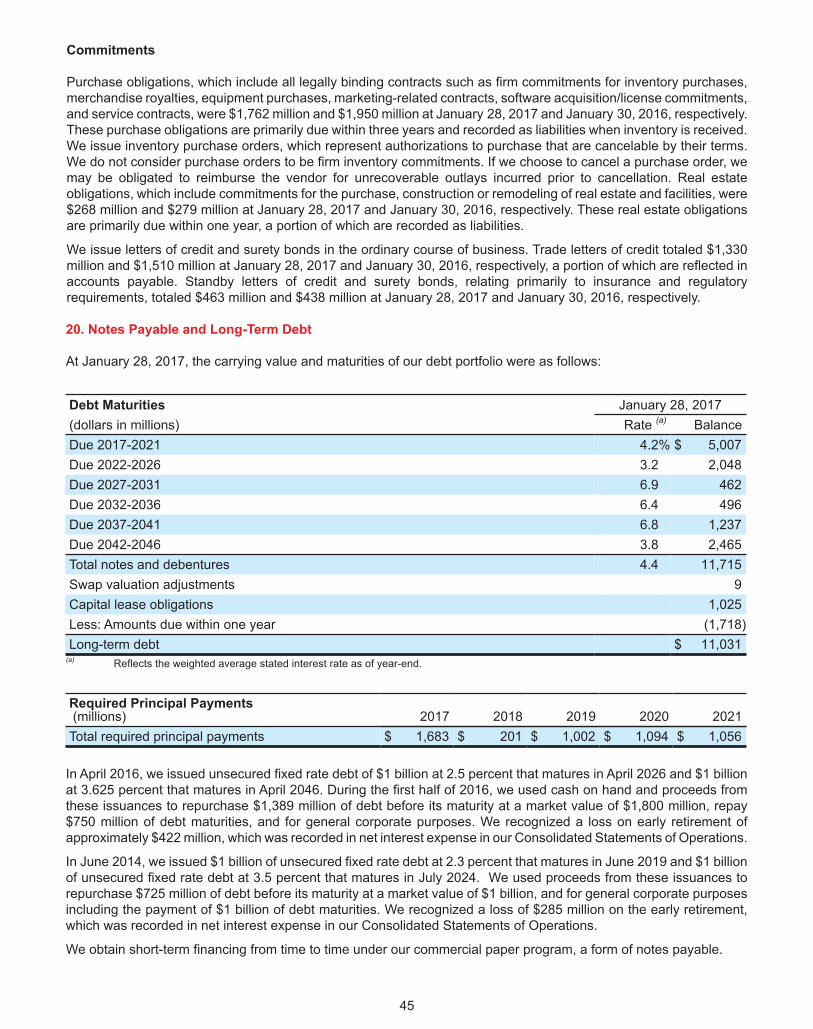
Commitments
Purchase obligations, which include all legally binding contracts such as firm commitments for inventory purchases,merchandise royalties, equipment purchases, marketing-related contracts, software acquisition/license commitments,and service contracts, were $1,762 million and $1,950 million at January 28, 2017 and January 30, 2016, respectively.These purchase obligations are primarily due within three years and recorded as liabilities when inventory is received.We issue inventory purchase orders, which represent authorizations to purchase that are cancelable by their terms.We do not consider purchase orders to be firm inventory commitments. If we choose to cancel a purchase order, wemay be obligated to reimburse the vendor for unrecoverable outlays incurred prior to cancellation. Real estateobligations, which include commitments for the purchase, construction or remodeling of real estate and facilities, were$268 million and $279 million at January 28, 2017 and January 30, 2016, respectively. These real estate obligationsare primarily due within one year, a portion of which are recorded as liabilities.
We issue letters of credit and surety bonds in the ordinary course of business. Trade letters of credit totaled $1,330million and $1,510 million at January 28, 2017 and January 30, 2016, respectively, a portion of which are reflected inaccounts payable. Standby letters of credit and surety bonds, relating primarily to insurance and regulatoryrequirements, totaled $463 million and $438 million at January 28, 2017 and January 30, 2016, respectively.
45
20. Notes Payable and Long-Term Debt
At January 28, 2017, the carrying value and maturities of our debt portfolio were as follows:
Debt Maturities January 28, 2017(dollars in millions) Rate (a) BalanceDue 2017-2021 4.2% $ 5,007Due 2022-2026 3.2 2,048Due 2027-2031 6.9 462Due 2032-2036 6.4 496Due 2037-2041 6.8 1,237Due 2042-2046 3.8 2,465Total notes and debentures 4.4 11,715Swap valuation adjustments 9Capital lease obligations 1,025Less: Amounts due within one year (1,718)Long-term debt $ 11,031
(a) Reflects the weighted average stated interest rate as of year-end.
Required Principal Payments (millions) 2017 2018 2019 2020 2021Total required principal payments $ 1,683 $ 201 $ 1,002 $ 1,094 $ 1,056
In April 2016, we issued unsecured fixed rate debt of $1 billion at 2.5 percent that matures in April 2026 and $1 billionat 3.625 percent that matures in April 2046. During the first half of 2016, we used cash on hand and proceeds fromthese issuances to repurchase $1,389 million of debt before its maturity at a market value of $1,800 million, repay$750 million of debt maturities, and for general corporate purposes. We recognized a loss on early retirement ofapproximately $422 million, which was recorded in net interest expense in our Consolidated Statements of Operations.
In June 2014, we issued $1 billion of unsecured fixed rate debt at 2.3 percent that matures in June 2019 and $1 billionof unsecured fixed rate debt at 3.5 percent that matures in July 2024. We used proceeds from these issuances torepurchase $725 million of debt before its maturity at a market value of $1 billion, and for general corporate purposesincluding the payment of $1 billion of debt maturities. We recognized a loss of $285 million on the early retirement,which was recorded in net interest expense in our Consolidated Statements of Operations.
We obtain short-term financing from time to time under our commercial paper program, a form of notes payable.
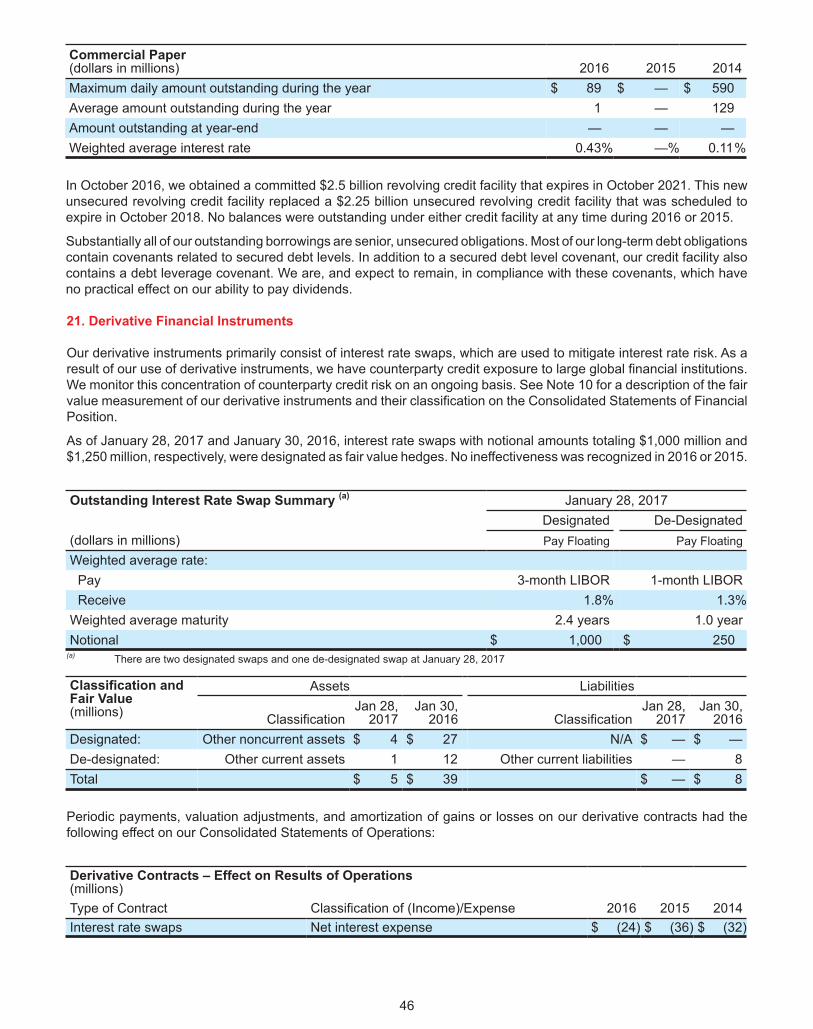
Commercial Paper(dollars in millions) 2016 2015 2014Maximum daily amount outstanding during the year $ 89 $ — $ 590Average amount outstanding during the year 1 — 129Amount outstanding at year-end — — —Weighted average interest rate 0.43% —% 0.11%
In October 2016, we obtained a committed $2.5 billion revolving credit facility that expires in October 2021. This newunsecured revolving credit facility replaced a $2.25 billion unsecured revolving credit facility that was scheduled toexpire in October 2018. No balances were outstanding under either credit facility at any time during 2016 or 2015.
Substantially all of our outstanding borrowings are senior, unsecured obligations. Most of our long-term debt obligationscontain covenants related to secured debt levels. In addition to a secured debt level covenant, our credit facility alsocontains a debt leverage covenant. We are, and expect to remain, in compliance with these covenants, which haveno practical effect on our ability to pay dividends.
46
21. Derivative Financial Instruments
Our derivative instruments primarily consist of interest rate swaps, which are used to mitigate interest rate risk. As aresult of our use of derivative instruments, we have counterparty credit exposure to large global financial institutions.We monitor this concentration of counterparty credit risk on an ongoing basis. See Note 10 for a description of the fairvalue measurement of our derivative instruments and their classification on the Consolidated Statements of FinancialPosition.
As of January 28, 2017 and January 30, 2016, interest rate swaps with notional amounts totaling $1,000 million and$1,250 million, respectively, were designated as fair value hedges. No ineffectiveness was recognized in 2016 or 2015.
Outstanding Interest Rate Swap Summary (a) January 28, 2017Designated De-Designated
(dollars in millions) Pay Floating Pay FloatingWeighted average rate:
Pay 3-month LIBOR 1-month LIBORReceive 1.8% 1.3%
Weighted average maturity 2.4 years 1.0 yearNotional $ 1,000 $ 250
(a) There are two designated swaps and one de-designated swap at January 28, 2017
Classification andFair Value(millions)
Assets Liabilities
ClassificationJan 28,
2017Jan 30,
2016 ClassificationJan 28,
2017Jan 30,
2016Designated: Other noncurrent assets $ 4 $ 27 N/A $ — $ —De-designated: Other current assets 1 12 Other current liabilities — 8Total $ 5 $ 39 $ — $ 8
Periodic payments, valuation adjustments, and amortization of gains or losses on our derivative contracts had thefollowing effect on our Consolidated Statements of Operations:
Derivative Contracts – Effect on Results of Operations(millions)Type of Contract Classification of (Income)/Expense 2016 2015 2014Interest rate swaps Net interest expense $ (24) $ (36) $ (32)
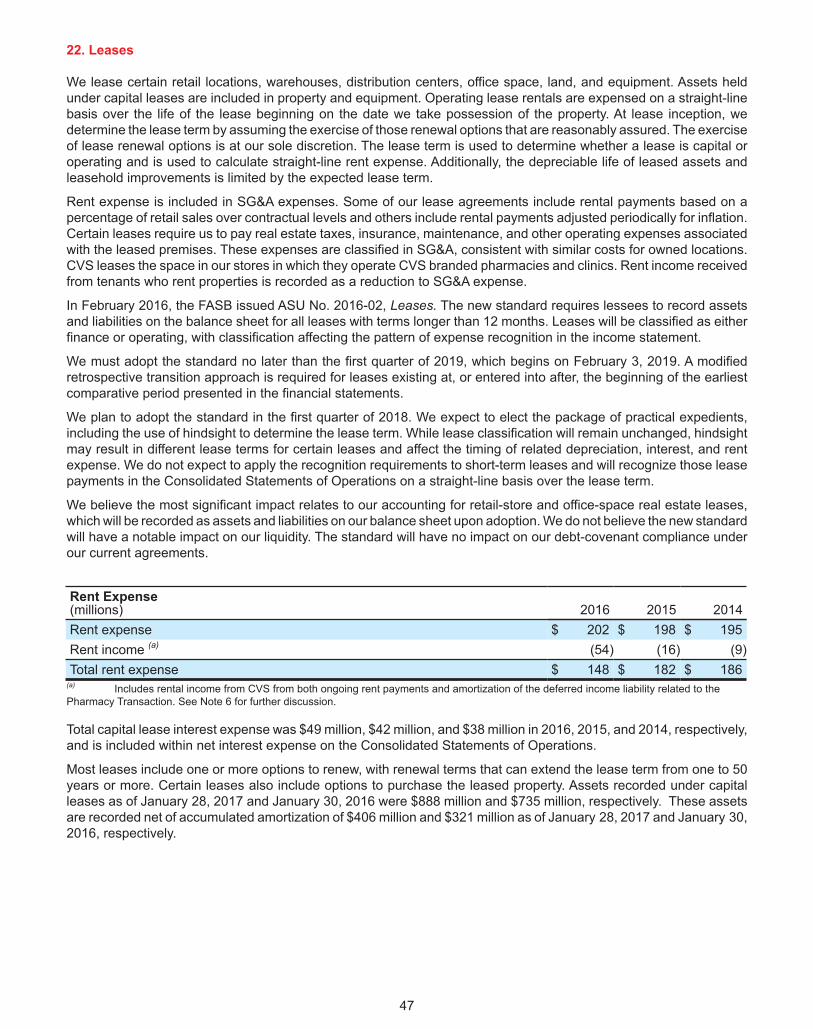
22. Leases
We lease certain retail locations, warehouses, distribution centers, office space, land, and equipment. Assets heldunder capital leases are included in property and equipment. Operating lease rentals are expensed on a straight-linebasis over the life of the lease beginning on the date we take possession of the property. At lease inception, wedetermine the lease term by assuming the exercise of those renewal options that are reasonably assured. The exerciseof lease renewal options is at our sole discretion. The lease term is used to determine whether a lease is capital oroperating and is used to calculate straight-line rent expense. Additionally, the depreciable life of leased assets andleasehold improvements is limited by the expected lease term.
Rent expense is included in SG&A expenses. Some of our lease agreements include rental payments based on apercentage of retail sales over contractual levels and others include rental payments adjusted periodically for inflation.Certain leases require us to pay real estate taxes, insurance, maintenance, and other operating expenses associatedwith the leased premises. These expenses are classified in SG&A, consistent with similar costs for owned locations.CVS leases the space in our stores in which they operate CVS branded pharmacies and clinics. Rent income receivedfrom tenants who rent properties is recorded as a reduction to SG&A expense.
In February 2016, the FASB issued ASU No. 2016-02, Leases. The new standard requires lessees to record assetsand liabilities on the balance sheet for all leases with terms longer than 12 months. Leases will be classified as eitherfinance or operating, with classification affecting the pattern of expense recognition in the income statement.
We must adopt the standard no later than the first quarter of 2019, which begins on February 3, 2019. A modifiedretrospective transition approach is required for leases existing at, or entered into after, the beginning of the earliestcomparative period presented in the financial statements.
We plan to adopt the standard in the first quarter of 2018. We expect to elect the package of practical expedients,including the use of hindsight to determine the lease term. While lease classification will remain unchanged, hindsightmay result in different lease terms for certain leases and affect the timing of related depreciation, interest, and rentexpense. We do not expect to apply the recognition requirements to short-term leases and will recognize those leasepayments in the Consolidated Statements of Operations on a straight-line basis over the lease term.
We believe the most significant impact relates to our accounting for retail-store and office-space real estate leases,which will be recorded as assets and liabilities on our balance sheet upon adoption. We do not believe the new standardwill have a notable impact on our liquidity. The standard will have no impact on our debt-covenant compliance underour current agreements.
Rent Expense(millions) 2016 2015 2014Rent expense $ 202 $ 198 $ 195Rent income (a) (54) (16) (9)Total rent expense $ 148 $ 182 $ 186
(a) Includes rental income from CVS from both ongoing rent payments and amortization of the deferred income liability related to thePharmacy Transaction. See Note 6 for further discussion.
Total capital lease interest expense was $49 million, $42 million, and $38 million in 2016, 2015, and 2014, respectively,and is included within net interest expense on the Consolidated Statements of Operations.
Most leases include one or more options to renew, with renewal terms that can extend the lease term from one to 50years or more. Certain leases also include options to purchase the leased property. Assets recorded under capitalleases as of January 28, 2017 and January 30, 2016 were $888 million and $735 million, respectively. These assetsare recorded net of accumulated amortization of $406 million and $321 million as of January 28, 2017 and January 30,2016, respectively.
47
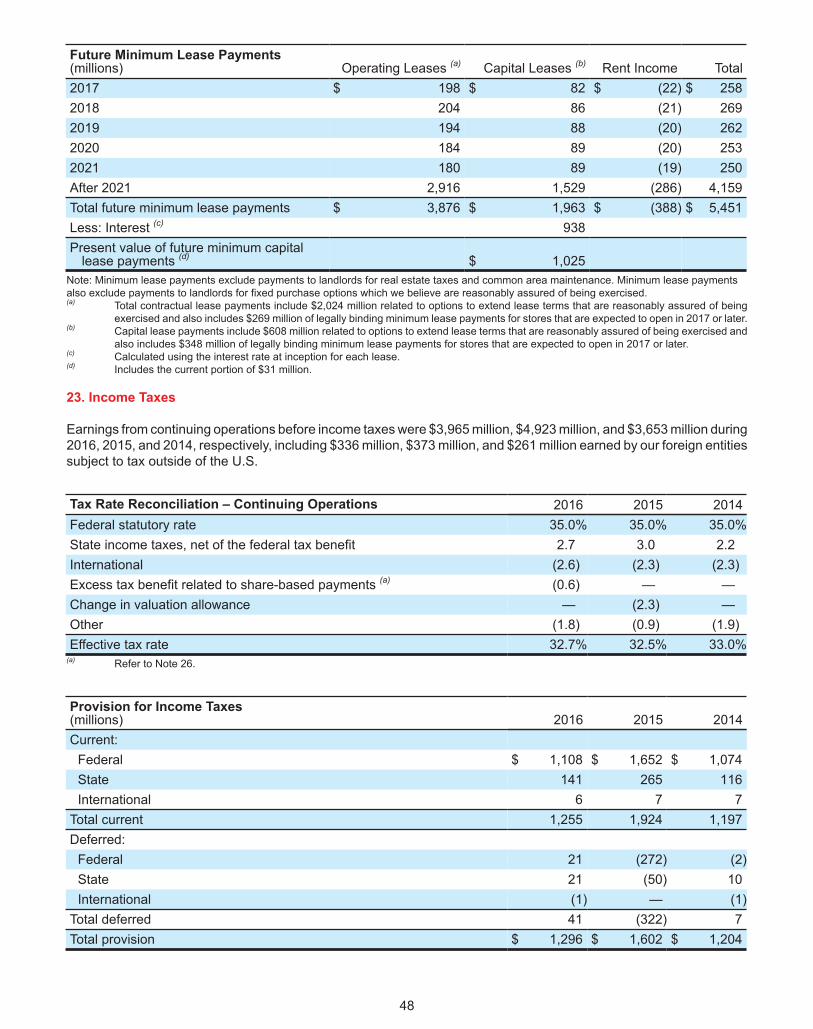
Future Minimum Lease Payments(millions) Operating Leases (a) Capital Leases (b) Rent Income Total2017 $ 198 $ 82 $ (22) $ 2582018 204 86 (21) 2692019 194 88 (20) 2622020 184 89 (20) 2532021 180 89 (19) 250After 2021 2,916 1,529 (286) 4,159Total future minimum lease payments $ 3,876 $ 1,963 $ (388) $ 5,451Less: Interest (c) 938Present value of future minimum capital
lease payments (d) $ 1,025Note: Minimum lease payments exclude payments to landlords for real estate taxes and common area maintenance. Minimum lease paymentsalso exclude payments to landlords for fixed purchase options which we believe are reasonably assured of being exercised. (a) Total contractual lease payments include $2,024 million related to options to extend lease terms that are reasonably assured of being
exercised and also includes $269 million of legally binding minimum lease payments for stores that are expected to open in 2017 or later.(b) Capital lease payments include $608 million related to options to extend lease terms that are reasonably assured of being exercised and
also includes $348 million of legally binding minimum lease payments for stores that are expected to open in 2017 or later. (c) Calculated using the interest rate at inception for each lease.(d) Includes the current portion of $31 million.
48
23. Income Taxes
Earnings from continuing operations before income taxes were $3,965 million, $4,923 million, and $3,653 million during2016, 2015, and 2014, respectively, including $336 million, $373 million, and $261 million earned by our foreign entitiessubject to tax outside of the U.S.
Tax Rate Reconciliation – Continuing Operations 2016 2015 2014Federal statutory rate 35.0% 35.0% 35.0%State income taxes, net of the federal tax benefit 2.7 3.0 2.2International (2.6) (2.3) (2.3)Excess tax benefit related to share-based payments (a) (0.6) — —Change in valuation allowance — (2.3) —Other (1.8) (0.9) (1.9)Effective tax rate 32.7% 32.5% 33.0%
(a) Refer to Note 26.
Provision for Income Taxes(millions) 2016 2015 2014Current:
Federal $ 1,108 $ 1,652 $ 1,074State 141 265 116International 6 7 7
Total current 1,255 1,924 1,197Deferred:
Federal 21 (272) (2)State 21 (50) 10International (1) — (1)
Total deferred 41 (322) 7Total provision $ 1,296 $ 1,602 $ 1,204
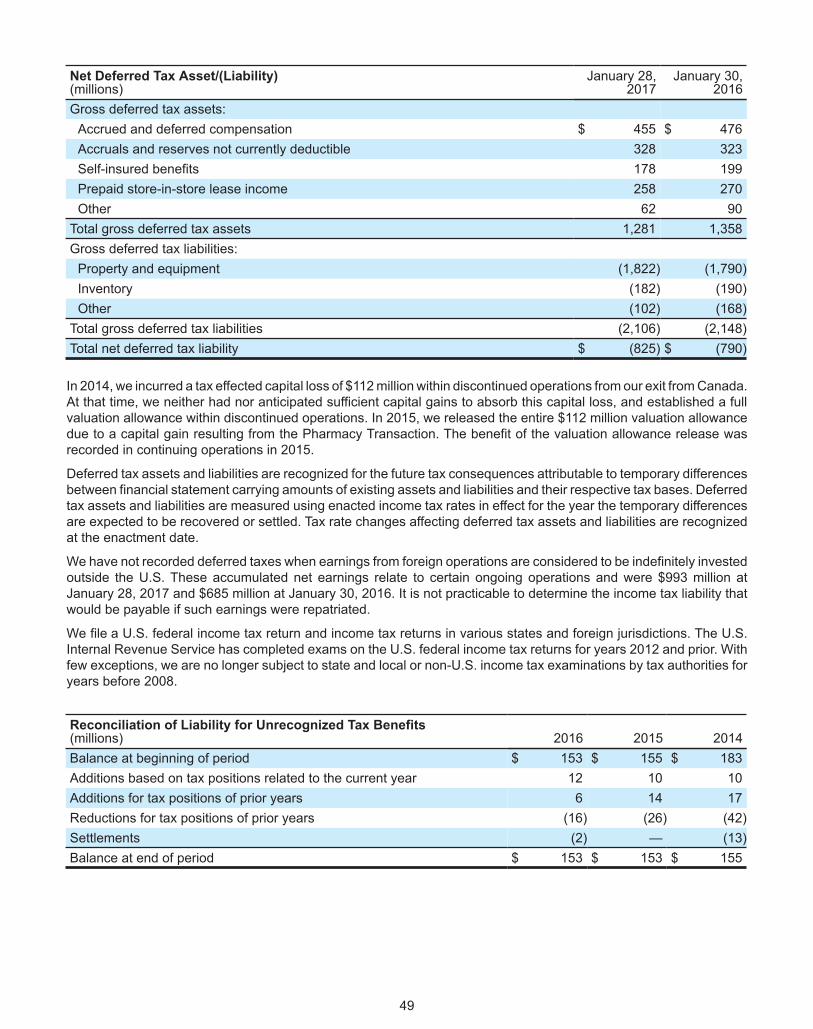
Net Deferred Tax Asset/(Liability)(millions)
January 28, 2017
January 30, 2016
Gross deferred tax assets:Accrued and deferred compensation $ 455 $ 476Accruals and reserves not currently deductible 328 323Self-insured benefits 178 199Prepaid store-in-store lease income 258 270Other 62 90
Total gross deferred tax assets 1,281 1,358Gross deferred tax liabilities:
Property and equipment (1,822) (1,790)Inventory (182) (190)Other (102) (168)
Total gross deferred tax liabilities (2,106) (2,148)Total net deferred tax liability $ (825) $ (790)
In 2014, we incurred a tax effected capital loss of $112 million within discontinued operations from our exit from Canada.At that time, we neither had nor anticipated sufficient capital gains to absorb this capital loss, and established a fullvaluation allowance within discontinued operations. In 2015, we released the entire $112 million valuation allowancedue to a capital gain resulting from the Pharmacy Transaction. The benefit of the valuation allowance release wasrecorded in continuing operations in 2015.
Deferred tax assets and liabilities are recognized for the future tax consequences attributable to temporary differencesbetween financial statement carrying amounts of existing assets and liabilities and their respective tax bases. Deferredtax assets and liabilities are measured using enacted income tax rates in effect for the year the temporary differencesare expected to be recovered or settled. Tax rate changes affecting deferred tax assets and liabilities are recognizedat the enactment date.
We have not recorded deferred taxes when earnings from foreign operations are considered to be indefinitely investedoutside the U.S. These accumulated net earnings relate to certain ongoing operations and were $993 million atJanuary 28, 2017 and $685 million at January 30, 2016. It is not practicable to determine the income tax liability thatwould be payable if such earnings were repatriated.
We file a U.S. federal income tax return and income tax returns in various states and foreign jurisdictions. The U.S.Internal Revenue Service has completed exams on the U.S. federal income tax returns for years 2012 and prior. Withfew exceptions, we are no longer subject to state and local or non-U.S. income tax examinations by tax authorities foryears before 2008.
Reconciliation of Liability for Unrecognized Tax Benefits(millions) 2016 2015 2014Balance at beginning of period $ 153 $ 155 $ 183Additions based on tax positions related to the current year 12 10 10Additions for tax positions of prior years 6 14 17Reductions for tax positions of prior years (16) (26) (42)Settlements (2) — (13)Balance at end of period $ 153 $ 153 $ 155
49
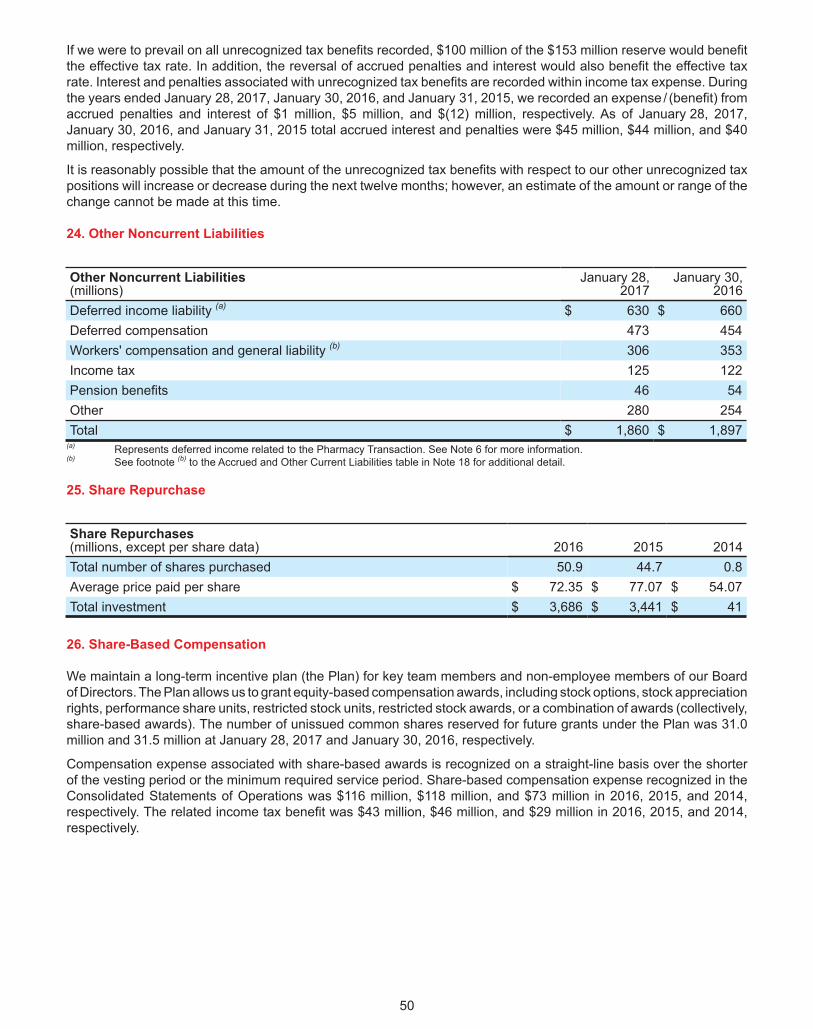
If we were to prevail on all unrecognized tax benefits recorded, $100 million of the $153 million reserve would benefitthe effective tax rate. In addition, the reversal of accrued penalties and interest would also benefit the effective taxrate. Interest and penalties associated with unrecognized tax benefits are recorded within income tax expense. Duringthe years ended January 28, 2017, January 30, 2016, and January 31, 2015, we recorded an expense / (benefit) fromaccrued penalties and interest of $1 million, $5 million, and $(12) million, respectively. As of January 28, 2017,January 30, 2016, and January 31, 2015 total accrued interest and penalties were $45 million, $44 million, and $40million, respectively.
It is reasonably possible that the amount of the unrecognized tax benefits with respect to our other unrecognized taxpositions will increase or decrease during the next twelve months; however, an estimate of the amount or range of thechange cannot be made at this time.
50
24. Other Noncurrent Liabilities
Other Noncurrent Liabilities(millions)
January 28, 2017
January 30, 2016
Deferred income liability (a) $ 630 $ 660Deferred compensation 473 454Workers' compensation and general liability (b) 306 353Income tax 125 122Pension benefits 46 54Other 280 254Total $ 1,860 $ 1,897
(a) Represents deferred income related to the Pharmacy Transaction. See Note 6 for more information.(b) See footnote (b) to the Accrued and Other Current Liabilities table in Note 18 for additional detail.
25. Share Repurchase
Share Repurchases(millions, except per share data) 2016 2015 2014Total number of shares purchased 50.9 44.7 0.8Average price paid per share $ 72.35 $ 77.07 $ 54.07Total investment $ 3,686 $ 3,441 $ 41
26. Share-Based Compensation
We maintain a long-term incentive plan (the Plan) for key team members and non-employee members of our Boardof Directors. The Plan allows us to grant equity-based compensation awards, including stock options, stock appreciationrights, performance share units, restricted stock units, restricted stock awards, or a combination of awards (collectively,share-based awards). The number of unissued common shares reserved for future grants under the Plan was 31.0million and 31.5 million at January 28, 2017 and January 30, 2016, respectively.
Compensation expense associated with share-based awards is recognized on a straight-line basis over the shorterof the vesting period or the minimum required service period. Share-based compensation expense recognized in theConsolidated Statements of Operations was $116 million, $118 million, and $73 million in 2016, 2015, and 2014,respectively. The related income tax benefit was $43 million, $46 million, and $29 million in 2016, 2015, and 2014,respectively.
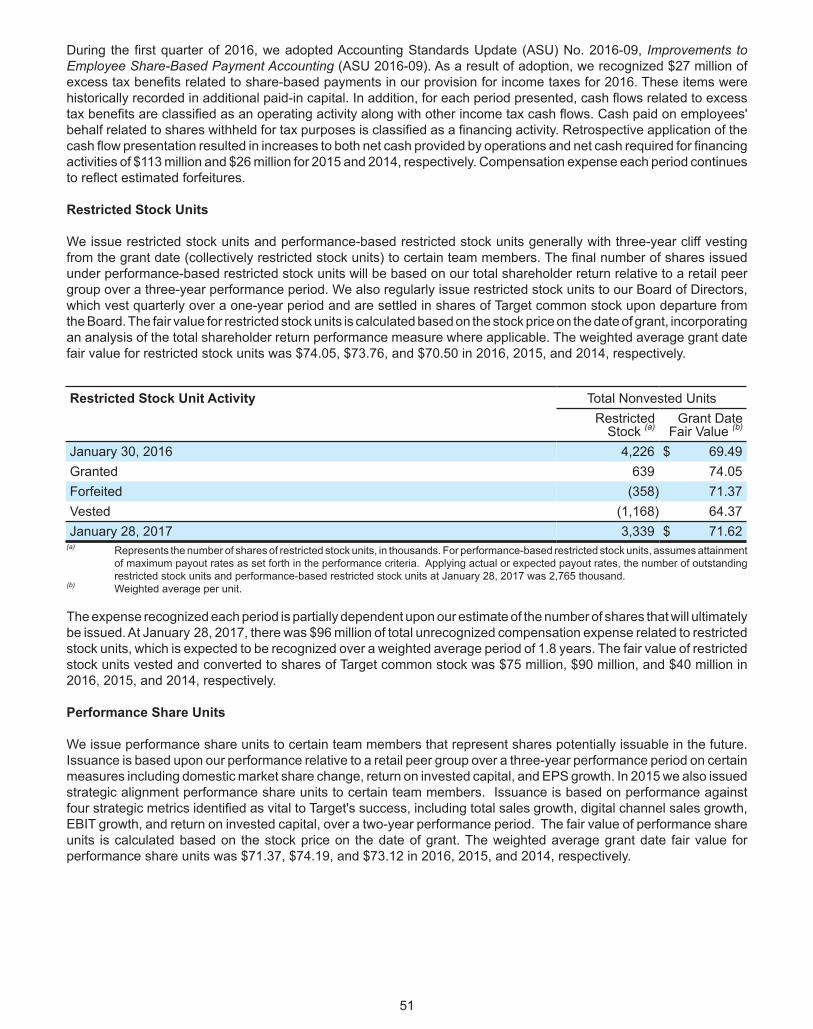
During the first quarter of 2016, we adopted Accounting Standards Update (ASU) No. 2016-09, Improvements toEmployee Share-Based Payment Accounting (ASU 2016-09). As a result of adoption, we recognized $27 million ofexcess tax benefits related to share-based payments in our provision for income taxes for 2016. These items werehistorically recorded in additional paid-in capital. In addition, for each period presented, cash flows related to excesstax benefits are classified as an operating activity along with other income tax cash flows. Cash paid on employees'behalf related to shares withheld for tax purposes is classified as a financing activity. Retrospective application of thecash flow presentation resulted in increases to both net cash provided by operations and net cash required for financingactivities of $113 million and $26 million for 2015 and 2014, respectively. Compensation expense each period continuesto reflect estimated forfeitures.
Restricted Stock Units
We issue restricted stock units and performance-based restricted stock units generally with three-year cliff vestingfrom the grant date (collectively restricted stock units) to certain team members. The final number of shares issuedunder performance-based restricted stock units will be based on our total shareholder return relative to a retail peergroup over a three-year performance period. We also regularly issue restricted stock units to our Board of Directors,which vest quarterly over a one-year period and are settled in shares of Target common stock upon departure fromthe Board. The fair value for restricted stock units is calculated based on the stock price on the date of grant, incorporatingan analysis of the total shareholder return performance measure where applicable. The weighted average grant datefair value for restricted stock units was $74.05, $73.76, and $70.50 in 2016, 2015, and 2014, respectively.
Restricted Stock Unit Activity Total Nonvested UnitsRestricted
Stock (a)Grant Date
Fair Value (b)
January 30, 2016 4,226 $ 69.49Granted 639 74.05Forfeited (358) 71.37Vested (1,168) 64.37January 28, 2017 3,339 $ 71.62
(a) Represents the number of shares of restricted stock units, in thousands. For performance-based restricted stock units, assumes attainmentof maximum payout rates as set forth in the performance criteria. Applying actual or expected payout rates, the number of outstandingrestricted stock units and performance-based restricted stock units at January 28, 2017 was 2,765 thousand.
(b) Weighted average per unit.
The expense recognized each period is partially dependent upon our estimate of the number of shares that will ultimatelybe issued. At January 28, 2017, there was $96 million of total unrecognized compensation expense related to restrictedstock units, which is expected to be recognized over a weighted average period of 1.8 years. The fair value of restrictedstock units vested and converted to shares of Target common stock was $75 million, $90 million, and $40 million in2016, 2015, and 2014, respectively.
Performance Share Units
We issue performance share units to certain team members that represent shares potentially issuable in the future.Issuance is based upon our performance relative to a retail peer group over a three-year performance period on certainmeasures including domestic market share change, return on invested capital, and EPS growth. In 2015 we also issuedstrategic alignment performance share units to certain team members. Issuance is based on performance againstfour strategic metrics identified as vital to Target's success, including total sales growth, digital channel sales growth,EBIT growth, and return on invested capital, over a two-year performance period. The fair value of performance shareunits is calculated based on the stock price on the date of grant. The weighted average grant date fair value forperformance share units was $71.37, $74.19, and $73.12 in 2016, 2015, and 2014, respectively.
51
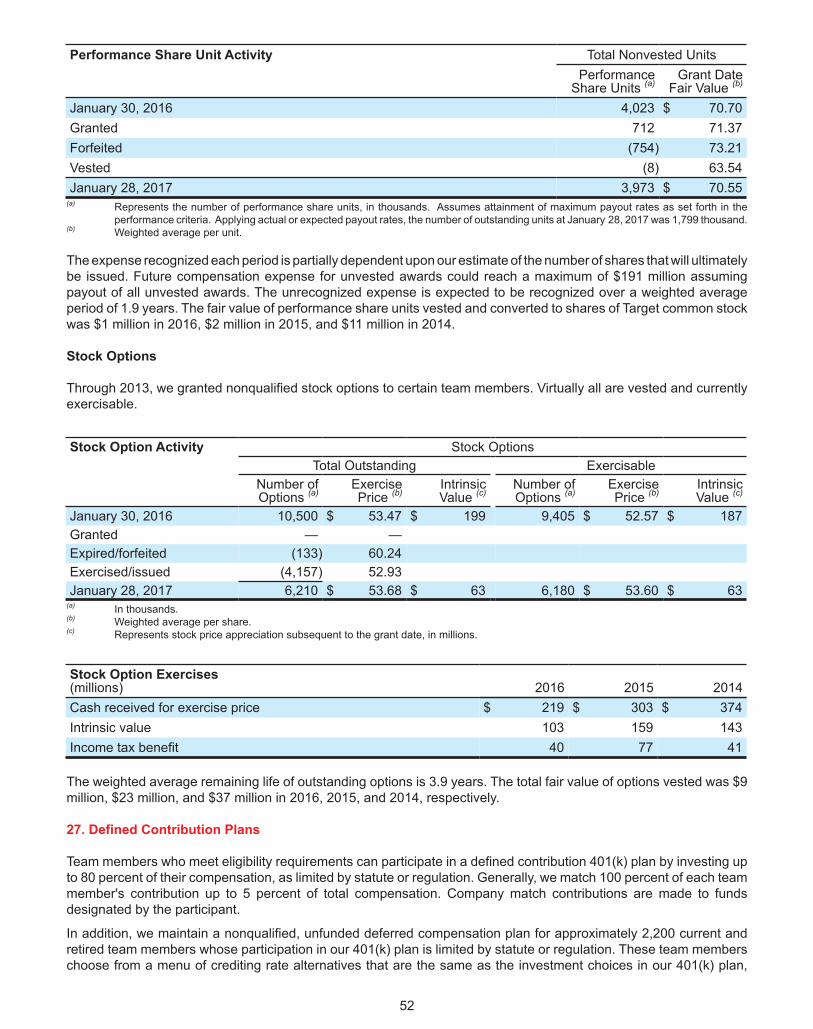
Performance Share Unit Activity Total Nonvested UnitsPerformance
Share Units (a)Grant Date
Fair Value (b)
January 30, 2016 4,023 $ 70.70Granted 712 71.37Forfeited (754) 73.21Vested (8) 63.54January 28, 2017 3,973 $ 70.55
(a) Represents the number of performance share units, in thousands. Assumes attainment of maximum payout rates as set forth in theperformance criteria. Applying actual or expected payout rates, the number of outstanding units at January 28, 2017 was 1,799 thousand.
(b) Weighted average per unit.
The expense recognized each period is partially dependent upon our estimate of the number of shares that will ultimatelybe issued. Future compensation expense for unvested awards could reach a maximum of $191 million assumingpayout of all unvested awards. The unrecognized expense is expected to be recognized over a weighted averageperiod of 1.9 years. The fair value of performance share units vested and converted to shares of Target common stockwas $1 million in 2016, $2 million in 2015, and $11 million in 2014.
Stock Options
Through 2013, we granted nonqualified stock options to certain team members. Virtually all are vested and currentlyexercisable.
Stock Option Activity Stock OptionsTotal Outstanding Exercisable
Number ofOptions (a)
ExercisePrice (b)
IntrinsicValue (c)
Number ofOptions (a)
ExercisePrice (b)
IntrinsicValue (c)
January 30, 2016 10,500 $ 53.47 $ 199 9,405 $ 52.57 $ 187Granted — —Expired/forfeited (133) 60.24Exercised/issued (4,157) 52.93January 28, 2017 6,210 $ 53.68 $ 63 6,180 $ 53.60 $ 63
(a) In thousands.(b) Weighted average per share.(c) Represents stock price appreciation subsequent to the grant date, in millions.
Stock Option Exercises(millions) 2016 2015 2014Cash received for exercise price $ 219 $ 303 $ 374Intrinsic value 103 159 143Income tax benefit 40 77 41
The weighted average remaining life of outstanding options is 3.9 years. The total fair value of options vested was $9million, $23 million, and $37 million in 2016, 2015, and 2014, respectively.
52
27. Defined Contribution Plans
Team members who meet eligibility requirements can participate in a defined contribution 401(k) plan by investing upto 80 percent of their compensation, as limited by statute or regulation. Generally, we match 100 percent of each teammember's contribution up to 5 percent of total compensation. Company match contributions are made to fundsdesignated by the participant.
In addition, we maintain a nonqualified, unfunded deferred compensation plan for approximately 2,200 current andretired team members whose participation in our 401(k) plan is limited by statute or regulation. These team memberschoose from a menu of crediting rate alternatives that are the same as the investment choices in our 401(k) plan,
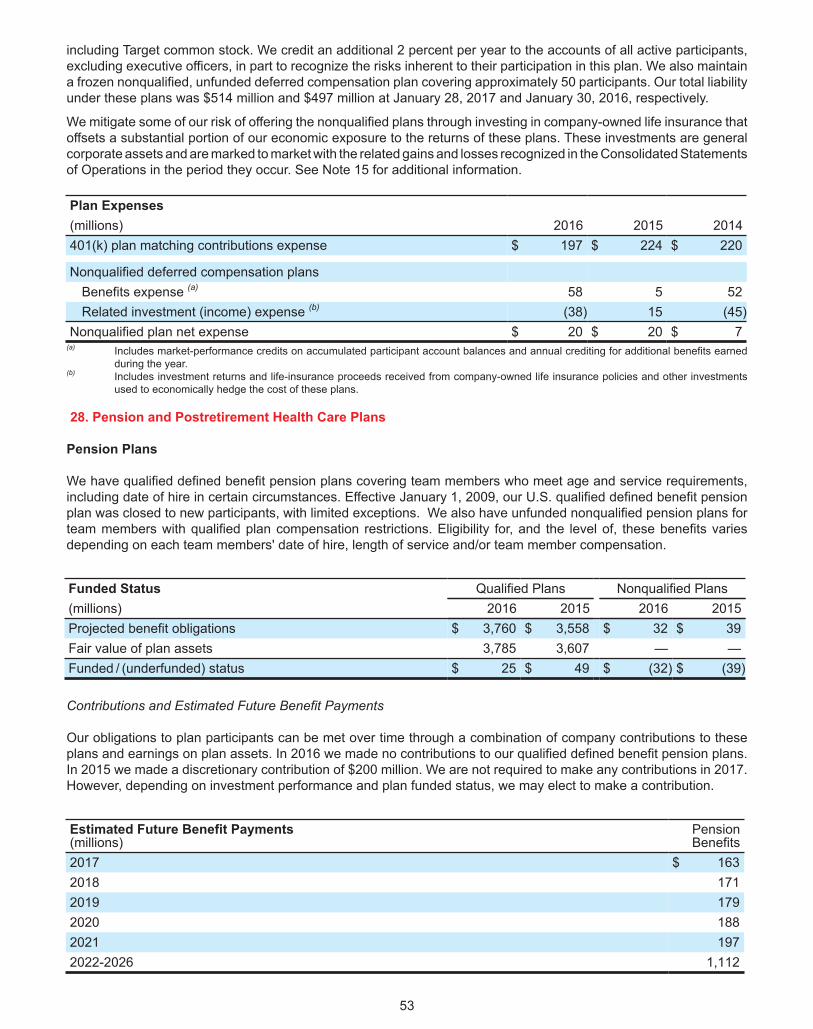
including Target common stock. We credit an additional 2 percent per year to the accounts of all active participants,excluding executive officers, in part to recognize the risks inherent to their participation in this plan. We also maintaina frozen nonqualified, unfunded deferred compensation plan covering approximately 50 participants. Our total liabilityunder these plans was $514 million and $497 million at January 28, 2017 and January 30, 2016, respectively.
We mitigate some of our risk of offering the nonqualified plans through investing in company-owned life insurance thatoffsets a substantial portion of our economic exposure to the returns of these plans. These investments are generalcorporate assets and are marked to market with the related gains and losses recognized in the Consolidated Statementsof Operations in the period they occur. See Note 15 for additional information.
Plan Expenses(millions) 2016 2015 2014401(k) plan matching contributions expense $ 197 $ 224 $ 220
Nonqualified deferred compensation plansBenefits expense (a) 58 5 52Related investment (income) expense (b) (38) 15 (45)
Nonqualified plan net expense $ 20 $ 20 $ 7(a) Includes market-performance credits on accumulated participant account balances and annual crediting for additional benefits earned
during the year.(b) Includes investment returns and life-insurance proceeds received from company-owned life insurance policies and other investments
used to economically hedge the cost of these plans.
53
28. Pension and Postretirement Health Care Plans
Pension Plans
We have qualified defined benefit pension plans covering team members who meet age and service requirements,including date of hire in certain circumstances. Effective January 1, 2009, our U.S. qualified defined benefit pensionplan was closed to new participants, with limited exceptions. We also have unfunded nonqualified pension plans forteam members with qualified plan compensation restrictions. Eligibility for, and the level of, these benefits variesdepending on each team members' date of hire, length of service and/or team member compensation.
Funded Status Qualified Plans Nonqualified Plans(millions) 2016 2015 2016 2015Projected benefit obligations $ 3,760 $ 3,558 $ 32 $ 39Fair value of plan assets 3,785 3,607 — —Funded / (underfunded) status $ 25 $ 49 $ (32) $ (39)
Contributions and Estimated Future Benefit Payments
Our obligations to plan participants can be met over time through a combination of company contributions to theseplans and earnings on plan assets. In 2016 we made no contributions to our qualified defined benefit pension plans.In 2015 we made a discretionary contribution of $200 million. We are not required to make any contributions in 2017.However, depending on investment performance and plan funded status, we may elect to make a contribution.
Estimated Future Benefit Payments(millions)
PensionBenefits
2017 $ 1632018 1712019 1792020 1882021 1972022-2026 1,112
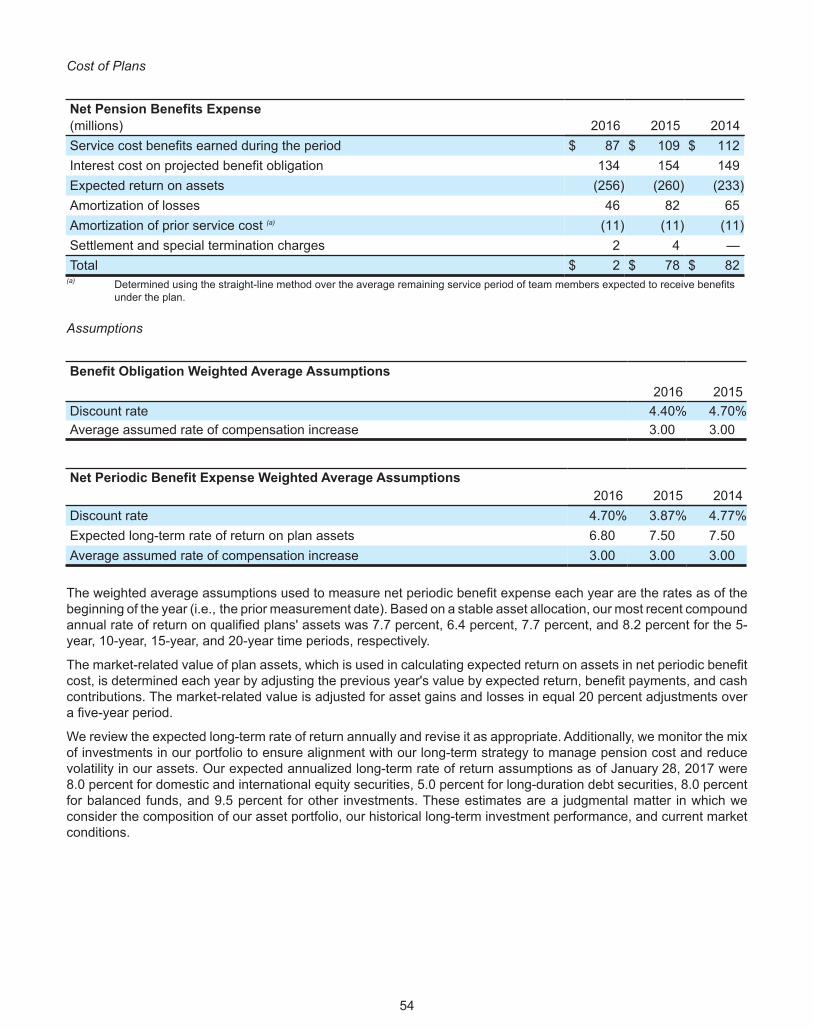
Cost of Plans
Net Pension Benefits Expense(millions) 2016 2015 2014Service cost benefits earned during the period $ 87 $ 109 $ 112Interest cost on projected benefit obligation 134 154 149Expected return on assets (256) (260) (233)Amortization of losses 46 82 65Amortization of prior service cost (a) (11) (11) (11)Settlement and special termination charges 2 4 —Total $ 2 $ 78 $ 82
(a) Determined using the straight-line method over the average remaining service period of team members expected to receive benefitsunder the plan.
Assumptions
Benefit Obligation Weighted Average Assumptions2016 2015
Discount rate 4.40% 4.70%Average assumed rate of compensation increase 3.00 3.00
Net Periodic Benefit Expense Weighted Average Assumptions2016 2015 2014
Discount rate 4.70% 3.87% 4.77%Expected long-term rate of return on plan assets 6.80 7.50 7.50Average assumed rate of compensation increase 3.00 3.00 3.00
The weighted average assumptions used to measure net periodic benefit expense each year are the rates as of thebeginning of the year (i.e., the prior measurement date). Based on a stable asset allocation, our most recent compoundannual rate of return on qualified plans' assets was 7.7 percent, 6.4 percent, 7.7 percent, and 8.2 percent for the 5-year, 10-year, 15-year, and 20-year time periods, respectively.
The market-related value of plan assets, which is used in calculating expected return on assets in net periodic benefitcost, is determined each year by adjusting the previous year's value by expected return, benefit payments, and cashcontributions. The market-related value is adjusted for asset gains and losses in equal 20 percent adjustments overa five-year period.
We review the expected long-term rate of return annually and revise it as appropriate. Additionally, we monitor the mixof investments in our portfolio to ensure alignment with our long-term strategy to manage pension cost and reducevolatility in our assets. Our expected annualized long-term rate of return assumptions as of January 28, 2017 were8.0 percent for domestic and international equity securities, 5.0 percent for long-duration debt securities, 8.0 percentfor balanced funds, and 9.5 percent for other investments. These estimates are a judgmental matter in which weconsider the composition of our asset portfolio, our historical long-term investment performance, and current marketconditions.
54
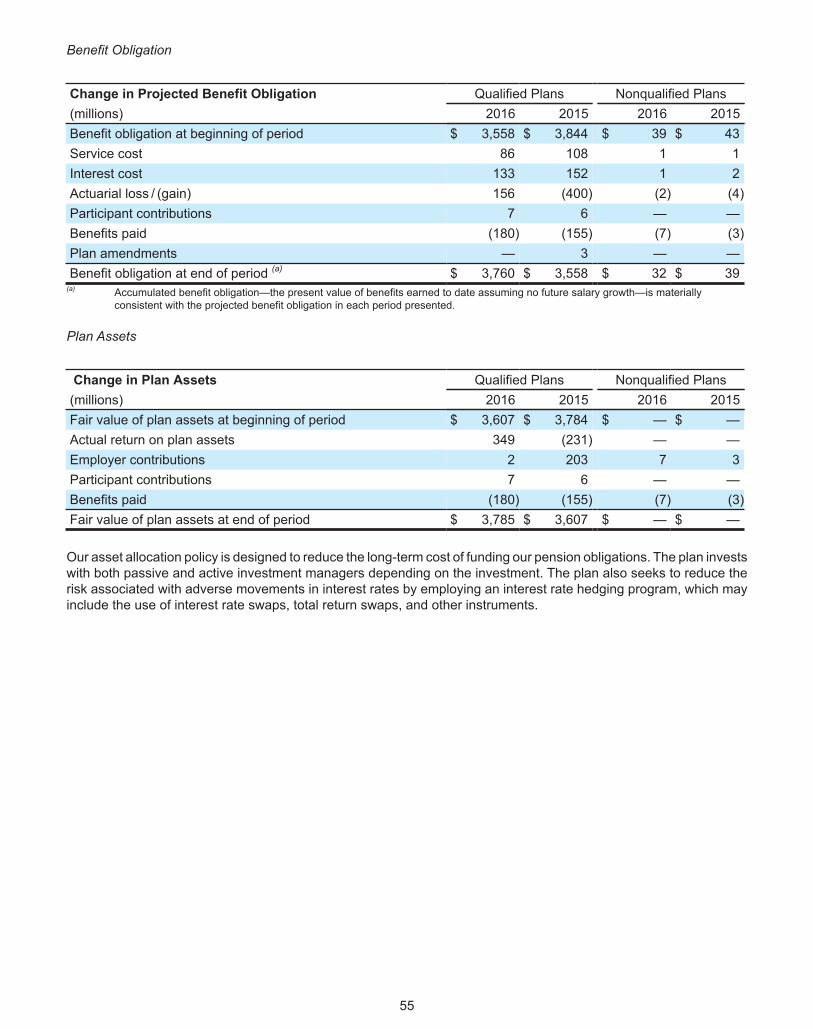
Benefit Obligation
Change in Projected Benefit Obligation Qualified Plans Nonqualified Plans(millions) 2016 2015 2016 2015Benefit obligation at beginning of period $ 3,558 $ 3,844 $ 39 $ 43Service cost 86 108 1 1Interest cost 133 152 1 2Actuarial loss / (gain) 156 (400) (2) (4)Participant contributions 7 6 — —Benefits paid (180) (155) (7) (3)Plan amendments — 3 — —Benefit obligation at end of period (a) $ 3,760 $ 3,558 $ 32 $ 39
(a) Accumulated benefit obligation—the present value of benefits earned to date assuming no future salary growth—is materiallyconsistent with the projected benefit obligation in each period presented.
Plan Assets
Change in Plan Assets Qualified Plans Nonqualified Plans(millions) 2016 2015 2016 2015Fair value of plan assets at beginning of period $ 3,607 $ 3,784 $ — $ —Actual return on plan assets 349 (231) — —Employer contributions 2 203 7 3Participant contributions 7 6 — —Benefits paid (180) (155) (7) (3)Fair value of plan assets at end of period $ 3,785 $ 3,607 $ — $ —
Our asset allocation policy is designed to reduce the long-term cost of funding our pension obligations. The plan investswith both passive and active investment managers depending on the investment. The plan also seeks to reduce therisk associated with adverse movements in interest rates by employing an interest rate hedging program, which mayinclude the use of interest rate swaps, total return swaps, and other instruments.
55
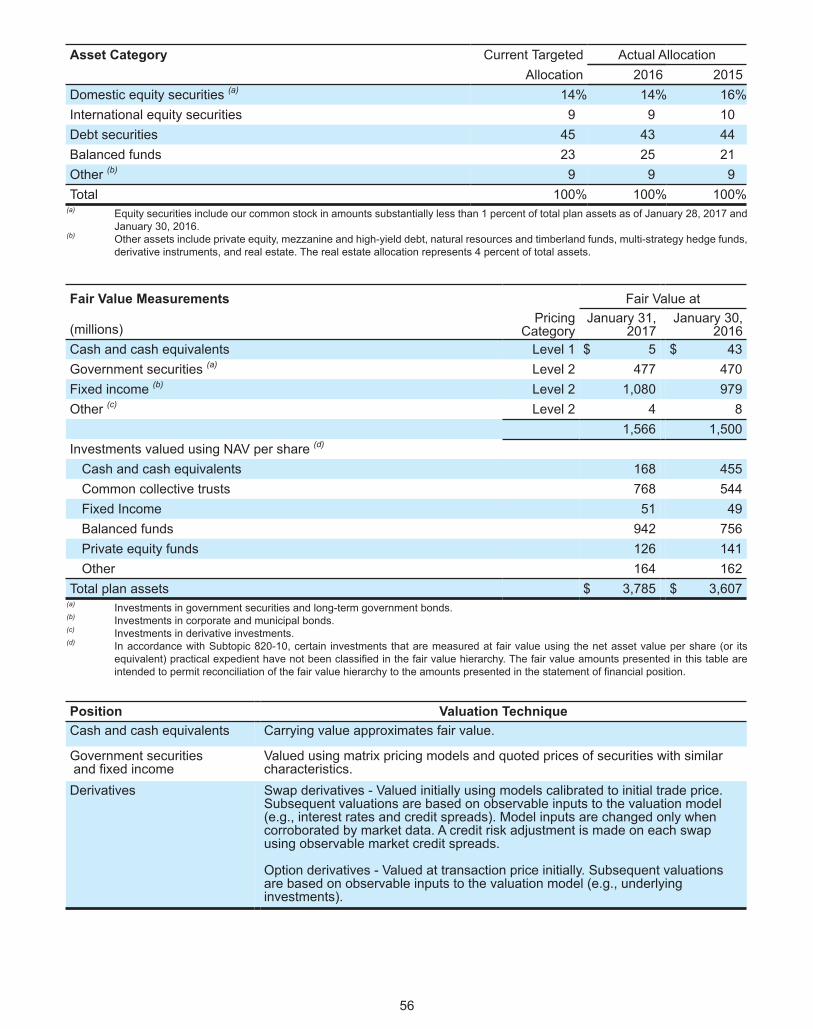
Asset Category Current Targeted Actual AllocationAllocation 2016 2015
Domestic equity securities (a) 14% 14% 16%International equity securities 9 9 10Debt securities 45 43 44Balanced funds 23 25 21Other (b) 9 9 9Total 100% 100% 100%
(a) Equity securities include our common stock in amounts substantially less than 1 percent of total plan assets as of January 28, 2017 andJanuary 30, 2016.
(b) Other assets include private equity, mezzanine and high-yield debt, natural resources and timberland funds, multi-strategy hedge funds,derivative instruments, and real estate. The real estate allocation represents 4 percent of total assets.
Fair Value Measurements Fair Value at
(millions)Pricing
CategoryJanuary 31,
2017January 30,
2016Cash and cash equivalents Level 1 $ 5 $ 43Government securities (a) Level 2 477 470Fixed income (b) Level 2 1,080 979Other (c) Level 2 4 8
1,566 1,500Investments valued using NAV per share (d)
Cash and cash equivalents 168 455Common collective trusts 768 544Fixed Income 51 49Balanced funds 942 756Private equity funds 126 141Other 164 162
Total plan assets $ 3,785 $ 3,607(a) Investments in government securities and long-term government bonds.(b) Investments in corporate and municipal bonds.(c) Investments in derivative investments.(d) In accordance with Subtopic 820-10, certain investments that are measured at fair value using the net asset value per share (or its
equivalent) practical expedient have not been classified in the fair value hierarchy. The fair value amounts presented in this table areintended to permit reconciliation of the fair value hierarchy to the amounts presented in the statement of financial position.
Position Valuation TechniqueCash and cash equivalents Carrying value approximates fair value.
Government securities and fixed income
Valued using matrix pricing models and quoted prices of securities with similarcharacteristics.
Derivatives Swap derivatives - Valued initially using models calibrated to initial trade price.Subsequent valuations are based on observable inputs to the valuation model(e.g., interest rates and credit spreads). Model inputs are changed only whencorroborated by market data. A credit risk adjustment is made on each swapusing observable market credit spreads.
Option derivatives - Valued at transaction price initially. Subsequent valuationsare based on observable inputs to the valuation model (e.g., underlyinginvestments).
56
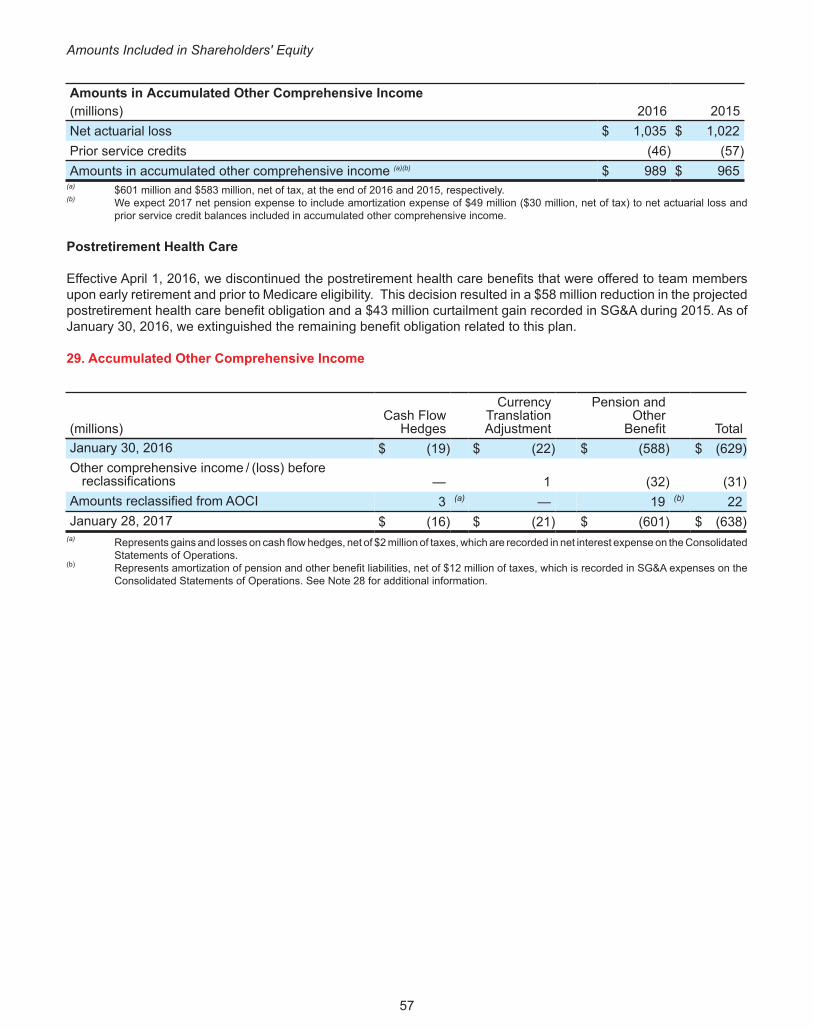
Amounts Included in Shareholders' Equity
Amounts in Accumulated Other Comprehensive Income(millions) 2016 2015Net actuarial loss $ 1,035 $ 1,022Prior service credits (46) (57)Amounts in accumulated other comprehensive income (a)(b) $ 989 $ 965
(a) $601 million and $583 million, net of tax, at the end of 2016 and 2015, respectively. (b) We expect 2017 net pension expense to include amortization expense of $49 million ($30 million, net of tax) to net actuarial loss and
prior service credit balances included in accumulated other comprehensive income.
Postretirement Health Care
Effective April 1, 2016, we discontinued the postretirement health care benefits that were offered to team membersupon early retirement and prior to Medicare eligibility. This decision resulted in a $58 million reduction in the projectedpostretirement health care benefit obligation and a $43 million curtailment gain recorded in SG&A during 2015. As ofJanuary 30, 2016, we extinguished the remaining benefit obligation related to this plan.
57
29. Accumulated Other Comprehensive Income
(millions)Cash Flow
Hedges
CurrencyTranslationAdjustment
Pension andOther
Benefit TotalJanuary 30, 2016 $ (19) $ (22) $ (588) $ (629)Other comprehensive income / (loss) before
reclassifications — 1 (32) (31)Amounts reclassified from AOCI 3 (a) — 19 (b) 22January 28, 2017 $ (16) $ (21) $ (601) $ (638)
(a) Represents gains and losses on cash flow hedges, net of $2 million of taxes, which are recorded in net interest expense on the ConsolidatedStatements of Operations.
(b) Represents amortization of pension and other benefit liabilities, net of $12 million of taxes, which is recorded in SG&A expenses on theConsolidated Statements of Operations. See Note 28 for additional information.
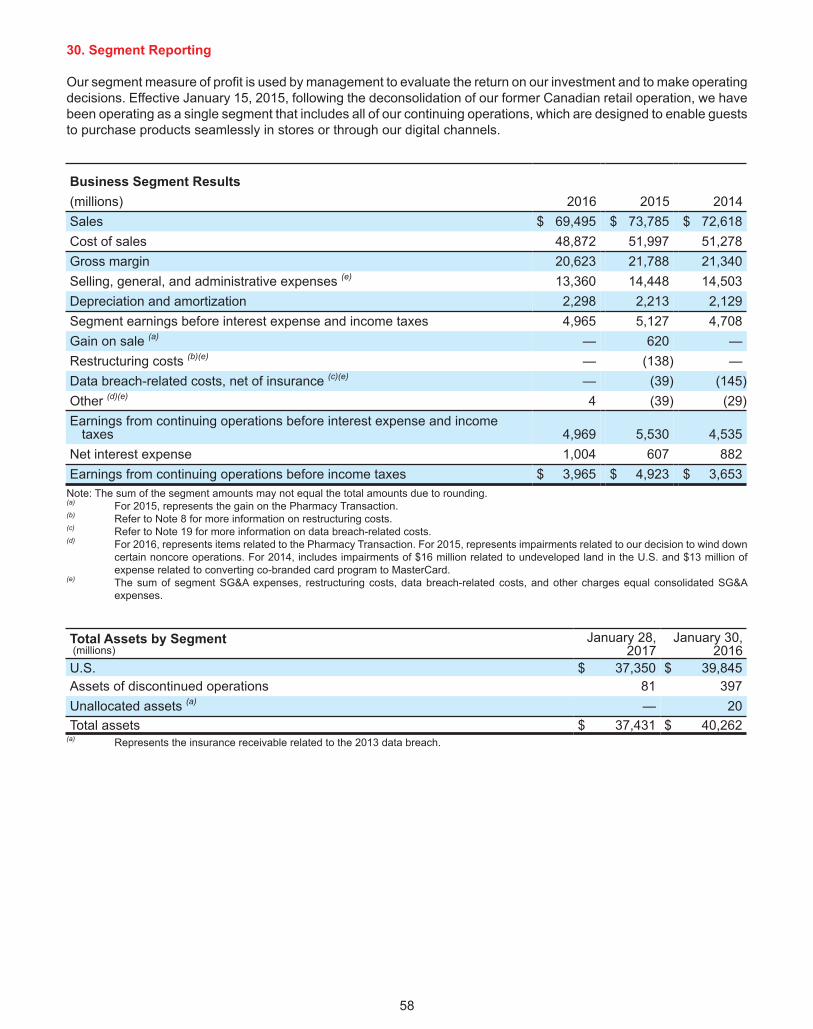
30. Segment Reporting
Our segment measure of profit is used by management to evaluate the return on our investment and to make operatingdecisions. Effective January 15, 2015, following the deconsolidation of our former Canadian retail operation, we havebeen operating as a single segment that includes all of our continuing operations, which are designed to enable gueststo purchase products seamlessly in stores or through our digital channels.
Business Segment Results2016 2015 2014(millions)
Sales $ 69,495 $ 73,785 $ 72,618Cost of sales 48,872 51,997 51,278Gross margin 20,623 21,788 21,340Selling, general, and administrative expenses (e) 13,360 14,448 14,503Depreciation and amortization 2,298 2,213 2,129Segment earnings before interest expense and income taxes 4,965 5,127 4,708Gain on sale (a) — 620 —Restructuring costs (b)(e) — (138) —Data breach-related costs, net of insurance (c)(e) — (39) (145)Other (d)(e) 4 (39) (29)Earnings from continuing operations before interest expense and income
taxes 4,969 5,530 4,535Net interest expense 1,004 607 882Earnings from continuing operations before income taxes $ 3,965 $ 4,923 $ 3,653
Note: The sum of the segment amounts may not equal the total amounts due to rounding.(a) For 2015, represents the gain on the Pharmacy Transaction. (b) Refer to Note 8 for more information on restructuring costs.(c) Refer to Note 19 for more information on data breach-related costs.(d) For 2016, represents items related to the Pharmacy Transaction. For 2015, represents impairments related to our decision to wind down
certain noncore operations. For 2014, includes impairments of $16 million related to undeveloped land in the U.S. and $13 million ofexpense related to converting co-branded card program to MasterCard.
(e) The sum of segment SG&A expenses, restructuring costs, data breach-related costs, and other charges equal consolidated SG&Aexpenses.
Total Assets by Segment (millions)
January 28, 2017
January 30, 2016
U.S. $ 37,350 $ 39,845Assets of discontinued operations 81 397Unallocated assets (a) — 20Total assets $ 37,431 $ 40,262
(a) Represents the insurance receivable related to the 2013 data breach.
58
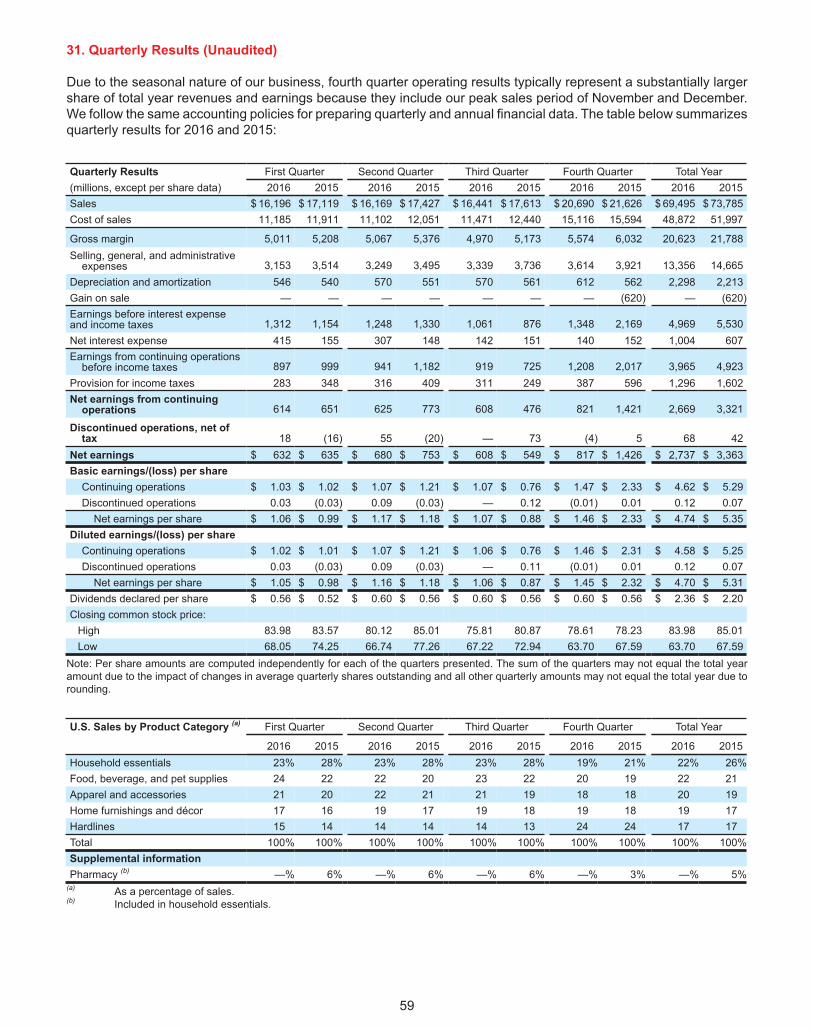
31. Quarterly Results (Unaudited)
Due to the seasonal nature of our business, fourth quarter operating results typically represent a substantially largershare of total year revenues and earnings because they include our peak sales period of November and December.We follow the same accounting policies for preparing quarterly and annual financial data. The table below summarizesquarterly results for 2016 and 2015:
Quarterly Results First Quarter Second Quarter Third Quarter Fourth Quarter Total Year(millions, except per share data) 2016 2015 2016 2015 2016 2015 2016 2015 2016 2015Sales $ 16,196 $ 17,119 $ 16,169 $ 17,427 $ 16,441 $ 17,613 $ 20,690 $ 21,626 $ 69,495 $ 73,785Cost of sales 11,185 11,911 11,102 12,051 11,471 12,440 15,116 15,594 48,872 51,997
Gross margin 5,011 5,208 5,067 5,376 4,970 5,173 5,574 6,032 20,623 21,788Selling, general, and administrative
expenses 3,153 3,514 3,249 3,495 3,339 3,736 3,614 3,921 13,356 14,665Depreciation and amortization 546 540 570 551 570 561 612 562 2,298 2,213Gain on sale — — — — — — — (620) — (620)Earnings before interest expenseand income taxes 1,312 1,154 1,248 1,330 1,061 876 1,348 2,169 4,969 5,530Net interest expense 415 155 307 148 142 151 140 152 1,004 607Earnings from continuing operations
before income taxes 897 999 941 1,182 919 725 1,208 2,017 3,965 4,923Provision for income taxes 283 348 316 409 311 249 387 596 1,296 1,602Net earnings from continuing
operations 614 651 625 773 608 476 821 1,421 2,669 3,321
Discontinued operations, net oftax 18 (16) 55 (20) — 73 (4) 5 68 42
Net earnings $ 632 $ 635 $ 680 $ 753 $ 608 $ 549 $ 817 $ 1,426 $ 2,737 $ 3,363Basic earnings/(loss) per share
Continuing operations $ 1.03 $ 1.02 $ 1.07 $ 1.21 $ 1.07 $ 0.76 $ 1.47 $ 2.33 $ 4.62 $ 5.29Discontinued operations 0.03 (0.03) 0.09 (0.03) — 0.12 (0.01) 0.01 0.12 0.07
Net earnings per share $ 1.06 $ 0.99 $ 1.17 $ 1.18 $ 1.07 $ 0.88 $ 1.46 $ 2.33 $ 4.74 $ 5.35Diluted earnings/(loss) per share
Continuing operations $ 1.02 $ 1.01 $ 1.07 $ 1.21 $ 1.06 $ 0.76 $ 1.46 $ 2.31 $ 4.58 $ 5.25Discontinued operations 0.03 (0.03) 0.09 (0.03) — 0.11 (0.01) 0.01 0.12 0.07
Net earnings per share $ 1.05 $ 0.98 $ 1.16 $ 1.18 $ 1.06 $ 0.87 $ 1.45 $ 2.32 $ 4.70 $ 5.31Dividends declared per share $ 0.56 $ 0.52 $ 0.60 $ 0.56 $ 0.60 $ 0.56 $ 0.60 $ 0.56 $ 2.36 $ 2.20Closing common stock price:
High 83.98 83.57 80.12 85.01 75.81 80.87 78.61 78.23 83.98 85.01Low 68.05 74.25 66.74 77.26 67.22 72.94 63.70 67.59 63.70 67.59
Note: Per share amounts are computed independently for each of the quarters presented. The sum of the quarters may not equal the total yearamount due to the impact of changes in average quarterly shares outstanding and all other quarterly amounts may not equal the total year due torounding.
U.S. Sales by Product Category (a) First Quarter Second Quarter Third Quarter Fourth Quarter Total Year
2016 2015 2016 2015 2016 2015 2016 2015 2016 2015Household essentials 23% 28% 23% 28% 23% 28% 19% 21% 22% 26%Food, beverage, and pet supplies 24 22 22 20 23 22 20 19 22 21Apparel and accessories 21 20 22 21 21 19 18 18 20 19Home furnishings and décor 17 16 19 17 19 18 19 18 19 17Hardlines 15 14 14 14 14 13 24 24 17 17Total 100% 100% 100% 100% 100% 100% 100% 100% 100% 100%Supplemental informationPharmacy (b) —% 6% —% 6% —% 6% —% 3% —% 5%
(a) As a percentage of sales.(b) Included in household essentials.
59
Item 9. Changes in and Disagreements with Accountants on Accounting and Financial Disclosure
Not applicable.
60
Item 9A. Controls and Procedures
Changes in Internal Control Over Financial Reporting
There have been no changes in our internal control over financial reporting during the most recently completedfiscal quarter that have materially affected, or are reasonably likely to materially affect, our internal control overfinancial reporting.
Evaluation of Disclosure Controls and Procedures
As of the end of the period covered by this Annual Report, we conducted an evaluation, under supervision and withthe participation of management, including the chief executive officer and chief financial officer, of the effectivenessof the design and operation of our disclosure controls and procedures pursuant to Rules 13a-15 and 15d-15 of theSecurities Exchange Act of 1934, as amended (Exchange Act). Based upon that evaluation, our chief executive officerand chief financial officer concluded that our disclosure controls and procedures are effective. Disclosure controls andprocedures are defined by Rules 13a-15(e) and 15d-15(e) of the Exchange Act as controls and other procedures thatare designed to ensure that information required to be disclosed by us in reports filed with the SEC under the ExchangeAct is recorded, processed, summarized and reported within the time periods specified in the SEC's rules and forms.Disclosure controls and procedures include, without limitation, controls and procedures designed to ensure thatinformation required to be disclosed by us in reports filed under the Exchange Act is accumulated and communicatedto our management, including our principal executive and principal financial officers, or persons performing similarfunctions, as appropriate, to allow timely decisions regarding required disclosure.
For the Report of Management on Internal Control and the Report of Independent Registered Public Accounting Firmon Internal Control over Financial Reporting, see Item 8, Financial Statements and Supplementary Data.
Item 9B. Other Information
Not applicable.
PART III
Certain information required by Part III is incorporated by reference from Target's definitive Proxy Statement to be filedon or about May 1, 2017. Except for those portions specifically incorporated in this Form 10-K by reference to Target'sProxy Statement, no other portions of the Proxy Statement are deemed to be filed as part of this Form 10-K.
Item 10. Directors, Executive Officers and Corporate Governance
The following sections of Target's Proxy Statement to be filed on or about May 1, 2017, are incorporated herein byreference:
• Item One--Election of Directors• Stock Ownership Information--Section 16(a) Beneficial Ownership Reporting Compliance• General Information About Corporate Governance and the Board of Directors
◦ Business Ethics and Conduct◦ Committees
• Questions and Answers About Our Annual Meeting and Voting--Question 14
See also Item 4A, Executive Officers of Part I hereof.
Item 11. Executive Compensation
The following sections of Target's Proxy Statement to be filed on or about May 1, 2017, are incorporated herein byreference:
• Compensation Discussion and Analysis• Compensation Tables• Human Resources & Compensation Committee Report
61
Item 12. Security Ownership of Certain Beneficial Owners and Management and Related Stockholder Matters
The following sections of Target's Proxy Statement to be filed on or about May 1, 2017, are incorporated herein byreference:
• Stock Ownership Information--◦ Beneficial Ownership of Directors and Officers◦ Beneficial Ownership of Target’s Largest Shareholders
• Compensation Tables--Equity Compensation Plan Information
Item 13. Certain Relationships and Related Transactions, and Director Independence
The following sections of Target's Proxy Statement to be filed on or about May 1, 2017, are incorporated herein byreference:
• General Information About Corporate Governance and the Board of Directors--◦ Policy on Transactions with Related Persons◦ Director Independence◦ Committees
Item 14. Principal Accountant Fees and Services
The following section of Target's Proxy Statement to be filed on or about May 1, 2017, is incorporated herein byreference:
• Item Two-- Ratification of Appointment of Ernst & Young LLP As Independent Registered Public AccountingFirm-Audit and Non-Audit Fees
PART IV
62
Item 15. Exhibits, Financial Statement Schedules
The following information required under this item is filed as part of this report:
a) Financial Statements
• Consolidated Statements of Operations for the Years Ended January 28, 2017, January 30, 2016, andJanuary 31, 2015
• Consolidated Statements of Comprehensive Income for the Years Ended January 28, 2017, January 30,2016, and January 31, 2015
• Consolidated Statements of Financial Position at January 28, 2017 and January 30, 2016• Consolidated Statements of Cash Flows for the Years Ended January 28, 2017, January 30, 2016, and
January 31, 2015• Consolidated Statements of Shareholders' Investment for the Years Ended January 28, 2017, January 30,
2016, and January 31, 2015• Notes to Consolidated Financial Statements• Report of Independent Registered Public Accounting Firm on Consolidated Financial Statements
Financial Statement Schedules
None.
Other schedules have not been included either because they are not applicable or because the information isincluded elsewhere in this Report.
b) Exhibits
(2)A † Asset Purchase Agreement dated June 12, 2015 between Target Corporation and CVS Pharmacy,Inc. (1)
(3)A Amended and Restated Articles of Incorporation (as amended through June 9, 2010) (2)B Bylaws (as amended through November 11, 2015) (3)
(4)A Indenture, dated as of August 4, 2000 between Target Corporation and Bank One Trust Company,N.A. (4)
B First Supplemental Indenture dated as of May 1, 2007 to Indenture dated as of August 4, 2000between Target Corporation and The Bank of New York Trust Company, N.A. (as successor ininterest to Bank One Trust Company N.A.) (5)
C Target agrees to furnish to the Commission on request copies of other instruments with respect tolong-term debt.
(10)A * Target Corporation Officer Short-Term Incentive Plan (6)B * Target Corporation Long-Term Incentive Plan (as amended and restated effective June 8, 2011) (7)C * Amended and Restated Target Corporation 2011 Long-Term Incentive Plan (8)D * Target Corporation SPP I (2016 Plan Statement) (as amended and restated effective April 3, 2016)
(9)E * Target Corporation SPP II (2016 Plan Statement) (as amended and restated effective April 3,
2016) (10)F * Target Corporation SPP III (2014 Plan Statement) (as amended and restated effective January 1,
2014) (11)G * Amendment to Target Corporation SPP III (2014 Plan Statement) (effective April 3, 2016) (12)H * Target Corporation Officer Deferred Compensation Plan (as amended and restated effective
June 8, 2011) (13)I * Target Corporation Officer EDCP (2017 Plan Statement) (as amended and restated effective May
1, 2017)J * Target Corporation Deferred Compensation Plan Directors (14)K * Target Corporation DDCP (2013 Plan Statement) (as amended and restated effective December 1,
2013) (15)L * Target Corporation Officer Income Continuance Policy Statement (as amended and restated
effective April 3, 2016) (16)M * Target Corporation Executive Excess Long Term Disability Plan (as restated effective January 1,
2010 (17)N * Director Retirement Program (18)O * Target Corporation Deferred Compensation Trust Agreement (as amended and restated effective
January 1, 2009) (19)P * Amendment to Target Corporation Deferred Compensation Trust Agreement (as amended and
restated effective January 1, 2009) (20)Q * Form of Amended and Restated Executive Non-Qualified Stock Option Agreement (21)R * Form of Executive Restricted Stock Unit Agreement - Cliff Vesting (22)S * Form of Executive Restricted Stock Unit Agreement - Ratable VestingT * Form of Executive Performance-Based Restricted Stock Unit Agreement (23)U * Form of Executive Performance Share Unit AgreementV * Form of Non-Employee Director Non-Qualified Stock Option Agreement (24)W * Form of Non-Employee Director Restricted Stock Unit Agreement (25)X * Form of Cash Retention Award (26)Y Five-Year Credit Agreement dated as of October 5, 2016 among Target Corporation, Bank of
America, N.A. as Administrative Agent and the Banks listed therein (27)Z ‡ Credit Card Program Agreement dated October 22, 2012 among Target Corporation, Target
Enterprise, Inc. and TD Bank USA, N.A. (28)
63
Copies of exhibits will be furnished upon written request and payment of Registrant's reasonable expenses in furnishingthe exhibits._____________________________________________________________________
† Excludes the Seller Disclosure Schedule, Exhibits B through G and Schedules I and II referred to in the agreement which Target Corporationagrees to furnish supplementally to the Securities and Exchange Commission upon request. Exhibit A is separately filed as Exhibit (10)BB.
‡ Certain portions of this exhibit have been omitted pursuant to a request for confidential treatment and have been filed separately with theSecurities and Exchange Commission.
* Management contract or compensation plan or arrangement required to be filed as an exhibit to this Form 10-K.(1) Incorporated by reference to Exhibit (2)H to Target's Form 10-Q Report for the quarter ended August 1, 2015.(2) Incorporated by reference to Exhibit (3)A to Target's Form 8-K Report filed June 10, 2010.(3) Incorporated by reference to Exhibit (3)A to Target's Form 8-K Report filed November 12, 2015.(4) Incorporated by reference to Exhibit 4.1 to Target's Form 8-K Report filed August 10, 2000.(5) Incorporated by reference to Exhibit 4.1 to the Registrant's Form 8-K Report filed May 1, 2007.(6) Incorporated by reference to Appendix A to the Registrant's Proxy Statement filed April 30, 2012.(7) Incorporated by reference to Exhibit (10)B to Target's Form 10-Q Report for the quarter ended July 30, 2011.(8) Incorporated by reference to Exhibit (10)JJ to Target's Form 8-K Report filed June 12, 2015.(9) Incorporated by reference to Exhibit (10)C to Target's Form 10-Q Report for the quarter ended April 30, 2016.(10) Incorporated by reference to Exhibit (10)D to Target's Form 10-Q Report for the quarter ended April 30, 2016.(11) Incorporated by reference to Exhibit (10)E to Target's Form 10-K Report for the year ended February 1, 2014.(12) Incorporated by reference to Exhibit (10)NN to Target's Form 10-Q Report for the quarter ended April 30, 2016.
AA ‡ First Amendment dated February 24, 2015 to Credit Card Program Agreement among TargetCorporation, Target Enterprise, Inc. and TD Bank USA, N.A. (29)
BB ‡ Pharmacy Operating Agreement dated December 16, 2015 between Target Corporation and CVSPharmacy, Inc. (30)
CC ‡ First Amendment dated November 30, 2016 to Pharmacy Operating Agreement between TargetCorporation and CVS Pharmacy, Inc.
DD * Restricted Stock Unit Agreement with John J. Mulligan, effective as of May 22, 2014 (31)EE * Employment Offer Letter to Brian C. Cornell, dated July 26, 2014 (32)FF * Make-Whole Performance-Based Restricted Stock Unit Agreement with Brian C. Cornell, effective
as of August 21, 2014 (33)GG * Aircraft Time Sharing Agreement as of March 13, 2015 among Target Corporation and Brian C.
Cornell (34)HH * Advisory Role Letter to Timothy R. Baer dated July 11, 2016 (35)
II * Target Corporation Officer EDCP (2017 Plan Statement) (as amended and restated effectiveJanuary 1, 2017) (36)
(12) Statements of Computations of Ratios of Earnings to Fixed Charges(21) List of Subsidiaries(23) Consent of Independent Registered Public Accounting Firm(24) Powers of Attorney
(31)A Certification of the Chief Executive Officer Pursuant to Section 302 of the Sarbanes-Oxley Act of2002
(31)B Certification of the Chief Financial Officer Pursuant to Section 302 of the Sarbanes-Oxley Act of2002
(32)A Certification of the Chief Executive Officer Pursuant to Section 18 U.S.C. Section 1350 Pursuant toSection 906 of the Sarbanes-Oxley Act of 2002
(32)B Certification of the Chief Financial Officer Pursuant to Section 18 U.S.C. Section 1350 Pursuant toSection 906 of the Sarbanes-Oxley Act of 2002
101.INS XBRL Instance Document101.SCH XBRL Taxonomy Extension Schema101.CAL XBRL Taxonomy Extension Calculation Linkbase101.DEF XBRL Taxonomy Extension Definition Linkbase101.LAB XBRL Taxonomy Extension Label Linkbase101.PRE XBRL Taxonomy Extension Presentation Linkbase
64
(13) Incorporated by reference to Exhibit (10)F to Target's Form 10-Q Report for the quarter ended July 30, 2011.(14) Incorporated by reference to Exhibit (10)I to Target's Form 10-K Report for the year ended February 3, 2007.(15) Incorporated by reference to Exhibit (10)I to Target's Form 10-K Report for the year ended February 1, 2014.(16) Incorporated by reference to Exhibit (10)J to Target's Form 10-Q Report for the quarter ended April 30, 2016.(17) Incorporated by reference to Exhibit (10)A to Target's Form 10-Q Report for the quarter ended October 30, 2010.(18) Incorporated by reference to Exhibit (10)O to Target's Form 10-K Report for the year ended January 29, 2005.(19) Incorporated by reference to Exhibit (10)O to Target's Form 10-K Report for the year ended January 31, 2009.(20) Incorporated by reference to Exhibit (10)AA to Target's Form 10-Q Report for the quarter ended July 30, 2011.(21) Incorporated by reference to Exhibit (10)V to Target's Form 10-K Report for the year ended January 31, 2015.(22) Incorporated by reference to Exhibit (10)W to Target's Form 10-K Report for the year ended January 30, 2016.(23) Incorporated by reference to Exhibit (10)X to Target's Form 10-K Report for the year ended January 30, 2016.(24) Incorporated by reference to Exhibit (10)EE to Target's Form 8-K Report filed January 11, 2012.(25) Incorporated by reference to Exhibit (10)AA to Target's Form 10-K Report for the year ended January 30, 2016.(26) Incorporated by reference to Exhibit (10)W to Target’s Form 10-K Report for year ended February 2, 2013.(27) Incorporated by reference to Exhibit (10)O to Target's Form 10-Q Report for the quarter ended October 29, 2016.(28) Incorporated by reference to Exhibit (10)X to Target's Form 10-Q/A Report for the quarter ended May 4, 2013.(29) Incorporated by reference to Exhibit (10)II to Target's Form 10-Q Report for the quarter ended May 2, 2015.(30) Incorporated by reference to Exhibit (10)KK to Target's Form 10-K Report for the year ended January 30, 2016.(31) Incorporated by reference to Exhibit (10)BB to Target's Form 10-Q Report for the quarter ended August 2, 2014.(32) Incorporated by reference to Exhibit (10)CC to Target's Form 10-Q Report for the quarter ended August 2, 2014.(33) Incorporated by reference to Exhibit (10)EE to Target's Form 10-Q Report for the quarter ended August 2, 2014.(34) Incorporated by reference to Exhibit (10)HH to Target's Form 10-K Report for the year ended January 31, 2015.(35) Incorporated by reference to Exhibit (10)OO to Target's Form 10-Q Report for the quarter ended July 30, 2016.(36) Incorporated by reference to Exhibit (10)G to Target's 10-Q Report for the quarter ended October 29, 2016.
65
SIGNATURES
Pursuant to the requirements of Section 13 or 15(d) of the Securities Exchange Act of 1934, Target has duly causedthis report to be signed on its behalf by the undersigned, thereunto duly authorized.
TARGET CORPORATIONBy:
Dated: March 8, 2017Cathy R. Smith
Executive Vice President and Chief Financial Officer___________________________________________________________________________________________________________________
Pursuant to the requirements of the Securities Exchange Act of 1934, the report has been signed below by the followingpersons on behalf of Target and in the capacities and on the dates indicated.
Dated: March 8, 2017Brian C. Cornell
Chairman of the Board and Chief Executive Officer
Dated: March 8, 2017Cathy R. Smith
Executive Vice President and Chief Financial Officer
Dated: March 8, 2017
Robert M. Harrison Senior Vice President, Chief Accounting Officer
and Controller
ROXANNE S. AUSTINDOUGLAS M. BAKER, JR.CALVIN DARDENHENRIQUE DE CASTROROBERT L. EDWARDSMELANIE L. HEALEY
DONALD R. KNAUSSMONICA C. LOZANOMARY E. MINNICKANNE M. MULCAHYDERICA W. RICEKENNETH L. SALAZAR Constituting a majority of the Board of Directors
66

Cathy R. Smith, by signing her name hereto, does hereby sign this document pursuant to powers of attorney dulyexecuted by the Directors named, filed with the Securities and Exchange Commission on behalf of such Directors, allin the capacities and on the date stated.
By:
Dated: March 8, 2017Cathy R. SmithAttorney-in-fact
67
Exhibit Index
Exhibit Description Manner of Filing(2)A Asset Purchase Agreement dated June 12, 2015 between Target
Corporation and CVS Pharmacy, Inc.Incorporated by Reference
(3)A Amended and Restated Articles of Incorporation (as amended June 9,2010)
Incorporated by Reference
(3)B Bylaws (as amended through November 11, 2015) Incorporated by Reference(4)A Indenture, dated as of August 4, 2000 between Target Corporation and
Bank One Trust Company, N.A.Incorporated by Reference
(4)B First Supplemental Indenture dated as of May 1, 2007 to Indenture datedas of August 4, 2000 between Target Corporation and The Bank of NewYork Trust Company, N.A. (as successor in interest to Bank One TrustCompany N.A.)
Incorporated by Reference
(4)C Target agrees to furnish to the Commission on request copies of otherinstruments with respect to long-term debt.
Filed Electronically
(10)A Target Corporation Officer Short-Term Incentive Plan Incorporated by Reference(10)B Target Corporation Long-Term Incentive Plan (as amended and restated
effective June 8, 2011)Incorporated by Reference
(10)C Amended and Restated Target Corporation 2011 Long-Term IncentivePlan
Incorporated by Reference
(10)D Target Corporation SPP I (2016 Plan Statement) (as amended andrestated effective April 3, 2016)
Incorporated by Reference
(10)E Target Corporation SPP II (2016 Plan Statement) (as amended andrestated effective April 3, 2016)
Incorporated by Reference
(10)F Target Corporation SPP III (2014 Plan Statement) (as amended andrestated effective January 1, 2014)
Incorporated by Reference
(10)G Amendment to Target Corporation SPP III (2014 Plan Statement)(effective April 3, 2016)
Incorporated by Reference
(10)H Target Corporation Officer Deferred Compensation Plan (as amended andrestated effective June 8, 2011)
Incorporated by Reference
(10)I Target Corporation Officer EDCP (2017 Plan Statement) (as amended andrestated effective May 1, 2017)
Filed Electronically
(10)J Target Corporation Deferred Compensation Plan Directors Incorporated by Reference(10)K Target Corporation DDCP (2013 Plan Statement) (as amended and
restated effective December 1, 2013)Incorporated by Reference
(10)L Target Corporation Officer Income Continuance Policy Statement (asamended and restated effective April 3, 2016)
Incorporated by Reference
(10)M Target Corporation Executive Excess Long Term Disability Plan (asrestated effective January 1, 2010)
Incorporated by Reference
(10)N Director Retirement Program Incorporated by Reference(10)O Target Corporation Deferred Compensation Trust Agreement (as
amended and restated effective January 1, 2009)Incorporated by Reference
(10)P Amendment to Target Corporation Deferred Compensation TrustAgreement (as amended and restated effective January 1, 2009)
Incorporated by Reference
(10)Q Form of Amended and Restated Executive Non-Qualified Stock OptionAgreement
Incorporated by Reference
(10)R Form of Executive Restricted Stock Unit Agreement - Cliff Vesting Incorporated by Reference(10)S Form of Executive Restricted Stock Unit Agreement - Ratable Vesting Filed Electronically(10)T Form of Executive Performance-Based Restricted Stock Unit Agreement Incorporated by Reference(10)U Form of Executive Performance Share Unit Agreement Filed Electronically(10)V Form of Non-Employee Director Non-Qualified Stock Option Agreement Incorporated by Reference(10)W Form of Non-Employee Director Restricted Stock Unit Agreement Incorporated by Reference
68
(10)X Form of Cash Retention Award Incorporated by Reference(10)Y Five-Year Credit Agreement dated as of October 5, 2016 among Target
Corporation, Bank of America, N.A. as Administrative Agent and theBanks listed therein
Incorporated by Reference
(10)Z Credit Card Program Agreement dated October 22, 2012 among TargetCorporation, Target Enterprise, Inc. and TD Bank USA, N.A.
Incorporated by Reference
(10)AA First Amendment dated February 24, 2015 to Credit Card ProgramAgreement among Target Corporation, Target Enterprise, Inc. and TDBank USA, N.A.
Incorporated by Reference
(10)BB Pharmacy Operating Agreement dated December 16, 2015 betweenTarget Corporation and CVS Pharmacy, Inc.
Incorporated by Reference
(10)CC First Amendment dated November 30, 2016 to Pharmacy OperatingAgreement between Target Corporation and CVS Pharmacy, Inc.
Filed Electronically
(10)DD Restricted Stock Unit Agreement with John J. Mulligan, effective as of May22, 2014
Incorporated by Reference
(10)EE Employment Offer Letter to Brian C. Cornell, dated July 26, 2014 Incorporated by Reference(10)FF Make-Whole Performance-Based Restricted Stock Unit Agreement with
Brian C. Cornell, effective as of August 21, 2014Incorporated by Reference
(10)GG Aircraft Time Sharing Agreement as of March 13, 2015 among TargetCorporation and Brian C. Cornell
Incorporated by Reference
(10)HH Advisory Role Letter to Timothy R. Baer dated July 11, 2016 Incorporated by Reference(10)II Target Corporation Officer EDCP (2017 Plan Statement) (as amended and
restated effective January 1, 2017)Incorporated by Reference
(12) Statements of Computations of Ratios of Earnings to Fixed Charges Filed Electronically(21) List of Subsidiaries Filed Electronically(23) Consent of Independent Registered Public Accounting Firm Filed Electronically(24) Powers of Attorney Filed Electronically(31)A Certification of the Chief Executive Officer Pursuant to Section 302 of the
Sarbanes-Oxley Act of 2002Filed Electronically
(31)B Certification of the Chief Financial Officer Pursuant to Section 302 of theSarbanes-Oxley Act of 2002
Filed Electronically
(32)A Certification of the Chief Executive Officer Pursuant to Section 18 U.S.C.Section 1350 Pursuant to Section 906 of the Sarbanes-Oxley Act of 2002
Filed Electronically
(32)B Certification of the Chief Financial Officer Pursuant to Section 18 U.S.C.Section 1350 Pursuant to Section 906 of the Sarbanes-Oxley Act of 2002
Filed Electronically
101.INS XBRL Instance Document Filed Electronically101.SCH XBRL Taxonomy Extension Schema Filed Electronically101.CAL XBRL Taxonomy Extension Calculation Linkbase Filed Electronically101.DEF XBRL Taxonomy Extension Definition Linkbase Filed Electronically101.LAB XBRL Taxonomy Extension Label Linkbase Filed Electronically101.PRE XBRL Taxonomy Extension Presentation Linkbase Filed Electronically
69
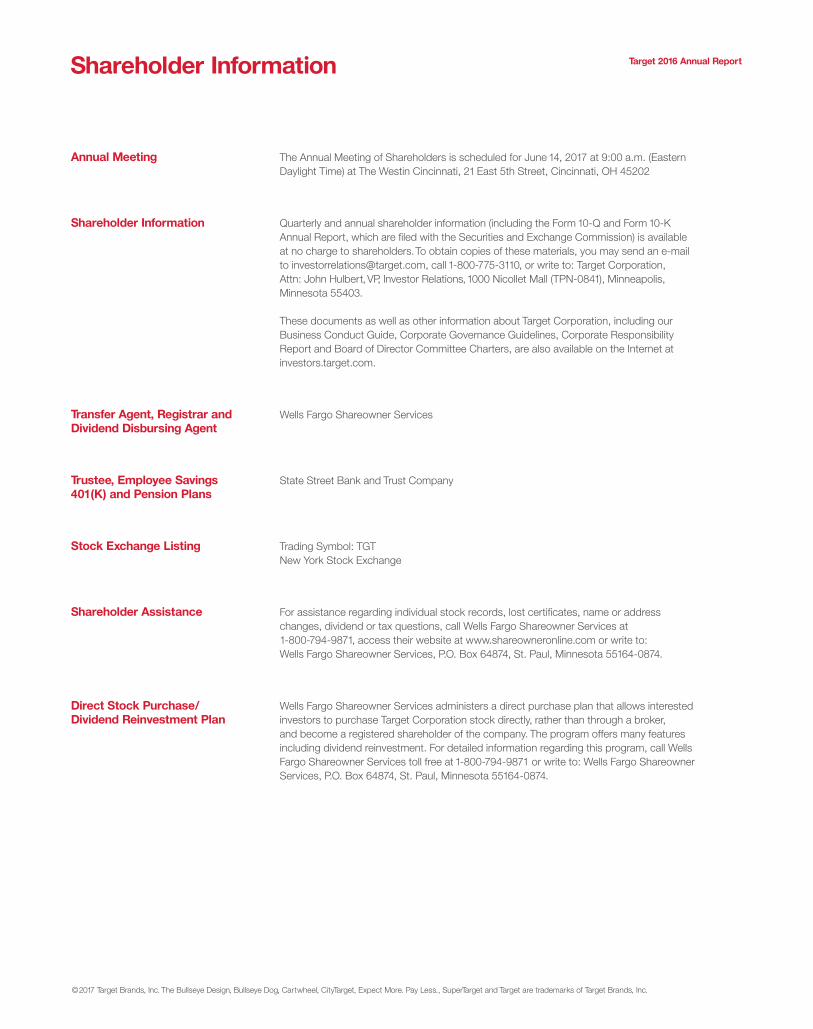
Shareholder Information Target 2016 Annual Report
Annual Meeting The Annual Meeting of Shareholders is scheduled for June 14, 2017 at 9:00 a.m. (Eastern Daylight Time) at The Westin Cincinnati, 21 East 5th Street, Cincinnati, OH 45202
Shareholder Information Quarterly and annual shareholder information (including the Form 10-Q and Form 10-K Annual Report, which are filed with the Securities and Exchange Commission) is available at no charge to shareholders. To obtain copies of these materials, you may send an e-mail to [email protected], call 1-800-775-3110, or write to: Target Corporation, Attn: John Hulbert, VP, Investor Relations, 1000 Nicollet Mall (TPN-0841), Minneapolis, Minnesota 55403. These documents as well as other information about Target Corporation, including our Business Conduct Guide, Corporate Governance Guidelines, Corporate Responsibility Report and Board of Director Committee Charters, are also available on the Internet at investors.target.com.
Transfer Agent, Registrar and Wells Fargo Shareowner Services Dividend Disbursing Agent
Trustee, Employee Savings State Street Bank and Trust Company 401(K) and Pension Plans
Stock Exchange Listing Trading Symbol: TGT New York Stock Exchange
Shareholder Assistance For assistance regarding individual stock records, lost certificates, name or address changes, dividend or tax questions, call Wells Fargo Shareowner Services at 1-800-794-9871, access their website at www.shareowneronline.com or write to: Wells Fargo Shareowner Services, P.O. Box 64874, St. Paul, Minnesota 55164-0874.
Direct Stock Purchase/ Dividend Reinvestment Plan
Wells Fargo Shareowner Services administers a direct purchase plan that allows interested investors to purchase Target Corporation stock directly, rather than through a broker, and become a registered shareholder of the company. The program offers many features including dividend reinvestment. For detailed information regarding this program, call Wells Fargo Shareowner Services toll free at 1-800-794-9871 or write to: Wells Fargo Shareowner Services, P.O. Box 64874, St. Paul, Minnesota 55164-0874.
©2017 Target Brands, Inc. The Bullseye Design, Bullseye Dog, Cartwheel, CityTarget, Expect More. Pay Less., SuperTarget and Target are trademarks of Target Brands, Inc.
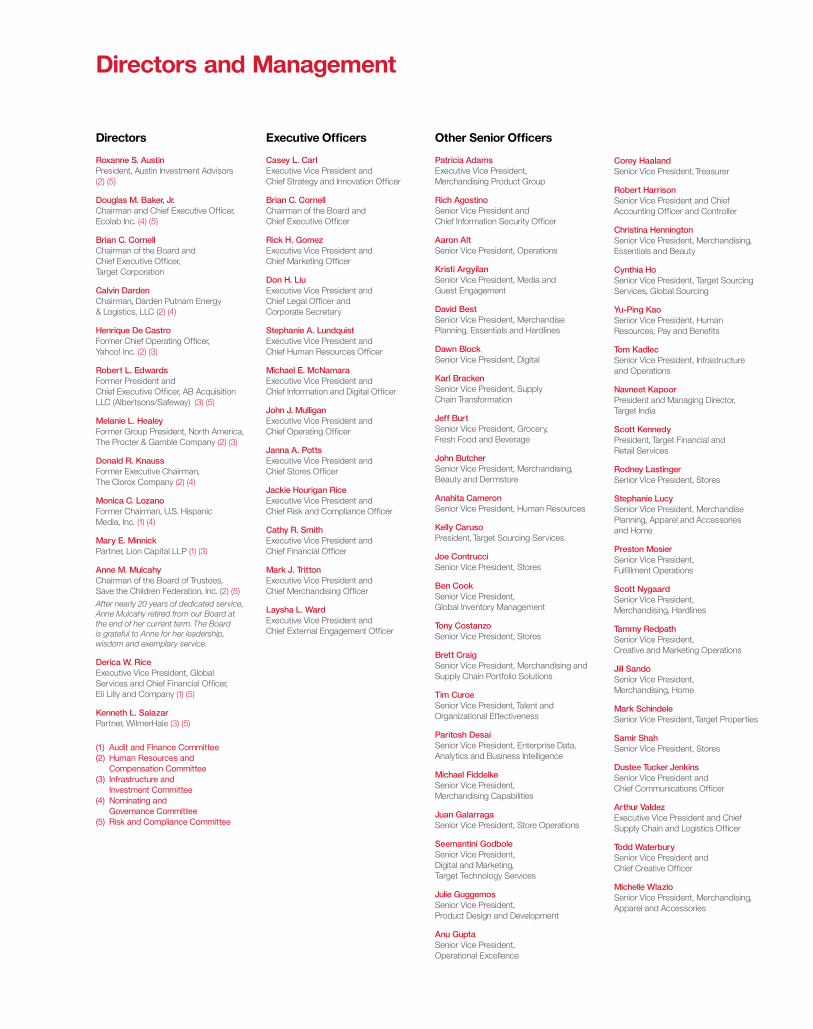
Directors and Management
Directors
Roxanne S. AustinPresident, Austin Investment Advisors(2) (5)
Douglas M. Baker, Jr.Chairman and Chief Executive Officer, Ecolab Inc. (4) (5)
Brian C. CornellChairman of the Board and Chief Executive Officer, Target Corporation
Calvin DardenChairman, Darden Putnam Energy & Logistics, LLC (2) (4)
Henrique De CastroFormer Chief Operating Officer, Yahoo! Inc. (2) (3)
Robert L. EdwardsFormer President and Chief Executive Officer, AB Acquisition LLC (Albertsons/Safeway) (3) (5)
Melanie L. HealeyFormer Group President, North America, The Procter & Gamble Company (2) (3)
Donald R. KnaussFormer Executive Chairman, The Clorox Company (2) (4)
Monica C. LozanoFormer Chairman, U.S. Hispanic Media, Inc. (1) (4)
Mary E. MinnickPartner, Lion Capital LLP (1) (3)
Anne M. MulcahyChairman of the Board of Trustees, Save the Children Federation, Inc. (2) (5)After nearly 20 years of dedicated service, Anne Mulcahy retired from our Board at the end of her current term. The Board is grateful to Anne for her leadership, wisdom and exemplary service.
Derica W. RiceExecutive Vice President, Global Services and Chief Financial Officer, Eli Lilly and Company (1) (5)
Kenneth L. SalazarPartner, WilmerHale (3) (5)
(1) Audit and Finance Committee(2) Human Resources and
Compensation Committee(3) Infrastructure and
Investment Committee(4) Nominating and
Governance Committee(5) Risk and Compliance Committee
Executive Officers
Casey L. CarlExecutive Vice President and Chief Strategy and Innovation Officer
Brian C. CornellChairman of the Board and Chief Executive Officer
Rick H. GomezExecutive Vice President and Chief Marketing Officer
Don H. LiuExecutive Vice President and Chief Legal Officer and Corporate Secretary
Stephanie A. LundquistExecutive Vice President and Chief Human Resources Officer
Michael E. McNamaraExecutive Vice President and Chief Information and Digital Officer
John J. MulliganExecutive Vice President and Chief Operating Officer
Janna A. PottsExecutive Vice President and Chief Stores Officer
Jackie Hourigan RiceExecutive Vice President and Chief Risk and Compliance Officer
Cathy R. SmithExecutive Vice President and Chief Financial Officer
Mark J. TrittonExecutive Vice President and Chief Merchandising Officer
Laysha L. WardExecutive Vice President and Chief External Engagement Officer
Other Senior Officers
Patricia AdamsExecutive Vice President, Merchandising Product Group
Rich AgostinoSenior Vice President and Chief Information Security Officer
Aaron AltSenior Vice President, Operations
Kristi ArgyilanSenior Vice President, Media and Guest Engagement
David BestSenior Vice President, Merchandise Planning, Essentials and Hardlines
Dawn BlockSenior Vice President, Digital
Karl BrackenSenior Vice President, Supply Chain Transformation
Jeff BurtSenior Vice President, Grocery, Fresh Food and Beverage
John ButcherSenior Vice President, Merchandising, Beauty and Dermstore
Anahita CameronSenior Vice President, Human Resources
Kelly CarusoPresident, Target Sourcing Services
Joe ContrucciSenior Vice President, Stores
Ben CookSenior Vice President, Global Inventory Management
Tony CostanzoSenior Vice President, Stores
Brett CraigSenior Vice President, Merchandising and Supply Chain Portfolio Solutions
Tim CuroeSenior Vice President, Talent and Organizational Effectiveness
Paritosh DesaiSenior Vice President, Enterprise Data, Analytics and Business Intelligence
Michael FiddelkeSenior Vice President, Merchandising Capabilities
Juan GalarragaSenior Vice President, Store Operations
Seemantini GodboleSenior Vice President, Digital and Marketing, Target Technology Services
Julie GuggemosSenior Vice President, Product Design and Development
Anu GuptaSenior Vice President, Operational Excellence
Corey HaalandSenior Vice President, Treasurer
Robert HarrisonSenior Vice President and Chief Accounting Officer and Controller
Christina HenningtonSenior Vice President, Merchandising, Essentials and Beauty
Cynthia HoSenior Vice President, Target Sourcing Services, Global Sourcing
Yu-Ping KaoSenior Vice President, Human Resources, Pay and Benefits
Tom KadlecSenior Vice President, Infrastructure and Operations
Navneet KapoorPresident and Managing Director, Target India
Scott KennedyPresident, Target Financial and Retail Services
Rodney LastingerSenior Vice President, Stores
Stephanie LucySenior Vice President, Merchandise Planning, Apparel and Accessories and Home
Preston MosierSenior Vice President, Fulfillment Operations
Scott NygaardSenior Vice President, Merchandising, Hardlines
Tammy RedpathSenior Vice President, Creative and Marketing Operations
Jill SandoSenior Vice President, Merchandising, Home
Mark SchindeleSenior Vice President, Target Properties
Samir ShahSenior Vice President, Stores
Dustee Tucker JenkinsSenior Vice President and Chief Communications Officer
Arthur ValdezExecutive Vice President and Chief Supply Chain and Logistics Officer
Todd WaterburySenior Vice President and Chief Creative Officer
Michelle WlazloSenior Vice President, Merchandising, Apparel and Accessories

2016 Annual R
eport
2016Annual Report
Visit our online Annual Report at Target.com/annualreport
1000 Nicollet Mall, Minneapolis, MN 55403612.304.6073