Vision - Inland Revenue Department
53
Transcript of Vision - Inland Revenue Department

i
Vision
To be a taxpayer friendly tax administrator delivering excellent service to
the tax paying public, with well-trained and dedicated staff facilitated by
fully automated system.
Mission To collect taxes in-terms of relevant tax and other related laws,
by encouraging voluntary compliance while deterring tax
evasion and tax avoidance, and
To enhance public confidence in the tax system by administering relevant tax and other related legislation fairly, friendly and expeditiously and thereby facilitate and foster a beneficial tax culture.
Strategic Goals
• To improve voluntary compliance by taxpayers with the
tax laws through programs, which encourage and assist in
that and detect those who do not comply and, where
necessary, take appropriate corrective action.
• To improve the effectiveness of the Department by the
application of efficient work methods, technology and
better utilization of available resources.
• To enhance the productivity and professionalism of the
staff through management and technical training, work
experience, and thereby to enable them to contribute more
effectively towards the fulfillment, by the Department, of
its mission.

ii
PRINCIPAL OFFICIALS
Mr. K.M.S. Kandegedara Commissioner General of Inland Revenue
Mr. V.D. P. Ubayasiri Senior Deputy Commissioner General
Information & Communication Technology and NBT
Mrs. M. Samarasekara Deputy Commissioner General
Indirect Tax Administration
Mr. K. L. S. Silva Deputy Commissioner General
Tax Surveillance & Risk Management & BOI Enterprises, Collection & Legal
Mr. H. B. A. Senevirathne Deputy Commissioner General
Tax Policy Planning & Development, Legislation, Rulings and International affairs
Mrs. D. M. Nanadawathie Deputy Commissioner General
Direct Tax Administration
Mr. H.M.Abesinghe Deputy Commissioner General
Human Resources Management
Mr. P.D. Premarathna Senior Commissioner
Legal, Stamp Duty, Appeals and Secretary to the Board of Review
Mr. S.T. Gobalasingham Senior Commissioner
Zone 3, Tax Policy Planning, Legislation and Rulings
Mr. K. A. P. Kaluarachchi Senior Commissioner
LTU & Corporate Tax
Mrs. W. B. S. Shanthikumar Senior Commissioner
Internal Audit
Mrs. L. Ramanayaka Senior Commissioner
Zone 1
Mr. W.M. Mendis Commissioner
Data processing (Information Technology 1)
Mr. A.L.A. Sirisena Commissioner
Nations Building Tax

iii
Mrs. H.M.C.I. Gunasekara Commissioner
Human Resource Development
Mr. W.V.P. Karunarathna Commissioner
Strategic & Operational Planning, Stamp Duty & Taxpayer services
Mr. P.A.V. Premarathna Commissioner
LTU
Mrs. K. Dahanayaka Commissioner
VAT, ESC, Betting and Gaming Levy
Mr. K.A.G. Abayarathne Commissioner
Corporate Tax
Mr. D.B. Jayasekara Commissioner
Zone – 1
Mrs. W Anulawathie Commissioner
Human Resource Management
Mrs. S. Edirisingha Commissioner
PAYE, WHT (Interest) & Unit 3
Mr. I.M.B Senevirathna Commissioner
Investigation
Mr. J.M. Jayawardhana Commissioner
Appeals
Mr. A. Sri Selvanayagam Commissioner
Collection and Special Collection
Mrs. R.M.R.W Manchanayaka Commissioner
Zone 2 & WHT (Specified fees)
Mr. D.M.L.I. Dissanayake Commissioner
Zone 3
Mr. A. N. Guruge Commissioner
VAT Refunds
Mrs. P. Rohini Commissioner
Internal Audit & Assessment Control
Mrs. R.M.P.S.K Rajapaksha Commissioner
Information
Mr. A.A.D.U. Abesinghe Commissioner
Procurement & Supplies and Economic Research & Planning

iv

v
Table of Contents The Summary of the Performance during the Year 2010……….. vii
PART I - HUMAN RESOURCE MANAGEMENT AND DEVELOPMENT 1
Chapter 1- Human Resources 1
1.1 Approved Cadre, The number in post and vacancies 1
1.2 Promotions 2
1.3 Retirements 2
1.4 Disciplinary Action 4
1.5 Training 4
PART II – TAX ADMINISTRATION
Chapter 2 - Collection of Revenue 8
2.1 Number of Taxpayers & Tax files 8
2.2 Total Revenue Collection 9
2.3 Total Revenue – Cash flow 11
2.4 Collection of Revenue – Self Assessment and Other 12
2.5 Inland Revenue Contribution to the Government Revenue and GDP 13
2.6 Return Compliance 14
2.7 Income Tax Collection 15
2.8 Value Added Tax Collection 16
2.9 Economic Service Charge (ESC) Collection 18
2.10 PAYE Collection 19
2.11 Withholding Taxes (on interest and specified fees) 19
2.12 Stamp Duty Collection 20
2.13 Betting & Gaming Levy Collection 20
2.14 Debits Tax Collection 21
2.15 Construction Industry Guarantee Fund Levy Collection 22
2.16 Nation Building Tax (NBT) Collection 22
2.17 Inland Revenue Collection 2006 to 2010 23
Chapter 3 - Expenditure and Productivity Ratio 26
3.1 Comparison of the total expenditure incurred during the year with 2008 , 2009 and 2010 27
3.2 Analysis of the Recurrent Expenditure in 2010 28
3.3 Productivity Ratio 28
Chapter 4 – Taxes in Default 30
Chapter-5 -Audits, Additional Tax Charged and Collected, Refunds, Recovery Action and Appeals 32 5.1 Audits 32 5.2 Appeals 33 5.3 Board of Review 33 5.4 Post VAT refund audits 34
5.5 Recovery Action 34 5.6 Refunds 34 PART III -
Chapter 6 - International Relations 36 6.1 Double Tax Avoidance Treaties 36 6.2 Affairs related to Double Tax Treaties during the year 2010 37
6.3 Participations at International Taxation Matters Abroad 38
Chapter 7 - Legislation 39 7.1 Approved Charities 39
7.2 Rulings Given During the Year 40
Chapter 8 - Other 41 8.1 Tax Payer Service Unit 41 8.2 Details of the Directions and clearance certificates issued 41
8.3 Analytical Reports 42
8.4 Activities in North and East 42

vi

vii
The Summary of the Performance during the Year 2010………..
Inland Revenue Department (IRD) could fulfill the government objective of collecting
revenue for development of the country during the year, along with the end of the
gruesome terrorism which lasted for almost three decades. The total revenue
collected by the IRD during the year 2010 was Rs. 422,512 million. It is a growth of
Rs. 69.5 million or 19.68% when compared to the figures in year 2009. It is also a
51.69% contribution to the total government revenue and 7.54% of the annual gross
domestic production.
The successful steps taken by the IRD to enhance compliance in furnishing tax
returns have resulted in an increase in return compliances relation to every tax
compared to year 2009. Furnishing of non- corporate income tax returns on the due
date reached 53% during the year of assessment 2009/2010 as against 48% recorded
in the year of assessment 2008/2009. The compliance rate of furnishing returns on
due date, has increased up to 66% while it was 58% during the year of assessment
2008/2009, with regard to the corporate sector.
Many new files could be opened with the initiatives taken by Information Branch and
Taxpayer Service Branch. Accordingly, 9,287 new income tax files and 766 PAYE tax
files (Employers) could be opened and 14,957 persons were temporally registered for
VAT. Number of 1V return forms issued on information received was 22,552.
During the year, by regulating tax audits, undisclosed income and turnover
amounting to Rs. 142,814 million could be disclosed. Additional taxes imposed
during the year on such amounts were Rs. 15,711 million. (Inclusive of setting off
refunds against arrears)
Further actions were taken to provide training on Code of Ethics for all the officers of
the Inland Revenue service. Moreover, a series of seminars and lectures was
conducted for providing awareness on tax matters, for the public and the staff. The
activities of the regional office in Jaffna which did not function properly for decades
due to the conflict situation in Northern and Eastern Provinces were formally
restored subsequent to the appointment of staff and making the public aware of taxes
by conducting seminars.
The project for the expansion of the Automatic Processing System for recovery of all
types of taxes was initiated during the year with increasing the number of computers
and other relevant equipment.
The head quarters of the IRD which was severely damaged by the terrorist attack in
February 2009, was renovated with sophisticated facilities and some branches which
had been operating in other buildings were relocated in the head quarters.

viii
Taxes under respective enactments administered by the IRD during the year
Taxes imposed under respective enactments administered by the IRD during the year
are as follows:
Tax Enactments
Income Tax Inland Revenue Act. No. 10 of 2006 as amended by Act No.10 of 2007, 9 of 2008 and 19 of 2009
Value Added Tax (including VAT on Financial services, Advance Tax on VAT and Optional VAT)
Value Added Tax Act. No. 14 of 2002 as amended by Act No 7 of 2003, 13 of 2004, 6 of 2005,8 & 49 of 2006, 14 of 2007, 15 of 2008 and 15 of 2009
Economic Service Charge Economic Service Charge Act. No. 13 of 2006 as amended by Act No 15 of 2007, 11 of 2008 and 16 of 2009
Debits Tax Debits Tax Act. No. 16 of 2002 as amended by Act No 05 of 2003, 12 of 2007 and 17 of 2009
Nation Building Tax Nation Building Tax Act. No.9 of 2009 as amended by Act No 32 of 2009
Betting and Gaming Levy The Betting and Gaming Levy Act. No. 40 of 1988
Stamp Duty Stamp Duty Act. No. 43 of 1982 and the Stamp Duty (Special Provisions) Act. No. 12 of 2006 as amended by Act No 10 of 2008
Share Transaction Levy Finance Act. No. 5 of 2005 and Finance Act. No. 13 of 2007
Construction Industry Guarantee Fund Levy
Social Responsibility Levy Finance Act. No. 5 of 2005, Finance Act No. 11 of 2006 and Finance Act. No. 8 of 2008
Turnover Tax (Northern Province) The Turnover Tax Act. No. 69 of 1981 as amended
IRD continued to deal with the work of assessment and collection of following
taxes, which were in force earlier and have since been repealed
Tax Imposed under
National Security Levy The National Security Levy Act. No. 52 of 1991 as amended
Goods and Services Tax The Goods and Services Tax Act. No. 34 of 1996 as amended
Save the Nation Contribution The Save the Nation Contribution Act. No. 5 of 1996 as amended
Surcharge on Wealth Tax The Surcharge on Wealth Tax Act. No. 25 of 1982 and Act No. 8 of 1989
Surcharge on Income Tax The Surcharge on Income Tax Act. No. 26 of 1982, Act No. 12 of 1984, Act No. 7 of 1989 as amended
Estate Duty The Estate Duty Act. No. 13 of 1980 as amended

1
Performance Report 2010
PART-I
HUMAN RESOURCE MANAGEMENT AND DEVELOPMENT
Chapter 1- Human Resources
1.1 Approved Cadre, the number in post and vacancies The following table shows the approved cadre of the Department, the actual number in post
and the vacancies, as at 31 December 2010
Cadre of the Department as at 31.12.2010
Grade Approved
Cadre Number in
Post Vacancies
Commissioner General 1 1 -
Senior Deputy Commissioner General 1 1 -
Deputy Commissioner General 6 5 1
Senior Commissioner 5 5 -
Commissioner 22 19 3
Deputy Commissioner 90 85 5
Senior Assessor 750
54 129
Assessor 567
Assessor (Supernumerary) - 2 -
Senior Tax Officer 1000
158 402
Tax officer 438
Combined Services
Director (Administration) 1 1 -
Accountant 7 7 -
Public Management Assistant(Supra) 2 2 -
Translator 9 7 2
Librarian 11 1 1 -
Librarian 111 1 - 1
Public Management Assistant 306 266 40
Budget Assistant 2 2 -
Transport officer 1 - 1
Driver 74 66 8
KKS 319 304 15
Other
Engineer 1 1 -
System Analyst 6 1 5
System Manager 2 2 -
System Controller 3 3 -
System Operator 11 3 8
Data entry Operator 18 8 10
Stamp Clerk 1 - 1
Receptionist 4 3 1
Supply Assistant 2 - 2
Building Supervisor 1 - 1
Storeman 3 - 3
Carpenter 1 1 -
Total 2651 2013 638

2
Performance Report 2010
1.2 Promotions
� Mr. K. M.S. Kandegedara, Deputy Commissioner General, was appointed to the rank of Commissioner General of Inland Revenue with effect from May 31, 2010.
� Mr. H.M. Abesinghe, Senior Commissioner was promoted to the rank of Deputy Commissioner General with effect from June 16, 2010.
� The following Commissioners were promoted to the rank of Senior Commissioner
Name Date of promotion
• Mrs. W. B. S. Shanthikumar 05.05.2010
• Mrs. L. Ramanayaka 31.05.2010
• Mr. W.M. Mendis 27.12.2010
� The following Deputy Commissioners were promoted to the rank of Commissioner
Name Date of promotion
• Mr. A. N. Guruge 10.01.2010
• Mrs. P. Rohini 03.04.2010
• Mrs. R.M.P.S.K Rajapaksha 05.05.2010
• Mr. A.A.D.U. Abesinghe 31.05.2010
• Ms. D.G.P.W. Gunathilake 03.11.2010
• Mr. J.P.D.R. Jayasekara 05.11.2010
� 06 Senior assessors were promoted to the rank of Deputy Commissioner with effect from
May 12, 2010
� 02 Assessors were promoted to the rank of Senior Assessor with effect from May 02, 2010
and July 07, 2010
1.3 Retirements
The following officers were retired from service during the year.
� Mr. E.M.M. Medagoda Commissioner General
� Mr. E.A.S. Edirisinghe Additional Commissioner General
� Mr. H.M. Premarathna Banda Senior Commissioner
� Mr. S.A. Hemapala Commissioner
� Mr. K. Rajarathnam Commissioner
� Mr. S. Rajapaksha Commissioner
� Mr. W.M.W.Kumarasiri Commissioner
� Mr. K.D.M.R. Perera Deputy Commissioner
� Mr. A.B.P. Karunarathne Deputy Commissioner

3
Performance Report 2010
Other Retirements
� Senior assessors – 05 � Assessors – 18 � Translator - 01 � Public Management Assistants – 06 � Drivers – 01 � K K S – 05
Mr. E.M.M. Medagoda
Mr. E.M.M. Medagoda was appointed Commissioner General of Inland Revenue on
June19, 2009. He began his career with the Department on September 01, 1976 as an
Assessor and held several important positions in the tax administration. During his
tenure of office spanning 33 years, Mr. Medagoda underwent training in Japan
participating in the Junior Tax Program held in 1985. He also followed VAT training
Course held in Indonesia in 1995. He represented the Department at the seminar on
Exchange and Information held in Korea in 1997, 26th Annual Technical Conference of
CATA held in Canada in 2005 and the 12th Annual International Taxation meeting on
Tax Treaties held in France in 2007, study tour for FMRP project held in Hongkong &
Philippines in 2007. Mr. Medagoda led the delegation in the negotiation and
conclusion of the Double Tax convention with Saudi Arabia.
Mr. E.A.S. Edirisinghe
Mr. E.A.S. Edirisinghe joined the Department on September 01, 1976 as an Assessor. He
served in various capacities with dedication and reached the rank of Additional
Commissioner General in 2009. He retired from service on October 01, 2010 having counted a
period of 33 years in the Inland Revenue service. Mr. Edirisinghe, during the tenure of his
office, underwent training and participated in several overseas taxation programs including
Tax Administration program held in California in 1990, and General Tax administration
course held in Malaysia in 2000, It is Mr. Edirisinghe’s dedication and devotion that led to
timely completion of the refurbishment work of the Inland Revenue building within a short
period of time.
Mr. H.M. Premarathne Banda
Mr. H.M. Premarathne Banda joined the Department on May 05, 1980 as an Assessor. At the
time of his retirement, which on May 04, 2010, he was functioning as Senior Commissioner
Secretariat. Mr. Premarathne Banda counted 30 years of dedicated service in the Department.
He played a dedicated role in the last restructuring program of the Department.

4
Performance Report 2010
1.4 Disciplinary Action
Category Balance o/s as at 01.01.2010
Commenced during the year
Concluded during the year
Balance o/s as at 31.12.2010
Assessor 5 - - 5
Tax officer 3 - 2 1
1.5 Training
1.5.1 In House Training
Training Branch of the Department conducts training courses and examinations for
Assessors and Tax officers, regularly. This is aimed at enhancing their knowledge and
improving their analytical skills, particularly in Taxation and Accountancy. More weight is
placed in providing the training on subjects that are required to fulfill various service
requirements of officers for their confirmation in the respective grades. Details of personnel
trained and the examinations conducted during the year are as follows:
� Training for Assessors.
Course No of Trainees
Training classes conducted for Assessors in Class 11 Grade 11
(promoted according to the Administrative Tribunal Case No.
AAT/26/2008 (PSC), on 12.10.2009) for the first departmental
examination
10
� Training for Tax Officers
Course No of Trainees
Training classes conducted for Tax Officers in Class 111 Grade 11 for
the conformation in Class 111 Grade 1 and eligibility for the
promotion to Class 11 Grade 11
� Sinhala medium
� English medium
� Tamil medium
375
37
20

5
Performance Report 2010
� Seminars, Work Shops etc.
Subject No. of seminars, workshops
held during the year Training programs on “Management and Good Governance” for Deputy Commissioners
3
Seminars on “Code of Ethics” for all Assessors and Tax Officers
3
Seminars on “Tax related subjects and relevant topics for office work”
8
Training sessions on “Tax Procedure” 8
1.5.2 Overseas Training
Arrangements were made for several officials of the Department to participate in
training programs, seminars and workshops held abroad with a view to expose them
to the advances made in the administration of Tax Laws and best practices of other
countries in order to maintain a level of professionalism as Tax administrators.
Accordingly, 33 officers were participated in such training programs during the
year. Details of such officers who were sent abroad for training and the training
programs they participated are as follows:
Name and Designation of the Officer
Name of the Program Country of Training
Duration
1 Mrs. L. Ramanayake Senior Commissioner
International seminar on Taxation (Senior Course)
Japan 30.08.2010-22.09.2010
2 Mr. D.M.L.I Disanayake Commissioner
Practical aspect of international Tax Planning
Netherlands 18.102010-22.10.2010
3 Mr. A.N. Guruge Commissioner
Practical aspect of international Tax Planning
Netherlands 18.102010-22.10.2010
4 Mr. H.M.W.C. Bandara Deputy Commissioner
Interpretation and Application of Tax treaties & Transfer pricing fundamentals(IBFD)
Netherlands 22.02.2010-26.02.2010
5 Mr. H.M. Dencil Deputy Commissioner
Interpretation and Application of Tax treaties & Transfer pricing fundamentals(IBFD)
Netherlands 22.02.2010-26.02.2010
6 Mr. D.M.S. Disanayake Deputy Commissioner
Interpretation and Application of Tax treaties & Transfer pricing fundamentals(IBFD)
Netherlands 22.02.2010-26.02.2010
7 Mr.W.K.K. Jayarathne Deputy Commissioner
Interpretation and Application of Tax treaties & Transfer pricing fundamentals(IBFD)
Netherlands 22.02.2010-26.02.2010
8 Mr. P.K.Pathmanaden Deputy Commissioner
Interpretation and Application of Tax treaties & Transfer pricing
Netherlands 22.02.2010-26.02.2010

6
Performance Report 2010
fundamentals(IBFD)
9 Ms. R.K.C Chithralatha Deputy Commissioner
Interpretation and Application of Tax treaties & Transfer pricing fundamentals(IBFD)
Netherlands 22.02.2010-26.02.2010
10 Ms. R.M.R.W. Munchanayake Deputy Commissioner
LHDNM_OECD Practical Workshop on the Negotiation of Tax Treaties
Malaysia 08.03.2010-12.03.2010
11 Mr. D.U.A. Jayawardena Deputy Commissioner r
Workshop on Taxation of International Transaction(TOTI)
Malaysia 03.05.2010-21.05.2010
12 Mr. E. S. De Soysa Deputy Commissioner
Tax administration Development (KOICA)
Korea 15.07.2010-30.07.2010
13 Mr. T. Rajapakshe Deputy Commissioner
Tax administration Development (KOICA)
Korea 15.07.2010-30.07.2010
14 Mr. R.A.N. Rajapakshe Deputy Commissioner
Tax administration Development (KOICA)
Korea 15.07.2010-30.07.2010
15 Mr. M. Gunaweera Deputy Commissioner
Tax administration Development (KOICA)
Korea 15.07.2010-30.07.2010
16 Mr. R. M. Dingiri Banda Deputy Commissioner
Tax administration Development (KOICA)
Korea 15.07.2010-30.07.2010
17 Mr. S.M.A. Bandara Deputy Commissioner
Tax administration Development (KOICA)
Korea 15.07.2010-30.07.2010
18 Ms. D.W.M. Wijekoon Deputy Commissioner
Tax administration Development (KOICA)
Korea 15.07.2010-30.07.2010
19 Ms. L.M.C. Weerakoon Deputy Commissioner
Tax administration Development (KOICA)
Korea 15.07.2010-30.07.2010
20 Ms. R.K.C. Chithralatha Deputy Commissioner
Tax administration Development (KOICA)
Korea 15.07.2010-30.07.2010
21 Ms. T.M.J.N ThalAramba Deputy Commissioner
Tax administration Development (KOICA)
Korea 15.07.2010-30.07.2010
22 Ms. K.G.C. Priyadarshanie Deputy Commissioner
Tax administration Development (KOICA)
Korea 15.07.2010-30.07.2010
23 Mr. W.M. N. Wickramasinghe Deputy Commissioner
Principles of International & Co-operative Taxation (IBFD)
Netherlands 16.08.2010-27.08.2010
24
Mr. N.M.P.N.B. Wanigasekara Deputy Commissioner
Principles of International & Co-operative Taxation (IBFD)
Netherlands 16.08.2010-27.08.2010
25 Mr. J.A.A. Parakrama Deputy Commissioner
Principles of International & Co-operative Taxation (IBFD)
Netherlands 16.08.2010-27.08.2010
26 Mr. D.M.R. Disanayake Senior Assessor
Transfer Pricing Aspects of Business Restructurings
Singapore 14.07.2010-16.07.2010

7
Performance Report 2010
27 Mr. H.T.K.F. Peris Senior Assessor
Transfer Pricing Aspects of Business Restructurings
Singapore 14.07.2010-16.07.2010
28 Ms. W.P.C.S. Ranaweera Senior Assessor
Transfer Pricing Aspects of Business Restructurings
Singapore 14.07.2010-16.07.2010
29 Mr. B.K. Saman Santha Senior Assessor
Transfer Pricing Aspects of Business Restructurings
Singapore 14.07.2010-16.07.2010
30 Ms. Swarna Liyanage Senior Assessor
Tax Analysis and Revenue Forecasting Programme (FMRP)
USA 27.06.2010-23.072010
31 Mr. S.W.P.Y. silva Assessor
Master’s Degree Programme in International development (KOICA)
Korea 17.02.2010-30.02.2011
32 Mr. M.G. Karunarathne Assessor
GTC:Project Management for E Government Promotion (JAICA)
Japan 05.04.2010-10.09.2010
33 Ms. S.I. Asanthi Assessor
Master’s Degree Programme in Public Policy & Management
Japan commenced on 05.04.2010
34 Mr. L.K. Rathnayake Assessor
Commonwealth Tax Inspectors Course(CTIC)
UK 02.08.2010-10.09.2010

8
Performance Report 2010
PART II
TAX ADMINISTRATION
Chapter 2 - Collection of Revenue
The Department of Inland Revenue being the main contributor to the Government’s
revenue is entrusted with an immense responsibility of collecting revenue to the
Government. The Department collected net revenue of Rs. 422,512,163,644 (including
Social Responsibility Levy) during the year. This sum shows an increase of Rs.69.5
billion (or 19.68%) over that of year 2009. This revenue was built up by attending to
affairs of 864,873 taxpayers, including several withholding agents through whom
certain taxes were collected by way of deduction at source, out of which 530,213
employees were paying income tax (by deduction at source) under PAYE scheme.
2.1 Number of Taxpayers & Tax files
The number of persons registered with the Department for the payment of tax, as at the end of
the year, is given in Table 01.
Number of Taxpayers and Tax Files as at 31-12-2010
Income Tax
Corporate
Resident Companies
29,833
Non-Resident Companies
576
State Corporations, Statutory Boards and State owned institutions 54 30,463
Non Corporate
Individuals
192,451
Partnerships
16,578
Bodies of Persons etc. 1,107
Employees paying income tax under Pay-As-You-Earn (PAYE) Scheme (as at 31-03-2010)
530,213 740,349
Total Income Taxpayers 770,812
Other Tax Payers
Persons and Partnerships registered for Economic Service Charge(ESC) 11,936
Persons registered for Value Added Tax (VAT) 31,271
Persons registered for Value Added Tax on Financial Services 152
Persons registered for Optional VAT 3,950
Persons registered for Nation Building Tax (NBT) 14,577
Persons registered for Debits Tax 911

9
Performance Report 2010
Betting Levy Files 933
Gaming Levy Files 4 63,734
Total Tax payers 834,546
Employers Registered under PAYE Scheme 14,354
Withholding Tax on Interest (Withholding Agents) 1,793
W H T on Specified Fees (Regular monthly schedule senders) 6,816
Stamp Duty (Regular quarterly schedules senders) 7,364 30,327
Total Number of tax files/ tax payers as at 31-12-2010 864,873
Table 01
*Not include employees given in incomplete declarations furnished by their respective
employers
Note:
(i) A separate file is not generally maintained in the Department in respect of any employee
from whose remuneration tax is deducted under PAYE Scheme, unless such employee has
any other income.
(ii) Individuals whose income is taxed at source as a final tax (such as interest on deposits,
Treasury Bills, Dividends, and Rewards etc) are not included.
(iii) 640 Non-Governmental Organizations and 4,648 Government employees with
maintaining files have been included in the above statistics
2.2 Total Revenue Collection
The total revenue collection for the year, amounted to Rs. 422 billion shows an increase of Rs.
69.5 billion or 19.68% over that of the previous year. This achievement could be attributable
mainly to wide reforms undertaken in tax administration, which also led to mending the
loopholes in the tax system.
The ratio of the total Inland Revenue contribution to the Government revenue in the year was
51.69%. The collection of revenue indicates 100% achievement of expectation reflecting only a
marginal drop in collection of Income tax and Value Added Tax. Even when compared with
the estimate of Rs. 434.61 billion for the year, the revenue for the year was short only by Rs.
2.10 billion. The collection of outstanding (default) taxes for the year under review was Rs.
13.0 Billion (the collection of default tax in 2009 was Rs. 15.6 Billion). This is somewhat
noteworthy as the refurbishment of the Inland Revenue building, which was damaged in the

10
Performance Report 2010
previous year, completed only in March 2010 and the scattered offices re-occupied the
building only in the middle of the year.
The revenue from VAT has gone up by 28% in 2010 over that of previous year. This was
mainly due to the increasing the volume of importation of some luxury items. However, the
collection of income tax of Rs.117.57 billion during the year indicates a short fall of Rs 7.7
billion over that of the year 2009. The main reason for the drop in revenue from Income tax
could be due changes in policies.
Table 02 shows the tax wise analysis and the table 03 shows the cash flow of the total revenue
collection for the year 2010
Total Revenue Collection – 2010
Type of Tax Revenue
Estimate Rs: (Revised)
Revenue Collection Rs:
Collection as a % of Estimate
Collection as a % of Total
Revenue
Income Tax 120,040,000,000 117,575,259,945 98% 27.87%
Economic Service Charge 15,000,000,000 18,047,723,176 120% 4.28%
Debits Tax 9,559,000,000 10,843,436,359 113% 2.57%
Betting & Gaming Levy 300,000,000 294,841,046 98% 0.07%
Share Transaction Levy 2,375,000,000 2,272,957,122 96% 0.54%
Stamp Duty 4,204,000,000 4,439,842,693 106% 1.05%
Value Added Tax 222,628,000,000 219,563,122,247 98% 51.97%
Goods & Services Tax 40,000,000 38,534,018 96% 0.01%
Turnover Tax 300,000,000 388,294,514 129% 0.09%
National Security Levy 15,000,000 23,222,185 155% 0.01%
Construction Industry Guarantee Fund Levy
780,000,000 829,785,134 106% 0.20%
Nation Building Tax 45,362,000,000 46,022,517,148 101% 10.83%
Total Revenue 420,603,000,000 420,339,535,587 100% 99.48%
Social Responsibility Levy 1,300,000,000 2,172,628,059 167% 0.52%
Total Revenue (Including SRL) 421,903,000,000 422,512,163,646 100% 100.00%
Table 02

Performance Report 2010
2.3 Total Revenue – Cash flow
Month
January
February
March
April
May
June
July
August
September
October
November
December
Table -03
0
50,000
100,000
150,000
200,000
250,000
IT
ESC
Re
ve
nu
e C
oll
ect
ion
Rs
Mil
lio
ns
Total Revenue Collection
IT ESC DT BGL
Cash flow
Cash Flow- 2010
Month
Revenue Collection
(Including SRL) Rs:
Cumulative Revenue Collection Rs:
28,684,753,511 28,684,753,511
33,360,985,619 62,045,739,130
25,632,333,259 87,678,072,389
32,410,069,287 120,088,141,676
32,486,436,610 152,574,578,286
29,875,187,606 182,449,765,892
35,798,647,762 218,248,413,654
41,063,059,288 259,311,472,942
44,389,906,062 303,701,379,004
39,793,567,617 343,494,946,621
43,184,763,385 386,679,710,006
35,832,453,640 422,512,163,646
ESCDT
BGL STL SD
VAT
GST TT NSL
Tax Type
Chart 01
Total Revenue Collection - 2010
BGL STL SD VAT GST TT NSL CIGFL
11
Cumulative Revenue Collection Rs:
28,684,753,511
62,045,739,130
87,678,072,389
120,088,141,676
152,574,578,286
182,449,765,892
218,248,413,654
259,311,472,942
303,701,379,004
343,494,946,621
386,679,710,006
422,512,163,646
CIGFL
NBT
SRL
CIGFL NBT SRL

Performance Report 2010
2.4 Collection of Revenue –
During the year, out of the total revenue collection (excluding VAT and NBT on Imports),
4.4% was collected as non s
collection.
Table 04 shows the comparison of figures.
Analysis of Collection under Self Assessment and other.
2008(Rs. ‘000)
Self Assessment
Income Tax 106,748,623
VAT(Excluding VAT on Imports)
97,674,946
NBT (Excluding NBT on Imports)
0
Others 29,263,312
Total 233,686,881
% to the Total Revenue
(Excluding VAT and NBT on Imports)
95.88%
Table 04
0
50,000
100,000
150,000
200,000
250,000
300,000
350,000
400,000
450,000R
ev
en
ue
Mil
lio
ns
Revenue Collection (Including SRL) Rs:
– Self Assessment and Other
During the year, out of the total revenue collection (excluding VAT and NBT on Imports),
non self assessment revenue. In 2009 this was 5.79% to the total revenue
Table 04 shows the comparison of figures.
Collection under Self Assessment and other.
2008(Rs. ‘000) 2009 (Rs. ‘000)
Assessment Other
Self Assessment
Other Self
Assessment
106,748,623 5,316,698 117,529,249 7,821,560 110,451,338,127
97,674,946 4,478,467 96,423,173 7,074,945 115,100,917,240
0 0 12,338,569 63,186 18,981,743,493
29,263,312 257,808 28,625,908 716,620 38,642,159,496
233,686,881 10,052,973 254,916,899 15,676,311 283,176,158,356
95.88% 4.12% 94.21% 5.79%
Month
Chart 02
Cash Flow- 2010
Revenue Collection (Including SRL) Rs: Cumulative Revenue Collection Rs:
12
During the year, out of the total revenue collection (excluding VAT and NBT on Imports),
ssessment revenue. In 2009 this was 5.79% to the total revenue
2010 (Rs. ‘000)
Self Assessment
Other
110,451,338,127 7,123,921,818
115,100,917,240 4,884,494,247
18,981,743,493 328,332,130
38,642,159,496 709,104,809
283,176,158,356 13,045,853,004
95.60% 4.40%
Cumulative Revenue Collection Rs:

Performance Report 2010
2.5 Inland Revenue Contribution to the Government
Table 05 shows the contribution of the Inland Revenue Department to the Government
revenue and the GDP in 2010 and its trends in last 4 years. Chart 03 illustrates these
contributions. Total Government revenue in 2010 has increased to Rs
Report of Ministry of Finance & Planning
Revenue collection to the Government revenue, recording as
slight decline in the Department’s contribution, it is still r
revenue collection.
Contribution to the Government Revenue and GDP at Current Prices of Major Economic Activities
Year Governments
Revenue Rs. Mn **
Collection Rs.
2006 477,833
2007 565,051
2008 655,260
2009 699,643
2010 817,280
Source – * Central Bank of Sri Lanka (Annual Report
Table 05
0
100,000
200,000
300,000
400,000
500,000
600,000
700,000
800,000
900,000
2006
Re
ve
nu
e
Contribution to the Government Revenue
Inland Revenue Contribution to the Government Revenue and GDP
Table 05 shows the contribution of the Inland Revenue Department to the Government
revenue and the GDP in 2010 and its trends in last 4 years. Chart 03 illustrates these
contributions. Total Government revenue in 2010 has increased to Rs
Report of Ministry of Finance & Planning – 2010) while the percentage of the total Inland
Revenue collection to the Government revenue, recording as 51.69%. Though, there was a
slight decline in the Department’s contribution, it is still remained above 50% of the total
Contribution to the Government Revenue and GDP at Current Prices of Major Economic
IRD’s Collection Rs.
Mn
% of IRD’s Collection to
Govt. Revenue
GDP at Current Prices of Major
Economic Activities Rs.
Mn *
253,319 53.01% 2,938,680
308,205 54.54% 3,578,688
344,570 52.59% 4,410,682
353,015 50.46% 4,835,293
422,512 51.69% 5,602,321
Central Bank of Sri Lanka (Annual Report- 2010) **Ministry of Finance and Planning (Annual Report
2007 2008 2009Year
Chart 4
Contribution to the Government Revenue
Governments Revenue IRD’s Collection
13
Revenue and GDP
Table 05 shows the contribution of the Inland Revenue Department to the Government
revenue and the GDP in 2010 and its trends in last 4 years. Chart 03 illustrates these
contributions. Total Government revenue in 2010 has increased to Rs 817,280 Mn (Annual
2010) while the percentage of the total Inland
%. Though, there was a
emained above 50% of the total
Contribution to the Government Revenue and GDP at Current Prices of Major Economic
Current Prices of Major
Activities Rs.
% of IRD’s Collection to
GDP
8.62%
8.61%
7.81%
7.30%
7.54%
) **Ministry of Finance and Planning (Annual Report- 2010)
2010
Contribution to the Government Revenue
IRD’s Collection

14
Performance Report 2010
2.6 Return Compliance
The programs for enhancing taxpayer compliance in timely filing tax returns and paying taxes
on self-assessment basis continued during the year. Offering benefits to individual taxpayers
to enhance voluntary compliance towards the tax laws, such as awarding Privilege Cards
(Gold & Silver), granting tax concessions on importation of motor vehicles, discounts on early
tax payments were effectively continued.
Accordingly, for the year of assessment 2009/10, Income Tax Return Compliance rate has
increased when compared with the previous year of assessment. Filling Corporate Income tax
returns on the due date reached 52% as against 49% recorded in the previous year. As regards
the Non-corporate Sector, the compliance rate of furnishing returns on the due date has
increased to 41% from 39% in the previous year, and after one month compliance reached 66%
in corporate sector and 53% in non-corporate sector.
• Table 06 shows the Income Tax Return Compliance rates on due date, and on a date
after one month from the due date for the years from 2005/06 to 2009/10.
• Table 07 shows the rates of return compliance on other taxes.
Income Tax Return Compliance 2005/06 to 2009/10
Year of Assessment
Sector Compliance on
Due Date
Compliance within one
month from the due date
2005/2006 Corporate 34% 44%
Non-corporate 33% 44%
2006/2007 Corporate 36% 42%
Non-corporate 26% 42%
2007/2008 Corporate 37% 55%
Non- corporate 27% 50%
2008/2009 Corporate 49% 58%
Non-corporate 39% 48%
2009/2010 Corporate 52% 66%
Non-corporate 41% 53%
Table 06
Return Compliance on Other Taxes
VAT ESC Debit Tax
NBT Stamp Duty
PAYE
Year 2010
94% 81% 100% 98% 99% Year of Assessment
2009/10 51%
Table 07

Performance Report 2010
2.7 Income Tax Collection
Income tax revenue declined by 6.2
tax revenue was reflected in the income tax collected from withholding tax on interest. The
interest rates of deposits were reduced during the year. As a result of reducti
deposit, investors moved to
of the total revenue of the Department for the year, and that was
2008 – 32.52%).
2.7.1 Income Tax Collection
The contribution from the corporate sector to the total income tax collection of Rs.
Billion was amounted to Rs.
contributed Rs. 60.41 Billion or
collection, and chart 04 illustrates it.
Corporate & Non
Sector
Corporate
Non-Corporate
Table 08
Notes- * includes dividend tax of Rs:
* * includes WHT deducted and remitted from interest income
Sector
Non-Corporate
51.38%
Corporate & Non
tax revenue declined by 6.2% to Rs. 117,575 Million in 2010. This slowdown of Income
tax revenue was reflected in the income tax collected from withholding tax on interest. The
interest rates of deposits were reduced during the year. As a result of reducti
deposit, investors moved towards share market. The Income tax collection accounts for
of the total revenue of the Department for the year, and that was 35.51% for the year 2008. (In
ollection – Sector wise clarification
The contribution from the corporate sector to the total income tax collection of Rs.
Billion was amounted to Rs.57.15 Billion or 48.62% whereas the non corporate sector
Billion or 51.38%. Table 08 shows the composition of Income Tax
collection, and chart 04 illustrates it.
Corporate & Non-Corporate Income Tax Collection – 2010
Tax Collection (Rs) %
57,159,980,481* 48.62%
Corporate 60,415,279,464** 51.38%
117,575,259,945 100%
* includes dividend tax of Rs: 5,645Mn
* * includes WHT deducted and remitted from interest income and services rendered by Corporate
Chart 5
Corporate & Non-Corporate Income Tax Collection
2010
Corporate Non-Corporate
15
This slowdown of Income
tax revenue was reflected in the income tax collected from withholding tax on interest. The
interest rates of deposits were reduced during the year. As a result of reduction rate of
The Income tax collection accounts for 27.83%
% for the year 2008. (In
The contribution from the corporate sector to the total income tax collection of Rs. 117.57
% whereas the non corporate sector
the composition of Income Tax
services rendered by Corporate
Corporate
48.62%
Corporate Income Tax Collection

16
Performance Report 2010
2.7.2 Source-wise Analysis of Income Tax collection
Table 09 shows the source wise composition (employment and others) of income tax
collected during the year
Income Tax Collection – 2010
Source wise Analysis (Employees and Others)
Source Collection (Rs,Mn)
Employment
PAYE Scheme 16,032.11
Self assessment and Assessments with penalties with tax in default
279.83 16,311.94
Others
Self assessment and Assessments with penalties with tax in default
57,669.69
With holding tax on interest, rent & specified fees 38,694.03
Deductions at source 5,646.92
Compounding penalties 0 102,010.64
Gross Collection 118,322.58
Less: Refunds -747.33
Net collection 117,575.25
Table 9
2.8 Value Added Tax Collection
Reflects an increase of 28% over that of the previous year which was Rs 171.11 Billion. Even
when compared with the estimate of Rs: 222.62 Billion for the year, the revenue for the year
reduced by Rs 3.06 Billion only. Increasing the volumes of importation in motor vehicles
including luxury items helped to increase the VAT revenue. The part of VAT collected on
domestic supplies shows a slight increase over that of the previous year. The total domestic
VAT collected for the year was 120 Billion and this amount was an increase of 16.5 Billion over
that of the year 2009 which was Rs 103.5.Billion. The total VAT collected on imports during
the year 2009 was Rs 67.6 Billion and in the year, 2010, it was Rs 99.5 Billion.
Table 10 shows the Sector wise classification of Value Added Tax collection and the
contribution to the GDP.
Sector wise Analysis of VAT Contribution to GDP
Sector Net Collection (Rs) % % of VAT Collection to GDP
2010 2009
Manufacturing Sector 31,705,003,722.00 14.44% 0.57 0.58
Non Manufacturing Sector 88,280,407,765.00 40.21% 1.58 1.56
On Imports 99,577,710,759.00 45.35% 1.77 1.4
Total 219,563,122,247.00 100% 3.91 3.54
Table 10

17
Performance Report 2010
Table 11 shows the Value Added Tax Gross Collection and Refunds, and the net Collection,
sector wise, which is illustrated by Chart 05.
Value Added Tax Gross Collection and Refunds
2009 2010
Sector Net Collection
(Rs. Mn) Gross Collection
(Rs. Mn) Refunds
Net Collection (Rs. Mn)
Manufacturing 28,220.54 39,282.04 7,577.04 31,705.00
Non- Manufacturing
-Services 54,267.71 59,664.36 1,292.61 58,371.75
-Financial Services 20,949.92 29,826.27 29,826.27
-Optional VAT 61.95 75,279.58 82.38 89,573.01 82.38 88,280.40
Imports 67,619.45 99,577.83 0.12 99,577.71
Total 171,117.57 228,432.88 8,869.77 219,563.11
Table 11
2.8.1 Industry-wise Analysis
Table 12 shows the domestic VAT industry-wise analysis, such as banking, insurance, hotel
& restaurant, construction, electricity & gas, imports, financing and their contribution to the
total VAT revenue.
Manufacturing Sector 14.46%
Non Manufacturing Sector 40.27%
Imports 45.27%
Chart 05
Value Added Tax Collection - 2010

18
Performance Report 2010
Gross Domestic VAT – Manufacturing and Service Sectors
Year 2008
(Rs.Mn) %
Year 2009
(Rs.Mn) %
Year 2010
(Rs.Mn) %
Banking 14,708 13.10% 15,669 14.00% 21,391 36.52%
Insurance 3,689 3.30% 2,674 2.40% 3,370 26.02%
Hotel & Restaurant 3,324 3.00% 2,495 2.20% 3,882 55.63%
Construction 8,178 7.30% 6,401 5.70% 6,077 -5.07%
Electricity & Gas 391 0.30% 1,723 1.50% 151 -91.23%
Imports 10,166 9.10% 7,687 6.90% 11,914 54.99%
Financing 10,717 9.60% 10,664 9.50% 13,354 25.23%
Communication 5,411 4.80% 4,140 3.70% 7,111 71.77%
Petroleum Product 1,556 1.40% 5,533 4.90% 2,438 -55.94%
Beverage –Alcoholic 7,484 6.70% 8,650 7.70% 10,887 25.86%
Services not classified 7,057 6.30% 1,560 1.40% 7,085 354.26%
Manufacturing not classified 6,012 5.40% 5,971 5.30% 6,507 8.99%
VAT on Financial Services & Others 33,260 29.70% 38,733 34.60% 25,817 -33.35%
Total 111,954 100 111,899 100 119,985 7.23%
Table 12
Import and supply of light weight electrical and electronic items under the certain HS code
were exempted from VAT with effected from 01.06.2010
2.9 Economic Service Charge (ESC) Collection
During the year, 1,541 new ESC files were opened increasing the total to 14,355 as at
31.12.2010.
The Department collected Rs. 18,048 Mn. as ESC during the year, and its contribution to the
total collection was 4.27%. It recorded 120 percent growth of the collection as against the
estimate for the year.
Table 13 shows sector - wise analysis of Corporate and Non Corporate of Economic Service
Charge collection for the year 2010 and Chart 06 illustrates it.
Economic Service Charge Collection- 2010
Sector Collection %
Corporate Sector 16,350,031,690.09 90.60%
Non Corporate Sector 1,697,691,485.67 9.40%
Total 18,047,723,175.76 100%
Table 13

19
Performance Report 2010
Corporate Sector
90.60%
Non Corporate Sector
9.40%
Chart 6
Economic Service Charge Collection 2010
2.10 PAYE Collection
Gross revenue collected under PAYE scheme, during the year, was Rs.16, 312 Million (in 2009–
Rs.: 14,536 Mn.) which is part of Income Tax collection.
The number of employees paying income tax under Pay-As-You-Earn (PAYE) scheme
recorded 530,213. (Not including the number of employees in the incomplete declarations
furnished by certain employers) and the number of employers registered under PAYE Scheme
was 14,534.
Analysis of Tax under PAYE and Level of income
Range of Income Total Gross
Remuneration No. of
Employees Tax under PAYE
Paid
Below 300,000
Tax not deducted 41,469,355,614.32 281,972
Tax deducted 182,998,224.49
300,001 - 600,000 45,325,091,275.86 106,540 709,935,978.75
600,001 - 800,000 28,487,940,494.67 41,083 845,578,174.05
800,001 - 1,000,000 21,216,809,207.74 23,075 961,216,067.33
1,000,001 - 1,200,000 12,511,456,616.07 58,441 785,680,069.35
1,200,001 - 1,400,000 6,944,988,664.48 5,513 631,577,156.07
1,400,001 -1,900,000 10,538,688,391.96 6,376 1,260,750,680.93
Above 1,900,000 27,542,672,331.25 7,213 6,502,363,136.23
Total 194,037,002,596.35 530,213 11,880,099,487.20
Note: This information is based on records in the completed returns furnished by the employers for the Y/E 2009/2010
Table-14
2.11 Withholding Taxes (on interest and specified fees)
WHT on interest recorded a collection of Rs. 29,422,008,983/- during the year, which consists
Rs. 22,325,326,102/- on Treasury Bills and Bonds (Rs. 35,785,982,991/- for the year 2009) and

20
Performance Report 2010
the balance from other instruments (deposits etc). WHT revenue on interest declined by Rs.1,
834 Mn against the estimated for the year. Due to the reduction of interest rate of deposit by
the Central Bank, investors moved to the share market. This may be a reason for the drop of
the WHT revenue of interest.
Rs. 9,239,680,706/- Mn. was collected as WHT on Specified Fees (Rs 8,610,067,557/- Mn for the
year 2009) through 6,816 permanent withholding taxpayers sending monthly schedules
during the year. Number of 80,520 monthly schedules received from them, recording 98.4%
compliance rate. The facility of directions for non-deduction available to ESC payers resulted
in drop of the WHT revenue on specified fees against the estimated for the year, (Rs
11,344Mn).
2.12 Stamp Duty Collection
Rs 4,440 Mn. generated from Stamp Duty during the year as against the estimate of Rs. 4,204
Mn. This shows that 105% of the estimate is achieved. The total collection of Stamp Duty
increased by 33.41% when compared to year 2009.
The Department conducted advisory and supervisory visits with view to enhance the tax base
and accordingly 156 places were visited in the year 2010. Numbers of regular registered
compounding agents of Stamp Duty were 7364, and out of this 6,758 have furnished schedules
recording a 99 % compliance.
2.13 Betting & Gaming Levy Collection
During the year, collection of Betting and Gaming levy was Rs.294, 841,046/-. This reflects a
marginal decline by Rs. 5,158,954/-when compared with the estimated for the year. However,
this collection showed an increase of 9.8Mn than the previous year.
Prosecution actions were taken during the year against the number of 27 defaulters by the
Betting and Gaming Levy Branch.
Table 15 compares the Revenue Estimate of Betting and Gaming Levy with the Revenue
Collected in the year.
Collection of Betting & Gaming Levy -2010
Estimated Revenue (Rs.)
Actual Collection (Rs.)
%
300,000,000 294,841,046 98.28%
Table 15

21
Performance Report 2010
292
293
294
295
296
297
298
299
300300.00
294.84Re
ven
ue
Mill
ion
s
Chart 7
Collection of Betting & Gaming Levy -2010
Estimated Revenue Actual Collection
2.14 Debits Tax Collection
Debits Tax generated Rs. 10,843Mn and constituted 2.58% of the total revenue collection
during the year. The Debits Tax collection could increase the target by Rs 1, 284Mn set for the
year and it reflects 35% increase over the corresponding figure in 2009.
Table 16 compares the revenue estimate of Debits Tax with the revenue collected during the
year, and the Chart 08 illustrates it.
Debits Tax Collection – 2010
Estimated Revenue (Rs)
Revenue Collection (Rs)
%
9,559,000,000 10,843,436,359 113.00%
Table 16
8,800
9,000
9,200
9,400
9,600
9,800
10,000
10,200
10,400
10,600
10,800
11,000
9,559
10,843
Re
ven
ue
M
illio
ns
Chart 8
Debits Tax Collection – 2010
Estimated Revenue (Rs) Revenue Collection (Rs)

22
Performance Report 2010
2.15 Construction Industry Guarantee Fund Levy Collection
Revenue collection from Construction Industry Guarantee Fund Levy exceeded the estimate
by Rs. 49,785,134/-. With its contribution of Rs 829,785,134/- to the total revenue. As a
percentage of the estimate, it recorded the rate of 106% during the year. This increase shows
the success of policy change made by introducing withholding system to this levy. 171
Construction Levy payers have been registered for paying this levy and all have submitted the
declarations on time with due payments, recording 100% compliance.
2.16 Nation Building Tax (NBT) Collection
Collection from NBT for the year exceeded the estimate by 660 Mn and contributed 10.89% to
the total revenue collection. Total number of tax payers registered for NBT as at 31. 12. 2010
was 14,627. Out of the companies registered for NBT are 8,783 and the rest are individuals and
partnerships. NBT collection has recorded a 100% achievement of the estimate for the year.
NBT revenue increased by 69% to 46,022 Mn in 2010.
Analysis of NBT collection -2010
Sector Net Collection
(Rs.)
Manufacturing 7,714,130,983.00
Services 11,595,944,639.00
Imports 26,712,441,526.00
Total 46,022,517,148.00
Table 17
Nation Building Tax Collection – 2010
Estimated Revenue (Rs)
Revenue Collection (Rs)
%
45,362,000,000 46,022,517,147 101%
Table 18

23
Performance Report 2010
45,000
45,100
45,200
45,300
45,400
45,500
45,600
45,700
45,800
45,900
46,000
46,100
45,362
46,023
Re
ven
ue
Mill
ion
s
Chart 9
Nation Building Tax Collection – 2010
Estimated Revenue (Rs) Revenue Collection (Rs)
Importation of gold was exempted from NBT with effect from 01.03.2010
2.17 Inland Revenue Collection 2006 to 2010
Figures in Table 19 represent the tax wise classification of revenue collection of the Department,
from 2006 to 2010.
Inland Revenue Collection 2006 to 2010 – Tax wise Analysis
Type of Tax
2006 2007 2008 2009 2010 Colln.
%
Colln.
%
Colln.
%
Colln.
%
Colln.
% (Rs. Mn)
(Rs. Mn)
(Rs.Mn) (Rs.Mn) (Rs.Mn)
Income Tax 71,481 28.22 94,965 30.81 112,065 32.52 125,350 35.51 117,575 27.83
Economic Service Charge 8,853 3.49 12,203 3.96 14,476 4.02 14,207 4.02 18,048 4.27
Value Added Tax 164,071 64.77 186,991 60.67 202,984 58.91 171,118 48.47 219,563 51.97
Debits Tax 6,255 2.47 7,187 2.33 8,410 2.44 8,036 2.29 10,843 2.58
Betting & Gaming Levy 282 0.11 268 0.09 270 0.08 269 0.07 295 0.07
Share Transaction Levy 420 0.17 412 0.13 449 0.13 560 0.16 2,273 0.53
Turnover tax 233 0.09 461 0.15 535 0.16 337 0.1 388 0.09
Stamp Duty 1495 0.59 4,026 1.31 3,751 1.09 3,327 0.94 4,440 1.05
Estate Duty 0.6 0 0 0 0 0 0 0 0

24
Performance Report 2010
Goods & Services Tax 136 0.05 142 0.05 127 0.04 56 0.01 39 0.00
National Security Levy 93 0.04 105 0.03 68 0.02 17 0.004 23 0.00
Construction Industry Guarantee Fund Levy
24 0.01 56 0.02 230 0.07 571 0.16 830 0.20
NBT 0.00 0.00 0 0 0 0 27,205 7.71 46,022 10.89
Social Responsibility Levy
0.00 0.00 1,389 0.45 1,206 0.35 1,962 0.56 2173 0.52
253,344 100 308,205 100 344,571 100 353,015 100 422,512 100
Table 19
Sector wise Analysis of Revenue Collection from Files attached to Large Tax Payers
Units and International Unit.
Revenue collections of Large Taxpayers Units constitute more than 60% of the total revenue of
the department. Table 20 shows the sector wise analyses of revenue collection of total files attach
to Large Taxpayers units and International Unit during the year 2009 and 2010.
0
50,000
100,000
150,000
200,000
250,000
2006 2007 2008 2009 2010
Re
ve
nu
e
Year
Chart 10
Inland Revenue Collection 2006 to 2010 – Tax wise Analysis
Income Tax Economic Service Charge
Mil
lio
ns

25
Performance Report 2010
Sector 2009 2010
Agriculture 704,119,455 1,167,684,186
Alcohol & Beverages 11,527,949,430 14,695,070,049
Bank, Investment companies, Money lending and leasing
35,203,988,610 37,854,812,051
Construction 7,094,371,316 7,021,604,471
Exporter 2,917,606,556 3159568179
Fishing 44,427,117 28,837,488,
Whole sale and retail 1,661,587,754 1,805,155,650
Hotels 2,561,735,140 3,418,001,062
Importer 9,851,540,316 13,748,377,671
Manufacturing 27,339,464,561 33,705,571,254
Mining and quarrying 54,138,113 117,462,782
Poultry 829,992,325 1,128,088,357
Petroleum 6,276,098,545 4,015,857,366
Services 17,790,195,720 20,203,463,006
Telecommunication & Broadcasting 13,905,890,184 15,712,721,165
Tobacco 9,572,741,877 9,848,082,546
Trade 6,514,903,536 4,015,470,034
Table 20

26
Performance Report 2010
Chapter 3 - Expenditure and Productivity Ratio
Total expenditure of the Department in the year was Rs.1, 597 Mn which recorded a 42%
decrease when compared with the previous year figure Rs.2, 759 Mn. Out of the total
expenditure, 90% or Rs.1, 442 Mn was incurred as recurrent expenditure which was a
decrease by 4% as against that of 2009 which was Rs 1,495 Mn. Expenditure on
emoluments increased by 1% to 1,081 Mn from 1,072 Mn in 2009. This was the largest
single expenditure item which accounted for 67.68% of total expenditure and 75% of
recurrent expenditure.
The capital expenditure during the year recorded a huge decrease of 88% compared to
2009 and reached Rs. 155 Mn. (That was 1,263Mn in 2009). Out of the total expenditure
of the Department, 10% represents capital expenditure; that ratio was 46% in the
previous year.
The Internal Audit
Audits carried out by the Internal Audit Branch included examining of all payment
vouchers relating to capital and, recurrent expenditure including incentive payments,
daily vehicle running charts (maintained by the head office and regional offices), pay
sheets, the board of survey reports , the Appropriation Account for the year 2009 and
bank reconciliation 2010. In addition to these activities, examining the action taken to
recover the amounts due on dishonored cheques, revenue accounts relating to VAT and
Income Tax, checking the unsettled imprest for the year 2008, Public Servants Advance
Account for the year 2009 and the refund of taxes were the other main tasks performed
by the Internal Audit Branch. After carrying out the above audit procedures, 72 Internal
Audit quarries were raised.

27
Performance Report 2010
3.1 Comparison of the Total Expenditure incurred during the year with 2008 , 2009 and 2010
Total Expenditure- 2008, 2009 and 2010
Description 2008
(Rs:’000) %
2009 (Rs:’000)
% 2010
(Rs:’000) %
Recurrent Expenditure
Emoluments 1,045,957 74.89% 1,072,170 38.85% 1,081,102 67.68%
Traveling 17,612 1.26% 9,512 0.34% 7,647 0.48%
Supplies &Equipments 48,685 3.49% 51,652 1.87% 55,603 3.48%
Repairs & Maintenance 32,822 2.35% 32,401 1.17% 21,650 1.36%
Contracted Services 133,650 9.57% 318,665 11.56% 264,372 16.55%
Transfers 11,494 82% 11,501 0.42% 11,309 0.71%
Other Recurrent Exp. - 0.00% - 0.00% - 0.00%
Modernization Programme - 0.00% - 0.00% - 0.00%
Sub Total 1,290,220 1,495,901 1,441,684
Capital Expenditure
Reconstruction and Improvements 34,985 2.51% 1,095,330 39.69% 131,178 8.21%
Acquisitions 68,910 4.93% 155,947 5.65% 15,636 0.98%
Capacity Building 12,382 0.45% 8,964 0.56%
Skill Development 2,483 0.18% - 0.00% - 0.00%
Sub Total 106,378 1,263,659 155,778
Total 1,396,598 100% 2,759,561 100% 1,597,462 100%
Table 21
Note :WHT (IT ) deductedby the department during the year-2010 -3.4 Mn VAT (withheld) by the department during the year-2010 – 6.4 Mn
0
500,000
1,000,000
1,500,000
2,000,000
2,500,000
3,000,000
2008 2009 2010
Th
ou
san
ds
Year
Chart 11
Total Expenditure- 2008, 2009 and 2010
Recurrent Expenditure Capital Expenditure

Performance Report 2010
3.2 Analysis of the Recurrent Expenditure in 20
3.3 Productivity Ratio
The total expenditure of the Department in the year w
revenue collected was Rs. 421,838,781,198/
collected for every rupee of expenditure) therefore, works out to 264:1. In other words,
the cost of collection for Rs. 100 was 38 cents. The Cost of collection per Rs.
excluding VAT and NBT on Imports accounted 54 Cents (In the previous year this
amounts were 78 cents and Rs 1/
Table 22 provides a classification of Revenue Collection, Total Expenditure and the cost
of collection from the year 2008
Revenue Collection, Total Expenditure and Cost of Collection (Rs. Mn
Revenue Collection
Income Tax
Economic Service Charge
Value Added Tax
Debits Tax
Betting & Gaming Levy
Share Transaction Levy
Traveling
0.48%
Supplies &
Equipments
3.48%
Repairs &
Maintenance
1.36%
Contracted Services
16.55%
Transfers
0.71%
Analysis of the Recurrent Expenditure in 2010
The total expenditure of the Department in the year was Rs. 1,597,461,930/
evenue collected was Rs. 421,838,781,198/-. The Productivity Ratio (i.e. the revenue
collected for every rupee of expenditure) therefore, works out to 264:1. In other words,
the cost of collection for Rs. 100 was 38 cents. The Cost of collection per Rs.
excluding VAT and NBT on Imports accounted 54 Cents (In the previous year this
amounts were 78 cents and Rs 1/- respectively).
Table 22 provides a classification of Revenue Collection, Total Expenditure and the cost
of collection from the year 2008 to the year 2010.
Revenue Collection, Total Expenditure and Cost of Collection (Rs. Mn
2008 2009
112,065.30 125,350.80
Economic Service Charge 14,475.90 14,207.30
202,984.40 171,117.60
8,410.10 8,036.00
Betting & Gaming Levy 269.7 268.5
Share Transaction Levy 448.9 560.2
Traveling
0.48%
Transfers
0.71%
Chart 12
Recurrent Expenditure - 2010
28
as Rs. 1,597,461,930/- and the
. The Productivity Ratio (i.e. the revenue
collected for every rupee of expenditure) therefore, works out to 264:1. In other words,
the cost of collection for Rs. 100 was 38 cents. The Cost of collection per Rs. 100,
excluding VAT and NBT on Imports accounted 54 Cents (In the previous year this
Table 22 provides a classification of Revenue Collection, Total Expenditure and the cost
Revenue Collection, Total Expenditure and Cost of Collection (Rs. Mn)
2009 2010
125,350.80 117,575.26
14,207.30 18,047.72
171,117.60 219,563.12
8,036.00 10,843.44
268.5 294.84
560.2 2,272.96
Emoluments
67.68%

29
Performance Report 2010
Turnover Tax 535.3 336.7 388.29
Stamp Duty 3,750.60 3,327.90 4,439.84
Estate Duty 0 0 0
Goods & Services Tax 126.7 55.7 38.53
National Security Levy 67.6 17.2 23.22
Construction Industry Guarantee Fund Levy 229.9 570.9 829.79
Social Responsibility Levy 1206.4 1,962.10 2,172.63
Nation Building Tax 27,204.60 46,022.52
Total 344,570.80 353,015.50 422,512.16
Expenditure
Recurrent Expenditure
Emoluments 1,045.90 1,072.10 1,081.10
Traveling 17.60 9.50 7.65
Supplies & Equipment 48.70 51.70 55.60
Repairs & Maintenance 32.8 32.4 21.65
Contracted Services 133.7 318.7 264.37
Transfers 11.5 11.5 11.31
Others 0.00 0.00 0.00
Capital Expenditure
Reconstruction & Improvements 34.9 1,095.30 131.18
Acquisitions 68.9 156 15.64
Capacity Building - 12.4 8.96
Skill Development 2.5 -
Total Expenditure 1,396.50 2,759.60 1,597.46
Cost of Collection per Rs.100, Rs. 0.4 0.78 0.37
Cost of Collection per Rs. 100, excluding VAT & NBT on imports 1 0.54
Table 22

30
Performance Report 2010
Chapter 4 - Taxes in default
Table 23 shows the amounts of taxes in default, the taxes held over and the collectible
taxes in default excluding Penalty, as at 31.12.2010
Analysis of the default taxes – as at 31.12.2010
Type of Tax Gross Tax in
Default Total Penalty
(Rs.)
Total Default Taxes
Excluding Penalty (Rs.)
Disputed Tax excluding
Penalty (Rs.)
Collectible Tax
excluding Penalty (Rs.)
Income Tax 93,494,467,703 34,037,193,473 59,457,274,230 48,100,045,531 11,357,228,699
Surcharge on Income Tax
1,457,828,113 475,330,848 982,497,265 732,264,138 250,233,127
Value Added Tax 95,139,970,990 30,576,910,300 64,563,060,690 51,310,827,335 13,252,233,355
Economic Service Charge
6,763,068,561 2,880,014,896 3,883,053,665 2,451,952,043 1,431,101,622
Wealth Tax 90,433,504 90,433,504 82,987,632 7,445,872
Surcharge on Wealth Tax
3,189,029 3,189,029 3,120,276 68,753
Gift Tax 13,926,258 13,926,258 10,375,990 3,550,268
Income Tax (WHT on Interest)
2,188,745,265 657,881,339 1,530,863,926 1,506,732,855 24,131,071
Stamp Duty 66,384,917 15,783,405 50,601,512 50,601,512
Goods & Services Tax
1,271,238,390 1,271,238,390 1,053,549,520 217,688,870
Turnover Tax 7,096,278,529 2,294,175,952 4,802,102,577 4,329,120,997 472,981,580
National Security Levy
5,014,000,101 1,457,051,336 3,556,948,765 3,311,674,612 245,274,153
Save the Nation Contribution
52,833,300 12,120,842 40,712,458 38,439,961 2,272,497
Compounding Penalty
13,471,224 13,471,224 13,471,224 -
Obsolete Taxes 182,264,807 182,264,807 13,774,618 168,490,189
Social Responsibility levy
4,885,827 4,885,827 97,763 4,788,064
Nation Building Tax
1,578,287,884 428,570,109 1,149,717,775 795,463,870 354,253,905
Total 214,431,274,402 72,835,032,500 141,596,241,902 113,753,898,365 27,842,343,537
Table 23

31
Performance Report 2010
Under the supervision of the Special Collection Unit, the Department was able to collect
Rs.11.52 billion of default taxes out of the outstanding taxes as at 31.12.2008 during the
year, as against the target set only at Rs.15 Billion for the year. Furthermore, taxes in
default amounting to Rs 13,045 Mn. were collected during the year, including dues on
assessments during the year 2010. Table 24 and 25 shows the amounts of default taxes
collected during the year.
Collection of arrears during the year out of the default taxes as at 31.12.2010
Target of collection
of default Taxes (Rs.)
Amount collected
during the year (Rs.)
Progress of the collection
15,000,000,000 11,523,381,984 76.82%
Table 24
Analysis of Revenue Collection of Default Taxes 2008-2010
Non Self Assessment
2010(Rs. ‘000) 2009 (Rs. ‘000) 2008 (Rs. ‘000)
Income Tax 6,844,105,711 7,821,560 5,316,698
VAT(Excluding VAT on imports) 4,884,494,247 7,074,945 4,478,467
Others 1,317,253,046 779,806 257,808
Total 13,045,853,004 15,676,311 10,052,973
% to the Total Revenue (Excluding VAT and NBT on Imports)
4.40% 5.79% 4.12%
Table 25

32
Performance Report 2010
Chapter 5 - Audits, Additional Tax Collections, Refunds, Recovery Action and
Appeals
5.1 Audits
Audits and investigations are undertaken with a view to achieve the widest possible
coverage of the taxpayer population, in terms of business activity, entity type and
business size. It has been, however, found that the utilization of the investigation
resources in the area of large taxpayers is more productive than in the others. The
number of audits carried out during the year was less than the previous year, since
officers had to engage in work of shifting offices to the refurbished Head Office
Building after the terrorist attack from the temporary relocated premieres. However,
audit functions were carried out in a satisfactory level resulting in collection of an
additional tax amounting to Rs. 8 Billion, in the year. Number of Audits conducted
and additional tax collected are shown in the table 26 and 27. Out of the total
additional tax agreed, 92% (9.8Billion) additional revenue has been imposed on
Corporate Sector.
Particulars of Audits and Additional Tax Collection during the year.(Rs.000.)
Income
Tax PAYE VAT ESC NBT Other Total
Total amount of additional tax assessed during the year
9,302,813 53,154 5,896,476 1,280,547 200,680 679,925 17,413,595
Total amount of additional tax collected during the year
8,605,278 43,159 5,133,092 1,093,388 157,330 679,057 15,711,304
Number of Audit cases commenced during the year 2010
6,463
Number of Audit cases finalized during the year 2010
6,179
* Penalty due on Additional Tax has not been included. Table 26
Classification of Additional Taxes by Corporate and Other units (excluding penalty)
Description
Additional Income/Turnover Assessed & Agreed
(Rs)
Additional Tax Assessed & Agreed (Rs.000) Additional Tax Collected (Rs)
(Includes Refunds claims setoff)
Corporate - LTU
Corporate - Other
Other Units
Total
Income Tax 72,135,907 7,090,523 1,477,644 734,646 9,302,813 8,605,278
VAT 28,684,930 3,014,596 873,552 2,008,328 5,896,476 5,133,092
ESC 33,348,630 990,715 249,179 40,653 1,280,547 1,093,388
PAYE 2,303,924 33,204 19,950 53,154 43,159
NBT 2,169,054 64,324 42,666 93,690 200,680 157,330
Others 4,172,324 675,165 4,760 679,925 679,057
Total 142,814,769 11,868,527 2,667,751 2,877,317 17,413,595 15,711,304
Table 27

33
Performance Report 2010
5.2 Appeals Appeals to the Commissioner General
During the year, the Department has finalized 2,075 appeals received against the
assessment issued and the analysis of appeal position is as follows:
Analysis of the Appeal Received and Settlement
Income Tax
Value Added Tax
Others Total
Balance as at 01.01.2010
Units (as per APL 2) 430 692 53 1175
Appeal Branch (as perAPL2) 44 48 15 107
CGIR' s Hearing 45 56 33 134
Registered (as per APL 2) during the year 610 566 100 1276
Finalized
Determined ( CGIR) 83 164 45 292
Units (APL 4) 761 998 117 1876
Appeal Branch 69 43 9 121
Submitted for CGIR's hearing 63 246 36 345
Balance as at 31.12.2010
Units (as per APL 2) 279 260 36 575
*Appeal Branch (as per APL2) 82 102 28 212
CGIR' s Hearing 25 138 24 187
*Files received to Appeal branch during the year 170 343 58 571
Table 28
5.3 Board of Review
The position regarding the appeals made to the Board of Review was as follows:
Number of appeals pending before the Board as at 01-01-2010
99
Number of appeals lodged during the year
• Income Tax 14
• VAT 16
• GST 1
• Penalty 1
• BTT 4 36
Number of orders issued on conclusion of hearing
37
Number of appeals outstanding as at 31-12-2010
98
The Board of Review took up 33 cases for hearing during the year, and 37 orders were issued on conclusion as indicated above.
Cases stated during the year for the opinion of the Court of Appeal – 22

34
Performance Report 2010
5.4 Post VAT refund audits
Special VAT audit branch of the Department completed 177 cases (files) as post VAT
refund audits during the year covering 3,987 taxable periods, resulting in the
collection of Rs.1,211,609,295/- as additional tax. Numbers of 7 cases were reported to
legal branch for prosecution actions under Section 67 of the Value Added Tax Act.459
cases of Post VAT refund in the other units have been selected for audit and 494 cases
were completed with outstanding cases as at 31.12.2009.
5.5 Recovery Action
Following table shows the number of cases attended and notices issued for recovery of
taxes during the year.
Recovery Action
Cases Notices
Issuing Seizer Notices 3366 3120
Prosecution Action 1736 1635
Other Action 1034 899
Table 29
5.6 Refunds
An analysis of refunds made during the year (excluding the refunds, which were set
off against outstanding taxes) is as follows:
Type of Tax
2010 2009
Amount of Refund Rs:
% to Net Revenue
Collection of each tax
Amount of Refund Rs:
% to Net Revenue
Collection of each tax
VAT 8,869,784,827.36 4.05% 8,400,766,072.00 4.91%
Debit Tax 1,814,672.89 0.02% 8,988,276.00 0.11%
Stamp Duty 2,162,855.00 0.05% 2,138,676.00 0.06%
Co-operate Income Tax 609,584,440.29 1.07% 95,672,184.00 0.19%
PAYE 43,757,498.00 0.27% 90,319,430.00 0.63%
WHT (On Interest 10%) 3,542,706.80 0.01% 3,461,417.00 0.01%
WHT (On Specified Fees) 28,804,937.75 0.31% 26,675,308.00 0.31%
Other Non Corporate Income Tax
61,638,570.34 1.12% 114,100,114.00 2.21%
Total 9,621,090,508.43 2.28% 8,472,121,477.00 0.02%
Table 30

35
Performance Report 2010
The Department received 1,046 VAT refund claims (with bank guarantee) during the
year and (together with the balance cases remained as at 31.12.2009) 1,549 cases were
finalized during the year, Accordingly, Rs 2,173 Million was refunded in the year.
VAT refund claims totaling to 24,250 (without bank guarantee) were received during
the year and 14,732 cases were finalized by refunding Rs. 6,541 Million in the year.
Out of the total amount refunded during the year a sum of Rs: 312 Mn has been
transferred / set off against outstanding taxes.
In addition to the refunds 2,005 Credit Vouchers were issued on claims received
up to 30.11.2010. The refunds include the Input tax of Rs.2, 223 Million refunded
in relation to supplies made to the special projects (number of cases 2,234).
Furthermore, 1643 valid refund cases of Income Taxes were completed during the
year.

36
Performance Report 2010
PART III
Chapter 6 - International Relations
6.1 Double Tax Avoidance Treaties
Countries enter into Double Tax Treaties to eliminate or mitigate the incidence of
juridical double taxation and fiscal evasions in the international trade (or transactions).
These Treaties are particularly important for developing countries as they play a great
role in attracting foreign investments, expertise, modern technology etc.
Sri Lanka has as at 31-12-2010 entered into tax treaties with 38 countries as referred to
in the Table-31.
The countries with which double tax treaties are in force as at 31-12-2010
Country Date of
Signing the Agreement
Gazetted Operative in Sri Lanka From the
Year of Assessment
Gazette No.
Date
1 Australia 18-Dec-89 657/2 08-Apr-91 1992/93
2 Bangladesh 24-Jul-86 448/13 07-Apr-87 1989/90
3 Belgium 03-Feb-83 292/6 09-Apr-84 1984/85
4 Canada 23-Jun-82 253/8 13-Jul-83 1986/87
5 China 11-Aug-03 1374/20 06-Jan-05 2006/07
6 Denmark 22-Dec-81 228/15 20-Jan-83 1980/81
7 France 17-Sep-81 210/17 17-Sep-82 1982/83
8 Finland 18-May-82 253/8 13-Jul-83 1981/82
9 Germany 13-Sep-79 113 31-Oct-80 1982/83
10 Hong Kong (Limited) 26-Mar-04 1374/21 06-Jan-05 2005/06
11 India 27-Jan-82 210/17 17-Sep-82 1980/81
12 Indonesia 03-Feb-93 789/10 21-Oct-93 1995/96
13 Iran 25-Jul-00 1187/16 06-Jun-01 2002/03
14 Italy 28-Mar-84 322/4 05-Nov-84 1978/79
15 Japan 12-Dec-67 14803/5 29-May-68 1969/70
16 Korea 28-May-84 342/11 29-Mar-85 1980/81
17 Kuwait 05-Feb-02 1245/19 18-Jul-02 2002/03
18 Malaysia 16-Sep-97 1028/21 22-May-98 99/2000
19 Mauritius 12-Mar-96 958/10 15-Jan-97 1998/99
20 Nepal 06-Jul-99 1116/6 26-Jan-00 2001/02
21 Netherlands 17-Nov-82 281/13 26-Jan-84 1979/80

37
Performance Report 2010
22 Norway 01-Dec-86 464/4 27-Jul-87 1989/90
23 Oman (Limited) 26-Jul-94 881/7 26-Jul-95 1979/80
24 Pakistan 15-Oct-81 210/17 17-Sep-82 1983/84
25 Philippines 11-Dec-00 1237/7 21-May-02
2010/11 1256/27 02-Oct-02
26 Poland 25-Apr-80 130 27-Feb-81 1984/85
27 Qatar 07-Nov-04 1422/10 05-Dec-05 2008/09
28 Romania 19-Oct-84 371/9 15-Oct-85 1986/87
29 Russia 02-Mar-99 1101/22 15-Oct-99 2003/04
30 Saudi Arabia (Limited) 16-Dec-99 1101/23 15-Oct-99 1983/84
31 Singapore 29-May-79 57/11 10-Oct-79 1977/78
32 Sweden 23-Feb-83 297/28 18-May-84 1985/86
33 Switzerland 11-Jan-83 292/6 09-Apr-84 1981/82
34 Thailand 14-Dec-88 571/16 18-Aug-89 1990/91
35 U.A.E. (Limited) 07-Jul-92 824/13 23-Jun-94 1979/80
U.A.E. (Comprehensive) 24-Sep-03 1346/1 21-Jun-04 2004/05
36 U.K. 21-Jun-79 60/23 02-Nov-79 1977/78
37 U.S.A 14-Mar-85 398/4 22-Apr-86
2004/05 U.S.A. Protocol 20-Sep-02 1298/8 21-Jul-03
38 Vietnam 26-Oct-05 1455/9 24-Jul-06 2007/08
Table -31
6.2 Affairs related to Double Tax Treaties during the year 2010 -
Treaty with Saudi Arabia
The approval of the cabinet was obtained on 09-06-2010 for signing the agreement at
Government level and for presenting for Parliamentary approval.
Agreement with Seychelles
The approval of the cabinet was obtained on 01-01-2010 for signing the agreement at
Government level and for presenting for Parliamentary approval.
Agreement with Bahrain
Documents were prepared on official papers in English, Sinhala and Arabic for the
purpose of signing at Government Level.
Agreement with South Africa
Awaited for signature at Government level.

38
Performance Report 2010
6.3 Participations at International Taxation Matters Abroad
No
Name and
Designation of the
officer
Name of the
Programme Country Duration
01 Mr. H.B.A. Senevirathne
DCGIR
31st CATA Annual
Technical Conference 2010
Abuja-Nigeria 10.10.2010-
16.10.2010
02 Mr. K.A.P. Kaluarachchi
SCIR
- do - Abuja-Nigeria 10.10.2010-
16.10.2010
03 Mr. P.G.K.
Samarathunga
DC
- do - Abuja-Nigeria 10.10.2010-
16.10.2010
04 Mr. O.P.P.K. Sirisena -
DC
- do - Abuja-Nigeria 10.10.2010-
16.10.2010
05 Mr. H.M.G. Wijesinghe-
DC
- do - Abuja-Nigeria 10.10.2010-
16.10.2010
06 Mr. M.S.M. Fuward
DC
International Tax Dialogue
Conference on “Taxing
Micro and Small Business”
The Philippines 02.03.2010-
05.03.2010
07 Mr. P.M. Dissanayake-
DC
International Tax Dialogue
Conference on “Taxing
Micro and Small Business”
The Philippines 02.03.2010-
05.03.2010
08 Mr. J. Rathnayake
DC
International Tax Dialogue
Conference on “Taxing
Micro and Small Business”
The Philippines 02.03.2010-
05.03.2010
Table -32

39
Performance Report 2010
Chapter 7 - Legislation
7.1 Approved Charities
The following institutions were declared as approved charities during the year.
S/N Name and Address of the Organization Gazette Number
Date
(i)
Fund for the construction of Sri Dhammarathi Ruhunu Temple of sacred Tooth Relic & Pirivena Monastery Building for Conducting meditation training in Kithalgama west, Thihagoda, Mathara.
7/1638 22.01.2010
(ii)
Prithipura Infant Home, Prithipura Society, Prithipura Road, Hendala, Waththala.
7/1638 22.01.2010
(iii)
Building Renovation Fund of Midddeniya Ancient Viharaya, Middeniya PuranaMaha Viharasthanabhiwardhana Sabawa, Midddeniya Ancient Viharaya, Middeniya.
1672 17.09.2010
(iv)
Shanthi Niwasa of the Missionaries of Charity, Missionaries of Charity, St. Jhon’s way, Modara, Colombo 15.
1667 13.08.2010
(v)
Jagaddala Development Center for the children of the Jagaddala social welfare institute, Sri Punyawardhanaramaya, Jagaddala social welfare institute, Kindelpitiya, Bandaragama
1660 24.06.2010
(vi)
Monastery Building Fund of Botale Sri Gotabaya Rajamaha Viharaya, Sri Gotabaya Rajamaha Viharaya, Botale, Ambepussa.
1676 15.10.2010
The total number of charitable institutions that were performing as at 31.12.2010 is 563.
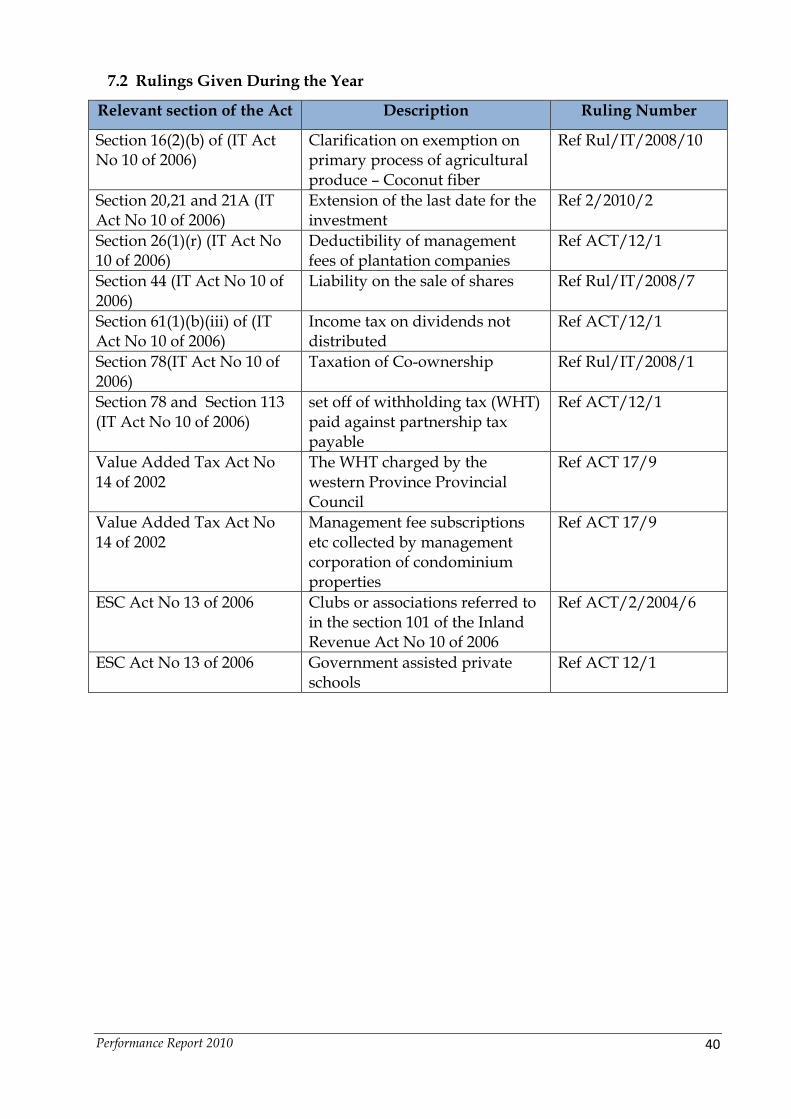
40
Performance Report 2010
7.2 Rulings Given During the Year
Relevant section of the Act Description Ruling Number
Section 16(2)(b) of (IT Act No 10 of 2006)
Clarification on exemption on primary process of agricultural produce – Coconut fiber
Ref Rul/IT/2008/10
Section 20,21 and 21A (IT Act No 10 of 2006)
Extension of the last date for the investment
Ref 2/2010/2
Section 26(1)(r) (IT Act No 10 of 2006)
Deductibility of management fees of plantation companies
Ref ACT/12/1
Section 44 (IT Act No 10 of 2006)
Liability on the sale of shares Ref Rul/IT/2008/7
Section 61(1)(b)(iii) of (IT Act No 10 of 2006)
Income tax on dividends not distributed
Ref ACT/12/1
Section 78(IT Act No 10 of 2006)
Taxation of Co-ownership Ref Rul/IT/2008/1
Section 78 and Section 113 (IT Act No 10 of 2006)
set off of withholding tax (WHT) paid against partnership tax payable
Ref ACT/12/1
Value Added Tax Act No 14 of 2002
The WHT charged by the western Province Provincial Council
Ref ACT 17/9
Value Added Tax Act No 14 of 2002
Management fee subscriptions etc collected by management corporation of condominium properties
Ref ACT 17/9
ESC Act No 13 of 2006 Clubs or associations referred to in the section 101 of the Inland Revenue Act No 10 of 2006
Ref ACT/2/2004/6
ESC Act No 13 of 2006 Government assisted private schools
Ref ACT 12/1

41
Performance Report 2010
Chapter 8 - Other
9.1 Tax Payer Service Unit
The Taxpayer Service Unit has made facilities for the taxpayers and the public to obtain
services conveniently. The Unit is equipped with officers to assist every person seeking help
or information. Relevant enactments, departmental publications, paying-in slips, forms etc.
are available in this Unit. To avoid possible delays and inconveniences, arrangements made to
issue Taxpayer Identification numbers (TINs) and temporary VAT Numbers at this Unit were
continued with improve of results. Accordingly, this Unit issued 14,957 Temporary
Identification Numbers, 3,478 Income Tax registrations, 14,957 Temporary VAT certificates
and 766 PAYE registrations during the year 2010. Furthermore, 118 clearance certificates were
issued for non-taxpayers and 14 awareness programs / seminars were organized and several
leaflets were prepared during the year for the benefit of taxpayers. As an average,
approximately 125 persons obtained services from Taxpayers Service Unit per day during the
year.
8.2 Details of the Directions and clearance certificates issued by the Department are as
Follows:
Description 2010 2009
Directions issued
• to employers in respect of PAYE deduction 4,679 6,276
• to banks for WHT on interest 1 148
• in relation to specific Fees 7,845 7,542
Clearance Certificates Issued
• in relation to withdrawals balances from Provident Fund 613 5,252
• in relation to persons leaving the country 49 83
Privilege Cards Issued
• Gold Cards 203 366
• Silver Cards 79 120

42
Performance Report 2010
8.3 Analytical Reports
The Economic Research and Policy Unit of the Department performed different types of
researches by analyzing data received from various sources such as Central Bank, Census &
Statistics Department etc.
The following reports were prepared during the year.
1. Report on withholding tax on interest
2. Revenue proposal for tea sector
3. Report on Tax liability of agencies of foreign employment bureau
4. Report on Tax liability of Mineral water
5. Report on Tax liability of Affiliated University
6. Bench Marks for 04 selected industries/ services. (Plastic manufacture, restaurants, paint
industry, storage and warehouse)
7. Comparison of Share Transaction Levy, received with the actual transactions at the
Colombo Stock exchange
8. Report on Advanced VAT
(i) Whether Government Institution comply with the statutory provisions of the VAT
Act
(ii) Returns furnished by the taxpayers are true and correct
(iii) Whether the computer system is given the correct tax credit on Advanced VAT.
9. Quarterly VAT refund reports (31.12.2009, 31.03.2010, 30.06.2010, 30.09.2010)
10. Monthly and Quarterly Tax Bulletins (up to 30.10.2010)
8.4 Activities in North and East
Jaffna Regional office
This is the first regional office opened in the year 1963. The administrative districts of
Jaffna, Killinochchi and Mulathivu are coming under the purview of this regional
office. Due to the war situation prevailed in the North; the office was not properly
functioned up to year 2009.
Revenue collection during the year 2009 and 2010 in Jaffna Regional office
IT ESC TT Total 2009 9,096,666 1,605,749 65,873,760 76,576,175
2010 12,735,396 1,807,274 149,376,892 163,919,562

43
Performance Report 2010
New files opened during the year 2010 and 2009
Tax type 2010 2009
Income tax
Individual 367 126
Partnership 39 31 BTT 1441 213
Total 1847 370
Batticaloa Regional office
The administrative districts of Ampara and Batticaloa are coming under the purview
of the regional office. The normal functioning of this office was not so affected as in
the case of Jaffna regional office. However the office functioned without a deputy
commissioner for a period of five years till 2009 and a permanent deputy
commissioner was appointed only in February 2010. The activities of the unit were
accelerated by opening new files and collecting more taxes.
Revenue collection during the year 2009 and 2010 in Batticaloa Regional office
IT ESC TT Total
2009 33,713,487 15,144,553 105,870,850 154,866,041
2010 40,598,798 20,633,404 5,853,861 67,116,906
New files opened during the year 2010 and 2009
Tax type 2010 2009
Income tax
Individual 646 662
Partnership 18 13
ESC 17 29 Optional VAT 0 35 Total 681 739

DIS
TR
IBU
TIO
N O
F S
TA
F , F
ILES
AN
D R
EV
EN
UE
AM
ON
G T
HE
AS
SE
SS
ING
DIV
ISIO
NS
A
nn
exu
re
Sta
ffF
iles
Re
ve
nu
e (R
S.M
n)
DC
SA
AS
TO
TO
ITB
&G
/SD
VA
T/
OP
VA
T
PA
YE
ES
CN
BT
DT
IT&
SR
L/ WH
TV
AT
& G
ST
PA
YE
ES
CN
BT
DT
/ST
L/
Co
n. Le
vy
TT
/B&
G/
SD
T
ota
l
Inte
rna
tion
al U
nit ( 5
B )
1
1
4
1
3
52
5
47
5
3
43
1
2
2,1
24
5
74
4
69
3
77
6
9
3,6
13
Un
it 1&
21
-
8
3
7
4
,96
4
19
4
68
1
7
48
5
Un
it 41
1
6
1
4
1
,18
7
1,0
43
8
68
6
87
7
44
1
,09
9
2,5
00
3
41
5
67
5
62
5
,06
9
Un
it 4 A
(4 N
ew
)1
1
1
1
6
4,8
53
1
,92
9
1,5
23
7
17
6
70
1
52
3
83
6
6
75
6
0
73
6
Un
it 51
3
4
1
5
1
,03
5
79
0
92
4
38
7
64
6
1,0
05
3
,53
7
57
6
73
3
75
5
6,6
06
Un
it 5 C
(5 N
ew
) 1
1
1
2
1
4
4,4
84
1
,92
7
3,3
94
5
71
1
,00
8
97
8
1,0
82
2
38
2
29
2
04
1
2
2,7
43
Un
it 10
2
1
15
3
1
1
66
5
50
0
50
1
43
4
37
9
3,7
48
7
,03
5
1,6
56
1
,70
0
1,6
65
1
5,8
04
Un
it 12
(5A
)1
1
6
2
6
1
,13
2
1,7
40
1
,01
2
96
2
86
0
1,4
32
3
,43
6
75
8
73
3
92
7
7,2
86
Un
it 5 D
(12
Ne
w)
1
1
8
2
6
5,7
90
2
,53
0
2,9
59
9
04
9
56
3
43
8
18
1
51
1
71
1
45
1
,62
8
Un
it 14
1
1
7
1
8
2,0
43
1
,15
3
88
6
57
0
51
8
24
3
92
5
51
2
39
1
82
1
,64
0
Un
it 15
1
1
9
1
6
2,4
61
1
,25
0
81
4
65
7
63
4
20
6
92
4
63
2
18
1
83
1
,59
4
Un
it 6 - A
2
1
10
2
1
1
22
8
23
7
21
2
22
6
19
0
6,3
74
1
0,9
52
1
,19
6
2,0
60
1
,91
5
22
,49
7
Un
it 6 - B
2
1
8
2
11
2
16
2
21
2
10
2
11
1
70
5
,69
0
13
,36
6
1,5
61
1
,28
3
2,7
00
2
2
4,6
02
Un
it 6 - C
2
1
1
5
1
8
12
2
10
9
11
2
10
8
47
9
11
2
1,0
77
7
,72
5
3,5
69
3
,06
3
1,1
20
1
0,8
45
4
7,3
99
Un
it 7 - A
2
1
13
2
6
2
38
2
32
2
29
2
27
1
79
6
,21
8
29
,36
7
2,6
02
2
,37
3
2,1
47
4
2,7
07
Un
it 7 - B
2
2
12
1
6
2
40
2
28
2
09
2
30
1
74
3
,07
6
10
,08
1
79
0
1,0
42
2
,47
0
11
7,4
60
Un
it 82
2
9
5
8
2
26
2
31
2
20
2
29
1
27
5
,50
6
16
,42
6
1,9
07
1
,45
3
3,3
78
2
8,6
70
VA
T R
eg
istratio
n
1
-
4
1
1
12
,04
7
12
,04
7
VA
T U
nit A
2
1
7
1
6
8,4
58
3
,38
2
3,3
82
VA
T U
nit B
1
1
6
2
6
8,6
46
3
,36
4
3,3
64
VA
T &
GS
T C
olle
1
-
1
1
1
5
35
3
5
Ad
va
nce
VA
T
1
1
1
1
5
3,2
65
3
9
39
VA
T (S
pe
cial A
ud
it )1
1
1
3
4
7
-
ES
C B
ran
ch1
-
1
0
5
5
17
17
B&
G1
-
2
4
9
33
3
03
30
3
VA
T R
efu
nd
1
4
3
13
7
1
6
-
VA
T R
efu
nd
21
-
1
0
2
3
-
WH
T S
pe
cified
Fe
es
1
1
11
2
1
1
6,8
16
1
0,0
73
1
0,0
73
WH
T O
n In
tere
st1
-
1
0
5
1,7
93
2
9,4
30
2
9,4
30
Un
it 32
-
1
7
2
14
3
27
3
27
PA
YE
1
-
4
2
3
2
28
8
98
2
93
2
,27
3
3,4
64
NB
T U
nit
1
-
7
3
8
5,7
14
8
26
8
26
Sta
mp
Du
ty B
ran
ch1
1
5
4
3
7
,36
4
3,4
68
3,4
68
Re
gio
na
l Office
s-
Co
lom
bo
So
uth
1
1
15
1
1
1
10
,61
7
31
2
77
5
01
4
70
2
1
03
2
5
77
Co
lom
bo
Ce
ntra
l1
2
1
4
2
7
15
,87
7
28
4
71
4
56
2
2
10
6
68
Co
lom
bo
City
1
-
1
5
2
11
8
,72
5
41
4
15
9
28
5
46
2
2
01
7
49
Ma
ha
rag
am
a E
ast
1
1
12
5
7
1
3,8
18
5
9
29
4
16
2
2
83
2
47
Ma
ha
rag
am
a W
est
1
-
14
4
7
1
6,7
29
1
12
2
22
2
45
3
8
1
32
9
Ba
du
lla
1
-
6
3
8
6,5
02
1
30
1
08
6
9
5
46
1
20
Ga
lle
1
1
8
11
7
,56
9
25
2
06
3
11
1
42
1
2
84
2
38
Ka
luta
ra
1
1
11
6
5
7
,96
8
61
2
8
15
8
41
1
14
2
5
6
17
2
Ma
tara
-
-
1
4
1
7
9,7
56
1
4
22
7
24
1
15
1
9
88
2
48
Nu
wa
ra E
liya
1
-
8
2
6
4
,12
9
99
1
32
6
7
2
45
1
14
Ra
tna
pu
ra
1
1
8
1
10
7
,55
4
52
5
2
19
8
1
17
4
2
73
2
49
An
ura
dh
ap
ura
1
-
1
2
2
10
5
,15
1
16
4
17
1
94
1
8
1
21
83
94
Ga
mp
ah
a
1
2
14
1
1
2
17
,63
9
1
16
3
93
1
31
1
41
2
72
Ba
tticalo
a1
1
1
1
0
3,9
04
2
7
6
14
4
40
4
1
21
6
68
Jaffn
a-
-
1
1
2
,94
1
13
2
1
49
16
4
Ka
nd
y
1
1
19
5
1
3
11
,50
3
33
3
94
3
26
2
99
1
4
85
3
98
Ke
ga
lle
1
1
12
4
9
5
,63
3
6
12
0
10
2
58
3
2
4
85
Ku
run
eg
ala
1
2
1
4
8
9
10
,76
8
42
1
75
2
77
1
0
18
3
4
96
2
83
Da
mb
ulla
1
1
1
3
5
8
8,2
52
1
9
41
1
71
4
9
4
1
49
1
44
Ne
go
mb
o
1
1
11
4
9
1
0,4
10
9
1
34
3
24
2
03
1
7
9
28
3
To
tal
63
4
5
51
0
13
2
30
2
22
4,4
63
8
,55
2
36
,62
6
14
,35
4
11
,93
6
14
,57
7
10
4,1
79
1
28
,06
5
16
,28
7
17
,99
8
19
,30
8
13
,11
8
4,1
61
30
3,1
16
VA
T o
n im
po
rts9
9,5
78
NB
T o
n im
po
rts2
6,7
12
Oth
er ta
xes
19
8
Tre
asu
ry T
ran
sfers
2,3
63
sum
s cred
ited
by
acco
un
ts bra
nch
19
3
43
2,1
60
Less -d
isho
no
ure
d ch
eq
ue
s(2
7)
43
2,1
33
Less - R
efu
nd
s(9
,62
1)
42
2,5
12
Asse
ssing
Div
ision
s


![Inland Revenue Act, No. 10 of 2006 Tax_Documents... · Inland Revenue Act, No. 10 of 2006 [Incorporating Amendments up to 30th April 2014] Department of Inland Revenue. i . Table](https://static.fdocuments.net/doc/165x107/6043c6879e27e213f25b2e6b/inland-revenue-act-no-10-of-taxdocuments-inland-revenue-act-no-10-of-2006.jpg)