Visible inflammation of the rumen wall correlates with...
16
Visible inflammation of the rumen wall correlates with caecal lipopolysaccharide concentrations CA McCartney, RC Cernat, HHC Koh‐Tan, EM Strachan, TJ Snelling, CD Harvey, NN Jonsson and RJ Wallace [email protected] CA McCartney, RC Cernat, HHC Koh‐Tan, EM Strachan, TJ Snelling, CD Harvey, NN Jonsson and RJ Wallace [email protected]
Transcript of Visible inflammation of the rumen wall correlates with...

Visible inflammation of the rumen wall correlates with caecal
lipopolysaccharide concentrations
CA McCartney, RC Cernat, HHC Koh‐Tan, EM Strachan, TJ Snelling, CD Harvey, NN Jonsson and RJ Wallace
CA McCartney, RC Cernat, HHC Koh‐Tan, EM Strachan, TJ Snelling, CD Harvey, NN Jonsson and RJ Wallace

Rapid ingestion of starch
Streptococcus bovis takes over
Only Lactobacillus can grow
pH = 6.5
pH = 5.5
pH = 4.5
More lactic acid formed
Sub‐acute ruminal acidosis

Lipopolysaccharide (LPS) / endotoxin
Plaizier et al. 2012. Anim. Feed Sci. Tech. 172:9-21.
Polysaccharide Phospholipid
Outer core Inner core
Core region Lipid A
Repeating unit
Component of Gram negative bacteria
Released when cells lyse – especially at low pH

Potential role of the hindgut in SARA?
• “Translocated LPS during SARA may aggravate ruminal acidosis” (Jing et al., 2014)
• “The hindgut is less capable (than the rumen) of maintaining digesta pH during times of increased VFA production” (Gressley et al., 2011)
Jing et al. 2014. Br. J. Nutr. 112:170-182. Gressley et al. 2012. J. Anim. Sci. 89:1120-1130.

• Determine LPS concentrations– In the rumen AND hindgut
– In ruminants from commercial farms (Low/high risk)
• Record visible signs of damage
Aims and Objectives

• In total 98 continental crossbred steers and heifers from 5 farms
• Rumen damage scores used to assess condition of rumen wall• Both pre‐ and post‐cooking
• Ruminal fluid and caecum content collected• Lab analyses: Limulus‐amebocyte lysate (LAL) assay
used to quantify LPS (EU/mL), VFAs quantified by GC
Animal Study
Score 0 Score 1 Score 2 Score 3 Score 4
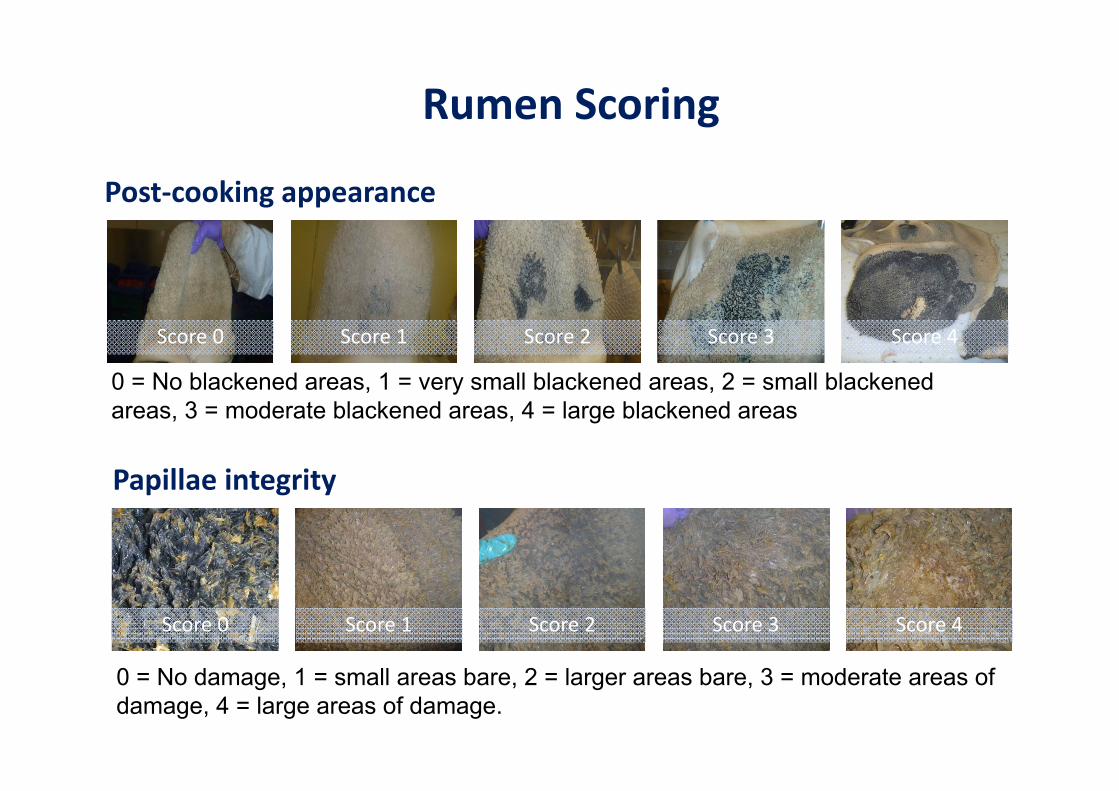
Rumen Scoring
Score 0 Score 1 Score 2 Score 3 Score 4
Post‐cooking appearance
Papillae integrity
0 = No blackened areas, 1 = very small blackened areas, 2 = small blackened areas, 3 = moderate blackened areas, 4 = large blackened areas
0 = No damage, 1 = small areas bare, 2 = larger areas bare, 3 = moderate areas of damage, 4 = large areas of damage.

Score 0 Score 1 Score 2 Score 3 Score 4
Score 0 Score 1 Score 2 Score 3 Score 4
Rumen Scoring
Papillae pinkness
Papillae shape
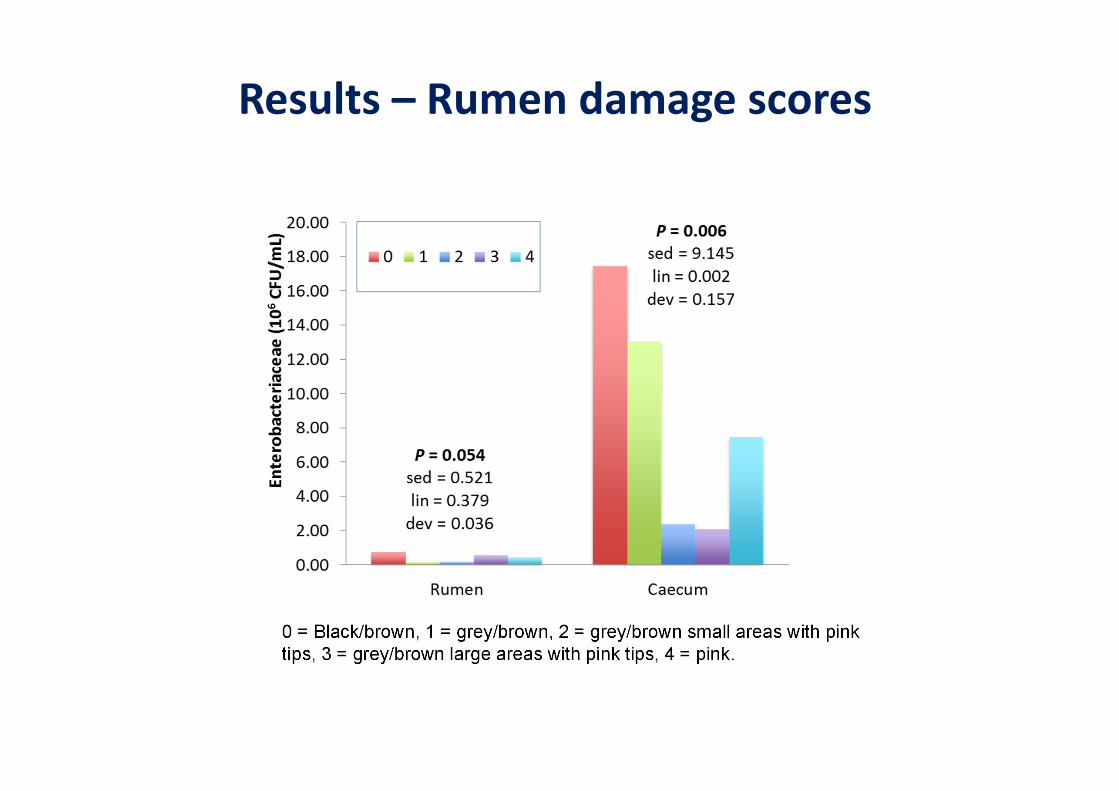
0 = Black/brown, 1 = grey/brown, 2 = grey/brown small areas with pink tips, 3 = grey/brown large areas with pink tips, 4 = pink.
0 = Long & thin, 1 = Long + oval, 2 = Short & thin, 3 = short & oval, 4 = short & brittle.

FarmLPS (106 EU/mL) BH1 BH6 BH7 BL2 BL6 s.e.d. Sig.
Rumen 0.068 0.136 0.056 0.116 0.072 0.024 0.003Caecum 0.624 0.125 0.879 0.537 1.976 0.208 <0.001
Results – LPS concentration
• 10‐fold higher concentration of LPS in caecal compared to ruminal digesta
• Significant differences between farms• High variation

Results – Volatile Fatty Acids
• Significant difference between farms• Lactate levels low – not acute acidosis• High variation
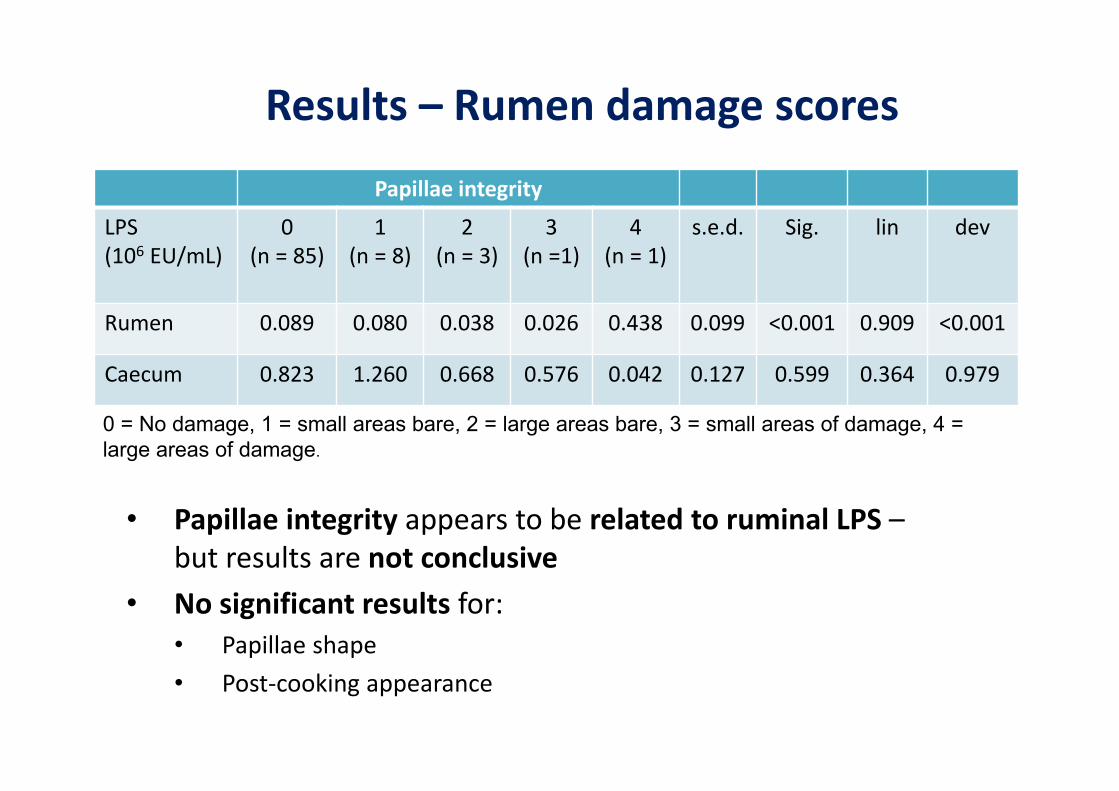
0 = No damage, 1 = small areas bare, 2 = large areas bare, 3 = small areas of damage, 4 = large areas of damage.
• Papillae integrity appears to be related to ruminal LPS –but results are not conclusive
• No significant results for:• Papillae shape• Post‐cooking appearance
Results – Rumen damage scores
Papillae integrity
LPS (106 EU/mL)
0(n = 85)
1(n = 8)
2(n = 3)
3(n =1)
4(n = 1)
s.e.d. Sig. lin dev
Rumen 0.089 0.080 0.038 0.026 0.438 0.099 <0.001 0.909 <0.001
Caecum 0.823 1.260 0.668 0.576 0.042 0.127 0.599 0.364 0.979

Results – Rumen damage scores
Example of Score 0
Example of Score 4
Significant linear relationship between caecal LPSand papillae pinkness
0 = Black/brown, 1 = grey/brown, 2 = grey/brown small areas with pink tips, 3 = grey/brown large areas with pink tips, 4 = pink.
0 = Black/brown, 1 = grey/brown, 2 = grey/brown small areas with pink tips, 3 = grey/brown large areas with pink tips, 4 = pink.
Results – Rumen damage scores
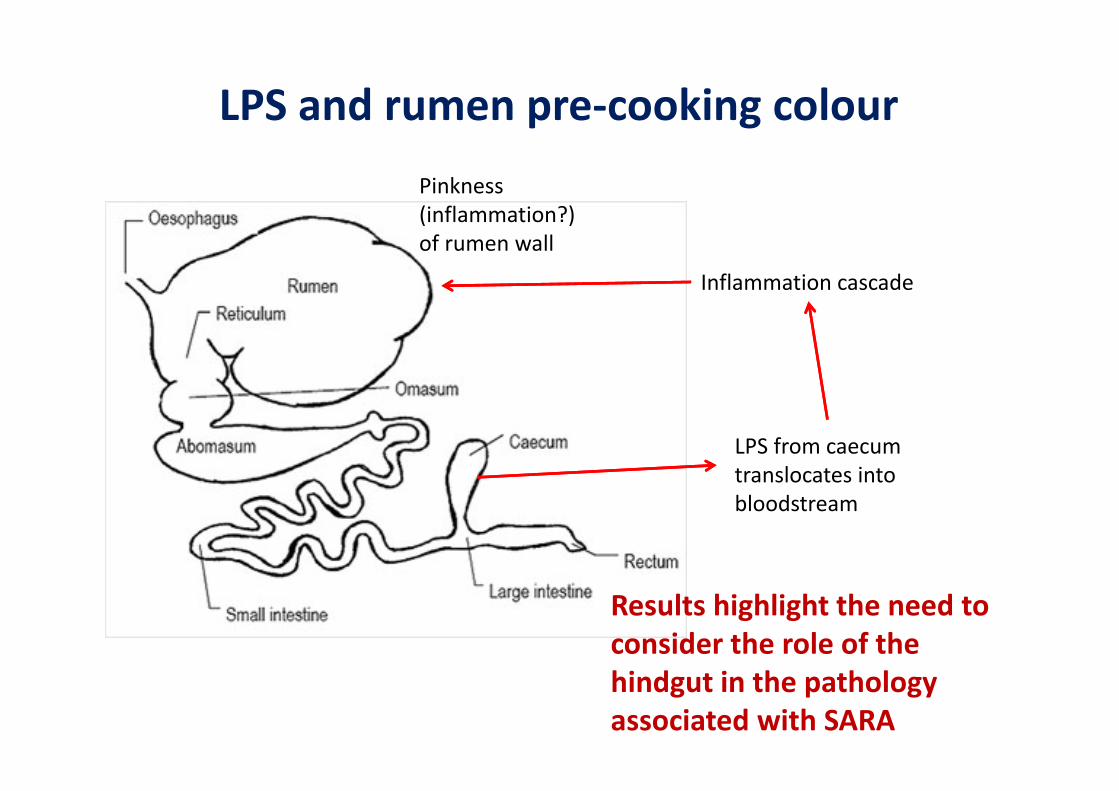
LPS from caecum translocates into bloodstream
Inflammation cascade
Pinkness (inflammation?) of rumen wall
Results highlight the need to consider the role of the hindgut in the pathology associated with SARA
LPS and rumen pre‐cooking colour
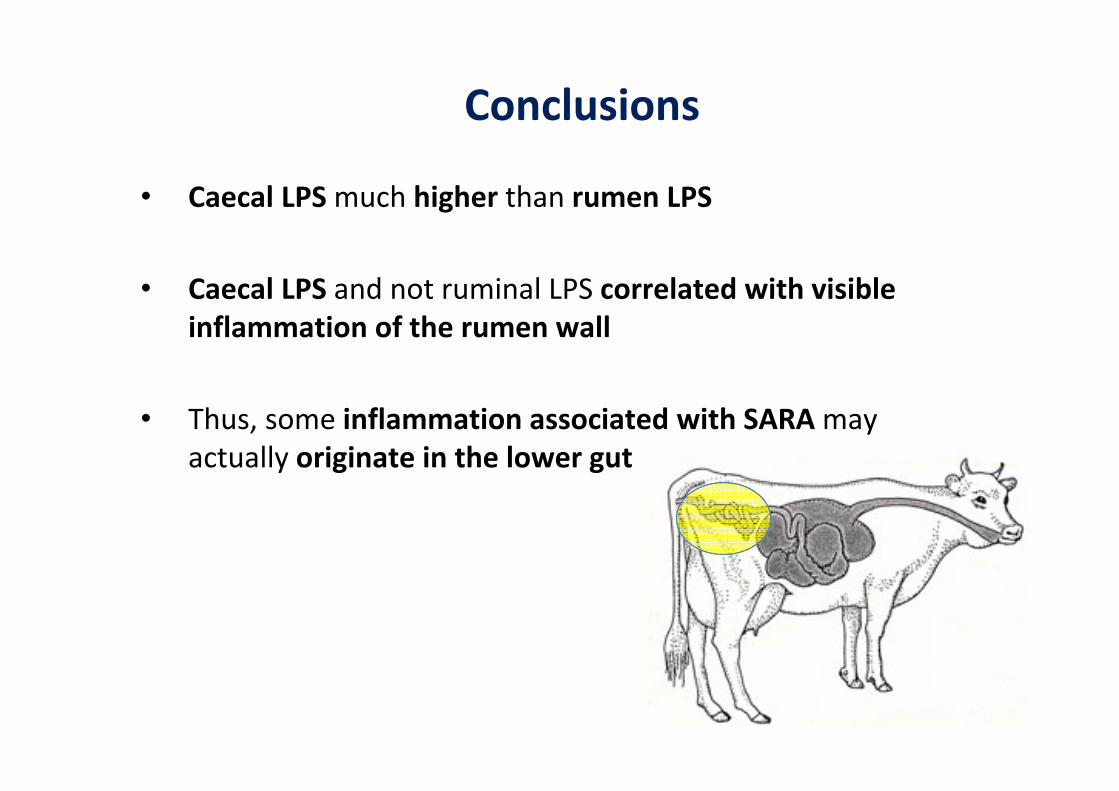
Conclusions
• Caecal LPS much higher than rumen LPS
• Caecal LPS and not ruminal LPS correlated with visible inflammation of the rumen wall
• Thus, some inflammation associated with SARA may actually originate in the lower gut

Rowett Institute of Nutrition and HealthUniversity of AberdeenNest McKainShirley MottaDinesh ThapaThulile SgwaneHugh Galbraith
University of GlasgowHolly Ferguson
University of StrathclydeCraig MichieIvan Andonovic
HarbroWillie Thomson
Chr HansenIda HindrichsenLars Moelbak
Dairy CoJenny Gibbons
Quality Meat ScotlandUel MortonCharlotte Maltin
Ab VistaNicola Walker
BBSRC
Abattoir Staff
The farmers!