Vishak_2256- Dissertation final doc - reduced size
61
Page No. 1 Dissertation Report On Feasibility Study to own a marine spread Submitted in partial fulfillment of the requirement of Executive Masters in Business Administration (EMBA) Operations Specialization Submitted By: ‐ Mentored By: ‐ Prof. Krishnan Subramanian Vishak Gopi Mr. Nihar Kumthekar Roll No. 2256 EMBA 22
-
Upload
vishak-gopi -
Category
Documents
-
view
149 -
download
0
Transcript of Vishak_2256- Dissertation final doc - reduced size

PageNo.1
DissertationReportOn
FeasibilityStudytoownamarinespread
Submittedinpartialfulfillmentoftherequirementof
ExecutiveMastersinBusinessAdministration(EMBA)
OperationsSpecialization
SubmittedBy:‐MentoredBy:‐Prof.KrishnanSubramanian
VishakGopiMr.NiharKumthekar
RollNo.2256
EMBA22

PageNo.2
DECLARATION
Iherebydeclare that thematter included in thisdissertationreportentitled “FeasibilityStudy toownamarinespread”,istheresultofstudyandinterviewscarriedoutbyme.Ifurtherdeclarethatthisismyoriginalworkandhasnotbeenpublishedanywherebefore.ThisProjectworkhasbeencarriedoutforthesolepurposeofsubmissioninpartialfulfillmentofExecutiveMastersinBusinessManagement(EMBA)inOperationsManagementatSPJainCenterofManagement,Dubai.
VishakGopi
RollNo.2256
EMBABatch22
SPJainSchoolofGlobalManagement
Block5
AcademicCity
Dubai,UAE
Theaboveistruetothebestofmyknowledgeandinformation
ProjectMentorIndustryMentor
Prof.KrishnanSubramanian Mr.SubhashNair
Mr.NiharKumthekar

PageNo.3
ACKNOWLEDGEMENT
Iwouldliketothankandexpressmysinceregratitudetoallthepeoplewhohaveassistedmewiththisreport.Especially:
Mr.NiharKumthekarforhisinterestandcontinuousguidancealongwithmotivationandtheinvaluableadvisethroughoutthetimedurationofthisprojectandProf.Krishnanforprovidingvaluableinsight.
Mr.SubhashNair,Director,TechnomakOffshoreandSubsea,forbeingmyindustrialmentorforhisvaluableinsightonthistopicinspiteofhisbusyschedule.
IwouldalsoliketothankallmyprofessorsatSPJAIN(Dubai)fortheircontributioninbroadeningmythinkingprocessandthinkoutofthebox.
IalsotakethisopportunitytothankmybatchmatesfromEMBA22forteachingmetheimportanceofteamworkandcollaboration.
Finally,Iwouldliketothankmyfamilyforsupportingmedevelopasagoodindividualandacompleteprofessional.
VishakGopi
24.05.2015

PageNo.4
EXECUTIVE SUMMARY
AsperrecentstudyitisestimatedthatJackupbargesarehavinghighdemandinoffshoreindustryespeciallyinshallowwater
AbuDhabioffshorehasmanyupcomingprojectsandmakesitanideallocationtotargetinthisregion.SincethecompanyhasalreadyregisteredwithmajoroilcompaniesinAbuDhabiforvariousworks,itwillbeeasytogetqualifiedaJack‐upvessel.
Therearemanycompetitorsinthisfield.Butthereareveryfewcompetitorswhoownavesselandcapabletodoalltheoffshorebrownfieldandgreenfieldworks.OwningaJack‐upbargewillenableTechnomaktobidandwinEPCIprojects.
ThisreportisonthestudymadebymeonthisissuewhethertoownaJack‐upbargeoraworkbargeorconvertaJack‐upRigorCharterthevessel.Iftheanswerisbuyingthenweneedtoknowwhichtypeofvessel?
MyanalysisshowsthatitisfeasibletoownaJack‐upbarge.Therevenuegeneratedisbasedonthedataavailableinthemarket.Thedecisionnottogoforanothertypeofvesselorcharterisalsodetailed.Thus,therecommendationisownaJack‐upbarge.

PageNo.5
TABLEOF CONTENTS
DECLARATION..........................................................................................................................................................................2
ACKNOWLEDGEMENT..........................................................................................................................................................3
EXECUTIVE SUMMARY.............................................................................................................................................................4
LISTOFFIGURES.....................................................................................................................................................................7
LISTOFTABLE.........................................................................................................................................................................8
INTRODUCTION.......................................................................................................................................................................9
COMPANYBACKGROUND..................................................................................................................................................10
BUSINESSMODEL............................................................................................................................................................11
OFFSHOREOPERATIONS..............................................................................................................................................12
MARINESPREAD..............................................................................................................................................................12
MARINESPREADINFORMATION...................................................................................................................................13
OFFSHOREWORKINGBARGE[Option‐1]..............................................................................................................13
JACK‐UPBARGE/LIFTBOAT[option‐2]...............................................................................................................14
CONVERTJACK‐UPDRILLRIGTOJACK‐UPWORKACCOMODATION/BARGE[option‐3]..............15
SERVICESTOBEOFFERED..........................................................................................................................................15
WHOARETHECUSTOMERS?.....................................................................................................................................16
VALUEPROPOSITION.....................................................................................................................................................16
PROBLEMSTATEMENT......................................................................................................................................................17
LITERATUREREVIEW.........................................................................................................................................................18
GROWTHFACTORSANDCHALLENGES.................................................................................................................21
DEMOGRAPHICFACTORS.............................................................................................................................................22
OILDEMAND......................................................................................................................................................................23
MOTORIZATIONINASIANCOUNTRIES.................................................................................................................24
FUELECONOMYIMPROVEMENTS...........................................................................................................................25
UPSTREAMCOSTINCREASE.......................................................................................................................................26
USSHALEOILPRODUCTIONOUTLOOK.................................................................................................................27
UNCERTAINITYINRESERVEESTIMATION..........................................................................................................29
POTENTIALFORWELLDRILLING............................................................................................................................30
OTHERCONSTRAINTS...................................................................................................................................................31
NORTHAMERICABECOMESTHELEADERINOILPRODUCTION...............................................................32
BIOFUELS...........................................................................................................................................................................33
DEEPWATERPRODUCTION.......................................................................................................................................34

PageNo.6
IRAQIPRODUCTIONGROWTHPROPSECTS.........................................................................................................35
OPEC’SBALANCINGROLE............................................................................................................................................37
GTL‐CHALLENGEFORTHEOILMARKETAFTER2020...................................................................................38
INFLUENCEOFDOLLAREXCHANGERATE..........................................................................................................39
OILPRICESFORECAST..................................................................................................................................................40
OILREFINERYPROJECTSINMIDDLEEAST.........................................................................................................41
RESEARCHOBJECTIVES.....................................................................................................................................................42
RESEARCHMETHEDOLOGY........................................................................................................................................43
PRIMARYRESEARCH......................................................................................................................................................43
SECONDARYRESEARCH...............................................................................................................................................44
PROJECTSCOPE.....................................................................................................................................................................44
VESSELSNOTINCLUDEDINTHEFLEET...............................................................................................................44
LIMITATIONS.....................................................................................................................................................................45
FINDINGANDANALYSIS....................................................................................................................................................45
PRIMARYRESEARCH......................................................................................................................................................45
FINDINGS.............................................................................................................................................................................46
TENTATIVELYASEDONPRIMARYRESEARCH[IDI]WITHCUSTOMERS...............................................46
SECONDARYRESEARCH...............................................................................................................................................47
PORTER’SFIVEFORCES................................................................................................................................................49
SWOTANALYSIS...............................................................................................................................................................50
DECISIONTREEFORSETTINGUPMARINEOPERATION...............................................................................51
RECOMMENDATIONS..........................................................................................................................................................52
MANAGERIALIMPLICATIONS.........................................................................................................................................52
SUPPLIERS..........................................................................................................................................................................52
VESSELCOST......................................................................................................................................................................53
INFRASTRACTUREREQUIREMENT.........................................................................................................................53
HUMANRESOURCEREQUIREMENT........................................................................................................................53
COMPETITORS...................................................................................................................................................................54
PROJECTEDPROFIT&LOSSSTATEMENTFORFIVEYEARS.........................................................................55
BREAKEVENANALYSIS................................................................................................................................................56
THEWAYFORWARD......................................................................................................................................................56
TIMEFRAMEFORPROJECTEXECUTION...............................................................................................................57
CONCLUSION...........................................................................................................................................................................58
BIBLIOGRAPHY......................................................................................................................................................................59
APPENDIX.................................................................................................................................................................................60

PageNo.7
LISTOFFIGURES
Figure1VALUEPROPOSITION........................................................................................................................................17
Figure2FACTORSAFFECTINGOILPRICE..................................................................................................................22
Figure3DEMOGRAPHICFACTORSAFFECTINGOILPRICE................................................................................23
Figure4OILDEMAND.........................................................................................................................................................24
Figure5MOTORIZATIONCURVES.................................................................................................................................25
Figure6FUELCONSUMPTIONBYNEWCARS..........................................................................................................26
Figure7UPSTREAMCOSTINCREASEINOILEXPLORATIONANDPRODUCTION....................................27
Figure8OILPRODUCTIONINNORTHDAKOTA......................................................................................................29
Figure9AVERAGEBAKKENWELLPRODUCTIONCURVE.................................................................................30
Figure10FORECASTOFNUMBEROFWELLS........................................................................................................31
Figure11FORECASTOFSHALEOILPRODUCTION..............................................................................................32
Figure12FORECASTOFPRODUCTIONOFLIQUIDHYDROCARBONINNORTHAMERICA.................33
Figure13FORECASTFORGLOBALBIOFUELPRODUCTION.............................................................................34
Figure14DEEPWATERPRODUCTIONFORECAST...............................................................................................35
Figure15FORECASTOFOILPRODUCTIONINIRAQ............................................................................................36
Figure16dYNAMICSOFOPECSHAREINGLOBALPRODUCTION..................................................................37
Figure17HISTORYOFGTLPROCESS..........................................................................................................................39
Figure18DYNAMICSOFBRENTOILPRODUCTION.............................................................................................40
Figure19BRENTPRICEFORECAST.............................................................................................................................41
Figure20LARGESTNEWOILREFINERYPROJECTSINTHEMIDDLEEAST..............................................42
Figure21PORTER’SFIVEFORCESMODEL...............................................................................................................49
Figure22DECISIONTREE.................................................................................................................................................51
Figure23RACICHART.......................................................................................................................................................57
Figure24GANTTCHART..................................................................................................................................................58

PageNo.8
LISTOFTABLE
Table1COMPARISONOFVESSELS,THEIRDAYRATEANDOPERATINGEXPENSES............................46
Table2ANALYSISBASEDONPORTERSFIVEFORCES.........................................................................................50
Table3SWOTANALYSIS....................................................................................................................................................51
Table4PROFIT&LOSSSTATEMENT...........................................................................................................................55
Table5PROJECTTIMEFRAME.......................................................................................................................................57
Table6IDITRANSCRIPT....................................................................................................................................................61

PageNo.9
INTRODUCTION
About56percentof theworld'soil reservesand36percentof theworld'snaturalgas
reservesareintheMiddleEast.
2011 saw UAE as the world's eighth largest oil producer, churning out an average
productionvolumeof2.813millionbarrelsperday.
UAEcomesfourthinthetopglobalexporters’ league,exportingaround81percentof its
total production. The UAE exports around 2.32 million barrels of crude oil each day to
predominantlyAsianmarkets.
The UAE holds theworld's sixth largest proven oil reserves of approximately 98 billion
barrelsandseventhlargestgasreservesof213trillioncubicfeet.
Almost one‐third of the top 20 largest oil and gas projects in the Middle East under
executionarenowtakingplaceintheUAE'sboomingupstreamsphere.
TheAbuDhabi InternationalPetroleum InvestmentCompany in July2012 inaugurateda
pipeline via Fujairah to a refinery in Pakistan that completely bypasses the Strait of
Hormuz.The1.8million‐barrel‐per‐daycrudeoilpipelinerunsfromHabshaninAbuDhabi
toFujairahandensuresthesecurityoftheUAE'soilproductionandexportstotheworld.
Theenergy investmentneeds in theMiddleEastandNorthAfricaregionover theperiod
2012 through to 2016 is expected to reach US$ 525 billion, with most of the energy
investments being in the Arabian Gulf, according to The Arab Petroleum Investment
Corporation.
Around600,000barrels per daywill be neededover thenext decade tomeet theUAE's
infrastructure, business and investment needs reiterating UAE's continued reliance on
technology, equipment and expertise in the oil & gas sector, to service its own
consumption.
PageNo.10
The above details describe the growing potential of Abu Dhabi Oil & Gas market and
modification/maintenanceofexistingfacilityaswellasthenewfacilitydevelopmentsare
mandatorytogrowingmarketdemand.
COMPANYBACKGROUND
TECHNOMAKisanintegratedEngineeringDesignFabricationErectionCompanygearedto
serve the growing needs of offshore, Oil and Gas marine Power, Metallurgy and
InfrastructureprojectrequirementsoftheMiddleEast,Africa,FarEast,EuropeandIndian
Sub‐Continent.
As an ISO 9001‐2008, ISO 14001‐2007 & OHSAS 8001‐2007 certified company,
TECHNOMAK is committed towards maintaining high safety, quality and environmental
standards and continuous improvement of the efficiency by encouraging teamwork and
creating a positive work environment .The prime focus of the company is on customer
satisfactionandbuildingalongtermandsolidbusinessrelationshipbyadoptingthebest
internationalstandardsandpracticesprevalentintheindustry.
TECHNOMAKhasa fully fledgedfabricationfacilitymeasuring1millionSq. ft.andawell
experiencedworkforceof730inUAE,620inIndiaandareintheprocessofrecruitinga
similarstrengthofemployeesinQatarimmediately.TECHNOMAKhasalreadyestablished
itsstrongpresenceinchallengingassignmentsintheMENAregion&Indiansubcontinents
Themissionofthecompanyistocatertotheneedsofthecustomersthroughsafe,
reliable and environmentally sound means thereby achieving new landmarks and
engravingthecompany’snameinthelistoftop‐notchcompanies.
Company is headed by a group of professional engineers with strong and hands on
experience in the field of ship building and ship repair, offshore structure design and
fabrication,Oil&Gaspipelines,TurnkeyandShutdownprojects.Thiswouldaddvalueto
thesuccessfulprojectexecution.

PageNo.11
Equipped with professional management, technically skilled workforce and full‐fledged
fabricationfacilitymeasuring1,000,000sqftarea,TECHNOMAKhasprovenitscapability
tomeetthechallengeswithinthescheduledtimeframes.
Our fabrication yard and workshops are situated in Hamriyah Free Zone. The
fabricationfacilityatInnerHarbourarea,HamriyahFreezoneisstrategicallylocated
toenableeasyloadoutandtransportationoffabricatedmodules.
Equippedwithacomprehensiverangeofsupportfacilityandsolidengineeringbackups,
TECHNOMAK is capable of providing full range of heavy engineering fabrication,
constructionandconsultancyservicesforshipbuilding,shiprepair,andvesselmodification
andupgradationandOil&Gasindustry.
BUSINESSMODEL
TheCompanyservesmajorsectorsincluding:
x ArchitecturalandStructuralSteelFabrication&Installation.
x OffshorestructuresandplatformsFabrications.
x Offshore&SubseabrownfieldProjects
x Pipelineprojects&Equipmenterections
x Petrochemicals,Refineries&Powerplantsshutdown
x ShipbuildingandShiprepair
x Tankfabrication&Erectionjob
x HVAC,MEP&InteriorsProjects
TECHNOMAKbelievesinthephilosophyofbuildingbondsbeyondbusinessandalways
upholdscustomersatisfactionwin‐winrelationship,continuousimprovement,teamwork
andachievingoperationalexcellence&growthwhiledeliveringvaluetothecustomers,
employeesandthecommunity,astheguidingprinciples.

PageNo.12
OFFSHOREOPERATIONS
Technomakhasstartedtheiroffshoreinstallationprojectsinthelastquarterof2013.Sofar
TechnomakcompletedoneoffshoreInstallationprojectanditwasthefirstkindofproject
incompanyhistory.Afterthatprojectthemanagementwasspeedinguptheprocessto
startanewdivisionfocusingoffshorebrown‐fieldandInstallationprojects.Company
targetssmallandmediumrangeofoffshorebrownfieldaswellasGreenfieldprojects.The
targetedworksare;
TopsideStructuralworks
TopsidePipingworks
TopsideMechanicalworks
TopsideElectricalandInstrumentationworks.
TopsideblastingandPaintingworks
MARINESPREAD
Besides looking at the businessmodel it is important to understandwhat rolewill be
playedbyamarinespreadinwinningandsuccessfullyexecutingtheproject.Themarine
spread can be a offshore working barge, Jack‐up barge, a rig converted into working
barge.Theinvestmentwouldbeintherangeof$10mto$100mdependsontheageand
typeofthevessel.Alternativelywecancharterthevesselforaparticularprojectorcan
charteronyearlyleasebasis.Tocharteravesselforshorttimeisverydifficultandmost
of the vessels are working on long‐term charters. Also the mobilization cost for the
vesselsareveryhighandwon’tbeviable formostof theshort termprojects.Ontopof
thatgettingasuitablevesselforcriticalprojectsontimeisverydifficult.Alsotheclient’s
firstprioritieswillgenerallygoestothecontractorshavingtheirownvessel.

PageNo.13
MARINESPREADINFORMATION
OFFSHOREWORKINGBARGE[OPTION‐1]
Thephotographshowsatypicaloffshoreworkbarge.Itconsistsofaccommodationinthe
rangeof150to300pax.Itwon’tbeselfpropelled.Suchkindofbargessupportspreadfor
mobilizationaswellasanchorhandling.Thesebargescanbeanchoredoffshorewith6to8
anchors.Tospreadtheanchors itrequiresanchorhandling tugboats.Andtheseanchors
mooringhavegotweatherlimitationsaswell.Whenweatherpicksupthebargehastobe
movedawayfromthefield.Thataffectstheoffshoreworkingdaysaswell.Ontopofthat
suchconventionaltypeofanchoringisnotacceptingtheoilcompaniesandthereisalways
risk that the anchors may damage subsea pipelines. But this type of vessel has good
stability, large deck space for storage and other works and cheaper compared to other
types.

PageNo.14
JACK‐UPBARGE/LIFTBOAT[OPTION‐2]
Thesetypesofbargesareselfelevatingandthesearecategorizedbasedonthewaterdepth
it can operate. The oil companies prefer such kind of barges to work near offshore
platforms because of safety. This can work in any weather. These types of vessels are
generally small in size.Therewillbe limitation inaccommodationspace,deckspaceand
cranecapacityaswell.Thecostofsuchbarges ishighcomparedto floatingworkbarges.
Butthedemandforsuchbargesisveryhighandgettingaprojectwithsuchbargeswon’t
bedifficult.

PageNo.15
CONVERTJACK‐UPDRILLRIGTOJACK‐UPWORKACCOMODATION/BARGE[OPTION‐3]
ThesekindsofRigsareusedfordrillingtheoilwells.Itconsistsofaccommodations,cranes
anddrillingunit.Thedrillingunitscanberemovedandcanbeconvertedintojack‐upwork
barge. The old rigs are available for sales in different part of the world. The cost for
mobilization,conversionsetcareconsideredinthefeasibilitystudy.
SERVICESTOBEOFFERED
Belowisthelistofservicesthatwillbeoffered
1. Allsortoftopsideworks.
2. Cranecapacityintherangeof250MTto400MT.
3. Accommodationfor150to300men.
4. Subseadivingworks

PageNo.16
5. Subseainstallations,tie‐ins.
WHOARETHECUSTOMERS?
OilfieldoperatorssuchasADMA,ZADCO,DubaiPetroleum,QatarPetroleum,Soudi
Aramco,Shell,MaerskOilQatar,OXY,Chevronetcarethetargetedcustomers.However
thecharteragentsandEPCcontractorsaretheothertargetedcustomersforwhomthe
vesselcanbegivenforlongtermorshorttermcharters.
VALUEPROPOSITION
Ourswillbeoneoftheonestopsolutionsforourclientrequirements.Includingthevessel,
fromdetaildesigntojobcompletionandwecanprovidealltypesofpumpsforthe
customer.Wewillbefocusingonleveragingourlocationbyprovidinggoodservicetoour
customers.Thus,easylogistics,costeffectivenessandcloseproximityisthevalue
propositionthatwewillbeofferingtoourcustomers.

PageNo.17
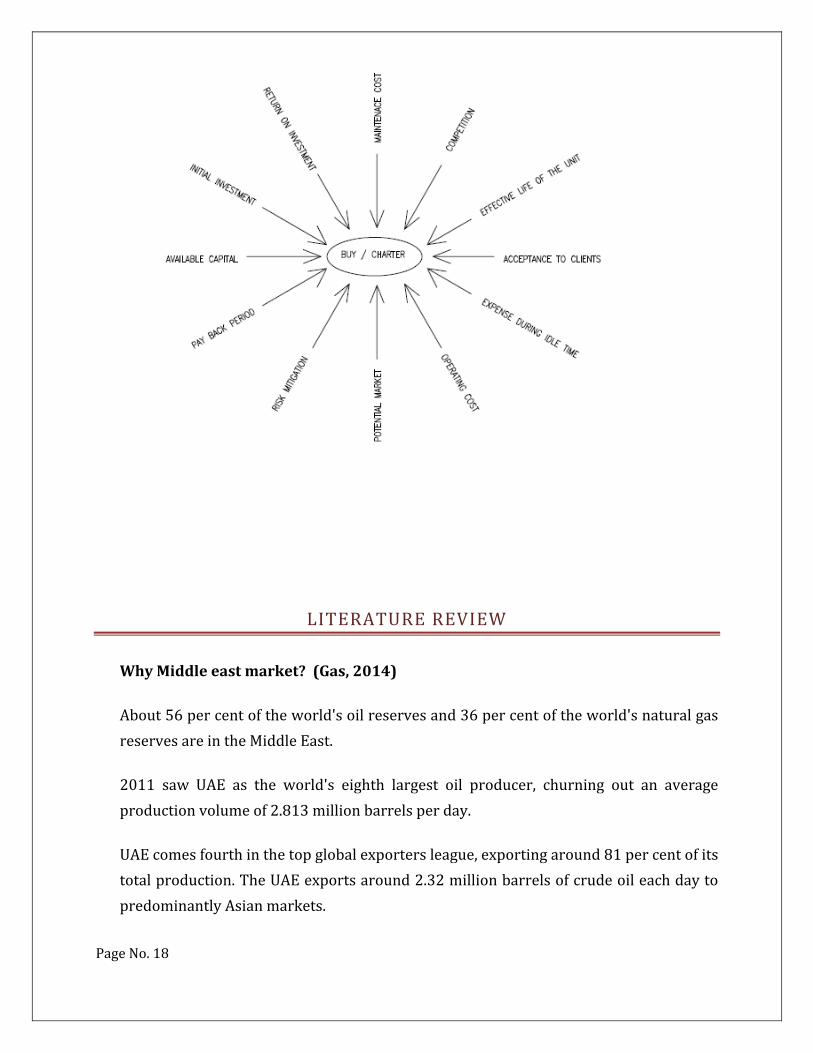
PROBLEMSTATEMENT
Tostartwithoffshoreoperations,Technomaktargetingthesmallinstallationprojectsin
thebeginning.Butthemajorchallengeistoownamarinespread[whichcanbeaoffshore
workingbarge, Jack‐upbarge, a rig converted intoworkingbargeetc.].The investment
wouldbeintherangeof$10mto$100mdependsontheageandtypeofthevessel.Else
wecancharterthevesselforaparticularprojectorcancharteronyearlyleasebasis.To
charter a vessel for short time is very difficult andmost of the vessels areworking on
long‐termcharters.Alsothemobilizationcostforthevesselsareveryhighandwon’tbe
viable formost of the short term projects. On top of that getting a suitable vessel for
criticalprojectsontimeisverydifficult.Alsotheclient’sfirstprioritieswillgenerallygoes
to the contractors having their own vessel. The following diagram shows the major
challenges
OURST
RENGTHS
GOODENGINEERING
EXPERIENCEDOFFSHORE
MARINESPREAD
ValueProposition
CustomerSatisfaction
Customerswillbeabletoexecutetheirprojectwithminimalinterfaces
Customerscangetoffshoreserviceandvesselunderoneroof
Customerscangetgoodcompetitivepricesincethevesselandexecutionteambelongstooneteam.
FIGURE1VALUEPROPOSITION
PageNo.18
LITERATUREREVIEW
WhyMiddleeastmarket?(Gas,2014)
About56percentoftheworld'soilreservesand36percentoftheworld'snaturalgas
reservesareintheMiddleEast.
2011 saw UAE as the world's eighth largest oil producer, churning out an average
productionvolumeof2.813millionbarrelsperday.
UAEcomesfourthinthetopglobalexportersleague,exportingaround81percentofits
totalproduction.TheUAEexportsaround2.32millionbarrelsofcrudeoileachdayto
predominantlyAsianmarkets.

PageNo.19
TheUAEholdstheworld'ssixthlargestprovenoilreservesofapproximately98billion
barrelsandseventhlargestgasreservesof213trillioncubicfeet.
Almost one‐third of the top 20 largest oil and gas projects in theMiddle East under
executionarenowtakingplaceintheUAE'sboomingupstreamsphere.
TheAbuDhabiInternationalPetroleumInvestmentCompanyinJuly2012inaugurated
apipelineviaFujairahtoarefinery inPakistanthatcompletelybypassestheStraitof
Hormuz. The1.8million‐barrel‐per‐day crude oil pipeline runs fromHabshan inAbu
Dhabi toFujairahandensuresthesecurityof theUAE'soilproductionandexports to
theworld.
The energy investment needs in the Middle East and North Africa region over the
period 2012 through to 2016 is expected to reach US$ 525 billion,withmost of the
energy investments being in the Arabian Gulf, according to The Arab Petroleum
InvestmentCorporation.
Around600,000barrelsperdaywillbeneededoverthenextdecadetomeettheUAE's
infrastructure,businessandinvestmentneedsreiteratingUAE'scontinuedrelianceon
technology, equipment and expertise in the oil & gas sector, to service its own
consumption.
UAEplanstobuildaliquefiednaturalgasbunkerstationinFujairahtomeet15%ofit's
increasingdemandongasbecauseofindustrialexpansion.
HowbigistheMiddleeast’soilandgasindustry?Howquicklyisitgrowing?(Nagraj,
2014)
Theworld’s largestoilproducer is theMiddleEast.ThoughSaudiArabiacontinues tobe
the region’s largest oil producer, Iraq displays one of the biggest growth rates in
production.
TheoilandnaturalgassectorintheMiddleEastwillrequireatotalof$1.6trillionofnew
investmentoverthenexttwoandahalfdecades.
Howwillthediscoveryofshaleintheusaffecttheregionaloilandgasmarket?

PageNo.20
Theuprising of light tight oil in theUSwill play amajor role inmeeting global demand
growthoverthenextdecade.However,theMiddleEastbeingtheonlylargesourceoflow‐
costoilwillmostcertainlyremainat thecentreof the longer‐termoiloutlook, capturing
mostoftheexpectedgrowthinglobaloildemand.
Whatarethemainchallengesthattheindustryfaces?
MiddleEasternoilproducersareencountering challengesof competitionandof growing
demandfromdomesticmarkets.Energyuseintheregionwillgrowby77percentby2035,
doublethe increase inproductionaccordingtothe latestestimates fromBP,whichcould
putpressureongovernmentsthatdependonoilexportrevenue
WiththeMiddleeastmarketsfocusingonrenewableenergy,howwilltheoilandgas
industryfareinthelongterm?
Duetohavingthelargestoilandgasreservesintheworld,onemightquestionwhetherthe
MiddleEast is the rightadvocate for renewableenergy.However,withoutstandingsolar
and wind conditions across the region, an increasingly tight gas market and a growing
recognition that hydrocarbon reserves could be put to better use other than generating
electricity, renewable energy is attracting unprecedented attention in the region. The
significantinvestmentbytheregionalcountriesisatestimonialtothefocus.
ThisisB2Bmarketinginallaspectsandtheprojectswhichwearetargetingisfromtheend
clients[oilfieldoperatorseg:ADMA,MAERSK,ZADCO,DP,QP,QGetc.]Thereisalways
highdemandforoffshoreworkingbarges/jack‐upbarges.Thevesselhastomeetthe
criteria’s/guidelinesofthefiledoperators.SuchguidelinesforADMA(OPCO,31.12.2004)
andMAERSK(MAERSKOIL,2011)shallbefollowedtoselectthevesselortheinvestment
requiredtomodifythevesseltomeetsuchguidelines.Therearelotsofprojectscomingup
inoil&Gasindustry,especiallyinthisgulfregion.(ZADCO,2014)Themostofthepipelines
arelaidin1970’sanditisagingnow.Theselinesaretobereplaced.Newfileddevelopment
projectsarealsocomingupinOman,RAK,Abudhabietc.Thesevesselscanbegivento
othercompaniesoncharteraswellforprojectspecificoroffshoreaccommodation
purpose.

PageNo.21
Afeasibilitystudyshouldbeabletoanswerthesemainquestions:
Idealtypeofvessel?[WorkBarge/Jack‐upbarge/Rigconverttoajack‐upworkbarge]
BuyorCharter?
MarketPotential?
Isitworthgoingahead?
GROWTHFACTORSANDCHALLENGES
Globaloilpricedynamicsaresubjecttomanyfactors,principallythebalanceofsupplyand
demand, the macroeconomic and geopolitical situation, the dynamics of the US dollar
exchangerateandconditionsoftheglobalfinancialmarkets.Technologicalbreakthroughs
make it possible to develop huge resources. The increase in unconventional oil and gas
productionintheUSservesasagoodexample.TakingintoaccounttheUSoilproduction
progressmany analytical agencies lower their long‐term oil price forecasts. At the same
time a number of trendswill support oil prices in themedium term. In this outlookwe
wouldliketospecifythesetrendsandcriticallyanalyzeanumberofchallengesthattheoil
industryfacenowadays.(Lukoil)
Growthfactors:
•Populationgrowth,urbanization
•MotorizationinAsia
•Growingcostsofexplorationandproduction
•OPECpolicy
•Dollardepreciation
Principalchallenges:
•IncreaseofunconventionaloilproductioninNorthAmerica

PageNo.22
•IncreaseofoilproductioninIraq
•Deepwatershelfproduction
•Biofuelsproductiongrowth
•Gastoliquids(GTL)expansion
FIGURE2FACTORSAFFECTINGOILPRICE
DEMOGRAPHICFACTORS
Our planet’s population will continue to grow rapidly. Between 2010 and 2025 global
populationwillgrowbymorethan1.1blnpeople.Thegreatestpopulationgrowthwillbe
registeredindevelopingcountries,whileinthedevelopedcountriespopulationwillremain
relativelystable.Highratesofpopulationgrowthareexpected, firstofall, inIndia,which
willbecome theworld’smostpopulouscountryby2020.Explosivepopulationgrowth is
also forecasted for the African countries where it will be the result of improvement in
socio‐economicconditionsandqualityofmedicalservices.Alongwithpopulationgrowth,
developing countrieswill experience themovement of the rural population to the cities,

PageNo.23
knownasurbanization.According to theestimatesofMckinseyGlobal Institute,by2025
440citiesindevelopingcountrieswillcontributeuptohalfoftheglobalGDPgrowth.
Atthesametimethelevelsofconsumptionwillgrow.Itisexpectedthatby2025thesizeof
the urban consumer class will grow by 1 bln people and the overall middle class will
amounttomorethan50%ofthetotalglobalpopulation.Themaingrowthwillcomefrom
developingAsiancountries.Urbanizationandgrowthoftheconsumerclassindeveloping
countrieswill, inturn,promotedemandforrealestate, infrastructure,cars,hi‐techgoods
and,asaresult,energyresources.(Lukoil)
FIGURE3DEMOGRAPHICFACTORSAFFECTINGOILPRICE
OILDEMAND
Demand for liquid hydrocarbons will continue to grow. Global demand for liquid
hydrocarbonswillcontinuetogrowannuallyby1.2%onaverageandwill,inourestimate,
reach 105 mb/d by 2025. The greatest surge in oil demand will come from the
transportation sector, for which oil is the principal energy source (over 90%).
Consumption of liquid hydrocarbons will increase in developing countries where the
transportation industry is undergoing rapid growth. Analysts expect to see significant

PageNo.24
growth in the number of cars as well as the development of sea, air and railway
transportation.
In addition to this, growth in demand for oil in developing countries will be further
encouragedbytheindustrialsector,inparticular,thepetrochemicalindustry.Atthesame
time, consumption of liquid hydrocarbons in developed countries will remain relatively
stable due to low rates of economic growth and further improvements in fuel economy.
Despitestablegrowthrates,oil’sshareintheglobalconsumptionofenergyresourceswill
gradually decrease, because of substitution for other energy sources in such sectors as
powergenerationandhousing.(Lukoil)
FIGURE4OILDEMAND
MOTORIZATIONINASIANCOUNTRIES
Themotorizationofthepopulationindevelopingcountriesisoneoftheprincipalfactors
behind the future growth in demand for oil. Today developing countries are severely
laggingbehinddevelopednations in termsof thenumber of carsper 1,000people, thus
creatingconditionsforsignificantgrowthinthesizeofglobalcarownership.Intheforecast
period, themostnoticeable increase incarownershipwill takeplace inChina,whosecar

PageNo.25
markethasalreadyenteredanintensivegrowthstage.Intoday’sChinathenumberofcars
per1,000peopleis40.By2025thisfigurewillbecloseto200,whichwillmeananincrease
of220millioncarsfortheperiodof2010‐2025.
Significantgrowth incarownershipwillalsoberegistered in Indiaandotherdeveloping
Asiancountries.By2025large‐scalegrowthofcarownershipwillbegininAfrica.Freight
cars and truckswillmake a strong contribution to the growth in consumption ofmotor
fuels.Thetotalnumberofsuchcarsisexpectedtogrowby140mlnby2025.Accordingto
ourestimates,theaggregateglobalcarfleetwillgrowby670mlnduringtheperiod2010‐
2025.Thiswillleadtoanincreaseinfuelconsumptionof9mb/d.(Lukoil)
FIGURE5MOTORIZATIONCURVES
FUELECONOMYIMPROVEMENTS
We are currently observing a sustained trend towards decrease of fuel consumption in
passengercars.This ishappeningforanumberofreasons: thedesignsofcarbodiesand
enginesareimproving,thequalityofenginefuelisgettingbetterandhybridtechnologies
arebeingimplementedmoreoften.Growthinthesizeofthecarfleetwillbeaccompanied
PageNo.26
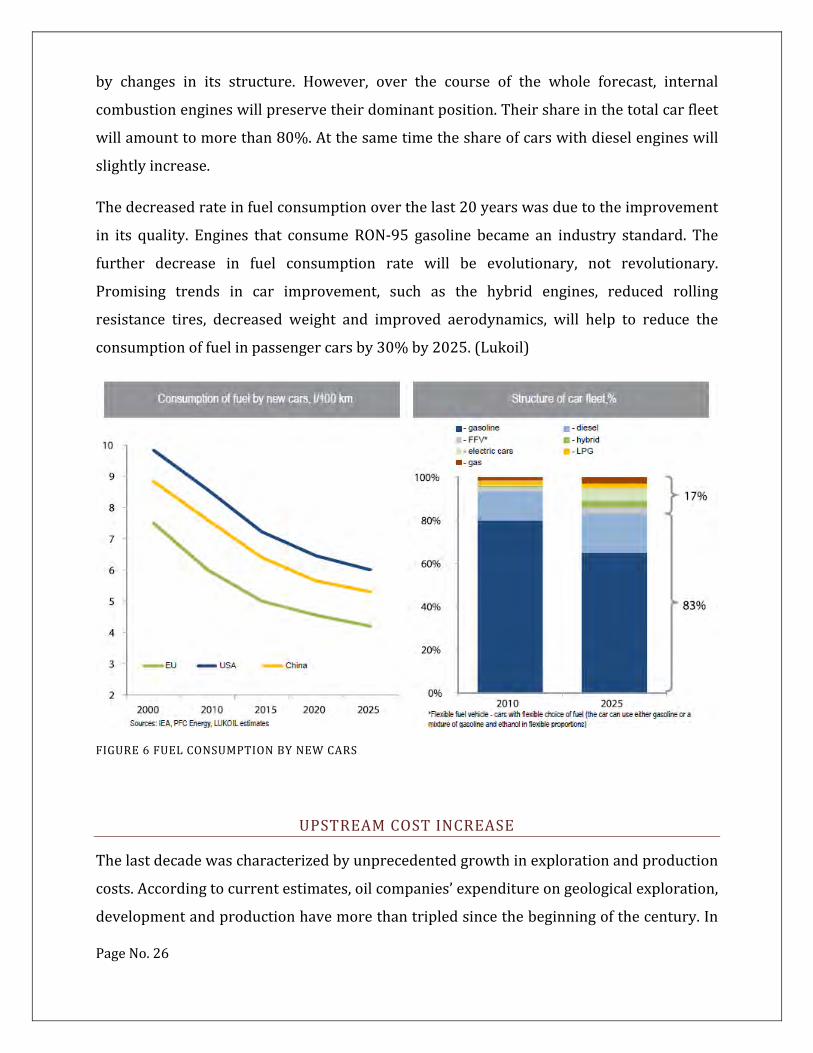
by changes in its structure. However, over the course of the whole forecast, internal
combustionengineswillpreservetheirdominantposition.Theirshareinthetotalcarfleet
willamounttomorethan80%.Atthesametimetheshareofcarswithdieselengineswill
slightlyincrease.
Thedecreasedrateinfuelconsumptionoverthelast20yearswasduetotheimprovement
in its quality. Engines that consumeRON‐95 gasoline became an industry standard. The
further decrease in fuel consumption rate will be evolutionary, not revolutionary.
Promising trends in car improvement, such as the hybrid engines, reduced rolling
resistance tires, decreased weight and improved aerodynamics, will help to reduce the
consumptionoffuelinpassengercarsby30%by2025.(Lukoil)
FIGURE6FUELCONSUMPTIONBYNEWCARS
UPSTREAMCOSTINCREASE
Thelastdecadewascharacterizedbyunprecedentedgrowthinexplorationandproduction
costs.Accordingtocurrentestimates,oilcompanies’expenditureongeologicalexploration,
developmentandproductionhavemorethantripledsincethebeginningofthecentury.In

PageNo.27
manyways the increase in costs is tied to thedepletionof the conventionaloil resource
base.Thegrowingdemandforhydrocarbonsforcescompaniestodevelopunconventional
and highly costly reserves. The companies are producing oil from deepwater shelves,
operatinghighviscosityoilfieldsandextractingoilfromtightreservoirs.Intoday’smarket
about 15mb/d have commercial production costs above $70/bbl. for example, shale oil
projectsintheUSonaverageareprofitableat$80/bblcostofoil.
Therefore,even ifdemandforoil fallssignificantly, itsequilibriumprice isunlikely tostaybelow
$70‐80/bbl for long.Futuregrowth inproductionwillprimarilycomefromthedevelopmentand
operationofunconventionalreserves.From2010‐2025over70%oftheincreaseinthesupplyof
liquid hydrocarbonswill come from the use of hi‐tech productionmethods and alternative fuels
suchasnatural gas liquids (NGL),GTL/CTLandbiofuel. Thegreatest increase inproductionwill
come from the deepwater shelf, tight oil reservoirs in theUS and heavy crude fromCanada and
Venezuela.WealsoexpectanincreaseintheproductionofNGL,primarilyintheMiddleEastandin
theUS.(Lukoil)
Figure7UPSTREAMCOSTINCREASEINOILEXPLORATIONANDPRODUCTION
USSHALEOILPRODUCTIONOUTLOOK
The development of horizontal drilling and hydraulic fracturing technologies havemade
profitable a significant amount of unconventional hydrocarbon reserves in the United
States.Thisbeganwiththeactiveproductionofshalegaswhichledtothecollapseofspot

PageNo.28
gasprices.Highoilprices in2011‐2012forcedmanycompaniestostartactivedrilling in
unconventionalreservoirscontainingliquidhydrocarbons.In2011thenumberofdrilling
oil rigs in theUSexceeded thenumberofgas rigs.Thegrowth inshaleoilproduction in
2011‐2012wasveryimpressive.OilproductionattheBakkenformationinNorthDakota
increasedmore than7.5 timesandamounted to589,000b/d in2012.Eagle fordplay in
Texasalsobecameasiteofexplosivegrowthinliquidhydrocarbonproduction.
In2012theaggregatevolumeofoilproductionfromunconventionalreservoirsintheUSis
estimatedtohaveequaled1.2mb/dy.Thetransportationandrefininginfrastructurewas
unprepared for such production growth and that led to a decrease in US oil prices. The
average spread between Brent and WTI oil amounted to $17/bbl in 2011‐2012, while
severalyearsbeforeWTIsoldatapremiumincomparisontoBrent.(Lukoil)

PageNo.29
FIGURE8OILPRODUCTIONINNORTHDAKOTA
UNCERTAINITYINRESERVEESTIMATION
Shaleoilreservesarecharacterizedbylowpermeability.Hydraulicfracturingtechnologyis
used to improve the oil inflow.Well flow rates in shale formations are characterized by
highdeclineratesinthefirstyearofproduction‐generallytheyamountto60‐70%ofthe
maximumflowrate.Shaleoil reserves in theUShaveundergoneseveral revisions in the
lastfewyears.In2008theUSGeologicalsurvey(UsGs)estimatedrecoverableoilreserves
attheBakkenformationat3,65bln.In2013theUSGSincreasedthereservesestimateto
7,4blnbbl.In2011ContinentalResourcesvaluedrecoverablereservesat20blnbbl.The
principalinstrumentofreserveestimationisproductioncurveanalysis,whereproduction
curvesarederivedfromtheactualdataofapproximatewellflowrates.Whentheperiodof
awell’soperationissmall,forecastsfordifferentproductioncurvesmayvarysignificantly.
Themajority ofwells in theBakken formation currently only have data for 3‐4 years of
actualoperations,leadingtosignificantdiscrepanciesinexistingestimates.
The value of the estimated ultimate recovery (EUR) depends on the chosen method of
calculation and data available. Estimates may significantly vary for different groups of
wells, depending on the quality of formation, hydraulic fracturing technology and other
factors.Hence,anoverestimationofshaleformationreservesispossible.(Lukoil)

PageNo.30
FIGURE9AVERAGEBAKKENWELLPRODUCTIONCURVE
POTENTIALFORWELLDRILLING
Whenforecastingshaleoilproduction,itisnecessarytotakeintoaccountthepotentialfor
well drilling. Themaximumnumber ofwellswill dependon theproductive area of land
suitablefordrillingandonwellspacing.Accordingtothecurrentestimates,themaximum
number ofwells that can be drilled at theBakken formation inNorthDakota is 33,000‐
39,000.Asthedensityofwellspacinggrows,EURdecreases,andthisshouldalsobetaken
into account when forecasting future production. Intensifying shale oil production by
increasingratesofdrillingwillleadtofastreservedepletion.
Accordingtoourestimates,dailyoilproductionof2mbattheBakkenformationisunlikely
tobesustainable,becauseinthiscasethedrillingpotentialwillbedepletedby2022‐2025.
ThemostlikelyscenarioofBakkenformationdevelopmentisthatitreachesaproduction
levelnothigherthan1.5mb/dby2020.Tosupportconsistentlyhighlevelsofproduction
companieswillhavetocontinueincreasingthenumberofactivedrillingrigs,leadingtothe
needtohiremoredrillingcrews.Accordingtothe2012pollconductedbyNationalOilwell

PageNo.31
Varco, theavailabilityofqualifieddrilling crews isoneof theprincipal challenges forUS
drillingcompanies.Itispossiblethatanothersubstantialconstrainttothegrowthinshale
oilproductionintheUSwillbeashortageofhydraulicfracturingcrews(Lukoil)
FIGURE10FORECASTOFNUMBEROFWELLS
OTHERCONSTRAINTS
Shale oil production requires the use of large quantities of water. Hydraulic fracturing
requires5‐19mln litersofwater.Thismaybecomeanimpediment incertainproduction
regions. There are also certain concerns regarding the environmental safety of shale oil
production.When hydraulic fracturing is underway at a shallow depth, companies may
inject chemical reagents into the ground waters. There may also be problems with the
disposalofusedchemical solutions. Inaddition, expertsnote that shaleoilproduction is
associated with the emission of methane and other dangerous compounds into the
atmosphere.
Some experts express concern that the use of hydraulic fracturing may lead to rock
movement and deformation, and this, in turn, can provoke landslides and restrict
construction. Considering this list of constraints,we forecast that shale oil production in
theUSwillamountto3.9mb/dby2025.Shaleoilproductiongrowthisexpectedprimarily
atthemostdevelopedformationsinBakkenandEagleford.Takingintoaccountwellflow

PageNo.32
rates, thepaceofdrillingand theproductivearea, themost intensivegrowth inshaleoil
production in the US will take place in the next 5‐10 years. After that production will
stabilize.(Lukoil)
FIGURE11FORECASTOFSHALEOILPRODUCTION
NORTHAMERICABECOMESTHELEADERINOILPRODUCTION
ForthenextdecadeNorthAmericawillremaintheleaderintermsofgrowthofproduction
of liquidhydrocarbons.By2025 theaggregatevolumeof liquidhydrocarbonandbiofuel
productionintheUSandCanadawillamountto19mb/d,thussignificantlyreducingthe
region’sdependencyonoil imports. Justseveralyearsagofewbelievedthatsuchgrowth
wouldbepossible in a regionwith consistentlydecliningproduction at brownfields.But
large‐scale deployment of innovative technologies has forced many to review their
evaluations.
TheUnitedStateswillcontinuetoincreaseliquidhydrocarbonproductionwiththehelpof
shale oil, the development of deepwater shelf and growth in NGL production In Canada
production growthwill primarily depend on the oil sands. By 2025 production of high‐
viscosity oil in Canada will reach 3.6 mb/d, which is 1.7 mb/d more than this year.

PageNo.33
Production growth in Canada may be significantly constrained by logistics and
environmentalconcerns.(Lukoil)
FIGURE12FORECASTOFPRODUCTIONOFLIQUIDHYDROCARBONINNORTHAMERICA
BIOFUELS
According to our estimates, the rapid growth in biofuel consumption that theworld has
beenexperiencingsincethemid‐2000sisunlikelytoberepeated.Europeanbiofuelshave
highproductionthecostanduntilrecentlyhavebeendevelopedwiththehelpofsubsidies.
InGermany,forexample,thecostofbiodieselproductionisalmosttwotimeshigherthan
thecostofproductionof regulardiesel fuel.Thecrisis,however, is forcing theEuropean
governments tocutbiofuelsubsidyprogramsand,asaresult,manyEuropeanproducers
are experiencing losses. In addition to this, the European Commission has proposed to
lowerthetarget levelof1stgenerationbiofuelconsumptionto5%ofthetotalvolumeof
motorfuelconsumption,whilethecurrenttargetlevelis10%.Ifthissuggestionispassed,
itwillhaveanegativeeffectontheconsumptionofbiofuelsinEurope.

PageNo.34
TheUnitedStatesistheworld’slargestbiofuelproducer,butthesituationthereisalsofar
from optimistic. It was believed earlier that the development of biofuels is a strategic
necessitycapableofdecreasingAmericandependencyonimportedoil.Butthegrowthin
productionofunconventionalhydrocarbonshasreducedtherolethatbiofuelsweremeant
toplayintheprovisionofAmericanenergysecurity.Manyexpertsdoubtwhetherbiofuel
productionisjustifiablefromanenvironmentalpointofview,since,asarule,productionof
fuelfromcropsrequiresfossilfuels.Takingthestatedcircumstancesintoaccount,wehave
aratherconservativeviewoffuturebiofuelprospects.(Lukoil)
FIGURE13FORECASTFORGLOBALBIOFUELPRODUCTION
DEEPWATERPRODUCTION
Astraditionalonshorereservesaredepleted,offshoreresourcesareplayingagreaterrole
insupplyingthegrowingdemand.Thegrowinginterestinshelfresourcesisillustratedby
thefactthatoverthelast20yearsthenumberoflargeshelfdiscoverieshasbeengreater
thanthenumberofbigonshorediscoveries.Today,provenoffshorereservesarevaluedat
280blnbbl,whileshelfproductionamountsto30%oftheglobalproduction.Technological
development helps oil companies to increase the depth of offshore fields. About 27%of

PageNo.35
shelfproductioniscurrentlyatadepthof300mandmoreandwithtimethisshareissetto
grow.Today,technologyallowsproducerstodrillatdepthsthatexceed3,000m.However,
developmentofsuchreservesrequiresmultimillion‐dollarinvestments
TheaccidentattheDeepWaterHorizondrillingplatformintheGulfofMexicohasforced
manycompaniestoreviewtheirapproachtosafetymeasuresduringshelfdrilling.Thiswill
lead to growing operating costs for offshore projects. The high tax burden in certain
countries, such as Angola and Nigeria, will also lead to growth in production costs.We
estimatetheoilpriceforprofitabledevelopmentofdeepwaterreservesshouldbeatthe
level of $50‐90/bbldependingon the regionofproductionandwaterdepth.Despite the
highcostofproductionandoperatingrisks,deepwaterproductionwillcontinuetogrow.
After2015,whenanumberofnewlargefieldswillbeput inoperation,weexpecttosee
significantproductiongrowth.(Lukoil)
FIGURE14DEEPWATERPRODUCTIONFORECAST
IRAQIPRODUCTIONGROWTHPROPSECTS
Iraq remains themost promising region in termsof conventional oil production growth.
Despitethecountry’s impressiveprovenreservesthatamountto143blnbbl,production
levels remain relatively low ‐ and in 2012 amounted to 3.1 mb/d. In the process of
PageNo.36
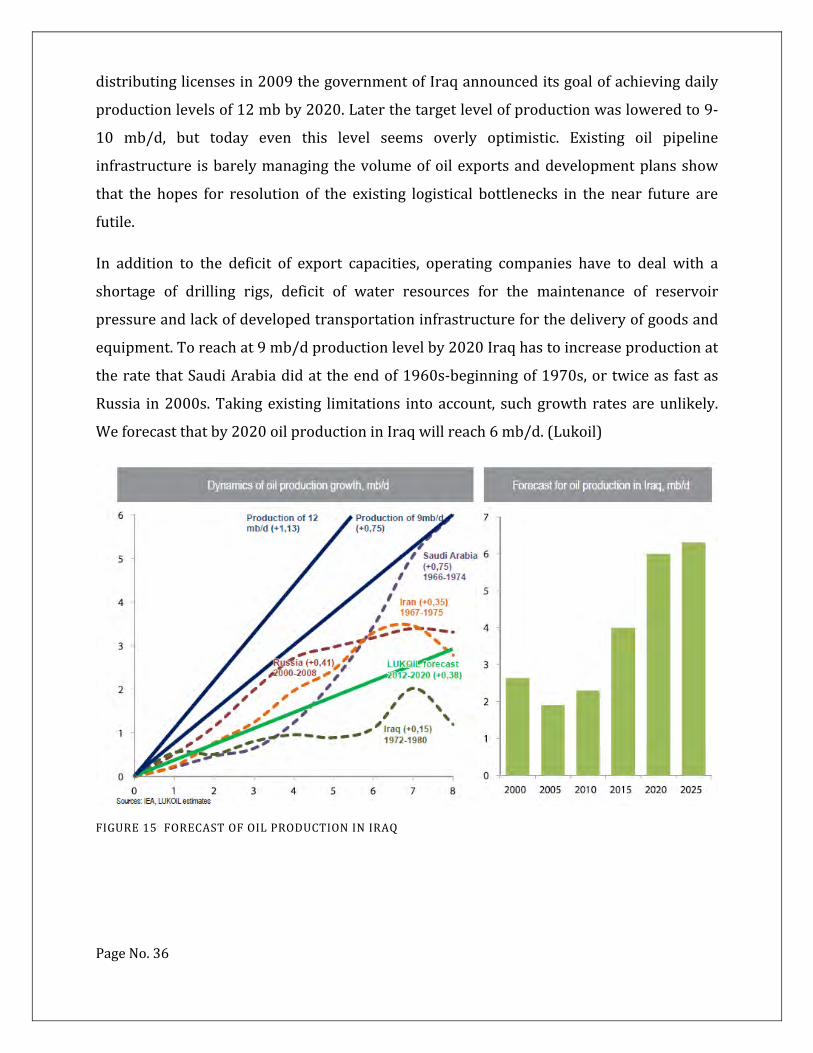
distributinglicensesin2009thegovernmentofIraqannounceditsgoalofachievingdaily
productionlevelsof12mbby2020.Laterthetargetlevelofproductionwasloweredto9‐
10 mb/d, but today even this level seems overly optimistic. Existing oil pipeline
infrastructure isbarelymanagingthevolumeofoilexportsanddevelopmentplansshow
that the hopes for resolution of the existing logistical bottlenecks in the near future are
futile.
In addition to the deficit of export capacities, operating companies have to deal with a
shortage of drilling rigs, deficit of water resources for the maintenance of reservoir
pressureandlackofdevelopedtransportationinfrastructureforthedeliveryofgoodsand
equipment.Toreachat9mb/dproductionlevelby2020Iraqhastoincreaseproductionat
theratethatSaudiArabiadidattheendof1960s‐beginningof1970s,ortwiceas fastas
Russia in2000s.Takingexisting limitations intoaccount, suchgrowth ratesareunlikely.
Weforecastthatby2020oilproductioninIraqwillreach6mb/d.(Lukoil)
FIGURE15FORECASTOFOILPRODUCTIONINIRAQ

PageNo.37
OPEC’SBALANCINGROLE
Today OPEC countries control about 42% of global oil production. Thanks to their
coordinated actions, cartel members are capable of rapidly reacting to changes in the
market situation by introducing production quotas. Such actions helped to stabilize oil
pricesratherquicklyduringtheglobalfinancialcrisisof2008.Oilpricesactasadecisive
factor for thebudgetrevenueplanningofOPECcountries.Asaresultof theArabSpring,
thebudgetaryobligationsofcertaincartelmembershavegrownsignificantly.Accordingto
existingestimates,thebreakevenpricethatallowsSaudiArabiatobalanceitsbudgetwas
about$78/bblin2012.
The probability of further budget expenditure needed to stimulate the economy and
implementinfrastructureprojectsisquitehighforthenext2‐3years.Forexample,Saudi
Arabia’s budget for 2013 envisions an increase of 19%. Therefore it should come as no
surprisethatSaudirepresentativesregularlyvoiceapriceof$100/bblasthetargetlevel.
In the medium term, as production by independent producers, especially the US and
Canada, grows, OPEC members will limit the growth of their own production, thus
supportingtheglobaloilpricesatnecessarylevels.(Lukoil)
FIGURE16DYNAMICSOFOPECSHAREINGLOBALPRODUCTION

PageNo.38
GTL‐CHALLENGEFORTHEOILMARKETAFTER2020
One of the most promising alternatives to oil fuels is GTL technology. This technology,
based on the synthesis of liquid fuels from coal ormethane, had been used back in the
1940s in Germany, which experienced a shortage of oil during World War II. GTL
technologymakes itpossible torefinemethanefromnaturalgas intoawidespectrumof
products, the most important of which are diesel fuel and kerosene with improved
environmentalcredentials.Today,revivalof interest inthistechnologyisaresultbothof
thestricterenvironmentalrequirementsformotorfuelsandofthepossibilityofoperating
gas fields in regions lacking gas transportation infrastructure. The largest active GTL
projecttodayisPearlGTL.Сurrentmarketpricesmakeitprofitable.
TheonlyprojectcurrentlyunderconstructionistheEscravosGTLinNigeria.Therelatively
smallnumberofactiveandplannedprojects isa resultof thehighcostsofbuildingGTL
refineries.OverthenextfewyearsGTLtechnologywon’tpresentaseriouschallengetothe
oil industry. But beyond this time the situation may radically change due to further
developmentofmethaneconversionmethods.Amongthepromisingmethodsisthemicro
channel technology that makes it possible to substantially reduce the physical size of
reactors, leading to a reduction in capital investments in construction. We believe that
development of GTL technologymay have a significant influence on the oilmarket after
2020.ShouldGTLtechnologygainlarge‐scalecirculation,it’spossiblewe’llseethespread
betweenoilandgaspricesnarrowing.(Lukoil)

PageNo.39
FIGURE17HISTORYOFGTLPROCESS
INFLUENCEOFDOLLAREXCHANGERATE
SinceoilpricesaredenominatedinUSD,thedynamicsoftheAmericancurrency’sexchange
rate will influence global oil prices. As a rule dollar depreciation leads to growth in oil
prices,while dollar appreciationdoes the opposite. The influence of the dollar exchange
rateonoilpricescanbeillustratedbycomparingthedynamicsofoilpricesinUSDwithoil
prices,denominatedinSwissfrancsandgold.Overtheperiodof2000‐2012,thepriceofoil
denominated inUSD increased3.9 times,while thepriceofbarreldenominated inSwiss
francsonlygrew2.2 times,while thepriceofoildenominated ingoldactually fell. If the
dollarwastightlytiedtothegoldstandard,thepriceofoiloverthelastdecadewouldbe
practicallyunchanged.
Overthelastdecadewehavebeenseeingatrendtowardsdollardepreciationagainstother
globalcurrencies.InmanywaysthisisaresultofUSmonetarypolicy.Depreciationofthe
dollar stimulates the US economy by having a positive influence on exports. Alongwith
economicgrowth,thecurrenciesofdevelopingcountries,especiallytheonesfromtheAsia
Pacific region, are appreciating.Most likely this trendwill continue in themedium term,
encouraginggrowthinoilprices.(Lukoil)

PageNo.40
FIGURE18DYNAMICSOFBRENTOILPRODUCTION
OILPRICESFORECAST
PopulationgrowthandhighratesofautomotivegrowthinAsiawillencourageanincrease
in oil consumption in the medium term. Growing demand and the natural decline of
production from conventional oil fields will require the development of new reserves.
Recently therehasbeenasteady trend towardsanescalation inE&Pcostswhichcanbe
explainedbythedepletionofconventionalfields.Astheincreaseinproductionwillbefrom
highcostsourcessuchasdeepwaterfields,high‐viscosityoilandoilfromtightreservoirs,
the production costs will continue to grow. Taking into account the high cost and
technological achievements in oil production, biofuelswill not have serious stimulus for
growthinproduction.
The increase inoilproduction inNorthAmericawillbegradualwhichwill allowmarket
playerstoadjusttochanges.Medium‐pacedincreaseinoilproductionisexpectedinIraq
where the planned production probably won’t be reached due to technological and
infrastructuralshortage.OPECwillstrivetokeeppricesabove$100/bbltomeetitsbudget
commitmentsastheindependentproducersincreasetheirproduction.Aboveall,thetrend
towards US dollar depreciation is one of the important factors that influence oil price
PageNo.41
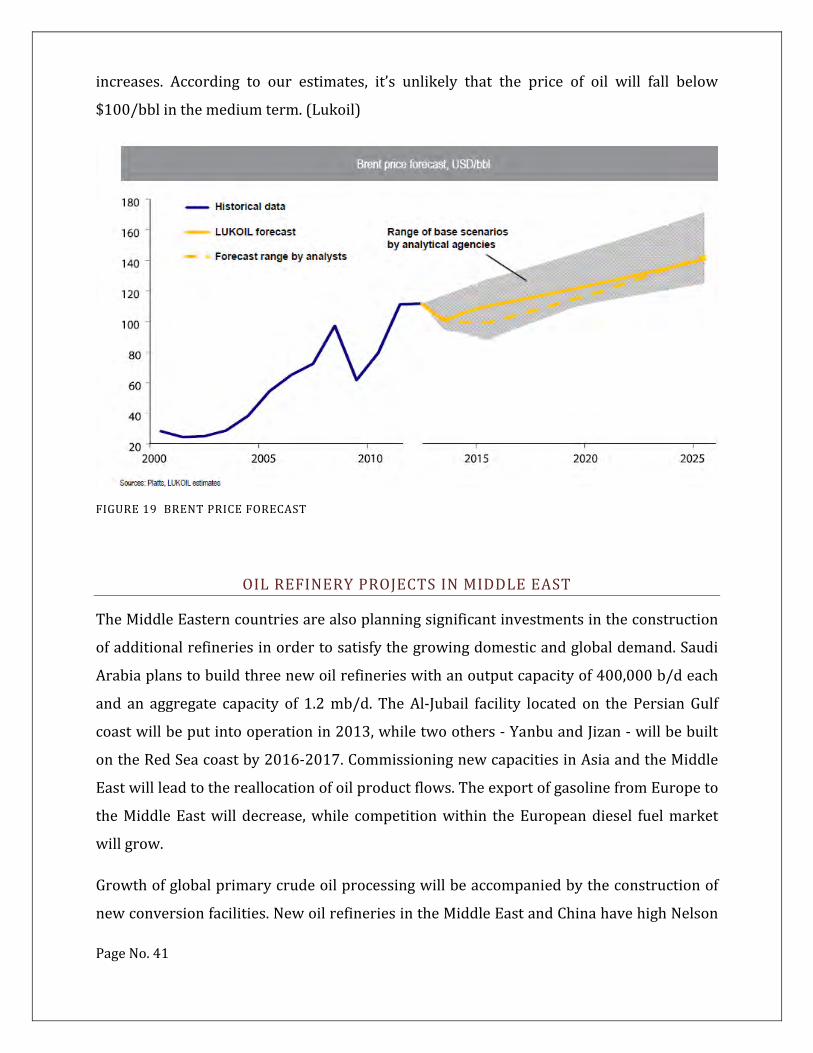
increases. According to our estimates, it’s unlikely that the price of oil will fall below
$100/bblinthemediumterm.(Lukoil)
FIGURE19BRENTPRICEFORECAST
OILREFINERYPROJECTSINMIDDLEEAST
TheMiddleEasterncountriesarealsoplanningsignificantinvestmentsintheconstruction
ofadditionalrefineriesinordertosatisfythegrowingdomesticandglobaldemand.Saudi
Arabiaplanstobuildthreenewoilrefinerieswithanoutputcapacityof400,000b/deach
and an aggregate capacity of 1.2mb/d. TheAl‐Jubail facility located on the Persian Gulf
coastwillbeputintooperationin2013,whiletwoothers‐YanbuandJizan‐willbebuilt
ontheRedSeacoastby2016‐2017.CommissioningnewcapacitiesinAsiaandtheMiddle
Eastwillleadtothereallocationofoilproductflows.TheexportofgasolinefromEuropeto
theMiddleEastwill decrease,while competitionwithin theEuropeandiesel fuelmarket
willgrow.
Growthofglobalprimarycrudeoilprocessingwillbeaccompaniedbytheconstructionof
newconversionfacilities.NewoilrefineriesintheMiddleEastandChinahavehighNelson

PageNo.42
complexity Indices and this implies that they have extensive conversion capacities. For
EuropeanoilrefineriestheaverageNelsonIndexequals7units,butforthenewcapacities
intheMiddleEastandAsiathisfigureamountsonaverageto10units.Constructionofnew
conversioncapacitieswillcontinuetotakeplaceindevelopingcountries.Themostpopular
productionprocesseswill includehydrocrackingunitsused forproductionofdiesel fuel
and high quality motor oils, catalytic cracking units used for production of high octane
gasolineandthecokingunitthatallowsheavyresiduestoberefinedintopetroleumcoke
withproductionofadditionallightoilproducts.(Lukoil)
FIGURE20LARGESTNEWOILREFINERYPROJECTSINTHEMIDDLEEAST
RESEARCHOBJECTIVES
TounderstandtheOil&Gasmarketpotentialgrowth.
Tounderstandthesuitablemarinespreadconsideringmarketdemand.
Tounderstandtheimplicationsinvestment,operatingcostandreturn.
Tocheckthefeasibilityofowningamarinespread.
Tounderstandtheadvantagesanddisadvantagesofchartering.

PageNo.43
Tokeepthebusinesssustainableandprofitable.
RESEARCHMETHEDOLOGY
This isdoneby interviewing thedecisionmakers invariouscompaniesand interviewing
experiencedoil&gasprofessionals.Thisistogaugeandunderstandthedemandofmarine
spread in Middle East and other part of the globe. Also, it will give an idea about the
company’s budget and economic conditions of themarket by giving a clearer picture on
demandandpotentialtowincontractsaswellascompetition.
PRIMARYRESEARCH
Primaryresearchisdonetofindoutthesuitablemarinespreadtoownandadvantagesand
disadvantagesofowningamarinespread.
Whatisthebasicoperationalrisk.ThispartoftheresearchisdonewithvariousOperation
managersofMarinecompanieswhichareoperatingtheirvesselsmostlyinMiddleEast.
Primaryresearchinvolvesthein‐depthinterviewwithkeypersonnelinvariousOil&Gas
companies .It gives the information regarding the upcoming projects, competitions,
potentialcompetitors,updatedmarineregulationsandsafetyrequirementstooperatethe
vessel.Thisresearchwillhelpusinfindingoutthedemandforthemarinespread.
Belowmentionedarethestakeholderswhowillbeinterviewedforgainingdeeper
understandingabouttheOil&Gasindustryandmarketdemandconditions.
VesselOperators‐The interviewwillbe1‐1andwillbean IDIwhichmeansan InDepth
InterviewbasedonQualitativeResearchQuestionnaire.Thistypeofaninterviewwillhelp
usgainmoreinsightonhowtheoperationsareruntooperateamarinespreadandwhat
are their futureplans in termsofnewbuildvesselwhichgivesan insight for themarket
demand.
Customers‐Oil&GasfieldOperators.Variouskeyprofessionalswhoworksforthemajor
oil field operators in Middle East are interviewed to understand their needs and
PageNo.44
requirementswithrespect to themarinespread.Tounderstandwhat is themostcritical
factor, in terms of HSE and marine regulations for them in order to give business to a
company.
SECONDARYRESEARCH
WehavecollectedthedatafromvariousreadingmaterialsavailableonOil&Gasindustry
presentinpublishedbooksaswellasonline.Thisdatahashelpedusindetermining
varioustrendsinoil&Gasindustry,Oilpricevariation,Oilproductiondemandetc.We
requiredtoknowthepast,presentandfutureprojects.
PROJECTSCOPE
Basedontheresearchmethodologythefindingscollectedbasedontheanalysisdonewill
helpusintakinganinformeddecisionwhethertogoforwardwithbuyamarinespreadup
or not. Based on the investment and assumptive return as per other operatorswe have
forecasted Profit and loss for the organization. We have used past project data and
assumptive returnby the competitorshowever these are all basedon thepast thus it is
necessarytofactorinmacroeconomicconditionsaswell likepolitical,currency,oilprice
inflationrisksetc. HoweverMiddleEastmarkethas lowriskscomparedtootherpartof
theGlobe.ThedemandfortheVesselinotherpartoftheGlobeandareaslikeEastAfrica,
NorthSeaandvariousreducestheriskofthismarket.
VESSELSNOTINCLUDEDINTHEFLEET
OIL & GAS operators mostly have restrictions to use conventional mooring barges to
operate near the Offshore platforms. It has got potential risk for the subsea pipelines.
Anchordrag,misspositioningofanchorswillresultsindamagingthesubseapipelines.In
additiontothattheweatherdowntimesforsuchvesselsareveryhigh.HencetheOilfiled
operatorsprefersJack‐upbargesforthetopsidemodificationworksaswellasothersubsea
work. Henceconventionalmooring bargesareeliminated fromtheFleet.For theGreen

PageNo.45
fieldprojects,tolaynewpipelines,theconventionalmooringbargesrequiredandthatshall
beconsideredlaterstageofthebusiness.
LIMITATIONS
OneofthemajorlimitationsfortheJack‐upbargesarelimitationinoperatingindeepsea.
Theleglengthofthejack‐upgovernstheoperatingdepth.SincetheMiddleEastoilfields
areshallow,wedidn’tanticipateanythreatinoperatinginthispart.
FINDINGANDANALYSIS
PRIMARYRESEARCH
Theprimaryresearchontherequirementsforselectthemarinespreaddivertedtothe
initialinvestment,potentialdayratesandOperationalcosts.Itinvolvedin‐depthinterview
withtheoperationalmanagerofvariousmarineoperators.
Comparisonofdifferenttypesofvesselandtheiradvantageanddisadvantagesaregiven
below.
Sl.No. Issues
Accommodations‐workBarge[OPTION‐1]
Buy/buildJack‐upbarge[OPTION‐2]
Convertdrillrigtoaccommodation‐workbarge[OPTION‐3]
1Operatingmode Afloatmode Elevatedmode Elevatedmode
2Metoceaneffect
Direst,therewillbesitedowntimesforHs>1.5
In‐derect,nositedowntimeduetoheavyseas
In‐derect,nositedowntimeduetoheavyseas
3Monsoondowntime Yes
No,roundtheyearoperation
No,roundtheyearoperation
4 Operatingcost
More,duetomooringspread&moredowntime Less Less
5Mobilizationcost
More,duetomooringspread Less Less
6Initialinvestment Low VeryHigh High
7Assetre‐salevalue Low High High

PageNo.46
8 Marketratesupto30,000US$/day
upto75,000US$/day
upto65,000US$/day
9Initialinvestment* 15mto25mUSD 60mto100mUSD 45mto55mUSD
TABLE1COMPARISONOFVESSELS,THEIRDAYRATEANDOPERATINGEXPENSES
FINDINGS
TentativelybasedonPrimaryresearch(IDI)arementionedbelow.
Interviewer:Myself
Interviewed:MukeshNair‐OperationsManager(MubarakMarine)
Mr.Ron–Director(LivingstoneLiftboats)
JeffJackson‐OperationsManager(AquaDive)
Jack‐upbargesarethehotcakeinMiddleEastMarket
ThereisdeficiencyofJack‐upbargesinthisMarket.
TheOffshorecompaniesowningaJack‐upbargeisveryfew.
OilfieldOperatorsprefersEPCcontractorswiththeirownvessel.
Minimalinterfacesintheproject.
Owningavesselwillenablethecompanytogivecompetitivebidsincethemajor
costfactorfortheoffshoreprojectsarethemarineunits.
MarineUnitswillenablethecompanytowinbidsirrespectiveofcompetition.
ManyofthevesseloperatorsfailingtoqualifythestringentrequirementofOil
fieldoperatorslikeADMA,ZADCOetc.Sinceourcompanyisalreadyqualifiedfor
differentworks,itshouldn’tbeaproblemforustogetitthrough
TENTATIVELYASEDONPRIMARYRESEARCH[IDI]WITHCUSTOMERS
Interviewer:Myself
Interviewee:Mr.RahulRajan(HSEdesignhead,ADMA)
Mr.Byron(SeniorProjectEngineer,MOQ)
Vishak Gopi
Text Box
Vishak Gopi
Text Box
PageNo.47
Mr.Anish(PrincipleSurveyor,DNV,Abhudhabi)
ThereisagoodneedforJack‐upvessel
Mostoftheavailablevesselsareagingnow.15yearsistheallowableageofthe
vesseltooperateinmostoftheoilfields.
It’sagoodideatohaveafleetalongwiththeotherservicesourcompanyoffers.
Mostofthesubseapipelinesandplatformarebuiltin1970’sandmostofthem
areagingnow.
Thepipelinesaretobereplaced.Topsidepipingtobereplacedorupgradedfor
higherdesignpressure
Mostofthetopsidepipingaredesignfor3250psiandithastobeupgradedto
3600psitoincreasetheoperatingpressureandhenceproduction.
Thereisanupcomingtenderforconductorpiperepairofover100wellhead
towersandboatlandingreplacementofover100platformsinAbhudhabioil
field.
SECONDARYRESEARCH
Secondaryresearchwasaccumulatedthroughvariousliteraturesavailableonlineand
otherwise.
HereisimportanttoscantheMACROECONOMICfactorsspecifictoOil&Gasindustry,
MiddleEast.
P‐PoliticalItisimportanttoknowthatMiddleEastispoliticallyverystable.The
Governmentisverystableandfocusesonoilproductiongrowth.
(Source:ArabianBusiness.com,2007)
E‐EconomicallyMiddleEastOil&Gasmarketisboomingthoughataslowerpace.About
56percentoftheworld'soilreservesand36percentoftheworld'snaturalgasreserves
areintheMiddleEast.2011sawUAEastheworld'seighthlargestoilproducer,churning
outanaverageproductionvolumeof2.813millionbarrelsperday.UAEcomesfourthinthe
Vishak Gopi
Text Box
PageNo.48
topglobalexportersleague,exportingaround81percentofitstotalproduction.TheUAE
exportsaround2.32millionbarrelsofcrudeoileachdaytopredominantlyAsianmarkets.
Almostone‐thirdofthetop20Oil&GasprojectsintheMiddleEastunderexecutionarein
UAE.(SourceGas,2014)
S‐Social‐ThesocialenvironmentinMiddleEastisveryhealthy.Expatriatesfromvarious
partsoftheglobeprefertoworkintheMiddleEast.Todevelopanexperiencedworkteam
foroffshoreoperationswouldn’tbeamajortask.OurcompanyoperatesinFreezone,and
thegovernmentbelievesinmakinggoodrelationshipwitheachotherforthegrowthofthe
business.
T‐Technologically‐MiddleEast,especiallyUAEisverysimilartootherEuropean
countries.Peoplehaveaccesstoallthenewtechnologicgadgetsandtherearemanylocal
andmultinationalcompaniesrunningtheiroperationswhichrequiregoodqualityproducts
andservices.
E‐Ecological‐UAEgivesspecialfocusoncleanlinessandsafeguardingitsnaturalbeauty.
SharjahFreezonehasalwaysrunaggressivecampaignstotakecareoftheecologicalaspect
oftheenvironment.
L‐Legal–SharjahHamriyahfreezonewasfoundedorestablishedoveradecadeandover
6000variouscompaniesareoperatingfromHFZ.Itprovidestheoptionof100%
ownershiptotheexpatslivingintheUAE.HFZgivesprioritiestothecompaniesregistered
inHFZintermsofberthallocation,permissionforthevesseltoenterandgoout,pilotage
servicesetc..

PageNo.49
PORTER’SFIVEFORCES
FIGURE21PORTER’SFIVEFORCESMODEL
(Source:PortersFiveforces,2013)
AsperPortersfiveForcesModelfollowinghasbeenestablished
Throughouttheanalysiswewillbegaugingiftheenvironmentisfeasibleforabusiness
liketooperateamarinespreadbasedonthefactorsmentionedaboveinfigure21.
Threatofnewentrants‐Threatofentrantscanbementionedasaveragesinceitisneither
veryhighnortoolow.Since,MiddleEastOil&Gasmarketisgrowingandmanyprojects
arecomingup,severalcompaniesareeyeingexpansioninincreasingtheirfleet.However
thereisdeficiencyinJack‐upinthemarket.Henceifthecompanyisowningajack‐upand
providesgoodserviceandbuildsupgoodrelationshipwiththecustomersthenthethreat
fromnewentrantscanbefurtherreducedtoagreatlength.
BargainingPower–Sincethecompanyalreadyhasgotexperiencedprojectexecution
teamandalreadyprovidinggoodservicetotheclients,theadditionofmarinespreadwill
definitelyelevatethebargainingpowerofthecompany.
ThreatofSubstitutes‐ThreatofsubstitutesisverylesssinceJack‐upbargescanbe
replacedwithJack‐upbargesonly.Todeployanewteamreplacinganexistingcompany
familiarwiththefieldandsafetynormsisnoteasytaskfortheclients.

PageNo.50
Rivalryamongcompetitors‐Competitionatthemomentisverylowsincethereis
deficiencyofsuitableAck‐upbargesinthemarket.Experienceinprojectexecution,HSEis
themajorfactorcompetitivenessinOil&Gasindustry.Thusfocusongoodandsafeservice.
VeryHighHighModerateLowVeryLow
12345
Threatofnewentrants 4
BargainingPowerofSuppliers 2
BargainingPowerofBuyers 4
ThreatofSubstitutes 5
RivalryAmongCompetitors 3
TABLE2ANALYSISBASEDONPORTERSFIVEFORCES
SWOTANALYSIS
Strength
ExperiencedTeam
Inhousecapabilitytooperate
Opportunities
Enablethecompanytowinprojectsbyattracttheclientswithmarinespread
Lessoperatingcostcomparedtothecompetitors.
C
Weakness
Newoperatorswhichwilltaketimetoestablishitselfasabrand
Threats
Verylowcompetitionentrybarrier
Contractorsliketodealwithexperiencedmarineoperators.

PageNo.51
TABLE3SWOTANALYSIS
DECISIONTREEFORSETTINGUPMARINEOPERATION
Figure22DECISIONTREE
Therevenueiscalculatedbasedonthedayrateofthestandardjack‐upbargesvsaverage
operational daily expense. Considering strong growth of 300 charter days and yearwill
giveanetreturnof15.5miland weakgrowthof250charterdaysayearwillgiveanet
returnof11.5mil.
Five year operation will enable the company to achieve break even in good growth
scenario.
Whereascharteringoptionwillgiveanominalcommissionof10%marginondayratesand
stronggrowthwillgive1.05milreturnsinanyearcomparedtoaweakgrowthof0.63mil
peryear.
ThedayrateofJackupis70000USDperday
Average operating cost 15000 USD per day considering operating crew charges and
maintenancecost[IncludingFuelOil,LubeOil,FreshWateretc].
Thestronggrowthconsidered300daycharterperyearirrespectiveoflongtermorshort
termcharters.250charterdaysperyearconsideredforweakgrowth.
Jack–UpBarge
Buy
Charter
StrongGrowth.300charterdaysanyear
StrongGrowth.150day
WeakGrowth.250days/year
WeakGrowth.90days
21‐5.48=(15.5mil)
17.5‐5.48=(12.02mil)
1.05mil
0.63mil

PageNo.52
Forthepresentcharteringoptioncompanyfollowsatariffof10%marginondayratesand
whicheventuallygives1.05mil revenueperannum ina stronggrowth scenariowhereas
0.63milincaseofweakgrowthscenario.
RECOMMENDATIONS
Now that findings encourage us going forwardwith own amarine spread. The required
specificationstobesetinthebeginning.Thenextchallengeistofindasuitablevesselinthe
market for sale and compare its cost to build in house. Since the company is capable of
manufacture a Jack‐up internal price comparison and committed work load shall be
analyzedandthemanagementwilltakeacallonbuyfromoutsideorbuiltin‐house.
MANAGERIALIMPLICATIONS
OntheabovefindingsandanalysistheorganizationneedtogoforwardwithowntheJack
upBarge.Sincethecompanyownthequay‐sidefacilityandJettyitwon’tbedifficulttoget
theberthtoanchortheJackupbarge.Theadditionalcostwillbetheoperationalcostas
mentionedintheprimaryresearchfindings.
SUPPLIERS
TheJackUpbargecanbebuiltin‐houseorbuyoutfromthemarket.TheavailableJackupbargesinthemarketasfollows
Livingstone360
AquaDiveII
WorkBoatInternational
RodsonUniversalPteLtd
Force3Offshore

PageNo.53
VESSELCOST
Livingstone360costs–USD80‐100mil
AquadiveII‐USD50‐60mil
InthisstudyUSD100milinvestmentconsideredeithertobuyLivingstone360classliftboatorUSD100miltobuiltin‐houseaJack‐upbargewhichisconsideredtobeaperfectoneinthismarket.
INFRASTRACTUREREQUIREMENT
Thelistofinfrastructurerequired:
Jetty–75meter Waterfrontequipmentstoragearea–2500Sq.Meter Officespace‐20person
Sincethecompanyalreadyhavingthemanpoweranddedicatedshiprepairdivision,themaintenanceofthevesselshallbedoneinhouse.
HUMANRESOURCEREQUIREMENT
ListofPersonnelrequirement[BargeOperation]:
BargeSuperintendent‐1nos BargeEngineer‐2nos BargeMaster–1nos FirstEngineer‐4Nos SecondEngineers‐6Nos Technicians‐12Nos StoreKeeper/Logistic‐1Nos Seamen‐8Nos Medic‐1nos
Note:TheEmployeesforbargeoperationshallbeoncontractbasisandtheirsalaryincludedinoperationalexpenses.
ListofPersonnelrequirement[OnshoreSupport]:
MaintenanceManager‐1nos[300,000AEDperannum]

PageNo.54
OperationsManager‐1nos[300,000AEDperannum] BusinessDevelopmentManager–1nos[300,000AEDperannum] FinanceManager‐1[300,000AEDperannum] ContractsManager‐1[300,000AEDperannum] ProjectManager‐1[300,000AEDperannum] Project/FieldEngineers‐2Nos[240,000AEDperannum] DesignEngineer/NavalArchitects‐2Nos[240,000AEDperannum] HRassistant‐1Nos[75,000AEDperannum] Secretory‐2Nos[75,000AEDperannum] Documentcontroller‐1Nos[75,000AEDperannum] Officeboy‐1Nos[48,000AEDperannum]
Themaintenance,finance,HR&Admin,Logistics,andSecurityetcshallbeutilizedfromtheexistingteam.
COMPETITORS
ItisalsoessentialtoknowaboutthecompetitorsinthismarkettogoforwardwiththeideatoownaJack‐upbarge.Thelistofcompetitorsisasbelow:
GMS ALROUMIGENERALTRADINGESTABLISHMENT ALMANSOORIPRODUCTIONSERVICES BINJABRMARINEEST. EMIRATESWESTERNOILWELLDRILLINGANDMAINTENANCECOMPANYLLC GENERALPETROLEUMSERVICESEST GULFAUTOMATIONSERVICES&OILFIELDSUPPLIES(GASOS) GULFMARINESERVICES MARIDIVE&OILSERVICES MUTAWAMARINEWORKSL.L.C. SCHLUMBERGERMIDDLEEASTS.A. TARGETENGINEERINGCONSTRUCTIONCO.LLC UNIARABENGINEERING&OILFIELDSERVICES ZAKHERMARINEINTERNATIONALINC. NATIONALPETROLEUMCONSTRUCTIONCOMPANY(NPCC) NATIONALPETROLEUMCONSTRUCTIONCOMPANY(NPCC) ALSHOUMOUKHINTERNATIONALSERVICES(SISCO) WHITESEASHIPPINGLLC STANFORDMARINESERVICESLLC WELLSTECHNIC EMDADLLC(exALBAWARDIEST) KHALIDFARAJSHIPPING

PageNo.55
ABUDHABIPETROLEUMPORTSOPERATINGCOMPANY(IRSHAD) ESNAAD HALLIBURTONWORLDWIDE BOSKALIS MUTAWAGROUP GPC AQUAMARINE LIVINGSTONE
PROJECTEDPROFIT&LOSSSTATEMENTFORFIVEYEARS
Year1 Year2 Year3 Year4 Year5Charterrevenue[300days/year]
21,000,000 21,000,000 21,000,000 21,000,000 21,000,000
Operatingcost[Includingmarinecrew]
5,475,000 5,748,750 6,036,188 6,337,997 6,654,897
GrossProfit 15,525,000 15,251,250 14,963,813 14,662,003 14,345,103GeneralandAdminExpenses
RentalofPremises 60,000 63,000 66,150 69,458 72,930
Salaries,allowances&bonuses[Onshoreteam]
900,000 945,000 992,250 1,041,863 1,093,956
Sales&MarketingExpenses Travelling/businessmeeting
50,000 50,000 50,000 50,000 50,000
TenderFee 30,000 30,000 30,000 30,000 30,000Others 50000 50000 50000 50000 50000TotalS&M 130,000 130,000 130,000 130,000 130,000PBDIT 14,435,000 14,113,250 13,775,413 13,420,683 13,048,217PBIT 12,035,000 11,713,250 11,375,413 11,020,683 10,648,217Profit/LossBeforeTaxation 9,035,000 8,713,250 8,375,413 8,020,683 7,648,217
LessTaxation 0 0 0 0 0
Profit/LossAfterTaxation 9,035,000 8,713,250 8,375,413 8,020,683 7,648,217
NetProfit[USD] 9,035,000 8,713,250 8,375,413 8,020,683 7,648,217TABLE4PROFIT&LOSSSTATEMENT

PageNo.56
BREAKEVENANALYSIS
Contribution=SellingPrice[Dayrate]–VariableCost=70000‐15000
BreakEvenPointofcharter=FC/Contribution
BreakEvenPoint=6565000/55000
=120Charterdays
THEWAYFORWARD
Fromthepastfewyearswehavebeenfacingchallengetofindasuitablevesseltobidandwintheoffshoreprojects.Ontopofthegainfromthecharterrevenuethemajorpotentialgainwouldbe theprofit fromtheoverallproject.Theproject shallbe takenas the lumpsum for a said duration and with the effective project management the days saved inschedulewouldaddthemajorprofitmargin.
Thereispotentiallongtermcharteravailablewithmajoroil&gasoperatorsin
Abudhabi,theprojectcalled“conductorpiperepair”forover100wellheadplatformsand“Boat landing replacement” for over 100 platforms. Since Technomak had successfullycarriedouttheConductorrepairoffivewellheadtowersasapilotproject,thatwouldhelpuswinningthecontract.
The responsibility assignment matrix below shows the participation of the variousdepartmentheadincompletingtheprojects.ItclarifiestherolesandtheresponsibilitiesofthemanagementinthedecisiontoownaJackUp.ThefourfactorsinRACIcharthavebeenincorporatedbetweenthehighermanagementstomakethisprojectasuccess.

PageNo.57
Engineering Manager
BD M
anager
Finance M
anager
Estimation Team
Site M
anager
HR M
anager
Board of Directors
3 rd party consultants
Operations Manager
Finalizing the specification of the Jack up R C C
Find out availability of the suitable Jack up for sale C R A
Assess the manufacturing cost of the Jack up in house C R I C
Assess the market value of available jack up C A R I
Cost comparison C R A C
Prepare the Yard and office space I R I A
Fund allocation R R
Human resource R I C
Responsible for completing that step in the process
Accountable for ensuring that step is completed
Consulted prior to the completion of that step
Informed of the results once the step is completed FIGURE23RACICHART
TIMEFRAMEFORPROJECTEXECUTION
Thetimeframeforthecompletefirstphaseofprojectexecutionwilltake15weeks.IfthedecisiontogoaheadwithbuiltanewJackup,themanufacturingdurationofoneyearshallbe considered additionally. The estimated time requirement for the project will be asfollows:
Task Start Date Duration [Weeks]
Finalizing the specification of the Jack up 15‐Jul‐15 2
Find out availability of the suitable Jack up for sale 30‐Jul‐15 6
Assess the manufacturing cost of the Jack up in house 30‐Jul‐15 4
Assess the market value of available jack up 1‐Sep‐15 3
Cost comparison 1‐Oct‐15 2
Prepare the Yard and office space 16‐Dec‐15 4
Human resource 16‐Dec‐15 4 TABLE5PROJECTTIMEFRAME

PageNo.58
FIGURE24GANTTCHART
As per the above Gantt chart, the period for the Planning to the implementation of theprojectis15weeks.ThemanufacturingofthenewJackupshouldstartfromJanuary2016,ifthemanagementdecisiontobuiltanewvessel.IfsuitableJackUpavailableinthemarketfor sale and management decides to go ahead with ready made one, the process ofacquisitionshallbeneedtobestartedformJan2016
Hencethisprojectwillenabletheorganizationtobemorecompetentinoffshoreindustryin terms competency. This will help to maintain the brand image of Technomak as ancompleteEPICcontractor.
CONCLUSION
1) DemandofJack‐upbargesinthisregionisveryhigh.
2) Thereislimitationinoperatingconventionalmooringbargesnearplatforms,henceconventionalmooringbargesarenotneededtoconsider
3) Thepotentialtobidandwintheprojectishighifweownasuitablevessel
4) ThereishardlyanyweatherdowntimeforJackUp.Itcanworkinsevereconditions
5) SinceTechnomakcarriedoutpilotprojectsofmajorrepairworksinAbudhabiOilfield,thepotentialtowinthelongtermchartercontractisveryhigh.

PageNo.59
BIBLIOGRAPHY
ArabianOilandGas.com. (2014, April 26). ArabianOilandGas. Retrieved April 26, 2014, from
ArabianOilandGas: http://www.arabianoilandgas.com/
Gas, A. O. (2014, April 27). UAE's Oil & Gas Sector. Retrieved April 27, 2014, from Arab Oil & Gas:
http://www.ogsonline.com/uae‐oil‐gas‐sector.php
Lukoil. (n.d.). www.lukoil.com. Retrieved from
http://www.lukoil.com/materials/doc/documents/Global_trends_to_2025.pdf
MAERSK OIL. (2011). Marine Control Procedures. Qatar: MAERSK OIL.
Nagraj, A. (2014, March 1). 30 Seconds On The Business Of…Middle East’s Oil and Gas Industry. Retrieved
April 27, 2014, from Gulf Bussiness: http://gulfbusiness.com/2014/03/30‐seconds‐business‐middle‐
easts‐oil‐gas‐industry/
OPCO. (31.12.2004). OPCO ACCEPTANCE STANDARD FOR MARINE VESSEL. MArine Operations.
Abudhabi: OPCO.
TECHNOLOGY, O. &. (2014, March‐May 90). Petroleum & Offshore. Retrieved March‐May 26‐04.14,
2014, from OIL & GAS TECHNOLOGY: http://www.oilandgastechnology.net/current‐issue?loginmsg=true
ZADCO. (2014, April 28). About ZADCO. Retrieved April 28, 2014, from ZADCO Projects:
http://zadco.ae/en/aboutus/Pages/AboutUs.aspx

PageNo.60
APPENDIX
Interviewer:Myself
Interviewee:Mr.MukeshNair–OperationManager,MubarakMarine
Mr.Ron‐Director‐LivingstoneLiftboats
Mr.JeffJackson‐OperationsManager,AquaJack
BasedonIDI(In‐DepthInterview),belowmentionedisthefinding.
MukeshNair –OperationsManagerMubarakMarine
Accomodationworkbarge
Ron‐OperationsManager‐Livingstone
LiftBoats
JeffJackson‐OperationManager
AquaJack‐Jack‐upBarges
MarketDemand
Whatistheaveragecharterinayear
Whatisaveragedayrates
WhatistheInitialinvestment
AverageOperatingCost
AverageMaintenancecost
200–250
30000
25milUSD
7500USD
1milUSD
250‐300
75000
60‐75milUSD
20000USD
2‐3milUSD
250‐300
50000
45‐55milUSD
15000USD
1.5‐2milUSD
MARINE REGULATIONS
Vishak Gopi
Text Box
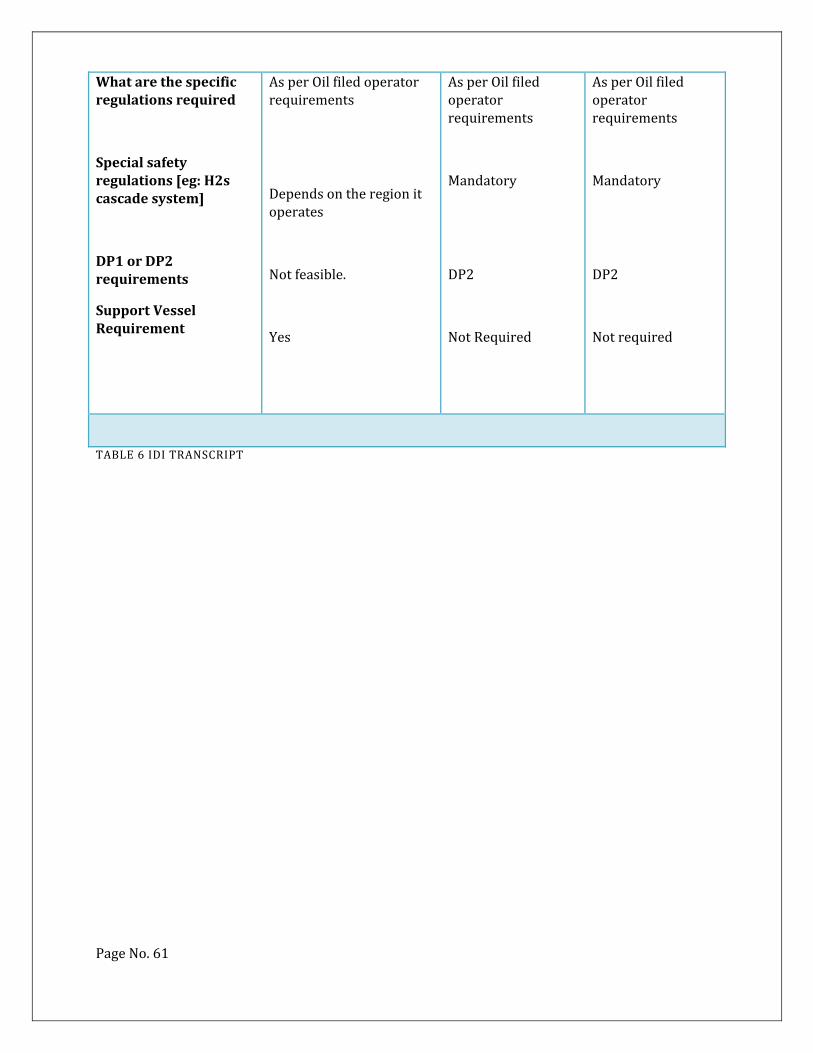
PageNo.61
Whatarethespecificregulationsrequired
Specialsafetyregulations[eg:H2scascadesystem]
DP1orDP2requirements
SupportVesselRequirement
AsperOilfiledoperatorrequirements
Dependsontheregionitoperates
Notfeasible.
Yes
AsperOilfiledoperatorrequirements
Mandatory
DP2
NotRequired
AsperOilfiledoperatorrequirements
Mandatory
DP2
Notrequired
TABLE6IDITRANSCRIPT