Viscosity jump in Earths mid-mantle
5
penetration. More generally, chemical reactions at a metal surface are nearly always modeled within the adiabatic Born-Oppenheimer approx- imation; see, for example, (30). Our work sug- gests that theories of surface chemistry capable of describing electron excitation may be crucial to understanding atomic-scale motion occurring in surface reactions, especially if H-atom transla- tion is involved. REFERENCES AND NOTES 1. I. Langmuir, J. Am. Chem. Soc. 34, 1310–1325 (1912). 2. M. P. Andersson et al., J. Catal. 255,6–19 (2008). 3. D. Hollenbach, E. E. Salpeter, Astrophys. J. 163, 155 (1971). 4. G. S. Higashi, Y. J. Chabal, G. W. Trucks, K. Raghavachari, Appl. Phys. Lett. 56, 656–658 (1990). 5. S. M. Lee et al., Synth. Met. 113, 209–216 (2000). 6. D. Haberer et al., Nano Lett. 10, 3360–3366 (2010). 7. J. K. Norskov, B. I. Lundqvist, Surf. Sci. 89, 251–261 (1979). 8. M. Born, R. Oppenheimer, Annalen Der Physik 84, 457–484 (1927). 9. C. L. A. Lamont, B. N. J. Persson, G. P. Williams, Chem. Phys. Lett. 243, 429–434 (1995). 10. H. Nienhaus et al., Phys. Rev. Lett. 82, 446–449 (1999). 11. B. Gergen, H. Nienhaus, W. H. Weinberg, E. W. McFarland, Science 294, 2521–2523 (2001). 12. D. M. Bird, M. S. Mizielinski, M. Lindenblatt, E. Pehlke, Surf. Sci. 602, 1212–1216 (2008). 13. A. Amirav, M.J. Cardillo, Phys. Rev. Lett. 57, 2299 (1986). 14. Y. Huang, C. T. Rettner, D. J. Auerbach, A. M. Wodtke, Science 290, 111–114 (2000). 15. K. Golibrzuch, N. Bartels, D. J. Auerbach, A. M. Wodtke, Annu. Rev. Phys. Chem. 66, 399–425 (2015). 16. N. Shenvi, S. Roy, J. C. Tully, Science 326, 829–832 (2009). 17. R. Cooper et al., Angew. Chem. Int. Ed. 51, 4954–4958 (2012). 18. M. Pavanello et al., Journal of Physical Chemistry Letters 4, 3735–3740 (2013). 19. G. J. Kroes, M. Pavanello, M. Blanco-Rey, M. Alducin, D. J. Auerbach, J. Chem. Phys. 141, 054705 (2014). 20. S. M. Janke, D. J. Auerbach, A. M. Wodtke, A. Kandratsenka, J. Chem. Phys. 143, 124708 (2015). 21. H. U. Finzel et al., Surf. Sci. 49, 577–605 (1975). 22. G. Caracciolo, S. Iannotta, G. Scoles, U. Valbusa, J. Chem. Phys. 72, 4491–4499 (1980). 23. T. H. Johnson, Phys. Rev. 37, 847–861 (1931). 24. K. Haberrecker et al., Nucl. Instrum. Methods 57, 22–28 (1967). 25. L. Schnieder et al., Faraday Discuss. 91, 259–269 (1991). 26. T. Kinugawa, T. Arikawa, Jpn. J. Appl. Phys. 2 (Part 2, No. 4A), L550–L552 (1993). 27. L. Schnieder, W. Meier, K. H. Welge, M. N. R. Ashfold, C. M. Western, J. Chem. Phys. 92, 7027–7037 (1990). 28. Y. Li, G. Wahnström, Phys. Rev. B 46, 14528–14542 (1992). 29. J. Strömquist, L. Bengtsson, M. Persson, B. Hammer, Surf. Sci. 397, 382–394 (1998). 30. A. Hellman et al., J. Phys. Chem. B 110, 17719–17735 (2006). ACKNOWLEDGMENTS We thank X. Yang and C. Xiao for helping to set up Rydberg Atom Tagging, R. Bürsing for helping to design the experimental apparatus, and G.-J. Kroes for assisting in the development of the theory. A.M.W. and D.J.A. gratefully acknowledge support from the Humboldt Foundation. We acknowledge support from the Sonderforschungsbereich 1073 under project A04; from the Deutsche Forschungsgemeinschaft (DFG) and the Agence Nationale de la Recherché (ANR) under grant no. WO 1541/1-1; and from the DFG, the Ministerium für Wissenschaft und Kultur (MWK) Niedersachsen, and the Volkswagenstiftung under grant no. INST 186/902-1. 21 September 2015; accepted 30 October 2015 Published online 26 November 2015 10.1126/science.aad4972 GEOPHYSICS Viscosity jump in Earth ’ s mid-mantle Maxwell L. Rudolph, 1 * Vedran Lekić, 2 Carolina Lithgow-Bertelloni 3 The viscosity structure of Earth’ s deep mantle affects the thermal evolution of Earth, the ascent of mantle plumes, settling of subducted oceanic lithosphere, and the mixing of compositional heterogeneities in the mantle. Based on a reanalysis of the long-wavelength nonhydrostatic geoid, we infer viscous layering of the mantle using a method that allows us to avoid a priori assumptions about its variation with depth. We detect an increase in viscosity at 800- to 1200-kilometers depth, far greater than the depth of the mineral phase transformations that define the mantle transition zone.The viscosity increase is coincident in depth with regions where seismic tomography has imaged slab stagnation, plume deflection, and changes in large-scale structure and offers a simple explanation of these phenomena. T he viscosity of Earth’s mantle controls the rate and pattern of mantle convection and, through it, the dynamics of our planet’s deep interior, including degassing of and heat transport from the interior, mixing of compositional heterogeneity, plume ascent and passive upwelling, and slab descent. The long- wavelength nonhydrostatic geoid is a key geo- physical constraint on Earth’s internal viscosity structure. At the largest spatial scales (spherical harmonic degrees 2 to 7), the geoid is most sen- sitive to density structure and viscosity contrasts in the lower mantle. At smaller scales, the geoid becomes increasingly sensitive to upper mantle structure, which is primarily associated with sub- ducting slabs. Because lateral viscosity variations have minor effects on the geoid at large spatial scales (1, 2)—though they may become more im- portant at shorter length scales (3)—it is pos- sible to infer deep mantle viscous layering from geoid observations. However, most studies of Earth’s mantle viscosity structure impose layer interfaces to be coincident with seismic velocity discontinuities. Thus, these studies may not re- solve viscous layering whose origin is distinct from that of pressure-induced phase changes (e.g., at 410- and 660-km depth), or may miss phase transitions not clearly associated with seis- mic discontinuities. We use the long-wavelength nonhydrostatic geoid to infer the mantle radial viscosity struc- ture in a manner distinct from that of previous attempts in three key ways. First, we employ a transdimensional, hierarchical, Bayesian inver- sion procedure (4) that does not specify at the outset the number or location of interfaces in our layered viscosity structure. The Bayesian approach is very attractive for this inverse problem because it yields a posterior probability distribution that can be analyzed to quantify uncertainties of and trade-offs between model parameters (e.g., layer depth and viscosity contrast). Second, we explore various choices for the conversion between seis- mic velocity anomalies and density anomalies, including depth-dependent conversion factors based on thermodynamic principles, calculated using HeFESTo (5). Finally, we use a recent whole- mantle tomographic model, SEMUCB-WM1 (6), developed with waveform tomography using high- ly accurate wave propagation computations, to infer mantle density structure and a modern geoid model based on 10 years of GRACE satellite ob- servations, combined with revised estimates of the hydrostatic flattening of Earth (7, 8). A posterior probability density function for the radial profile of viscosity is shown in Fig. 1, where the mean (taken in log-space) viscosity at each depth is shown as a purple curve. In this par- ticular inversion, we find evidence for relatively uniform viscosity throughout the upper mantle and transition zone. Below the mantle transition zone, there is a region of lower viscosity and an increase in viscosity between 670- and 1000-km depth. The preferred depth of this viscosity in- crease can be inferred from Fig. 1B and is cen- tered about 1000 km. We carried out multiple inversions to explore the effects of (i) our treatment of data and model uncertainty, (ii) the degree of truncation of the spherical harmonic expansion of the geoid used to constrain our models, and (iii) the density scaling R r;S ¼ d ln r=d ln V S (Fig. 1). We consider features of the viscosity profiles to be robust if they are common among the separate inversions. We find that all solutions place the depth of viscosity in- crease considerably below 670-km depth, most often near 1000-km depth. This result appears to be independent of assumptions made, including maximum spherical harmonic degree l max , choice of depth-dependent or constant R r;S , or treat- ment of data and model covariance (7). Other features of the solutions are sensitive to these choices and, therefore, their robustness is pro- portional to the likelihood of the assumptions from which they result. Inversions with l max ¼ 7 (dashed curves in Fig. 2) generally have a more pronounced peak in viscosity in the mid-mantle, underlain by a weaker region between 1500- and 2500-km depth and an increase in viscosity in SCIENCE sciencemag.org 11 DECEMBER 2015 • VOL 350 ISSUE 6266 1349 1 Department of Geology, Portland State University, Post Office Box 751, Portland, OR 97207, USA. 2 Department of Geology, University of Maryland, College Park, MD 20742, USA. 3 Department of Earth Sciences, University College London, London WC1E 6BT, UK. *Corresponding author. E-mail: [email protected] RESEARCH | REPORTS on December 10, 2015 www.sciencemag.org Downloaded from on December 10, 2015 www.sciencemag.org Downloaded from on December 10, 2015 www.sciencemag.org Downloaded from on December 10, 2015 www.sciencemag.org Downloaded from
Transcript of Viscosity jump in Earths mid-mantle
penetration. More generally, chemical reactionsat a metal surface are nearly always modeledwithin the adiabatic Born-Oppenheimer approx-imation; see, for example, (30). Our work sug-gests that theories of surface chemistry capableof describing electron excitation may be crucialto understanding atomic-scale motion occurringin surface reactions, especially if H-atom transla-tion is involved.
REFERENCES AND NOTES
1. I. Langmuir, J. Am. Chem. Soc. 34, 1310–1325 (1912).2. M. P. Andersson et al., J. Catal. 255, 6–19 (2008).3. D. Hollenbach, E. E. Salpeter, Astrophys. J. 163, 155
(1971).4. G. S. Higashi, Y. J. Chabal, G. W. Trucks, K. Raghavachari,
Appl. Phys. Lett. 56, 656–658 (1990).5. S. M. Lee et al., Synth. Met. 113, 209–216 (2000).6. D. Haberer et al., Nano Lett. 10, 3360–3366 (2010).7. J. K. Norskov, B. I. Lundqvist, Surf. Sci. 89, 251–261
(1979).8. M. Born, R. Oppenheimer, Annalen Der Physik 84, 457–484
(1927).9. C. L. A. Lamont, B. N. J. Persson, G. P. Williams, Chem. Phys.
Lett. 243, 429–434 (1995).10. H. Nienhaus et al., Phys. Rev. Lett. 82, 446–449
(1999).11. B. Gergen, H. Nienhaus, W. H. Weinberg, E. W. McFarland,
Science 294, 2521–2523 (2001).12. D. M. Bird, M. S. Mizielinski, M. Lindenblatt, E. Pehlke,
Surf. Sci. 602, 1212–1216 (2008).13. A. Amirav, M.J. Cardillo, Phys. Rev. Lett. 57, 2299
(1986).14. Y. Huang, C. T. Rettner, D. J. Auerbach, A. M. Wodtke,
Science 290, 111–114 (2000).15. K. Golibrzuch, N. Bartels, D. J. Auerbach, A. M. Wodtke,
Annu. Rev. Phys. Chem. 66, 399–425 (2015).16. N. Shenvi, S. Roy, J. C. Tully, Science 326, 829–832
(2009).17. R. Cooper et al., Angew. Chem. Int. Ed. 51, 4954–4958
(2012).18. M. Pavanello et al., Journal of Physical Chemistry Letters 4,
3735–3740 (2013).19. G. J. Kroes, M. Pavanello, M. Blanco-Rey, M. Alducin,
D. J. Auerbach, J. Chem. Phys. 141, 054705 (2014).20. S. M. Janke, D. J. Auerbach, A. M. Wodtke, A. Kandratsenka,
J. Chem. Phys. 143, 124708 (2015).21. H. U. Finzel et al., Surf. Sci. 49, 577–605 (1975).22. G. Caracciolo, S. Iannotta, G. Scoles, U. Valbusa, J. Chem.
Phys. 72, 4491–4499 (1980).23. T. H. Johnson, Phys. Rev. 37, 847–861 (1931).24. K. Haberrecker et al., Nucl. Instrum. Methods 57, 22–28
(1967).25. L. Schnieder et al., Faraday Discuss. 91, 259–269
(1991).26. T. Kinugawa, T. Arikawa, Jpn. J. Appl. Phys. 2 (Part 2, No. 4A),
L550–L552 (1993).27. L. Schnieder, W. Meier, K. H. Welge, M. N. R. Ashfold,
C. M. Western, J. Chem. Phys. 92, 7027–7037 (1990).28. Y. Li, G. Wahnström, Phys. Rev. B 46, 14528–14542
(1992).29. J. Strömquist, L. Bengtsson, M. Persson, B. Hammer,
Surf. Sci. 397, 382–394 (1998).30. A. Hellman et al., J. Phys. Chem. B 110, 17719–17735 (2006).
ACKNOWLEDGMENTS
We thank X. Yang and C. Xiao for helping to set up RydbergAtom Tagging, R. Bürsing for helping to design the experimentalapparatus, and G.-J. Kroes for assisting in the development ofthe theory. A.M.W. and D.J.A. gratefully acknowledge supportfrom the Humboldt Foundation. We acknowledge support from theSonderforschungsbereich 1073 under project A04; from theDeutsche Forschungsgemeinschaft (DFG) and the AgenceNationale de la Recherché (ANR) under grant no. WO 1541/1-1;and from the DFG, the Ministerium für Wissenschaft und Kultur(MWK) Niedersachsen, and the Volkswagenstiftung under grantno. INST 186/902-1.
21 September 2015; accepted 30 October 2015Published online 26 November 201510.1126/science.aad4972
GEOPHYSICS
Viscosity jump in Earth’s mid-mantleMaxwell L. Rudolph,1* Vedran Lekić,2 Carolina Lithgow-Bertelloni3
The viscosity structure of Earth’s deep mantle affects the thermal evolution of Earth, theascent of mantle plumes, settling of subducted oceanic lithosphere, and the mixing ofcompositional heterogeneities in the mantle. Based on a reanalysis of the long-wavelengthnonhydrostatic geoid, we infer viscous layering of the mantle using a method that allows usto avoid a priori assumptions about its variation with depth. We detect an increase inviscosity at 800- to 1200-kilometers depth, far greater than the depth of the mineral phasetransformations that define the mantle transition zone.The viscosity increase is coincidentin depth with regions where seismic tomography has imaged slab stagnation, plumedeflection, and changes in large-scale structure and offers a simple explanation ofthese phenomena.
The viscosity of Earth’s mantle controls therate and pattern of mantle convection and,through it, the dynamics of our planet’sdeep interior, including degassing of andheat transport from the interior, mixing
of compositional heterogeneity, plume ascent andpassive upwelling, and slab descent. The long-wavelength nonhydrostatic geoid is a key geo-physical constraint on Earth’s internal viscositystructure. At the largest spatial scales (sphericalharmonic degrees 2 to 7), the geoid is most sen-sitive to density structure and viscosity contrastsin the lower mantle. At smaller scales, the geoidbecomes increasingly sensitive to upper mantlestructure, which is primarily associated with sub-ducting slabs. Because lateral viscosity variationshave minor effects on the geoid at large spatialscales (1, 2)—though they may become more im-portant at shorter length scales (3)—it is pos-sible to infer deep mantle viscous layering fromgeoid observations. However, most studies ofEarth’s mantle viscosity structure impose layerinterfaces to be coincident with seismic velocitydiscontinuities. Thus, these studies may not re-solve viscous layering whose origin is distinctfrom that of pressure-induced phase changes(e.g., at 410- and 660-km depth), or may missphase transitions not clearly associated with seis-mic discontinuities.We use the long-wavelength nonhydrostatic
geoid to infer the mantle radial viscosity struc-ture in a manner distinct from that of previousattempts in three key ways. First, we employ atransdimensional, hierarchical, Bayesian inver-sion procedure (4) that does not specify at theoutset the number or location of interfaces in ourlayered viscosity structure. The Bayesian approachis very attractive for this inverse problembecauseit yields a posterior probability distribution thatcan be analyzed to quantify uncertainties of andtrade-offs between model parameters (e.g., layer
depth and viscosity contrast). Second, we explorevarious choices for the conversion between seis-mic velocity anomalies and density anomalies,including depth-dependent conversion factorsbased on thermodynamic principles, calculatedusingHeFESTo (5). Finally, we use a recent whole-mantle tomographic model, SEMUCB-WM1 (6),developedwithwaveform tomography using high-ly accurate wave propagation computations, toinfermantle density structure and amodern geoidmodel based on 10 years of GRACE satellite ob-servations, combined with revised estimates ofthe hydrostatic flattening of Earth (7, 8).A posterior probability density function for the
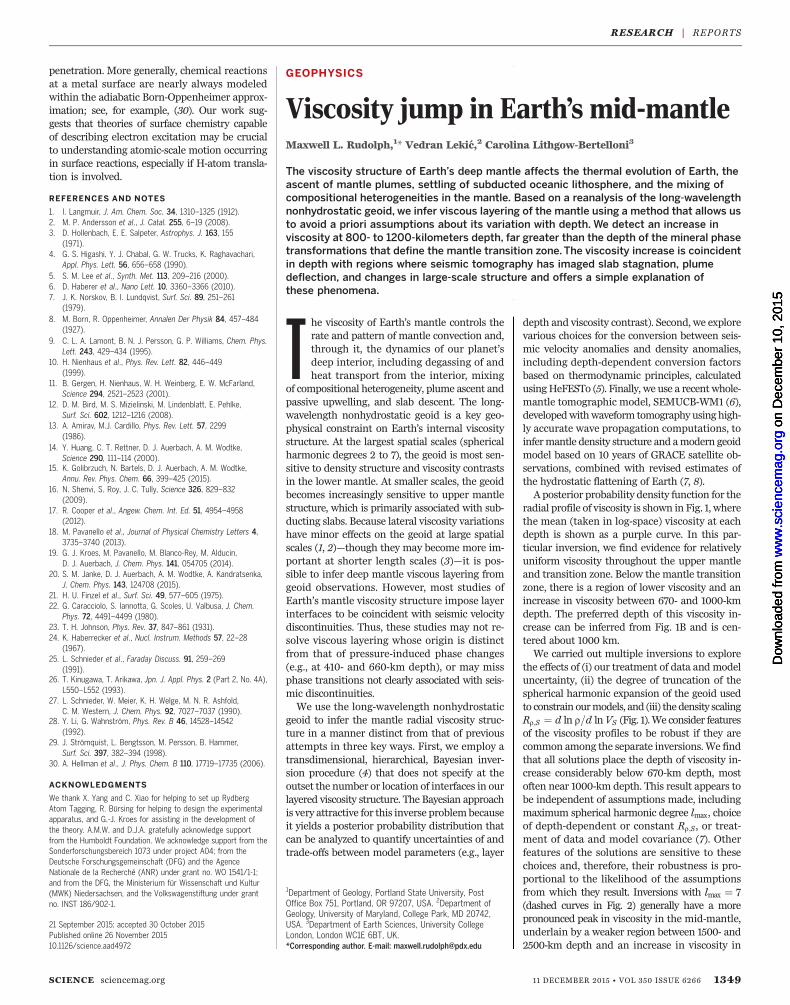
radial profile of viscosity is shown in Fig. 1, wherethe mean (taken in log-space) viscosity at eachdepth is shown as a purple curve. In this par-ticular inversion, we find evidence for relativelyuniform viscosity throughout the upper mantleand transition zone. Below the mantle transitionzone, there is a region of lower viscosity and anincrease in viscosity between 670- and 1000-kmdepth. The preferred depth of this viscosity in-crease can be inferred from Fig. 1B and is cen-tered about 1000 km.We carried out multiple inversions to explore
the effects of (i) our treatment of data and modeluncertainty, (ii) the degree of truncation of thespherical harmonic expansion of the geoid usedto constrain ourmodels, and (iii) thedensity scalingRr;S ¼ d ln r=d ln VS (Fig. 1).We consider featuresof the viscosity profiles to be robust if they arecommon among the separate inversions.We findthat all solutions place the depth of viscosity in-crease considerably below 670-km depth, mostoften near 1000-km depth. This result appears tobe independent of assumptions made, includingmaximum spherical harmonic degree lmax, choiceof depth-dependent or constant Rr;S , or treat-ment of data and model covariance (7). Otherfeatures of the solutions are sensitive to thesechoices and, therefore, their robustness is pro-portional to the likelihood of the assumptionsfrom which they result. Inversions with lmax ¼ 7(dashed curves in Fig. 2) generally have a morepronounced peak in viscosity in the mid-mantle,underlain by a weaker region between 1500- and2500-km depth and an increase in viscosity in
SCIENCE sciencemag.org 11 DECEMBER 2015 • VOL 350 ISSUE 6266 1349
1Department of Geology, Portland State University, PostOffice Box 751, Portland, OR 97207, USA. 2Department ofGeology, University of Maryland, College Park, MD 20742,USA. 3Department of Earth Sciences, University CollegeLondon, London WC1E 6BT, UK.*Corresponding author. E-mail: [email protected]
RESEARCH | REPORTS
on
Dec
embe
r 10
, 201
5w
ww
.sci
ence
mag
.org
Dow
nloa
ded
from
o
n D
ecem
ber
10, 2
015
ww
w.s
cien
cem
ag.o
rgD
ownl
oade
d fr
om
on
Dec
embe
r 10
, 201
5w
ww
.sci
ence
mag
.org
Dow
nloa
ded
from
o
n D
ecem
ber
10, 2
015
ww
w.s
cien
cem
ag.o
rgD
ownl
oade
d fr
om

the lowermost mantle. Several solutions, usingdepth-dependent Rr;S or Rr;S ¼ 0:4, feature alower-viscosity layer between 670- and 1000-kmdepth. Some solutions include a high-viscosity“hill” in themid-mantle between 1000- and 1500-kmdepth, separating upper and lower mantles oflower viscosity.Many early studies advocated for layeredman-
tle convection with an interface at or somewhatbelow 670-km depth, and in particular Wen andAnderson (9) noted that the amplitude and pat-tern of the long-wavelength geoid and surfacetopography could bewell reproduced usingman-tle flow models with an imposed barrier to flowabout 250 km deeper than the 670-km seismicdiscontinuity. However, tomographic images ofrelict Farallon and Tethys slabs in the lower man-tle suggest that the concept of layered mantleconvection is at best incomplete, and we empha-size that our mantle flow calculations do not im-pose layered convection.Our results favor viscosity structures in which
the overall increase in viscosity is a factor of 10 to150, in agreement with previous studies. All of ourresults favor the location (interface depth) of thisviscosity increase lying below 670-km depth, andmost models place this viscosity increase deeperstill, in the vicinity of 1000-km depth. This resultis particularly intriguing given the observation
that most actively subducting slabs stagnate be-low the 670-km seismic discontinuity, at depthsof 1000 km (10). For instance, both the GAP-P4model (11) and SEMUCB-WM1 reveal slabs stag-nating above the 670-kmdiscontinuity in theNorth-ern Honshu arc, but passing through the 670-kmdiscontinuity and stagnating above 1000-kmdepthalong the Tonga and Kermadec arcs. In at leastone region, Central America, the slab appears toenter the lower mantle without stagnation. Themechanism responsible for this slab stagnationis unclear, as there is no velocity discontinuity atthis depth in one-dimensional (1D) seismic mod-els (12), nor a known phase transition.Twomechanisms have been recently suggested
for slab stagnation in the mid-mantle. First,King et al. (13) have suggested that the pyroxenetomajoritic garnet phase transition in subductedslabs is kinetically hindered, and thus older, colder,slabs are more prone to stagnation. Marquardtand Miyagi (14), based on high-pressure defor-mation experiments of (Mg,Fe)O, argued that vis-cosity in the regions surrounding settling slabsin the shallow-most 900 km of the lower mantlemay be about two orders of magnitude higherthan previously expected, causing slabs to spreadlaterally and to settle very slowly through this re-gion. Our results indicate that there may be a vis-cosity increase in the mid-mantle, and many of
our inversions have viscosity contrasts at depthscomparable to those suggested (14). However, wenote that the observation of regional differencesin slab behavior, and in particular the speculationthat old, cold, slabs preferentially stagnate, cannotbe explained using our 1D viscosity structure orby a viscosity contrast that would occur in themantle surrounding all slabs, irrespective of age,without invoking additional mantle dynamic pro-cesses or subduction zone histories, such as theprevalence of trench rollback.Previous inversions for layered viscosity struc-
ture with prescribed layer interfaces depths re-vealed some indication of an increase in viscosityat or around 1000-km depth. In particular, KingandMasters (15) inverted for layered viscosity struc-ture constrained by the geoid using a uniformvelocity to density conversion factor, with veloc-ity anomalies inferred from S-wave tomographicmodels, and found evidence for a viscosity in-crease of ~20 at 670-km depth and a second in-crease of ~5 at 1022-km depth. Forte and Peltier(16) also found, using a combination of a slabdensity model and lower-mantle tomographicmodel, that the agreement between modeled andobserved geoid was better for a layered viscositystructurewith an interface at 1200-kmdepth thanat 670-km depth. Kido et al. (17) performed in-versions for layered mantle viscosity structure
1350 11 DECEMBER 2015 • VOL 350 ISSUE 6266 sciencemag.org SCIENCE
Relative Viscosity 10-310-210-1100 101 102 103
Dep
th (
km)
0
500
1000
1500
2000
2500
0 2 4 6 8
Viscosity Increase
0
500
1000
1500
2000
2500
0 100 200 300
0
500
1000
1500
2000
2500
N0 2000 4000 6000
Residual (m)50 100 150 200
Cou
nt
0
500
1000
1500
2000
2500
3000
3500
4000
4500
Number of Layers0 5 10
Cou
nt
0
500
1000
1500
2000
2500
3000
3500
4000
4500
5000
10-3 10-2 10-1 100 101 102 103
Fig. 1. Properties of ensemble solution.Viscosity inversion using depth-dependent Rr,S from HeFESTo, lmax = 3, and assumption of uncorrelated errorsyields radial viscosity profiles with a viscosity increase at 1000-km depth and a lower-viscosity channel between 670 and 1000 km. (A) A 2D histogramshowing the posterior likelihood of viscosity and depth values. Horizontal dotted lines indicate depths of 670 and 1000 km. (B) A 2D histogram showingthe posterior likelihood of layer interface depth and viscosity increase (>1 means viscosity increases with increasing depth). (C) Posterior likelihood ofhaving a layer interface at each depth. (D) Distribution of residuals of solutions in ensemble solution. (E) Distribution of number of layers in models in theensemble solution.
RESEARCH | REPORTS

(with prescribed layer depths) using a geneticalgorithm and found evidence for a decrease inviscosity at 670-km depth and subsequent in-crease in viscosity at 1000-kmdepth. Our study isdifferent in that we do not prescribe at the outsetthe number or locations of layer interfaces in ourlayered viscosity structure and as a result, we placethe largest viscosity contrast in the model some-what deeper than previous studies.Many studies from the 1980s and 1990s em-
ployed layered structures with layering identicalto that of the tomographic models then available(~11 layers), or layered structures with layers atthe major seismic discontinuities. Subsequentmodels have introduced additional layers [forinstance, 25 in (18)]. To justify such parameter-izations, either additional observational constraints,such as rates of glacial isostatic adjustment, platemotions, or patterns of seismic anisotropy, oradditional assumptions about the smoothnessof the mantle viscosity structure, are required.Paulson et al. (19, 20) used geoid and relative sea-level data as constraints on a Monte-Carlo inver-sion for mantle viscosity structure with one, two,and three layers. One of the central conclusionswas that the GRACE and relative sea-level datacannot be used to uniquely constrain a layeredmantle viscosity structure with more than twolayers. Two markedly different two-layer modelswerepermittedby these inversions (withprescribedinterface depth at 670 km), one having an uppermantle with viscosity around 5 × 10²⁰ Pa-s and alower mantle ~4.33 more viscous and the otherhaving an upper mantle viscosity about an orderof magnitude smaller and a viscosity contrast of~1500, similar to what was found by Ricard et al.(21). Our results generally support the suggestionthat the geoid alone cannot uniquely constrainthe viscosity of more than a handful of layers. In-deed, many individual models in the posteriorpopulation for each of our inversions do havemore than five layers (e.g., Fig. 1), but owing totrade-offs, the layer properties of these more com-plex structures cannot be uniquely constrained.The posterior distribution of solutions inherentlycaptures these trade-offs between model param-eters, and the precise viscosity structures of theseinversions are largely dependent on assumptionsin the inversion (7).A viscosity contrast at 1000-km depth has im-
portant implications for the dynamics of convec-tion in Earth’s mantle, including its thermal andchemical evolution. As ascending plumes en-counter abrupt changes in viscosity (in numeri-cal models), they can be laterally deflected andthinned. Similarly, downwellings in numerical simu-lations become elongated laterally and compressedvertically as they encounter viscosity increases.Deflection of upwellings is observed in some tomo-graphic models. For instance, recent tomographicimages obtained by full waveform tomographywith sophisticated forward-modeling approachesreveal apparent deflection at 1000-km depth ofthe seismically slow structures both regionallybeneath the Iceland hotspot (22) and globally (23).Indeed, examples of apparent deflected upwell-ings, such as the feature beneath the Macdonald
hotspot in the South Pacific (Fig. 3), are globallynot uncommon (23). In both studies (22, 23), theapparent radius of plumes also decreases fromthe lower to the upper mantle. The decrease inradius appears to be coincident with the deflec-tion at 1000-km depth. Upwelling structures innumerical simulations of mantle convection withan imposed increase in viscosity at 1000-kmdepthshow similar behavior (Fig. 3).Other studies use themantle radial correlation
function (24) to analyze tomographic models andto compare tomographic and geodynamic models(24, 25). Radial correlation functions calculatedfor SEMUCB-WM1, aswell as for the globalP-wavetomographic model GAP-P4 (10) for sphericalharmonic degrees 1 to 3 (Fig. 4, A and B), showa high degree of correlation throughout thelower mantle at depths greater than 1000 km
and a rapid decrease in correlation at 1000-kmdepth. Nearly identical behavior is also presentin the average of S-wave tomographic modelsSMEAN (25) (fig. S10). Other tomographic mod-els show a change in radial correlation aroundthis depth as well as a change in velocity hetero-geneity, particularly at spherical harmonic degree4 (25), and an independent test based on voxeltomography favors a vertical coherenceminimumaround 800-km depth, below the base of thetransition zone (26).Changes in the radial correlation functionmay
be related to changes in viscosity. Numerical simu-lations of convection in spherical shell geometryshow that endothermic phase changes (24) anddepth-dependent viscosity can both cause corre-sponding changes in the radial correlation. Wefind that a viscosity increase at 1000 km (Fig. 4C)
SCIENCE sciencemag.org 11 DECEMBER 2015 • VOL 350 ISSUE 6266 1351
Fig. 2. Results from mul-tiple inversions. Meanradial profiles of viscosityobtained in eight inver-sions varying Rr,S, lmax,and eliminating buoyancycontributions from thelowermost 1000 km of themantle (denoted by asuperscript “a”) all exhibitan increase in viscositybetween 670- and1000-km depth. Modelswith lmax = 7 are charac-terized by low viscosity inthe mid–lower mantle.
Relative Viscosity
10-2 100 102 104
Dep
th (
km)
0
500
1000
1500
2000
2500
3000
R=0.2, l=2-3R=0.2, l=2-7R=0.4, l=2-3R=0.4, l=2-7R=0.4a, l=2-3R=0.4a, l=2-7HeFESTo, l=2-3HeFESTo, l=2-7
Fig. 3. Observed andmodeled upwellings.(A) Shear velocityanomaly isocontoursdelineate deflecteddownwellings at1000-km depth(horizontal line) nearMcDonald hotspotin SEMUCB-WM1.(B) Dimensionlesstemperature (Tʹ)anomaly isocontours(and pseudocolor)
show similar deflection and thinning of upwellings in a numerical geodynamic model with a viscosityincrease at 1000-km depth. Cool and warm colors trace dimensionless temperature variations in (B) anddenote seismically fast or slow regions in (A).
Surface
CMB
1000 km
Surface
CMB
1000 km
2
1
0
-1
-2
dln
VS (
%)
0.06
0.03
0
-0.03
-0.06
RESEARCH | REPORTS

yields a radial correlation structure much moresimilar to that found in tomographic models(Fig. 4,AandB) than does a viscosity increase at670 km (Fig. 4D). The rapid change in radial cor-relation at 1000-km depth in tomographic mod-els thus suggests a contrast in viscosity, becauseno change in phase is known to occur at this depth.We emphasize that these models include simpli-fied representations of mantle viscosity structure(fig. S7) and that a more gradual increase in vis-cosity may also be compatible with the observa-tions. Other, more complex viscosity structurescan also alter the behavior of upwellings and down-wellings and consequently change the radial cor-relation structure. Convection simulations runwitha “second asthenosphere,” a weak zone extend-ing from 670- to 1000-km depth as suggestedin some of our inversions (Fig. 1) as well as in in-versions by Kido et al. (17), show a greater ten-dency toward layered convection (27), whichpromotes decorrelation.The viscosity contrast at a 1000-km depth pro-
vides a physical mechanism for the observationthat slabs and plumes stagnate or becomedeflecteddeeper than the transition zone in the absence ofa pervasive compositional barrier or another en-dothermic phase change. It may also reconcileobservations of changes in seismic structure (28)that led to a proposed hot abyssal layer (29),though this was originally placed at greater depths.Given the present state of understanding inmineral physics, no unique mechanism can beidentified for this increase in viscosity, and ourobservation should motivate further experimen-tal and computational studies. First principles cal-culations have indicated a continuous thoughgentle increase in the viscosity of bridgmanite dueto greater vacancy diffusion starting at around40 GPa (~1000 km) and continuing until thepostperovskite phase transition (30). The increasein the strength of ferropericlase observed byMarquardt and Miyagi (14) is the first positiveexperimental evidence for a possible change inrheology at these depths. Whether this effect,which is localized in high–strain-rate regions(surrounding slabs), should be expected to con-tribute to the viscosity inferred on the basis of thevery-long-wavelength components of the geoid,
remains to be determined. The spin transition inferropericlase occurs at much greater depths, andfirst-principles simulations suggest that the higher-pressure phase (low spin) should have increaseddiffusion and lower viscosity (31), with a viscosityminimum near 1500-km depth (32).Two possible intriguing (though speculative)
solutions remain. Changes in the relative abun-dance of ferric versus ferrous iron due to dis-prortionation (33) at these depths or graduallyover a depth range might change the bondingstrength in bridgmanite enough to markedlystrengthen it. Perhaps of greater interest and ofmore pervasive dynamical consequencemight bethe gradual drying of the bridgmanite perovskiteas the solubility of water in the structure decreaseswith pressure (34), becoming more viscous at1000-km depth.
REFERENCES AND NOTES
1. S. Zhong, J. Geophys. Res. 106, 703 (2001).2. R. Moucha, A. M. Forte, J. X. Mitrovica, A. Daradich, Geophys. J.
R. Astron. Soc. 169, 113–135 (2007).3. A. Ghosh, T. W. Becker, S. J. Zhong, Geophys. Res. Lett. 37,
01301 (2010).4. M. Sambridge, T. Bodin, K. Gallagher, H. Tkalcic,
Philos. Trans. A Math. Phys. Eng. Sci. 371, 20110547(2013).
5. L. Stixrude, C. Lithgow-Bertelloni, Earth Planet. Sci. Lett. 263,45–55 (2007).
6. S. W. French, B. A. Romanowicz, Geophys. J. Int. 199,1303–1327 (2014).
7. Methods can be found in the supplementary materials onScience Online.
8. F. Chambat, Y. Ricard, B. Valette, Geophys. J. Int. 183,727–732 (2010).
9. L. Wen, D. L. Anderson, Earth Planet. Sci. Lett. 146, 367(1997).
10. Y. Fukao, M. Obayashi, J. Geophys. Res. B 118, 5920–5938(2013). 10.1002/2013JB010466
11. M. Obayashi et al., Geophys. Res. Lett. 40, 5652–5657(2013).
12. A. M. Dziewonski, D. L. Anderson, Phys. Earth Planet. Inter. 25,297–356 (1981).
13. S. D. King, D. J. Frost, D. C. Rubie, Geology 43, 231–234(2015).
14. H. Marquardt, L. Miyagi, Nat. Geosci. 8, 311–314(2015).
15. S. D. King, G. Masters, Geophys. Res. Lett. 19, 1551–1554(1992).
16. A. M. Forte, R. Peltier, J. Geophys. Res. 96, 20131(1991).
17. M. Kido, D. A. Yuen, O. Čadek, T. Nakakuki, Phys. Earth Planet.Inter. 107, 307–326 (1998).
18. J. X. Mitrovica, A. M. Forte, Earth Planet. Sci. Lett. 225,177–189 (2004).
19. A. Paulson, S. Zhong, J. Wahr, Geophys. J. Int. 168,1195–1209 (2007).
20. A. Paulson, S. Zhong, J. Wahr, Geophys. J. Int. 171,497–508 (2007).
21. Y. Ricard, C. Vigny, C. Froidevaux, J. Geophys. Res. 94(B10), 13739 (1989).
22. F. Rickers, A. Fichtner, J. Trampert, Earth Planet. Sci. Lett.367, 39 (2013).
23. S. W. French, B. Romanowicz, Nature 525, 95–99(2015).
24. T. H. Jordan, P. Puster, G. A. Glatzmaier, P. J. Tackley,Science 261, 1427–1431 (1993).
25. T. W. Becker, L. Boschi, Geochem. Geophys. Geosyst. 3,1003 (2002).
26. L. Boschi, T. W. Becker, Geophys. Res. Lett. 38, L20306(2011).
27. L. Cserepes, D. Yuen, Geophys. Res. Lett. 24, 181–184(1997).
28. H. Kárason, R. D. van der Hilst, Science 283, 1885–1888(1999).
29. L. H. Kellogg, B. H. Hager, R. D. van der Hilst,R. D. van der Hilst, Science 283, 1881–1884 (1999).
30. M. W. Ammann, J. P. Brodholt, J. Wookey, D. P. Dobson,Nature 465, 462–465 (2010).
31. M. W. Ammann, J. P. Brodholt, D. P. Dobson, Earth Planet.Sci. Lett. 302, 393–402 (2011).
32. R. M. Wentzcovitch et al., Proc. Natl. Acad. Sci. U.S.A. 106,8447–8452 (2009).
33. D. J. Frost et al., Nature 428, 409–412 (2004).34. N. Bolfan-Casanova, H. Keppler, D. C. Rubie, Geophys. Res. Lett.
30, 1905 (2003).
ACKNOWLEDGMENTS
We thank T. Becker and C. O’Neill for developing and releasingthe source code to HC and the Computational Infrastructure forGeodynamics (geodynamics.org) for distributing software,Y. Ricard for enlightening discussion, and three anonymousreviewers. This project was initiated at the 2014 CIDER workshopat the Kavli Institute for Theoretical Physics, University ofCalifornia, Santa Barbara. This work was supported by NSFgrant EAR/1135452 and Natural Environment Research CouncilNE/K006061/1, as well as a Packard Science and EngineeringFellowship to V.L. All data are available in the manuscript andsupplementary materials. The GRACE gravity model GGM05S canbe obtained at: ftp://ftp.csr.utexas.edu/pub/grace.
SUPPLEMENTARY MATERIALS
www.sciencemag.org/content/350/6266/1349/suppl/DC1Materials and MethodsFigs. S1 to S10Table S1References (35–56)
6 August 2015; accepted 30 October 201510.1126/science.aad1929
1352 11 DECEMBER 2015 • VOL 350 ISSUE 6266 sciencemag.org SCIENCE
-1
-0.8
-0.6
-0.4
-0.2
0
0.2
0.4
0.6
0.8
1
0 500 1000 1500 2000 2500Depth (km)
0
500
1000
1500
2000
2500
0 500 1000 1500 2000 2500Depth (km)
0
500
1000
1500
2000
2500
0 500 1000 1500 2000 2500Depth (km)
Dep
th (
km)
0
500
1000
1500
2000
2500
0 500 1000 1500 2000 2500Depth (km)
0
500
1000
1500
2000
2500
Fig. 4. Radial correlation functions of tomographic and geodynamic models. (A) Radial correlation functions for spherical harmonic degrees 1 to 3 fromSEMUCB-WM1 and (B) GAP-P4 show an abrupt decorrelation of structure across 1000-km depth. Very similar radial correlation functions are seen in thetemperature field from numerical mantle convection simulations with imposed plate motions, including a viscosity contrast at 1000-km depth (C), but notwhen the viscosity contrast is smaller and shallower, at 670-km depth (D).
RESEARCH | REPORTS

DOI: 10.1126/science.aad1929, 1349 (2015);350 Science
et al.Maxwell L. RudolphViscosity jump in Earth's mid-mantle
This copy is for your personal, non-commercial use only.
clicking here.colleagues, clients, or customers by , you can order high-quality copies for yourIf you wish to distribute this article to others
here.following the guidelines
can be obtained byPermission to republish or repurpose articles or portions of articles
): December 10, 2015 www.sciencemag.org (this information is current as of
The following resources related to this article are available online at
http://www.sciencemag.org/content/350/6266/1349.full.htmlversion of this article at:
including high-resolution figures, can be found in the onlineUpdated information and services,
http://www.sciencemag.org/content/suppl/2015/12/09/350.6266.1349.DC1.html can be found at: Supporting Online Material
http://www.sciencemag.org/content/350/6266/1349.full.html#ref-list-1, 15 of which can be accessed free:cites 54 articlesThis article
http://www.sciencemag.org/cgi/collection/geochem_physGeochemistry, Geophysics
subject collections:This article appears in the following
registered trademark of AAAS. is aScience2015 by the American Association for the Advancement of Science; all rights reserved. The title
CopyrightAmerican Association for the Advancement of Science, 1200 New York Avenue NW, Washington, DC 20005. (print ISSN 0036-8075; online ISSN 1095-9203) is published weekly, except the last week in December, by theScience
on
Dec
embe
r 10
, 201
5w
ww
.sci
ence
mag
.org
Dow
nloa
ded
from