SM1205 Interactivity Topic 07: Interactivity for Games Spring 2011SCM-CityU1.
VisAR: Bringing Interactivity to Static Data Visualizations throughAugmented Reality
Taeheon Kim* Bahador Saket† Alex Endert‡ Blair MacIntyre§
Georgia Institute of Technology
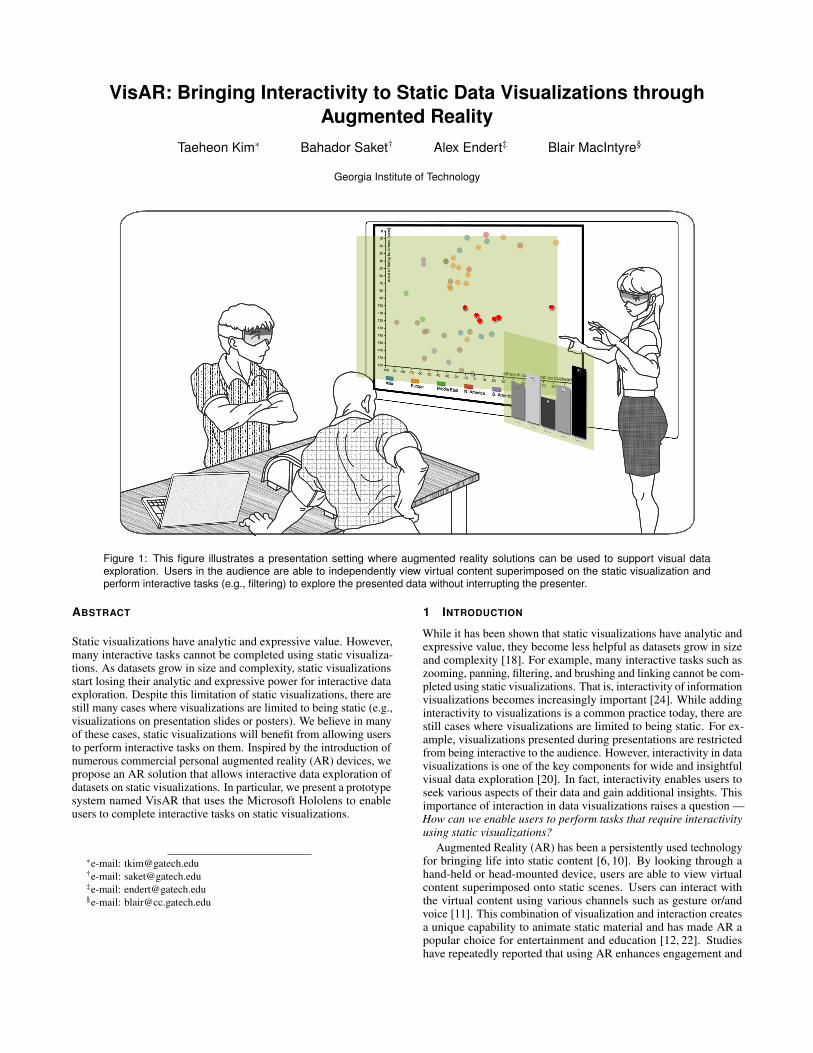
Figure 1: This figure illustrates a presentation setting where augmented reality solutions can be used to support visual dataexploration. Users in the audience are able to independently view virtual content superimposed on the static visualization andperform interactive tasks (e.g., filtering) to explore the presented data without interrupting the presenter.
ABSTRACT
Static visualizations have analytic and expressive value. However,many interactive tasks cannot be completed using static visualiza-tions. As datasets grow in size and complexity, static visualizationsstart losing their analytic and expressive power for interactive dataexploration. Despite this limitation of static visualizations, there arestill many cases where visualizations are limited to being static (e.g.,visualizations on presentation slides or posters). We believe in manyof these cases, static visualizations will benefit from allowing usersto perform interactive tasks on them. Inspired by the introduction ofnumerous commercial personal augmented reality (AR) devices, wepropose an AR solution that allows interactive data exploration ofdatasets on static visualizations. In particular, we present a prototypesystem named VisAR that uses the Microsoft Hololens to enableusers to complete interactive tasks on static visualizations.
*e-mail: [email protected]†e-mail: [email protected]‡e-mail: [email protected]§e-mail: [email protected]
1 INTRODUCTION
While it has been shown that static visualizations have analytic andexpressive value, they become less helpful as datasets grow in sizeand complexity [18]. For example, many interactive tasks such aszooming, panning, filtering, and brushing and linking cannot be com-pleted using static visualizations. That is, interactivity of informationvisualizations becomes increasingly important [24]. While addinginteractivity to visualizations is a common practice today, there arestill cases where visualizations are limited to being static. For ex-ample, visualizations presented during presentations are restrictedfrom being interactive to the audience. However, interactivity in datavisualizations is one of the key components for wide and insightfulvisual data exploration [20]. In fact, interactivity enables users toseek various aspects of their data and gain additional insights. Thisimportance of interaction in data visualizations raises a question —How can we enable users to perform tasks that require interactivityusing static visualizations?
Augmented Reality (AR) has been a persistently used technologyfor bringing life into static content [6, 10]. By looking through ahand-held or head-mounted device, users are able to view virtualcontent superimposed onto static scenes. Users can interact withthe virtual content using various channels such as gesture or/andvoice [11]. This combination of visualization and interaction createsa unique capability to animate static material and has made AR apopular choice for entertainment and education [12, 22]. Studieshave repeatedly reported that using AR enhances engagement and
motivation of users compared to using non-AR material [9].In this paper, we present how augmented reality can be used to
bring interactivity to static visualizations. In particular, we presenta new solution built on the Microsoft Hololens, enabling users toperform interactive tasks such as filtering, highlighting, linking, andhovering on static visualizations. Users can use gestures or voicecommands to interact with visualizations and observe changes inreal-time on the AR device. Through interactivity, our solutionenables users to customize views of static visualizations and answerpersonal data-driven questions.
2 RELATED WORK
Augmented reality allows users to have a seamless experience be-tween their world and content others have created. One interestingaspect of AR is that it can breath life into static content. In theAR domain, there have been numerous projects that animate staticobjects by adding interactivity to the once-inanimate experience. Forexample, Billinghurst’s MagicBook was a novel AR interface thatallowed static components of a physical book to be interactive to thereader [6]. This lead to various follow up studies that experimentedwith adding interactivity to physical books [10]. Researchers inves-tigated how AR solutions affect user experience while performingtasks. For example, in one study, researchers observed that studentsusing AR-enhanced books were better motivated and more engagedin the material [5] compared to using other methods.
The power of animating static content has also been proven bythe widespread usage of the commercial product Layar [2]. Layarprovides AR experiences that enhance printed material to be digitallyinteractive on everyday smartphones. The resulting artifacts showedan 87% click-through rate which is overwhelming compared tosingle digit click-through rates of other advertisement methods. Thisshows that when properly designed, using AR for the purpose ofadding interactivity to static content has a potential of increasinguser engagement.
In the information visualization domain, there have been otherattempts to merge AR with information visualization. In the sensethat AR inherently couples virtual content with the user’s physicalsurroundings, White defines situated visualization as visualizationsthat are coupled with the context of physical surroundings [23]. Ourapproach is somewhat different from White’s view of situated visual-ization as we ignore the physical context in which the visualization isplaced in and focus on extending the capabilities of the visualizationregardless of the context.
In the interaction space, Cordeil et al. coined the concept of spatio-data coordination which defines the mapping between the physicalinteraction space and the virtual visualization space [8]. Whenstructuring our approach through this concept, we see that bystandersof visualizations cannot interact with the visualizations, having nocoordination between their interaction space and the visualizationspace. By introducing additional elements in the visualization spacethat have spatio-data coordination with personal interaction spaces,we allow users to directly interact with the visualization and viewpersonalized content in their own display space.
Our work is also inspired by the information-rich virtual environ-ment concept introduced by Bowman et al. [7]. The concept looksinto interactions between virtual environments and abstract infor-mation. If we consider a synthetic static visualization as a virtualrepresentation of data, our solution provides abstract informationabout that environment. Users can perform interaction tasks thatpoint from the virtual environment to abstract information; that is,users can retrieve details associated with a synthetic visualization.
Other studies have investigated view management systems thatadaptively annotate scenes with virtual content [4, 21]. These sys-tems adjust annotations according to various factors such as theuser’s viewpoint or the amount of crowded content on the screen.The results of these studies have direct implications to our system as
we rely on annotations on static visualizations.
3 MOTIVATION
In this section, we discuss a couple of scenarios that motivate us-ing AR techniques to enable people to gain more insights throughinteracting with static visualizations.
3.1 Data Exploration of Audience During PresentationsUsing visualizations is a common method to convey information toan audience during presentations and meetings. In a presentationsetting where a projector is used to show digital slides, informationdelivered to the audience is limited to content presented in the slidesand delivered by a presenter verbally. That is, the audience cannotdirectly interact with the visualization presented on the slides toexplore different aspects of the underlying data. This leaves limitedroom for answering questions that individuals in the audience mighthave. Personal AR devices would enable users to individually in-teract with static visualizations shown on digital slides to conductopen-ended exploration. ?? shows an example of VisAR being usedin a presentation setting.
3.2 Credential-based Data ExplorationIn a group where individuals have different levels of credentials, ARcan provide a way of differentiating visualizations and explorationcapabilities among the users. According to an individual’s securityclearance level, they can be allowed different sets of interactionsor be provided with distinct sets of data. For instance, when anentry-level employee and a senior employee are both attending apresentation on the company’s annual reports and the screen iscurrently showing a chart of this year’s profits, only the senioremployee can be allowed to explore through sensitive parts of thedata on her personal AR device by interacting with annotations thatlead to other related information.
4 METHOD
The analytical workflow starts with a preparation stage which in-volves accessing the AR application that contains the underlyingdataset that was used for creating the visualization. The user thenobserves a typical static visualization (visualization target) shownon a poster or digital screen through an AR device. The deviceuses it’s camera and an image-based tracking system such as PTC’sVuforia [15] to track the visualization as a target. Depending onthe number of trackable features, the target can either be a fiducialmarker that is carefully positioned on the visualization or simply theentire static visualization itself. Once the AR device recognizes thetarget, it superimposes virtual content onto the static visualization.For example, in the case of a static scatterplot visualization, thesystem renders a new set of virtual data points and overlays it ontothe static version of the visualization. Users are then able to seeand interact with the virtual content that is superimposed on thestatic visualization. User interaction with the virtual content canbe through voice or/and gestures. For example, users can filter aspecific set of data points by saying “Filter out cars above $40,000”.Similarly users can see detailed information about a specific datapoint by simply looking directly at the data point.
5 VISAR PROTOTYPE
To indicate the feasibility of our idea, we implemented a prototypesystem on the Microsoft Hololens [14] which has accurate trackingand rendering capabilities and an RGB camera that can be usedfor target recognition. No additional adjustment to the device wasrequired. For the computer vision solution on tracking target imageswe use PTC’s Vuforia which has support for the Hololens platform.We prepared an example static visualization and defined the entirevisualization as the target visualization because it had enough fea-tures to qualify as an image target. The visualization system was

Figure 2: A live screenshot taken from the viewpoint of the user whileusing the VisAR prototype. Gazing at a data point reveals detailedinformation on it.
built using the Unity Editor for Hololens while the example staticvisualization was built with the D3 library.
5.1 Techniques and Interactions Supported by VisARThe current version of VisAR supports two types of visualizationtechniques (bar chart and scatterplot) and four main interactionsincluding details on demand, highlighting, filtering, and linkingviews.
• Details on Demand: VisAR supports one of the most com-monly provided interactions in visualization tools, details ondemand, to let the user inspect data points on-the-fly. Whenusers “point” at a data point using their head, the system visu-alizes a pop-up box that contains detailed information on thespecific data point(Fig. 2). Users are able to turn this featureon or off by means of voice commands. Because our deviceuses head gaze as the pointing interface, we consider head gazeas the direction that the user is looking at. The point wherethe user’s head gaze contacts the visualization is the locationof the gaze pointer, analogous to a mouse pointer. On devicesthat support eye gaze tracking, it would be preferable to useeye gaze instead of head gaze.
• Highlighting: Another interaction that VisAR supports ishighlighting. Highlighting enables users to find and emphasizethe relevant points of interest. Users can highlight data pointsof interest either by tapping on the provided buttons or usingvoice commands. As a result, the relevant points are empha-sized through highlighting of the points. To do this, we renderanother layer of data points with slightly increased brightnessonto the exact points(Fig. 3). Because the rendered data pointshave a different contrast and brightness than the original datapoints, it works as a highlighting method.
• Filtering: Similar to highlighting, VisAR also supports a clas-sic filtering method through diminished reality [13]. This isachieved by overlaying virtual “patches” to cover data pointsthat should be hidden. The patches are colored with the defaultbackground color, shaped according to the data point shape,and sized slightly larger than the data points. The result is avisualization that only shows the data point that the user isinterested in. For instance, if a user applies a filter to see cer-tain data points, irrelevant data points are “removed” from thestatic visualization to let the user focus on the relevant ones.
• Linking Views: The fourth interaction VisAR supports islinking views. Upon filtering or highlighting a subset of datapoints, VisAR reveals a bar chart visualization to the rightof the main scatterplot. The bar chart provides additionalinformation about the filtered or highlighted data points byvisualizing other data attributes of the dataset. The same setof interactions are provided for both visualizations and thevisualizations are linked, so interacting with one visualizationupdates the other visualization.
5.2 The VisAR InterfaceVisAR receives user input through two different modalities: speechand gesture. Below, we describe how VisAR receives user inputusing each of these modalities.
• Voice Input: Among the two channels of input we support,voice input is the most direct and efficient way to interact withVisAR. The head-mounted platform used in VisAR providesa powerful natural language user interface, allowing users toperform voice commands. Users can filter or highlight desireddata points with a single voice command such as “Filter outcountries in Asia.” Voice commands also allow custom featuresthat are not supported by gesture such as “Filter out countrieswith GDP larger than $10,000.”
• Gesture Input: The other input channel supported by VisARis gesture. This is a useful input mode in extremely quiet ornoisy environments where voice input is impractical. Users canperform select or exit commands through gestures identical towhat the Microsoft Hololens provides by default. For selecting,the gesture input needs to be accompanied by a gaze pointer.Using the gaze pointer, the user hovers over a static graphicalcomponent and gestures a select command to interact withit. For example, if a user wants to highlight a data point, shewould look at the data point and gesture a click.
Upon receiving an input from the user, VisAR provides feedbackabout what action has been done and what has been accomplished.VisAR provides feedback through visual and auditory channels.
• Auditory Feedback: Each time that the system receives userinput, audio feedback will be provided through the head-mounted device. A simple system chime is used to indicate thesuccess of an input. As the Microsoft Hololens has personalspeakers attached right next to the user’s ears, any auditoryfeedback is only audible to the individual user without the needof additional headphones.
• Visual Feedback: After each user interaction with the visual-ization, VisAR updates the represented view accordingly. Forexample, after filtering a specific set of data points, VisARimmediately overlays virtual patches to cover data points thatare supposed to be filtered.
5.3 Usage ScenarioAssume Bob plans to attend a workshop on the future of interac-tions in data visualizations. Workshop organizers have providedthe presentation slides and the accompanying AR application onthe workshop’s website. Before the workshop, Bob navigates tothe workshop’s website on his AR device and downloads the ARapplication that would augment the presentation slides. During onepresentation, the presenter brings up a slide that has a scatterplot onit. Each point in the scatterplot represents the ratio of the numberof information visualization faculty members to the number of stu-dents in a university. Bob notices that one university has an unusualfaculty-to-student ratio compared to the ratio of other schools. He is

Figure 3: A live screenshot taken from the viewpoint of the user whileusing the VisAR prototype. A subset of data points are highlighted(blue) and a linked view is displayed.
curious to know what might be the reason for the outlier. Bob pointshis head to the data point that interests him. The data point is high-lighted and a small text-box appears with simple information on theschool. The details are not enough for Bob to understand the reasonso he gestures a “click” motion which brings up a separate bar charton the side of the original scatterplot. By quickly going throughthe pop-up visualization, he sees that the school has been investingmore on hiring information visualization faculty members comparedto other schools in the country. Bob assumes that this might be thereason. Now that he feels that he has a better understanding of theoutlier, he gestures an “exit” motion and continues listening to thepresentation.
6 DISCUSSION
We developed VisAR to show the feasibility of using AR devicesto bring interactivity to static data visualizations. The current ver-sion of VisAR supports two types of visualization techniques (barchart and scatterplot) and four interaction techniques (details ondemand, highlighting, filtering and linking views). We view thecurrent version of VisAR as the early step towards exploring theapplications of augmented reality in data visualization. However,generalizing the usage of AR devices for interacting with static visu-alizations requires support of more sophisticated analytic operationsand visualization techniques. For example, how can users performbrushing and linking or zooming on static visualizations using ARtechnologies? Multiple avenues for future work lie in improving theVisAR interface. We envision expanding VisAR to include othervisualization techniques (e.g., linecharts) and interaction tasks (e.g.,zooming, panning).
Previous work in the AR community indicates that using ARimproves user engagement compared to using non-AR material [5].However, it is not clear to the visualization community how usageof AR solutions affect user experience during the visual data ex-ploration process. An important avenue for continued research isconducting an in-depth study utilizing both qualitative and quan-titative techniques to measure the impact of AR solutions in datavisualization compared to non-AR solutions, using various usability(e.g., time and error) and user experience (e.g., engagement [16,17])metrics. We hypothesize that using AR solutions increases userengagement in working with data visualizations, but this remains tobe formally studied.
Many AR solutions rely on two interaction modalities: speech andgesture. There are advantages in using speech and gesture in visualdata exploration since they enable users to express their questionsand commands more easily [19]. However, these interaction modali-ties also bring challenges such as lack of discoverability. How does
a user recognize what the possible interactions are? How does a userknow what the exact gesture or voice command is for performing aspecific interaction? One interesting research avenue is to investigatemethods that make possible interactions more discoverable in suchsystems.
In the current version of VisAR, we are using a high-end ARdevice (Microsoft Hololens) which currently might not be a feasi-ble option to use for most people. However, with recent advancesin smartphone technology, currently available off-the-shelf smart-phones are also powerful enough to be used as a personal AR de-vice. By using a smartphone as a hand-held AR device, the currentimplementation can be ported to have identical capabilities. Werecommend using cross-platform AR systems such as Argon [1] toallow users to be able to access the same experience regardless ofthe underlying device or operating system.
7 CONCLUSION
While the benefit of 3D visualizations in immersive AR settings arestill yet to be further discussed [3], in this paper we examined adifferent aspect of AR that takes advantage of 2D visualizations. AsAR allows us to add visual interactive components to static scenes,we utilize this capability to add interactivity to static visualizationsand enable users to independently address personal data-driven ques-tions. Through the prototype of our solution, we demonstrate thatthe idea is feasible to be implemented on currently available ARdevices. Although further study is needed to measure the advantagesof the system, with the abundance of personal AR devices such assmartphones, we believe our solution is not only powerful but alsopractical.
REFERENCES
[1] argon.js. https://www.argonjs.io/, 2017.[2] Layar. https://www.layar.com/, 2017.[3] D. Belcher, M. Billinghurst, S. E. Hayes, and R. Stiles. Using aug-
mented reality for visualizing complex graphs in three dimensions. InThe Second IEEE and ACM International Symposium on Mixed andAugmented Reality, 2003. Proceedings., pp. 84–93, Oct 2003. doi: 10.1109/ISMAR.2003.1240691
[4] B. Bell, S. Feiner, and T. Hollerer. View management for virtual andaugmented reality. In Proceedings of the 14th Annual ACM Symposiumon User Interface Software and Technology, UIST ’01, pp. 101–110.ACM, New York, NY, USA, 2001. doi: 10.1145/502348.502363
[5] M. Billinghurst and A. Duenser. Augmented reality in the classroom.Computer, 45(7):56–63, July 2012. doi: 10.1109/MC.2012.111
[6] M. Billinghurst, H. Kato, and I. Poupyrev. The magicbook - movingseamlessly between reality and virtuality. IEEE Computer Graphicsand Applications, 21(3):6–8, May 2001. doi: 10.1109/38.920621
[7] D. A. Bowman, C. North, J. Chen, N. F. Polys, P. S. Pyla, and U. Yilmaz.Information-rich virtual environments: Theory, tools, and researchagenda. In Proceedings of the ACM Symposium on Virtual RealitySoftware and Technology, VRST ’03, pp. 81–90. ACM, New York, NY,USA, 2003. doi: 10.1145/1008653.1008669
[8] M. Cordeil, B. Bach, Y. Li, E. Wilson, and T. Dwyer. A design space forspatio-data coordination: Tangible interaction devices for immersiveinformation visualisation. In Proceedings of IEEE Pacific VisualizationSymposium (Pacific Vis), 2017.
[9] M. Dunleavy, C. Dede, and R. Mitchell. Affordances and limitations ofimmersive participatory augmented reality simulations for teaching andlearning. Journal of Science Education and Technology, 18(1):7–22,Feb 2009. doi: 10.1007/s10956-008-9119-1
[10] R. Grasset, A. Duenser, H. Seichter, and M. Billinghurst. The mixedreality book: A new multimedia reading experience. In CHI ’07Extended Abstracts on Human Factors in Computing Systems, CHIEA ’07, pp. 1953–1958. ACM, New York, NY, USA, 2007. doi: 10.1145/1240866.1240931
[11] S. Irawati, S. Green, M. Billinghurst, A. Duenser, and H. Ko. An Eval-uation of an Augmented Reality Multimodal Interface Using Speech

and Paddle Gestures, pp. 272–283. Springer Berlin Heidelberg, Berlin,Heidelberg, 2006. doi: 10.1007/11941354 28
[12] A. M. Kamarainen, S. Metcalf, T. Grotzer, A. Browne, D. Mazzuca,M. S. Tutwiler, and C. Dede. Ecomobile: Integrating augmented realityand probeware with environmental education field trips. Comput. Educ.,68:545–556, Oct. 2013. doi: 10.1016/j.compedu.2013.02.018
[13] S. Mann and J. Fung. Eyetap devices for augmented, deliberately di-minished, or otherwise altered visual perception of rigid planar patchesof real-world scenes. Presence: Teleoper. Virtual Environ., 11(2):158–175, Apr. 2002. doi: 10.1162/1054746021470603
[14] Microsoft. HoloLens. https://www.microsoft.com/en-us/
hololens, 2017.[15] PTC Inc. Vuforia. https://www.vuforia.com/, 2017.[16] B. Saket, A. Endert, and J. Stasko. Beyond usability and performance:
A review of user experience-focused evaluations in visualization. InProceedings of the Sixth Workshop on Beyond Time and Errors onNovel Evaluation Methods for Visualization, BELIV ’16, pp. 133–142.ACM, New York, NY, USA, 2016. doi: 10.1145/2993901.2993903
[17] B. Saket, C. Scheidegger, and S. Kobourov. Comparing node-link andnode-link-group visualizations from an enjoyment perspective. Com-puter Graphics Forum, 35(3):41–50, 2016. doi: 10.1111/cgf.12880
[18] B. Saket, P. Simonetto, S. Kobourov, and K. Brner. Node, node-link,and node-link-group diagrams: An evaluation. IEEE Transactions onVisualization and Computer Graphics, 20(12):2231–2240, Dec 2014.doi: 10.1109/TVCG.2014.2346422
[19] A. Srinivasan and J. T. Stasko. Natural Language Interfaces for DataAnalysis with Visualization: Considering What Has and Could BeAsked. In B. Kozlikova, T. Schreck, and T. Wischgoll, eds., EuroVis2017 - Short Papers. The Eurographics Association, 2017. doi: 10.2312/eurovisshort.20171133
[20] J. Stasko. Value-driven evaluation of visualizations. In Proceedingsof the Fifth Workshop on Beyond Time and Errors: Novel EvaluationMethods for Visualization, BELIV ’14, pp. 46–53. ACM, New York,NY, USA, 2014. doi: 10.1145/2669557.2669579
[21] M. Tatzgern, D. Kalkofen, R. Grasset, and D. Schmalstieg. Hedgehoglabeling: View management techniques for external labels in 3d space.In 2014 IEEE Virtual Reality (VR), pp. 27–32, March 2014. doi: 10.1109/VR.2014.6802046
[22] D. Wagner, T. Pintaric, and D. Schmalstieg. The invisible train: Acollaborative handheld augmented reality demonstrator. In ACM SIG-GRAPH 2004 Emerging Technologies, SIGGRAPH ’04, pp. 12–. ACM,New York, NY, USA, 2004. doi: 10.1145/1186155.1186168
[23] S. M. White. Interaction and Presentation Techniques for SituatedVisualization. PhD thesis, New York, NY, USA, 2009. AAI3373578.
[24] J. S. Yi, Y. a. Kang, J. Stasko, and J. Jacko. Toward a deeper under-standing of the role of interaction in information visualization. IEEETransactions on Visualization and Computer Graphics, 13(6):1224–1231, Nov. 2007. doi: 10.1109/TVCG.2007.70515