Virtual Desktops Security Test Report · PDF fileVirtual Desktops Security Test Report...
20
Virtual Desktops Security Test Report ©2014 AV-TEST GmbH 1 Virtual Desktops Security Test Report A test commissioned by Kaspersky Lab and performed by AV-TEST GmbH Date of the report: May 19 th , 2014 Executive Summary AV-TEST performed a comparative review (January to March 2014) of three purpose-built security solutions for virtual environments to analyze their capabilities to protect against real world and prevalent malware as well as the performance impact in virtual desktop infrastructure (VDI) environments. The products under test were Kaspersky Security for Virtualization | Light Agent, Symantec Endpoint Security and Trend Micro Deep Security. Each solution was evaluated in a Microsoft Hyper-V hypervisor environment. In the first part of the test the Protection capabilities were measured with a simulated real world test and a detection test against prevalent malware. This environment was established according to AV-TEST’s testing methodologies typically leveraged in certification testing. Figure 1: Real World Detection Results In the real world test the protected virtual machines were exposed to real world attacks from malicious URLs and detection by any technology of security software was recorded. Additionally the post-test system state was compared with the original state to determine whether the attack was successfully blocked or not. Kaspersky Lab and Symantec detected and blocked 100% of all real world test-cases. Trend Micro failed one of the 48 test-cases used in this methodology. In the test against prevalent malware the products had to scan a set of 9,851 prevalent malicious files. Each undetected file was executed on a protected virtual machine and any additional detection by the security software was noted. 40 41 42 43 44 45 46 47 48 Kaspersky Security for Virtualization Symantec Endpoint Protection Trend Micro Deep Security Real World Detection Results
-
Upload
duonghuong -
Category
Documents
-
view
226 -
download
0
Transcript of Virtual Desktops Security Test Report · PDF fileVirtual Desktops Security Test Report...

Virtual Desktops Security Test Report ©2014 AV-TEST GmbH 1
Virtual Desktops Security Test Report
A test commissioned by Kaspersky Lab and performed by AV-TEST GmbH
Date of the report: May 19th, 2014
Executive Summary AV-TEST performed a comparative review (January to March 2014) of three purpose-built security solutions for virtual
environments to analyze their capabilities to protect against real world and prevalent malware as well as the
performance impact in virtual desktop infrastructure (VDI) environments. The products under test were Kaspersky
Security for Virtualization | Light Agent, Symantec Endpoint Security and Trend Micro Deep Security. Each solution was
evaluated in a Microsoft Hyper-V hypervisor environment.
In the first part of the test the Protection capabilities were measured with a simulated real world test and a detection
test against prevalent malware. This environment was established according to AV-TEST’s testing methodologies
typically leveraged in certification testing.
Figure 1: Real World Detection Results
In the real world test the protected virtual machines were exposed to real world attacks from malicious URLs and
detection by any technology of security software was recorded. Additionally the post-test system state was compared
with the original state to determine whether the attack was successfully blocked or not.
Kaspersky Lab and Symantec detected and blocked 100% of all real world test-cases. Trend Micro failed one of the 48
test-cases used in this methodology.
In the test against prevalent malware the products had to scan a set of 9,851 prevalent malicious files. Each undetected
file was executed on a protected virtual machine and any additional detection by the security software was noted.
40
41
42
43
44
45
46
47
48
Kaspersky Security forVirtualization
Symantec EndpointProtection
Trend Micro DeepSecurity
Real World Detection Results

Virtual Desktops Security Test Report ©2014 AV-TEST GmbH 2
Figure 2: Detection of Prevalent Malware
Kaspersky Lab and Trend Micro achieved the top detection score of 6 points detecting more than 99.8% of prevalent
malware. Symantec achieved a detection score of 5.5 points. For more information please refer to chapter “Test
Results”.
The second part of the test was focused on Performance. A low performance impact by the security solution helps to
keep the consolidation ratios high (improved ROI) and to maintain a good user experience. The impact on the virtual
environment was determined with the Login VSI benchmark suite as well as a custom “Boot Storm” scenario.
Figure 3: Results of Login VSI Benchmark Suite (less is better)
The Login VSI benchmark suite emulates realistic workloads on every virtual desktop and measures the response time.
Thereby it determines the overall system performance.
Kaspersky Lab achieved the lowest Login VSI Index score. It was shown to have the least impact on the performance of
the virtual infrastructure. Symantec achieved the second best result and Trend Micro caused the highest performance
impact. For more information please refer to chapter “Test Results”.
98,00%
99,80%
3
3,5
4
4,5
5
5,5
6
Kaspersky Securityfor Virtualization
Symantec EndpointProtection
Trend Micro DeepSecurity
De
tect
ion
Sco
re
Detection of Prevalent Malware
2.751 3.908 4.5490
500
1.000
1.500
2.000
2.500
3.000
3.500
4.000
4.500
5.000
Kaspersky Security forVirtualization
Symantec EndpointProtection
Trend Micro DeepSecurity
Login VSI Index

Virtual Desktops Security Test Report ©2014 AV-TEST GmbH 3
Figure 4: Average Boot Time during the Boot Storm Test
In the “Boot Storm” scenario Kaspersky Lab showed the least performance impact leveraging the Login VSI benchmark
results. Symantec and Trend Micro were both shown to have more significant impacts to boot time. For more
information please refer to chapter “Test Results”.
While all measured products show similar protection levels their performance impacts differed significantly. Kaspersky
Security for Virtualization | Light Agent has shown the least impact on the virtual infrastructure which results in better
efficiency of the virtual environment empowered by this solution.
109 139 1710
20
40
60
80
100
120
140
160
180
Kaspersky Security forVirtualization
Symantec EndpointProtection
Trend Micro DeepSecurity
Bo
ot
tim
e in
s
Average Boot Time

Virtual Desktops Security Test Report ©2014 AV-TEST GmbH 4
Content Executive Summary ................................................................................................................................................................ 1
Products Tested ...................................................................................................................................................................... 5
Methodology .......................................................................................................................................................................... 6
Platform .............................................................................................................................................................................. 6
Testing Methodology .......................................................................................................................................................... 7
General............................................................................................................................................................................ 7
Protection: Real-World Test ........................................................................................................................................... 7
Protection: Prevalent Malware Detection Test .............................................................................................................. 8
Performance: Login VSI Test ........................................................................................................................................... 8
Performance: Boot Storm Test ....................................................................................................................................... 9
Test Results ........................................................................................................................................................................... 10
Protection: Real-World Test ............................................................................................................................................. 10
Protection: Prevalent Malware Detection Test ................................................................................................................ 10
Performance: Login VSI Test ............................................................................................................................................. 11
Performance: Boot Storm Test ......................................................................................................................................... 14
Summary ............................................................................................................................................................................... 18
Appendix A – Version information of the tested software ................................................................................................... 19
Appendix B – Hardware specifications ................................................................................................................................. 19
Appendix C – Threat Landscape Overview ........................................................................................................................... 20
Appendix D – AV-TEST detection score calculation .............................................................................................................. 20

Virtual Desktops Security Test Report ©2014 AV-TEST GmbH 5
Products Tested The testing occurred from January to March 2014. AV-TEST used the latest releases available at the time of the test of
the following products:
Kaspersky Security for Virtualization Light Agent 3.0
Symantec Endpoint Security 12.1RU4
Trend Micro Deep Security 9.0 SP1
Since virtual infrastructures are an important topic for the enterprise, security vendors provide new products which are
designed especially for those environments. There are three types of protection implementations in virtual
environments.
The first approach is equal to the traditional desktop protection. Every machine has its own protection agent, which
takes resources from the machine for its different protection modules. This approach is usually independent from the
hypervisor, but it requires more resources for the same number of machines due to redundant protection modules
being loaded into the memory of each machine.
The second approach uses hypervisor based protection and works without an agent on the machine. The hypervisor
provides an interface for a protection appliance, which can be used for anti-malware scans and detections. That means
that all protected machines on a hypervisor share the same resource for protection. The drawbacks of this approach are
the dependency on the hypervisor technology (VMware only), the limited number of protection technologies that can
be implemented with this architecture and the missing possibility to provide comprehensive user feedback, if a threat
was detected.
The third approach is a hybrid solution with a light agent on each machine and a protection appliance, which is used to
scan files for malicious content. The light agent can display a protection status and warning messages to the user and it
can also implement other advanced protection modules such as proactive detection modules, application monitoring,
control tools and others. Resource intensive tasks like scanning files are forwarded to the protection appliance.
In this test Symantec’s and Trend Micro’s solutions rely on the first approach and Kaspersky Lab relies on the third
approach. As this test was performed in a Microsoft Hyper-V environment, the agentless approach was not considered
in this test.

Virtual Desktops Security Test Report ©2014 AV-TEST GmbH 6
Methodology
Platform The test environment was setup according to figure 5.
Desktop Template + 50 Diff Disk
ClonesAV Appliance
Internal Network
Monitoring Network and
Internet access
Host under test (Hyper-V 2012)
Gateway VSI Controller AV manager
Infrastructure host (ESXi 5.1)
Figure 5: Setup of the Test Environment
The hypervisor was Windows Server 2012 Standard with Hyper-V role. The protected virtual machines were running
with Windows 7 Enterprise (64 Bit) SP1. The management consoles were hosted on a VMware ESXi 5.1.0 (Build 799733)
server. The virtual machines for the management consoles were running with Windows Server 2008 R2 Standard +
VMware Tools.
Please see the Appendix B for hardware specifications.

Virtual Desktops Security Test Report ©2014 AV-TEST GmbH 7
Testing Methodology
General
1. Clean system for each sample. The test virtual machines were restored to a clean state before being exposed to
each malware sample.
2. Product Cloud/Internet Connection. The Internet was available to all tested products that use the cloud as part
of their protection strategy.
3. System Configuration. To eliminate the influence on the performance test scheduled tasks from the operating
system and the products were disabled (e.g. automatic updates, defragmentation, scheduled scans etc.). UAC
was disabled during the whole test.
4. Product Configuration. Symantec was configured with the “High Performance” profile and “Virtual Image
Exception” according to their best practices for virtualization. This configuration was used for Protection as well
as Performance tests, because an administrator would not switch between different profiles after he has setup
the environment.
A full system scan was done before the performance tests of Symantec according to their best practices. For
Kaspersky Lab and Trend Micro such a scan was not required.
Signature updates were performed manually before each Protection and Performance test.
5. Sample Cloud/Internet Accessibility. If the malware uses the cloud/Internet connection to reach other sites in
order to download other files and infect the system, care should be taken to make sure that the cloud access is
available to the malware sample in a safe way such that the testing network is not under the threat of getting
infected.
6. Allow time for sample to run. Each sample was allowed to run on the target system for 10 minutes to exhibit
autonomous malicious behavior. This may include initiating connections to systems on the internet, or installing
itself to survive a reboot (as may be the case with certain key-logging Trojans that only activate when the victim
is performing a certain task).
The procedures below are carried out on all tested programs and all test cases at the same time in order to ensure that
all protection programs have the exact same test conditions. If a test case is no longer working or its behavior varies in
different protection programs (which can be clearly determined using the Sunshine analyses), the test case is deleted.
This ensures that all products were tested in the exact same test scenarios. All test cases are solely obtained from
internal AV-TEST sources and are always fully analyzed by AV-TEST. AV-TEST never resorts to using test cases or analyses
provided by manufacturers or other external sources.
The tests were performed in the following order:
1. Protection: Real-World Test
2. Protection: Prevalent Malware Detection Test
3. Performance: Login VSI Test
4. Performance: Boot Storm Test
Each test was prepared and performed separately, so that the tests didn’t affect each other.
Protection: Real-World Test
1. The products are updated manually before each test case. The protection program has complete Internet access
at all times.
2. AV-TEST uses the analysis program Sunshine, which it developed itself, to produce a map of the non-infected
system.
3. It then attempts to access the website respective execute the malicious file.
4. If access to/execution of the sample is blocked with static or dynamic detection mechanisms by the program,
this is documented.

Virtual Desktops Security Test Report ©2014 AV-TEST GmbH 8
5. Given that the detection of malicious components or actions is not always synonymous to successful blockage,
Sunshine constantly monitors all actions on the computer in order to determine whether the attack was
completely or partially blocked or not blocked at all.
6. A result for the test case is then determined based on the documented detection according to the protection
program and the actions on the system recorded by Sunshine.
Samples
The test set for the real-world test contains 48 malicious test-cases. These test-cases have been collected during January 23rd and January 30th 2014. Every test-case has been tested on the same day of its appearance in AV-TEST’s analysis systems.
Protection: Prevalent Malware Detection Test
1. 9,851 prevalent malware samples have been scanned with the products with recent updates and connection to
the cloud.
2. Each undetected sample was executed on a protected virtual machine and each detection by the security
solution was noted.
Samples
The malware set for the static scanning test contains 9,851 samples of prevalent malware. This includes files that were
spread in the internet in the last few weeks and that were collected by AV-TEST during February 2014. The tests were
performed in March 2014.
Figure 6: Prevalent Malware Set Composition
Performance: Login VSI Test
1. AV-TEST used the Login VSI1 benchmark suite to measure the performance impact when 50 machines were
running on the hypervisor.
2. Login VSI has been used in version 3.7. The test was performed in Dynamic mode with the “medium workload”
profile.
3. The performance of the hypervisor was monitored with perfmon.
4. Five test cycles have been performed.
1 http://www.loginvsi.com
6000
7000
8000
9000
10000
Prevalent Malware Set Composition
Viruses
Dropper
Password-Stealer (PWS)
Rogue Applications (e.g. Fake AV)
Downloader
Worms
Backdoors
Bots
Generic

Virtual Desktops Security Test Report ©2014 AV-TEST GmbH 9
5. During each of the test cycle the correspondent Login VSI values were measured and the average Login VSI
index was calculated.
6. The best and worst test cycles according to their average Login VSI values were removed from the results to
improve the stability and robustness of the results.
7. The final average Login VSI index was calculated from the remaining three test cycles.
8. The same calculation was done for the values measured with perfmon.
Performance: Boot Storm Test
1. In the Boot Storm test scenario 50 virtual machines were started sequentially by a PowerShell script running on
the hypervisor. The delay between the power up of each machine was set to 20 seconds. AV-TEST has measured
the boot time for each virtual machine and monitored the performance of the hypervisor using perfmon.
2. Five test cycles have been performed.
3. During each of the test cycle the average boot time was calculated.
4. The best and worst test cycles according to their average boot time were removed from the results to improve
the stability and robustness of the results.
5. The final average boot time was calculated from the remaining three test cycles.
6. The best and worst values of each test cycle were removed and the average boot time was calculated from the
remaining values.
7. A test cycle was considered as correct when at least 95% of the machines booted correctly.

Virtual Desktops Security Test Report ©2014 AV-TEST GmbH 10
Test Results
Protection: Real-World Test In the real world test scenario the protected virtual machines were exposed to malicious URLs, which were accessed
with the Internet Explorer 9, which was the default browser on the test systems. If the testers were able to download a
malicious payload from the URL, this payload was executed. Kaspersky Lab and Symantec achieved a perfect result and
blocked all 48 attacks. Trend Micro has missed one attack and the system got infected.
Figure 7: Real World Detection Results
Protection: Prevalent Malware Detection Test
Figure 8: Detection of Prevalent Malware
In the second part of the protection test with 9,851 prevalent malicious samples the products achieved the following results:
Product Detection Score2 Detection Rate
Kaspersky Security for Virtualization | Light Agent 6.0 99.81% Symantec Endpoint Protection 5.5 99.70% Trend Micro Deep Security 6.0 99.97%
Table 1: Detection of Prevalent Malware
2 The detection score was calculated according to AV-TEST’s certification scoring methodology. See the Appendix D for details.
40
41
42
43
44
45
46
47
48
Kaspersky Security forVirtualization
Symantec EndpointProtection
Trend Micro DeepSecurity
Real World Detection Results
98,00%
99,80%
3
3,5
4
4,5
5
5,5
6
Kaspersky Securityfor Virtualization
Symantec EndpointProtection
Trend Micro DeepSecurity
De
tect
ion
Sco
re
Detection of Prevalent Malware

Virtual Desktops Security Test Report ©2014 AV-TEST GmbH 11
All in all the protection is on a similar level for all three solutions. The difference between Symantec and Trend Micro is
only 27 samples. With another sample set the results may slightly vary.
Performance: Login VSI Test Login VSI is a well-known solution for benchmarking and load testing for hosted virtual infrastructures, like virtual
desktops. The benchmark works independently from the virtualization platform. In this test it ran on Hyper-V. The Login
VSI suite runs realistic workloads that act as virtual users on the server. These workloads contain several real-world
tasks like reading documents in Microsoft Office, playing videos, converting documents and so on. During the test Login
VSI measures the performance based on user experience, meaning that Login VSI measures for each activity how long it
will take (in milliseconds) before an application is started and it appears on the screen for the user. The data that is
collected for each activity is then used to calculate a final performance index3.
Figure 9: Results of Login VSI Benchmark Suite (less is better)
The chart in figure 9 shows that Kaspersky Security for Virtualization | Light Agent has the least impact on the system
performance and provides better response times for the end users. Compared to the performance impact of Kaspersky
Security for Virtualization | Light Agent the impact of Symantec is 40% higher and Trend Micro’s performance impact is
65% higher.
The Login VSI index is a measure of the whole system slowdown when a set of typical office applications and tasks is
performed. The VSI index (N) is measured as a weighted sum of the response times of seven specific “office” operations
for a particular number N of virtual machines running. The final Login VSI index was calculated as the average along all
Login VSI index (N).
3 The official description of the index is available here: http://www.loginvsi.com/pdf/documentation/v3/Login-VSI-37-Documentation.pdf
2.751 3.908 4.5490
500
1.000
1.500
2.000
2.500
3.000
3.500
4.000
4.500
5.000
Kaspersky Security forVirtualization
Symantec EndpointProtection
Trend Micro DeepSecurity
Login VSI Index

Virtual Desktops Security Test Report ©2014 AV-TEST GmbH 12
Figure 10: Average Disk Queue Length over virtual machines and on average
Figure 10 presents the queue of disk operations during the running Login VSI test. A lower value allows a higher number of virtual machines to run simultaneously on a particular hardware without a significant performance degradation. With only a few virtual machines running on the hypervisor the queue was short for all three products. With about ten machines running the values start to differ a bit and with about 20 machines and more the difference increases dramatically.
0
5
10
15
20
25
30
0 4 8 12 16 20 24 28 32 36 40 44 48
Ave
rage
Dis
k Q
ue
ue
Le
ngt
h
Number of running Virtual Machines
Baseline
Kaspersky Security for Virtualization
Symantec Endpoint Protection
Trend Micro Deep Security
0
2
4
6
8
10
12
Ave
rage
Dis
k Q
ue
ue
Le
ngt
h
Baseline
Kaspersky Security for Virtualization
Symantec Endpoint Protection
Trend Micro Deep Security

Virtual Desktops Security Test Report ©2014 AV-TEST GmbH 13
Figure 11: Disk Reads/s over virtual machines and on average
Figure 12: Disk Writes/s over virtual machines and on average
0
200
400
600
800
1.000
1.200
1.400
1.600
0 4 8 12 16 20 24 28 32 36 40 44 48
Dis
k R
ead
s/s
Number of running Virtual Machines
Baseline
Kaspersky Security for Virtualization
Symantec Endpoint Protection
Trend Micro Deep Security
0
200
400
600
800
1.000
1.200
Dis
k R
ead
s/s
Baseline
Kaspersky Security for Virtualization
Symantec Endpoint Protection
Trend Micro Deep Security
0
100
200
300
400
500
600
700
0 4 8 12 16 20 24 28 32 36 40 44 48
Dis
k W
rite
s/s
Number of running Virtual Machines
Baseline
Kaspersky Security for Virtualization
Symantec Endpoint Protection
Trend Micro Deep Security
0
50
100
150
200
250
300
350
400
450
Dis
k W
rite
s/s
Baseline
Kaspersky Security for Virtualization
Symantec Endpoint Protection
Trend Micro Deep Security

Virtual Desktops Security Test Report ©2014 AV-TEST GmbH 14
Figure 11 and 12 represent the amount of read and write operations per second. The more disk operations are
performed by a product the higher the load on the storage system. Trend Micro produces less write operations but lots
of read operations, that should be taken into consideration and juxtaposed to the storage and workload I/O profile
planning.
Figure 13: Average CPU time in %
Figure 13 shows the average CPU utilization by the products. And although there is a little more consumption by
Kaspersky Security for Virtualization | Light Agent, within scale of the whole system, any of the values, including the
difference between the products, is negligibly low and all products present excellent performance here.
Performance: Boot Storm Test As many important components such as CPU, memory and the hard disk are on load during the boot process, the
BootStorm test shows the importance of the performance impact of the installed security solution. An agent-based
security solution is usually loaded at an early point during the boot process and may therefore delay the remaining
startup procedures.
Figure 14: Average Boot Time during the BootStorm Test
1,60,7 0,7
0
5
10
15
20
25
Kaspersky Securityfor Virtualization
SymantecEndpoint
Protection
Trend Micro DeepSecurity
0
20
40
60
80
100
120
140
160
180
Baseline Kaspersky Securityfor Virtualization
Symantec EndpointProtection
Trend Micro DeepSecurity
Bo
ot
tim
e in
s
Average Boot Time

Virtual Desktops Security Test Report ©2014 AV-TEST GmbH 15
Figure 14 shows the average boot time, which was measured during the BootStorm test scenario. All products including
Kaspersky Security for Virtualization at least double the average boot time of the virtual machines. Actually Symantec
delays the boot time to three times of the baseline and Trend Micro delays even four times of the baseline.
Figure 15: Boot Time per Virtual Machine
The chart in figure 15 shows the boot time for each virtual machine. The machines were booted in sequential order
from left to right with a delay of 20 seconds between each other. When the first machine was powered up, there was
still no load on the hypervisor. Therefore the boot time was low. With an increasing number of machines running on the
hypervisor the load increased as well and the boot times became longer. E.g. when 24 virtual machines with Kaspersky
Security for Virtualization were already started the 25th virtual machine took about 100 seconds to boot. In comparison
the 25th virtual machine with Trend Micro took more than twice the time of the Kaspersky machine to boot and more
than four times of the baseline. The chart allows estimating a level of consolidation with a particular solution and
predicting the amount of simultaneously working virtual machines without degrading the whole system, so the lower
the line the better the performance. Kaspersky showed the best results in this test scenario.
0
50
100
150
200
250
1 3 5 7 9 11 13 15 17 19 21 23 25 27 29 31 33 35 37 39 41 43 45 47 49
Bo
ot
tim
e in
s
Boot Time per Virtual MachineTrend MicroDeep Security
SymantecEndpointProtection
KasperskySecurity forVirtualization
Baseline

Virtual Desktops Security Test Report ©2014 AV-TEST GmbH 16
Figure 16: Average Disk Queue Length over virtual machines and on average
Figure 16 presents the queue of disk operations during the sequential boot of the 50 virtual machines with a difference
of 20 seconds among each other. The chart correlates with the boot time (Fig. 15), so it shows the importance of the
storage system to the whole system performance.
Figure 17: Disk Reads/s over virtual machines and on average
0
5
10
15
20
25
30
35
40
0 4 8 12 16 20 24 28 32 36 40 44 48
Ave
rage
Dis
k Q
ue
ue
Le
ngt
h
Number of booted virtual machines
Baseline
Kaspersky Security for Virtualization
Symantec Endpoint Protection
Trend Micro Deep Security
0
5
10
15
20
25
Baseline
Kaspersky Security for Virtualization
Symantec Endpoint Protection
Trend Micro Deep Security
0
500
1.000
1.500
2.000
2.500
3.000
3.500
4.000
4.500
0 4 8 12 16 20 24 28 32 36 40 44 48
Dis
k R
ead
s/s
Number of booted virtual machines
Baseline
Kaspersky Security for Virtualization
Symantec Endpoint Protection
Trend Micro Deep Security
0
500
1.000
1.500
2.000
2.500
3.000
3.500
Baseline
Kaspersky Security for Virtualization
Symantec Endpoint Protection
Trend Micro Deep Security

Virtual Desktops Security Test Report ©2014 AV-TEST GmbH 17
Figure 18: Disk Writes/s over virtual machines and on average
Figure 17 and 18 represent the amount of read and write operations per second. The more disk operations are
performed by a product the higher the load on the storage system. As in the Login VSI test Trend Micro produces less
write operations but lots of read operations, that should be taken into consideration and juxtaposed to the storage and
workload I/O profile planning.
Figure 19: Average CPU time over virtual machines and on average
Figure 19 shows the average CPU utilization by the products during the Boot Storm scenario. And although there is a
little higher consumption by Kaspersky Security for Virtualization and Trend Micro Deep Security, within the scale of the
whole system, any of the values, including the difference between the products, is negligibly low and all products
present excellent performance here.
0
100
200
300
400
500
600
700
800
0 4 8 12 16 20 24 28 32 36 40 44 48
Dis
k W
rite
s/s
Number of booted virtual machines
Baseline
Kaspersky Security for Virtualization
Symantec Endpoint Protection
Trend Micro Deep Security
0
50
100
150
200
250
300
350
400
Baseline
Kaspersky Security for Virtualization
Symantec Endpoint Protection
Trend Micro Deep Security
0
1
2
3
4
5
6
7
8
0 4 8 12 16 20 24 28 32 36 40 44 48
CP
U t
ime
in %
Number of booted virtual machines
Baseline
Kaspersky Security for Virtualization
Symantec Endpoint Protection
Trend Micro Deep Security
0,8 1,4 0,9 1,3
0
5
10
15
20
Baseline
Kaspersky Security for Virtualization
Symantec Endpoint Protection
Trend Micro Deep Security
Virtual Desktops Security Test Report ©2014 AV-TEST GmbH 18
Summary In this comparative test of enterprise security solutions for virtual desktop infrastructure we can see high achievements
in the protection tests by all three products with no significant difference between them in different tests. In the “Real-
World Test” Trend Micro Deep Security missed one attack, while Kaspersky Security for Virtualization and Symantec
Endpoint Protection blocked all attacks successfully. At the same time Trend Micro achieved the best detection rate of
the three products in the “Prevalent Malware Detection Test”, but AV-TEST’s detection score shows that Trend Micro
and Kaspersky Lab are on the same level. Symantec’s detection rate was slightly behind. Although Trend Micro missed a
real-world attack, it has to be kept in mind that the number of tested real-world attacks is comparatively low. With an
adequate number of real-world samples the total detection rates would probably align with each other.
A notable difference was measured in the performance test scenarios. When the security solution causes too much load
on the hypervisor, you have to deploy fewer machines to achieve a similar level of performance or you have to invest in
better hardware to run the same number of machines.
Comparing the three solutions in the Performance part of the test Kaspersky Security for Virtualization | Light Agent
showed the least performance impact on the virtual machines.
Virtual Desktops Security Test Report ©2014 AV-TEST GmbH 19
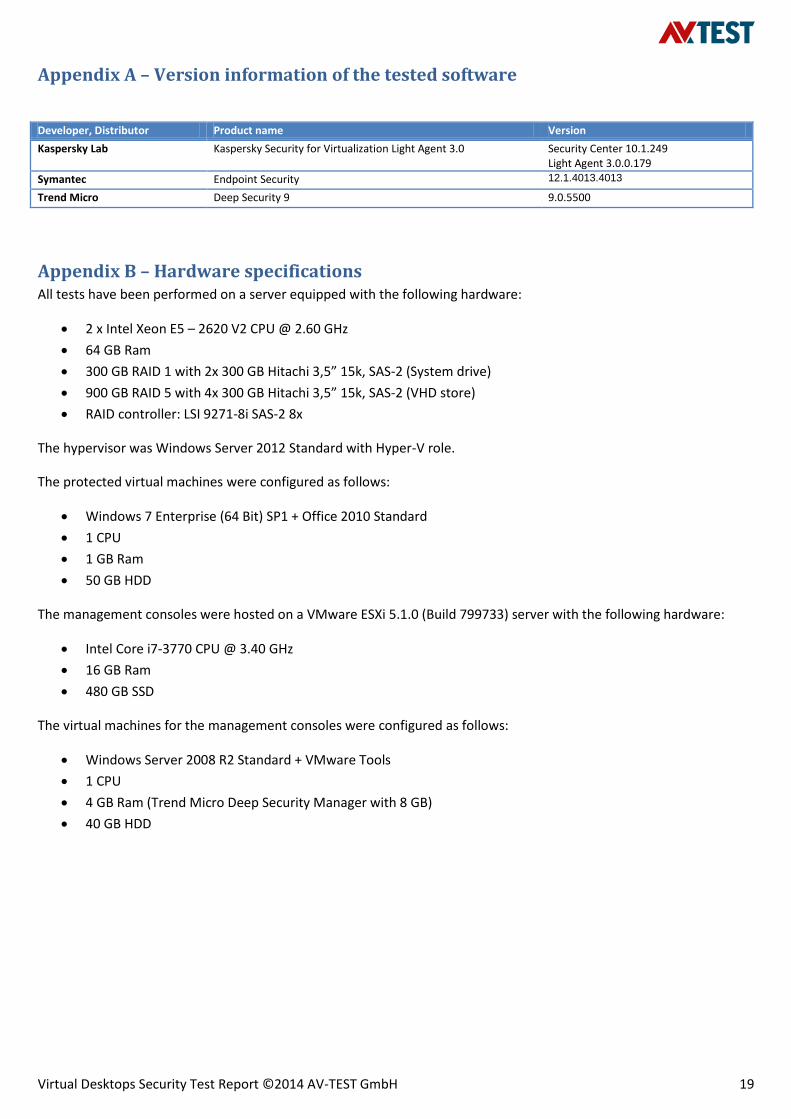
Appendix A – Version information of the tested software
Developer, Distributor Product name Version
Kaspersky Lab Kaspersky Security for Virtualization Light Agent 3.0 Security Center 10.1.249 Light Agent 3.0.0.179
Symantec Endpoint Security 12.1.4013.4013
Trend Micro Deep Security 9 9.0.5500
Appendix B – Hardware specifications All tests have been performed on a server equipped with the following hardware:
2 x Intel Xeon E5 – 2620 V2 CPU @ 2.60 GHz
64 GB Ram
300 GB RAID 1 with 2x 300 GB Hitachi 3,5” 15k, SAS-2 (System drive)
900 GB RAID 5 with 4x 300 GB Hitachi 3,5” 15k, SAS-2 (VHD store)
RAID controller: LSI 9271-8i SAS-2 8x
The hypervisor was Windows Server 2012 Standard with Hyper-V role.
The protected virtual machines were configured as follows:
Windows 7 Enterprise (64 Bit) SP1 + Office 2010 Standard
1 CPU
1 GB Ram
50 GB HDD
The management consoles were hosted on a VMware ESXi 5.1.0 (Build 799733) server with the following hardware:
Intel Core i7-3770 CPU @ 3.40 GHz
16 GB Ram
480 GB SSD
The virtual machines for the management consoles were configured as follows:
Windows Server 2008 R2 Standard + VMware Tools
1 CPU
4 GB Ram (Trend Micro Deep Security Manager with 8 GB)
40 GB HDD

Virtual Desktops Security Test Report ©2014 AV-TEST GmbH 20
Appendix C – Threat Landscape Overview With the increasing number of threats that is being released and spreading through the Internet these days, the danger
of getting infected is increasing as well. A few years back there were new viruses released every few days. This has
grown to several thousand new threats per hour.
Figure 20: New samples added per year
In the year 2000, AV-TEST received more than 170,000 new samples, and in 2013 the number of new samples grew to
more than 80,000,000 new samples. The numbers continue to grow in the year 2014 with already over 20 million new
samples in the first quarter. The growth of these numbers is displayed in Figure 20.
Appendix D – AV-TEST detection score calculation
Score Detection Rate
0 0
1 96.00%
1.5 96.50%
2 97.00%
2.5 97.50%
3 98.00%
3.5 98.50%
4 98.76%
4.5 99.02%
5 99.28%
5.5 99.54%
6 99.80%
The detection rate for a score of 3.5 points bases on the industry average detection rate from AV-TEST’s certification
tests in 2013. The detection rate for 6 points is set to a fixed threshold of 99.8%. The steps between 3.5 and 6 points are
divided equally. Below 3.5 points the steps are fixed to 0.5%.
Copyright © 2014 by AV-TEST GmbH, Klewitzstr. 7, 39112 Magdeburg, Germany
Phone +49 (0) 391 60754-60, Fax +49 (0) 391 60754-69, Web http://www.av-test.org
0
20.000.000
40.000.000
60.000.000
80.000.000
100.000.000
120.000.000
2005 2006 2007 2008 2009 2010 2011 2012 2013 2014*
Jan Feb Mar Apr May Jun Jul Aug Sep Oct Nov Dec Estimated