Orthotopic Heart and Combined Heart Liver Transplantation ...
Virtual Cross-Matching in Heart TransplantationLarge scale simulation of survival after heart
transplantation using Artificial Neural Networks
Johan Nilsson Associate Professor
Consultant Cardiothoracic Surgeon
!
The position
• Surgical Director, Lund Heart Transplant Program, Skane University Hospital, since 2013
• Investigator Director, Artificial Intelligence in Cardiothoracic Sciences, Lund University, since 2008
• Deputy Chairman, Swedish Cardiothoracic Registry since 2011
• Delegate, Scandiatransplant Council of Representativessince 2010
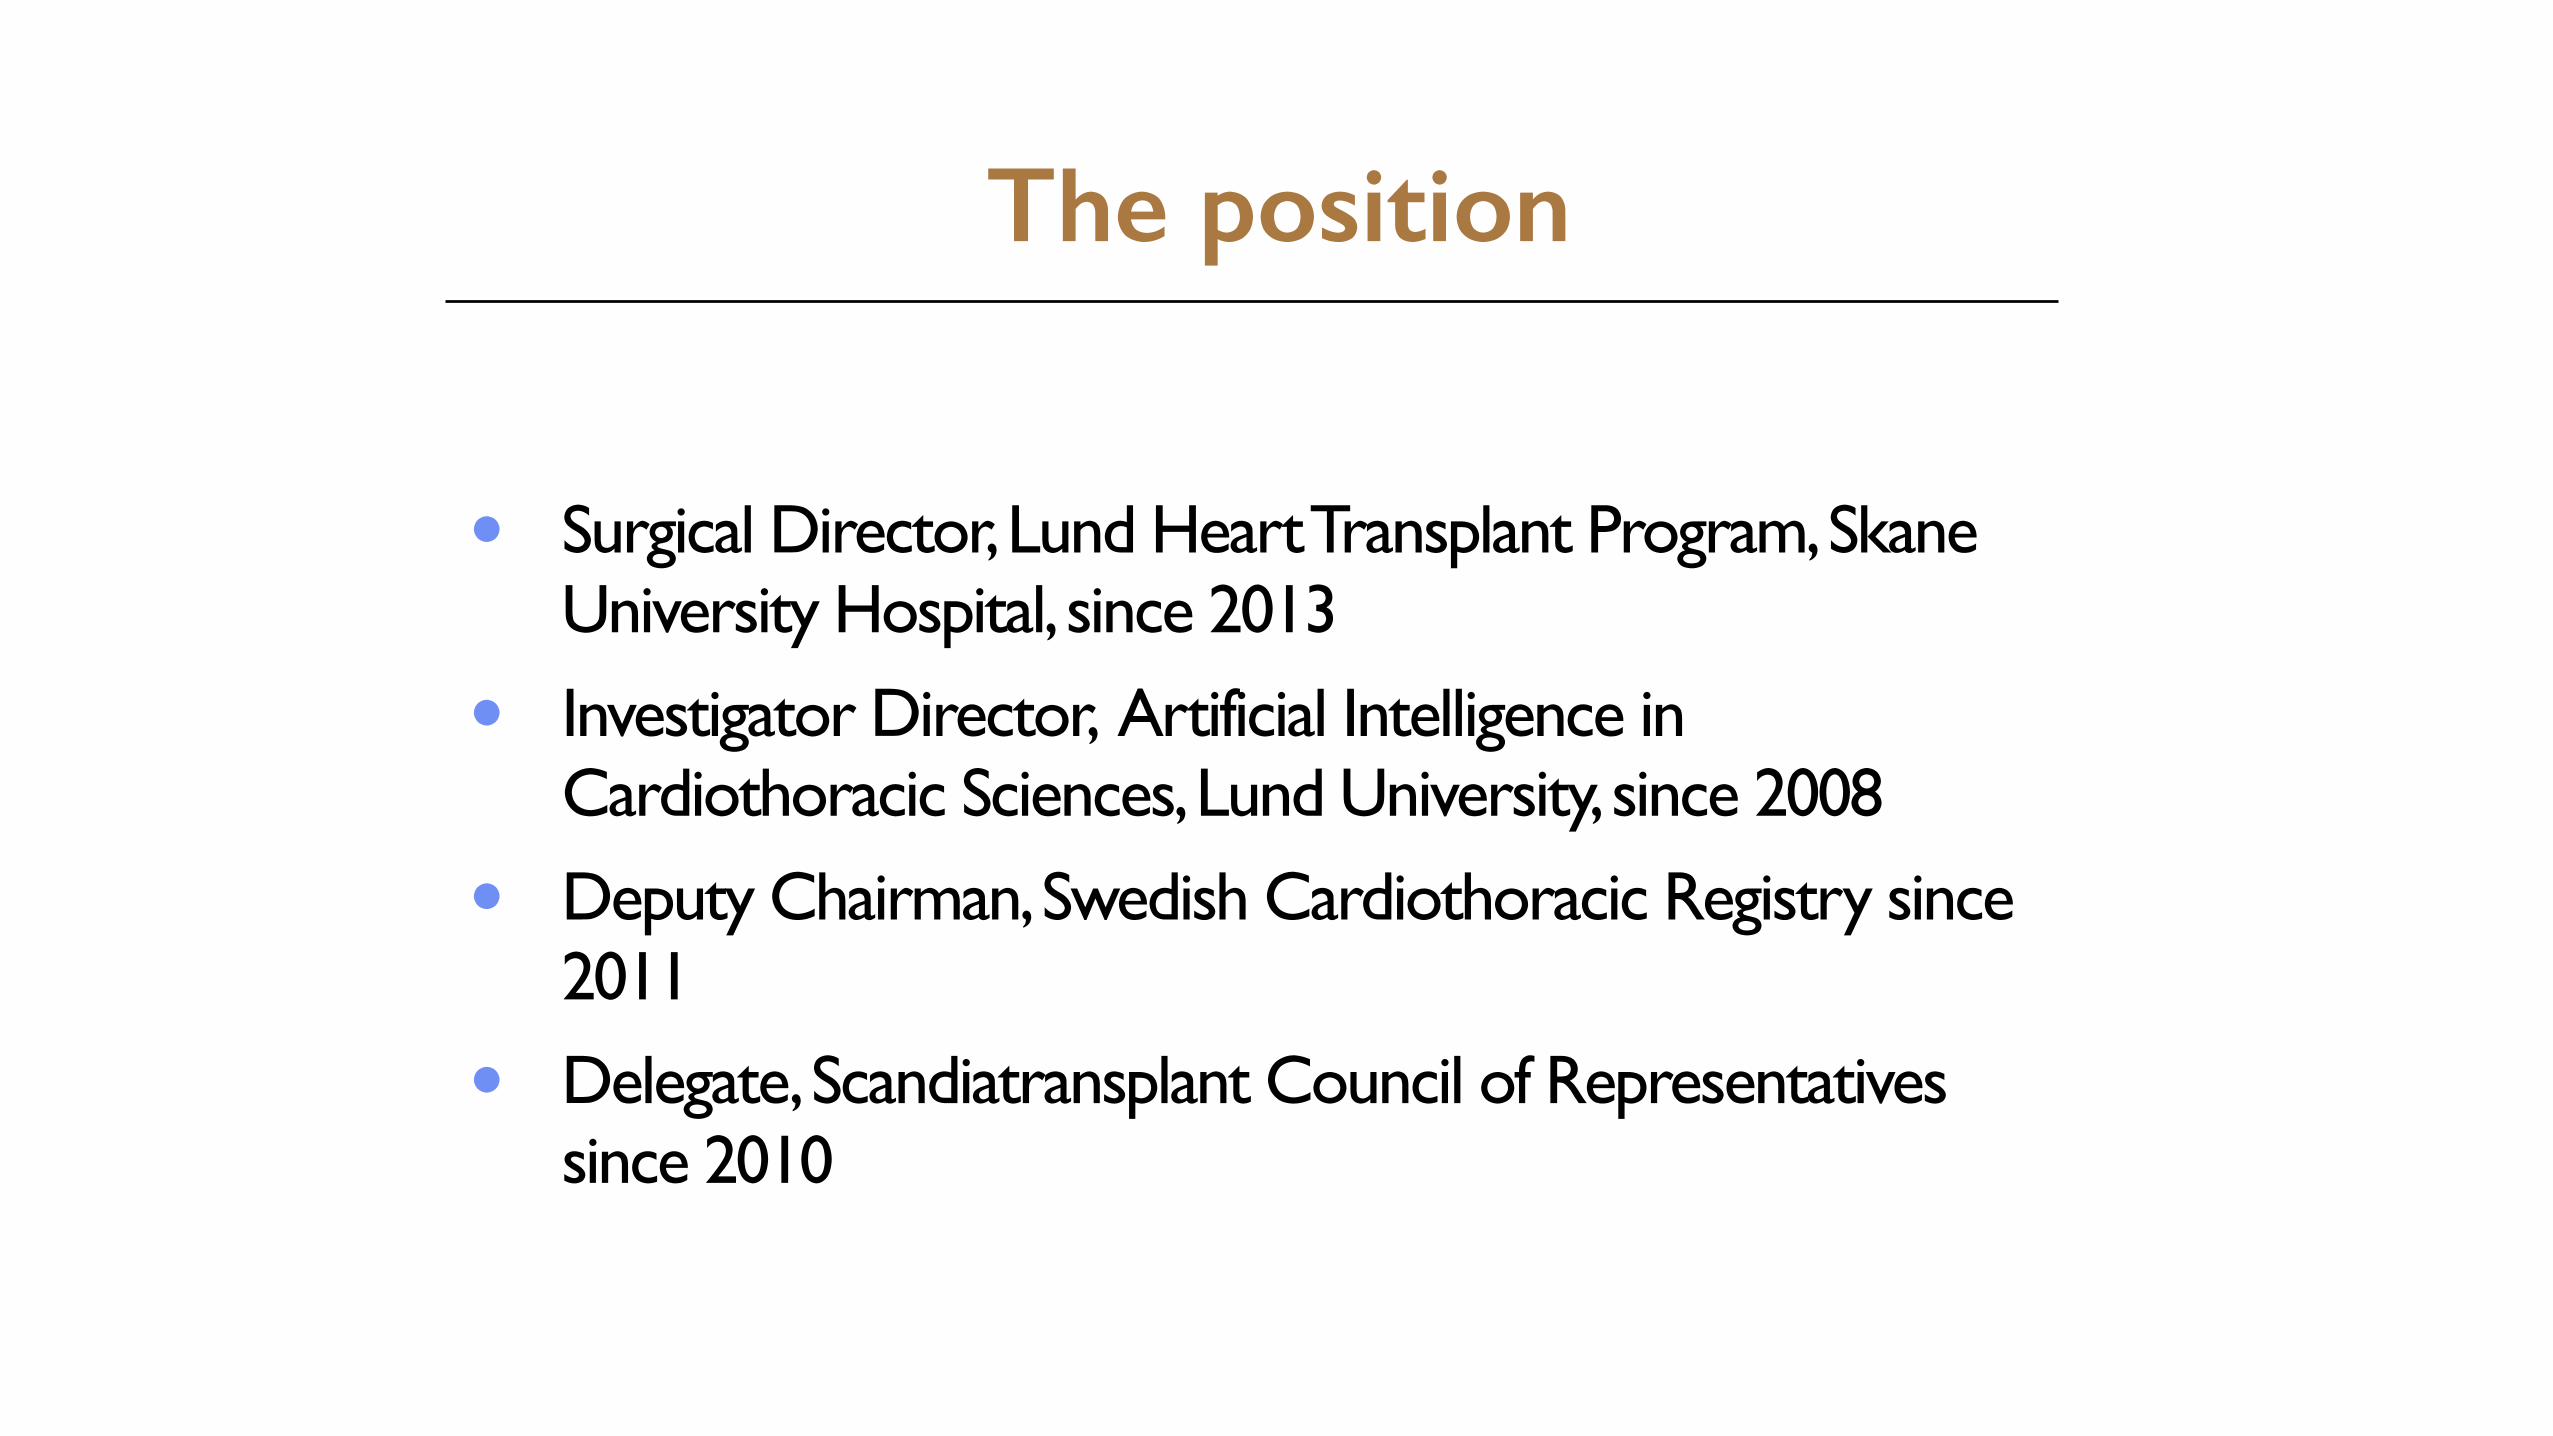
LUND UNIVERSITY• One of Europe’s leading universities
• Education and research within; engineering, science, law, social sciences, economics and management, medicine, humanities, theology, fine art, music and theatre
• 47 000 students and 6 300 staff from all over the world
• 680 partner universities in more than 50 countries
SKÅNE UNIVERSITY HOSPITAL• Third largest of Sweden's seven university
hospitals
• 12 500 employees
• The department of Cardiothoracic Surgery
• 1 400 open heart surgery cases
• 55 thoracic transplantations• It is one of the two hospital which are allowed to
perform heart and lung transplantation in Sweden. The other hospital is Sahlgrenska in Gothenburg.
Lund University, Artificial Intelligence in Cardiothoracic Science (http://www.med.lu.se/aicts)
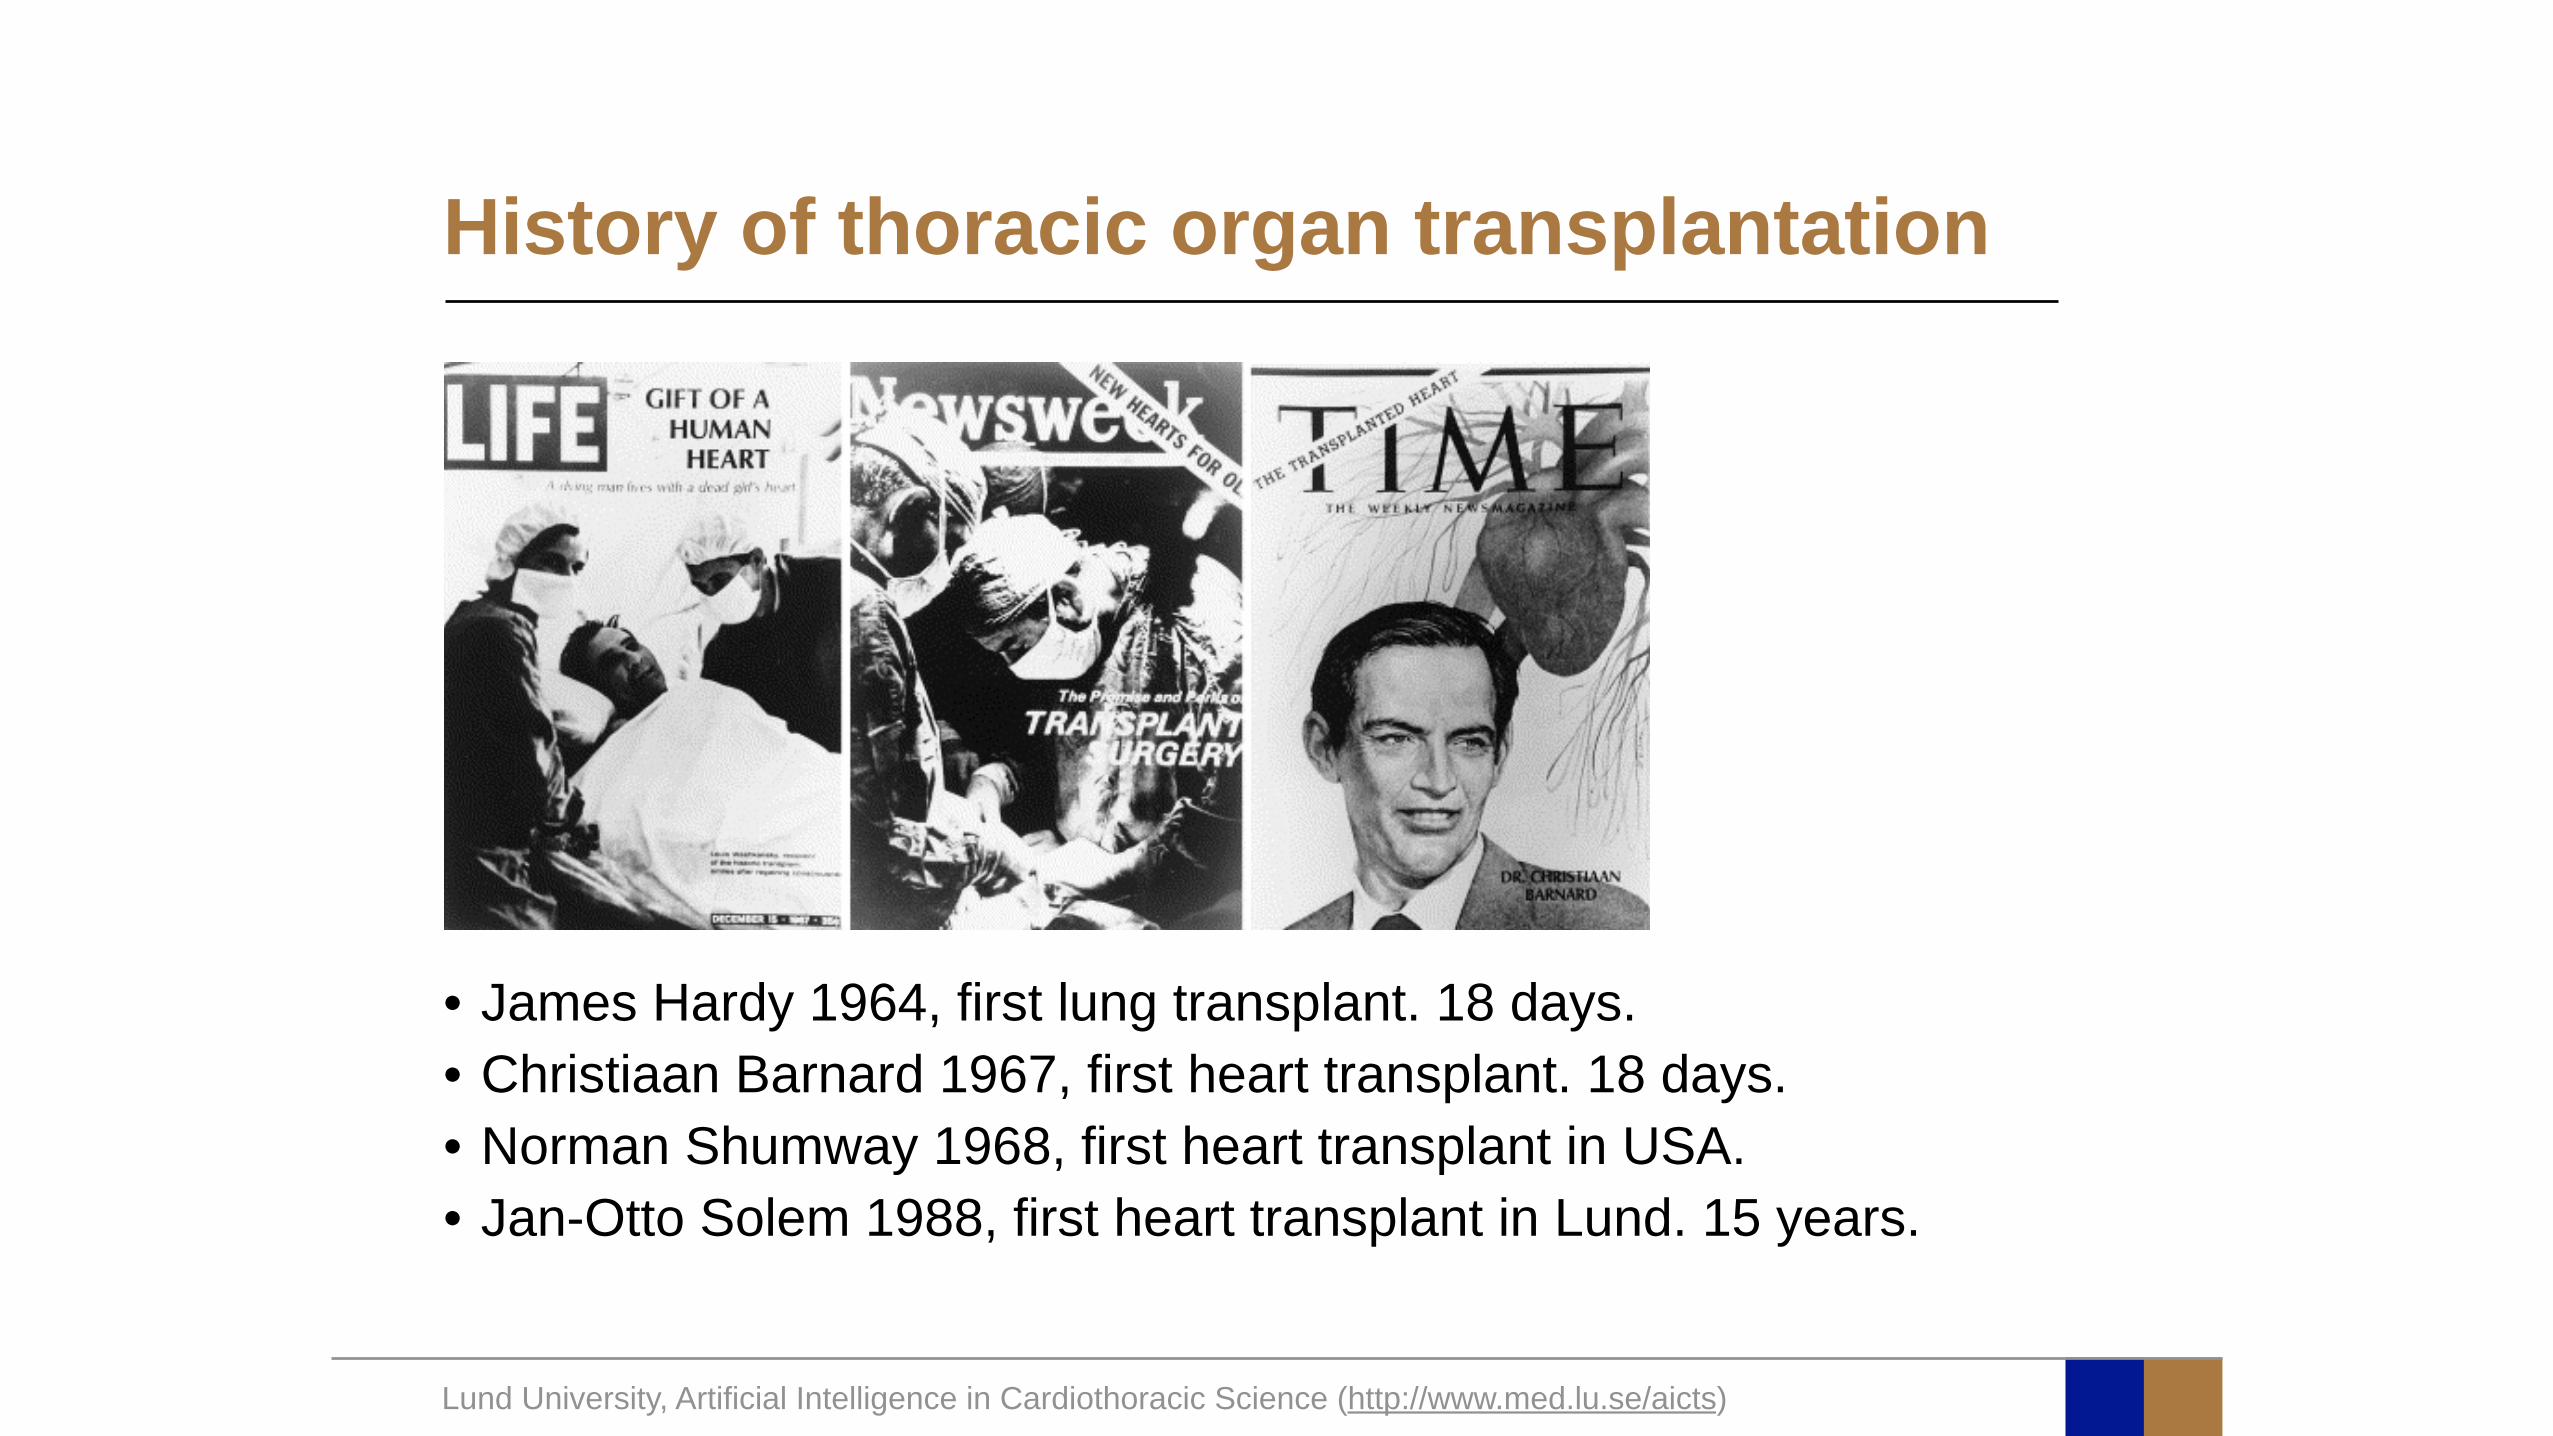
History of thoracic organ transplantation
• James Hardy 1964, first lung transplant. 18 days. • Christiaan Barnard 1967, first heart transplant. 18 days. • Norman Shumway 1968, first heart transplant in USA. • Jan-Otto Solem 1988, first heart transplant in Lund. 15 years.
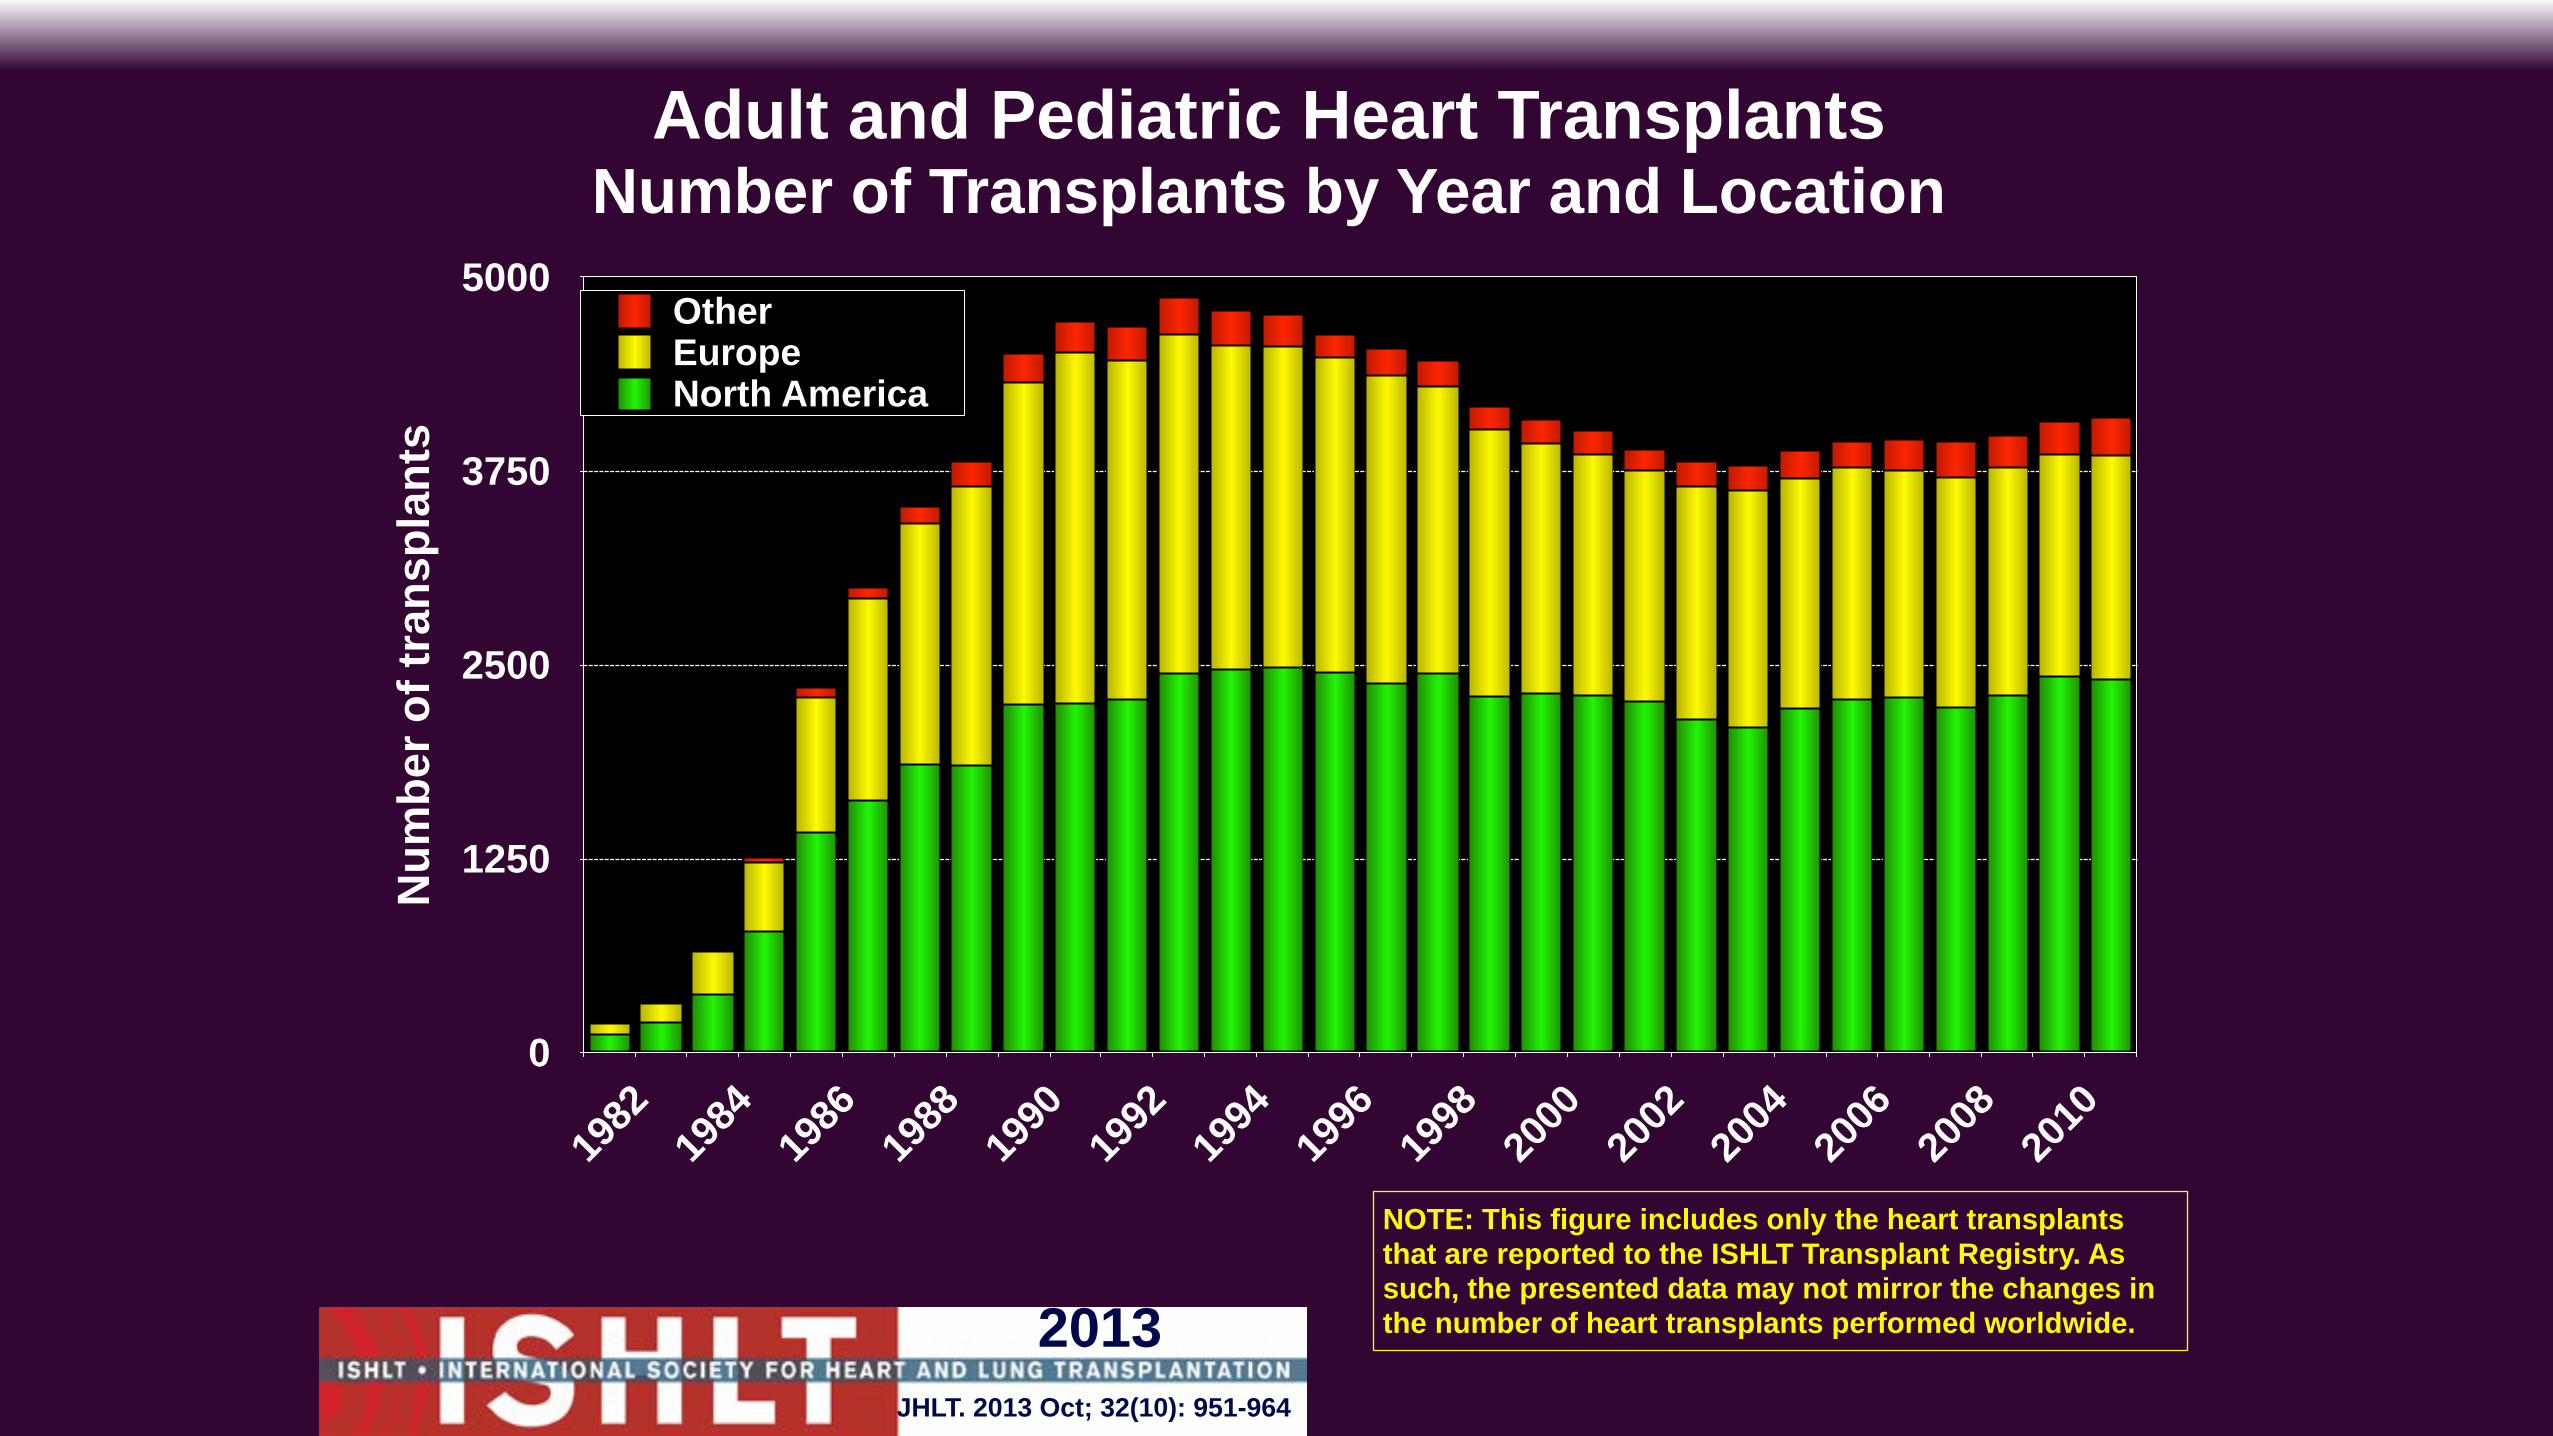
Adult and Pediatric Heart TransplantsNumber of Transplants by Year and Location
Num
ber o
f tra
nspl
ants
0
1250
2500
3750
5000
1982
1984
1986
1988
1990
1992
1994
1996
1998
2000
2002
2004
2006
2008
2010
North AmericaEuropeOther
NOTE: This figure includes only the heart transplants that are reported to the ISHLT Transplant Registry. As such, the presented data may not mirror the changes in the number of heart transplants performed worldwide.
JHLT. 2013 Oct; 32(10): 951-964
2013
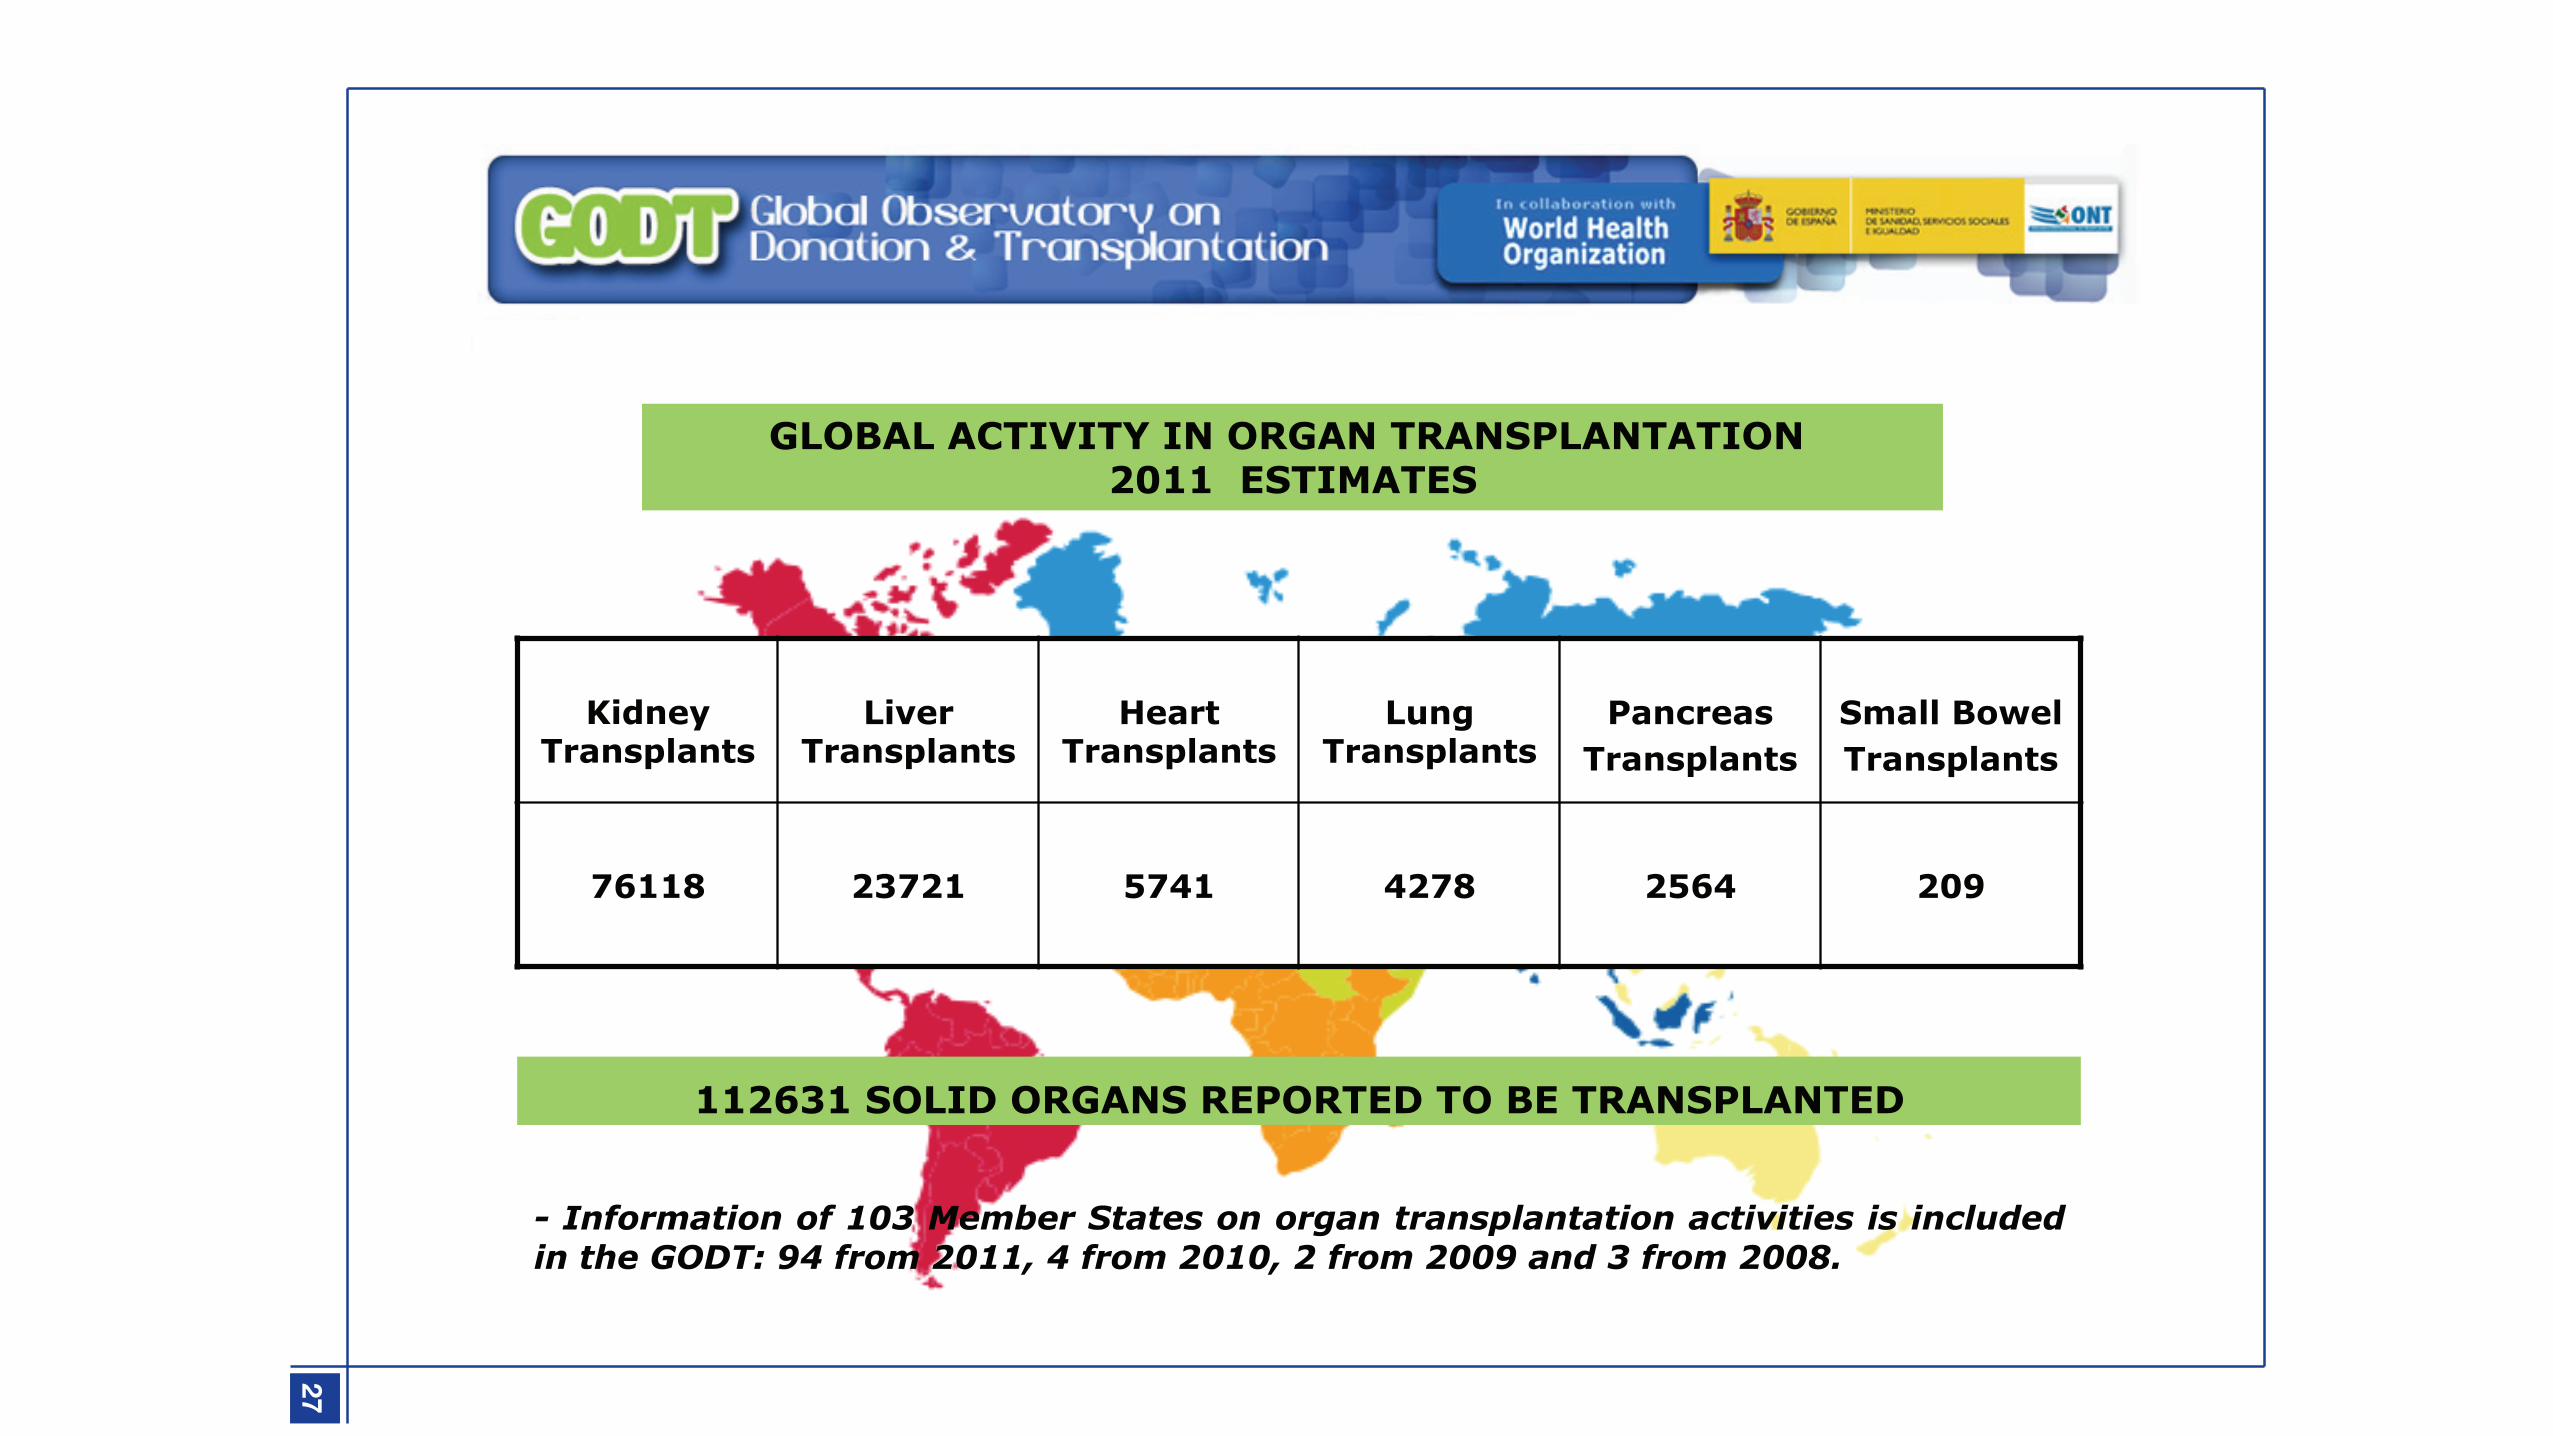
112631 SOLID ORGANS REPORTED TO BE TRANSPLANTED
Kidney
Transplants
Liver
Transplants
Heart
Transplants
Lung
Transplants
Pancreas
Transplants
Small Bowel Transplants
76118 23721 5741 4278 2564 209
- Information of 103 Member States on organ transplantation activities is included in the GODT: 94 from 2011, 4 from 2010, 2 from 2009 and 3 from 2008.
GLOBAL ACTIVITY IN ORGAN TRANSPLANTATION 2011 ESTIMATES
27
1-NEWSLETTER 2013_aula m
edica 10/10/13 18:13 Página 27
010
020
030
0N
umbe
r of d
onor
s
Donors Heart transplanted
1983
1984
1985
1986
1987
1988
1989
1990
1991
1992
1993
1994
1995
1996
1997
1998
1999
2000
2001
2002
2003
2004
2005
2006
2007
2008
2009
2010
2011
2012
2013
1983
1984
1985
1986
1987
1988
1989
1990
1991
1992
1993
1994
1995
1996
1997
1998
1999
2000
2001
2002
2003
2004
2005
2006
2007
2008
2009
2010
2011
2012
2013
Denmark FinlandIsland EuropeNorway SwedenIceland
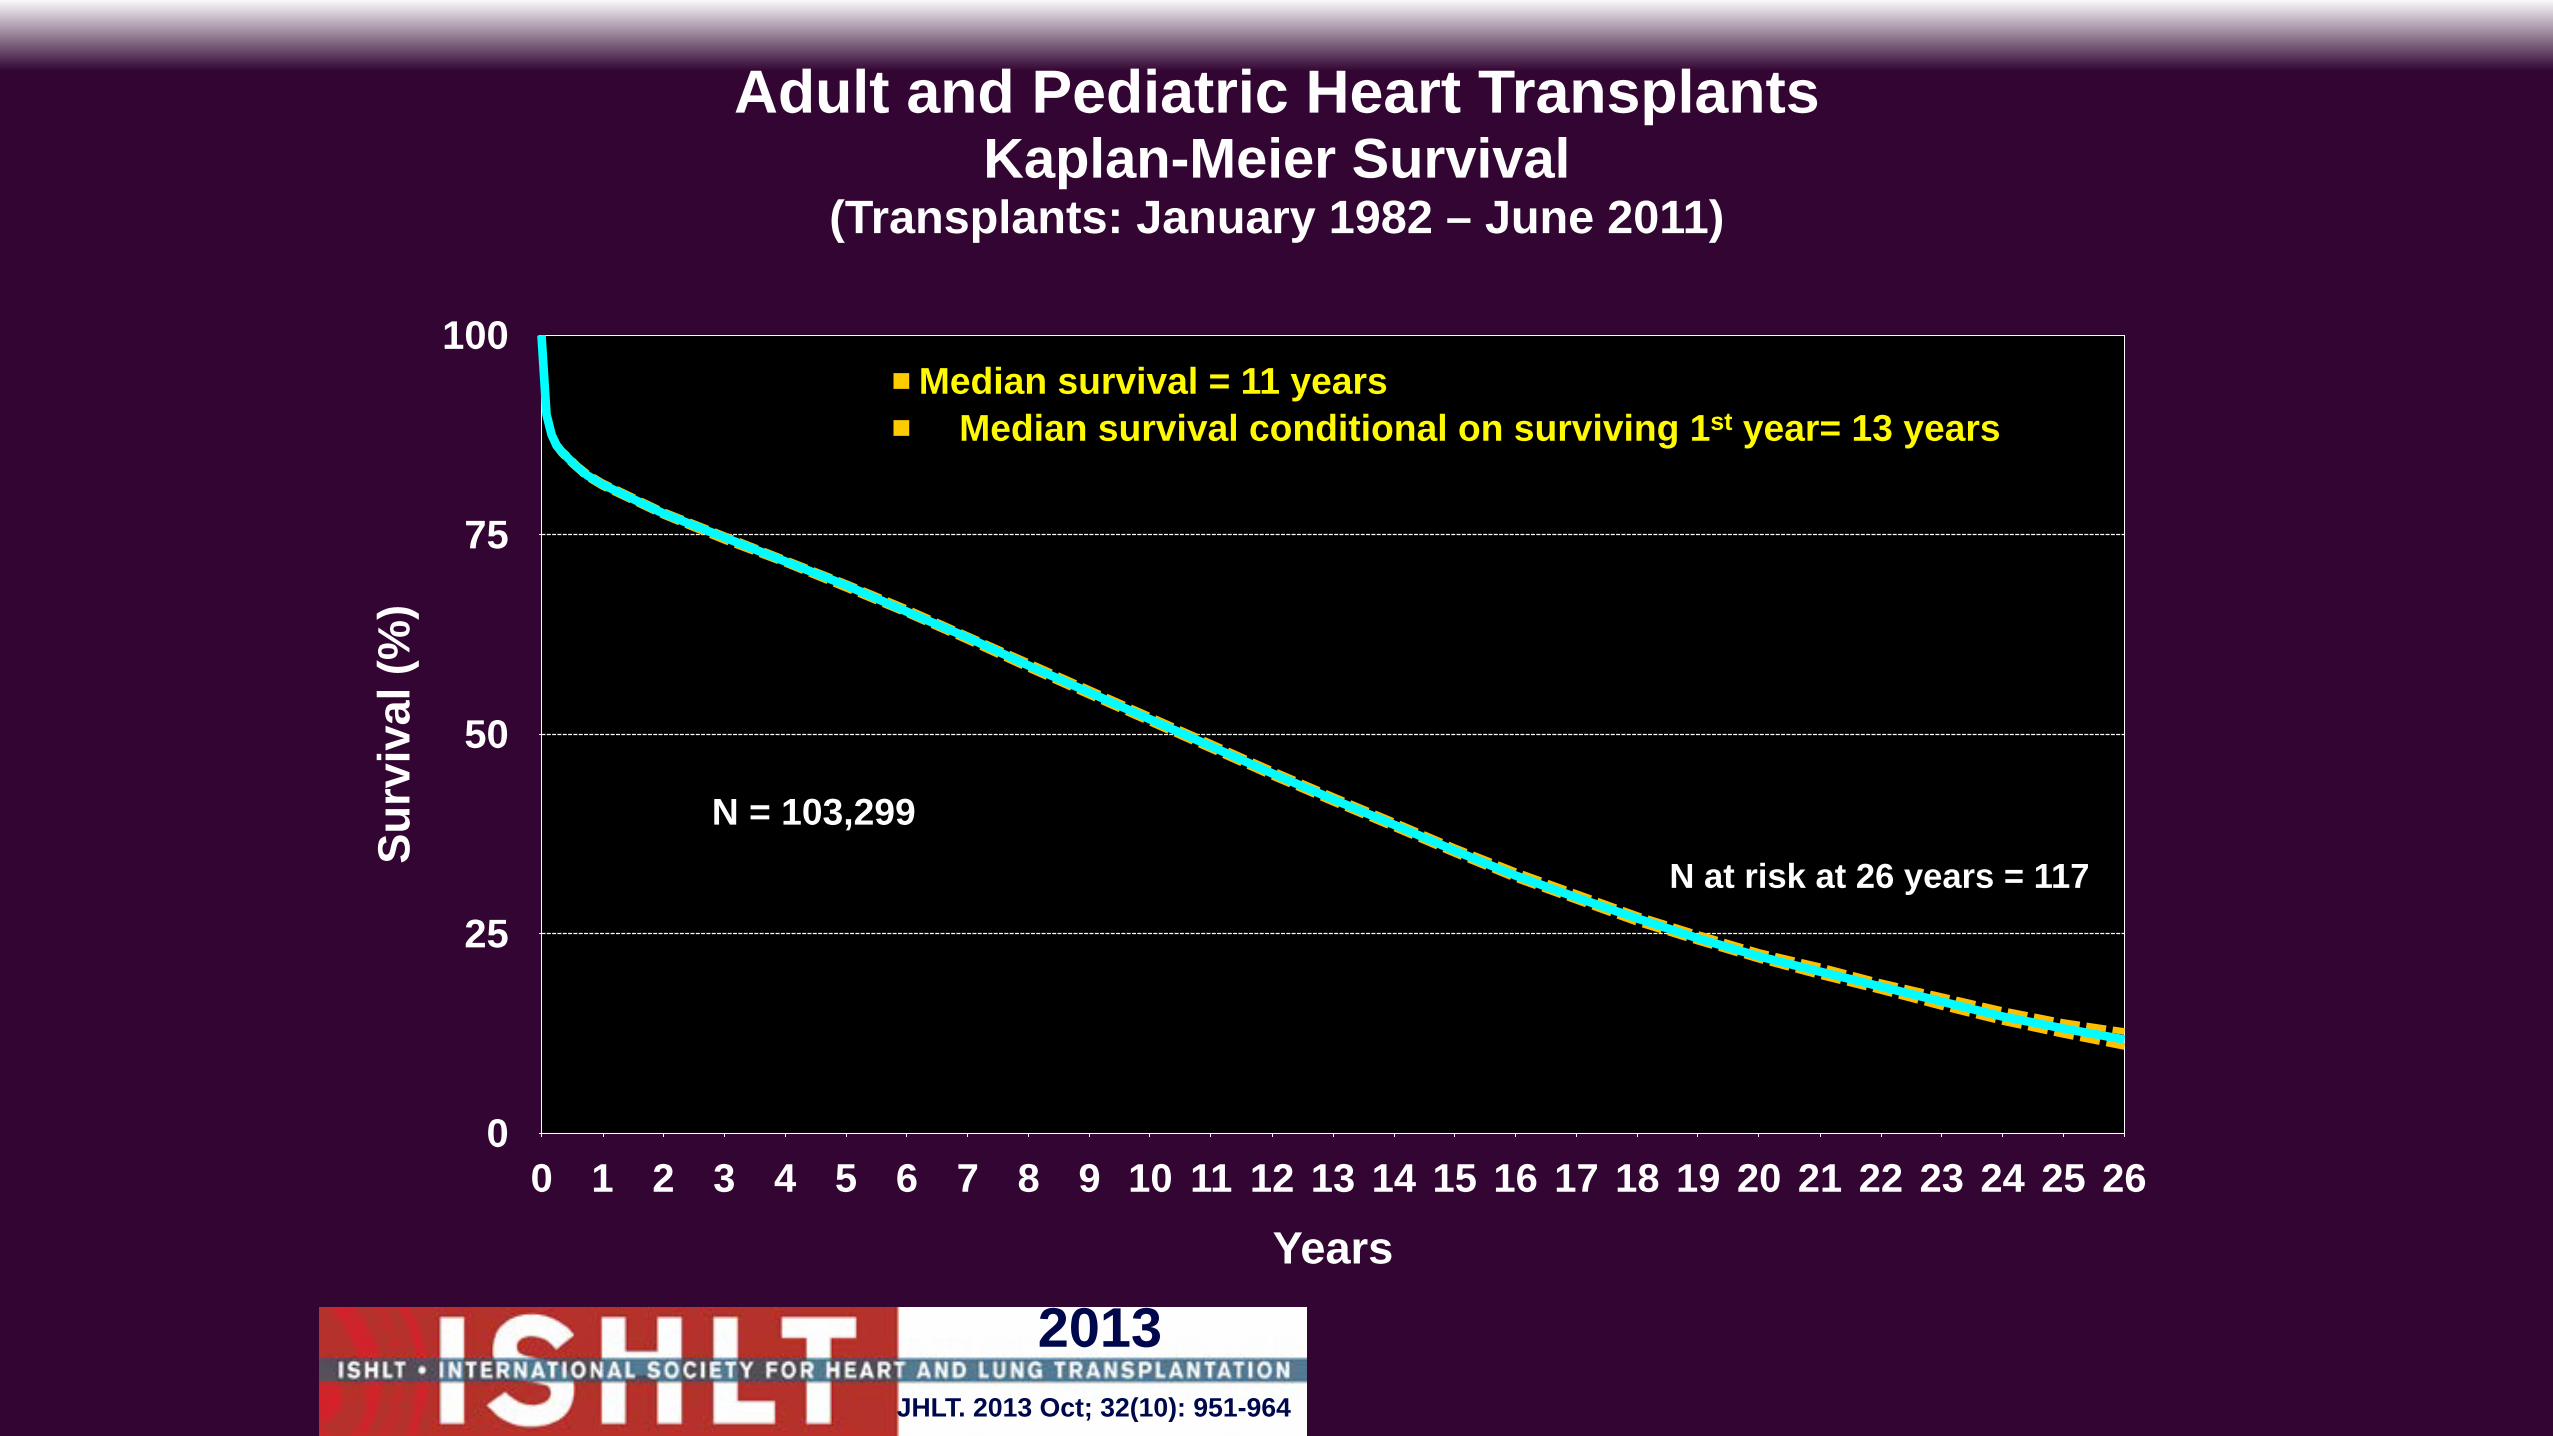
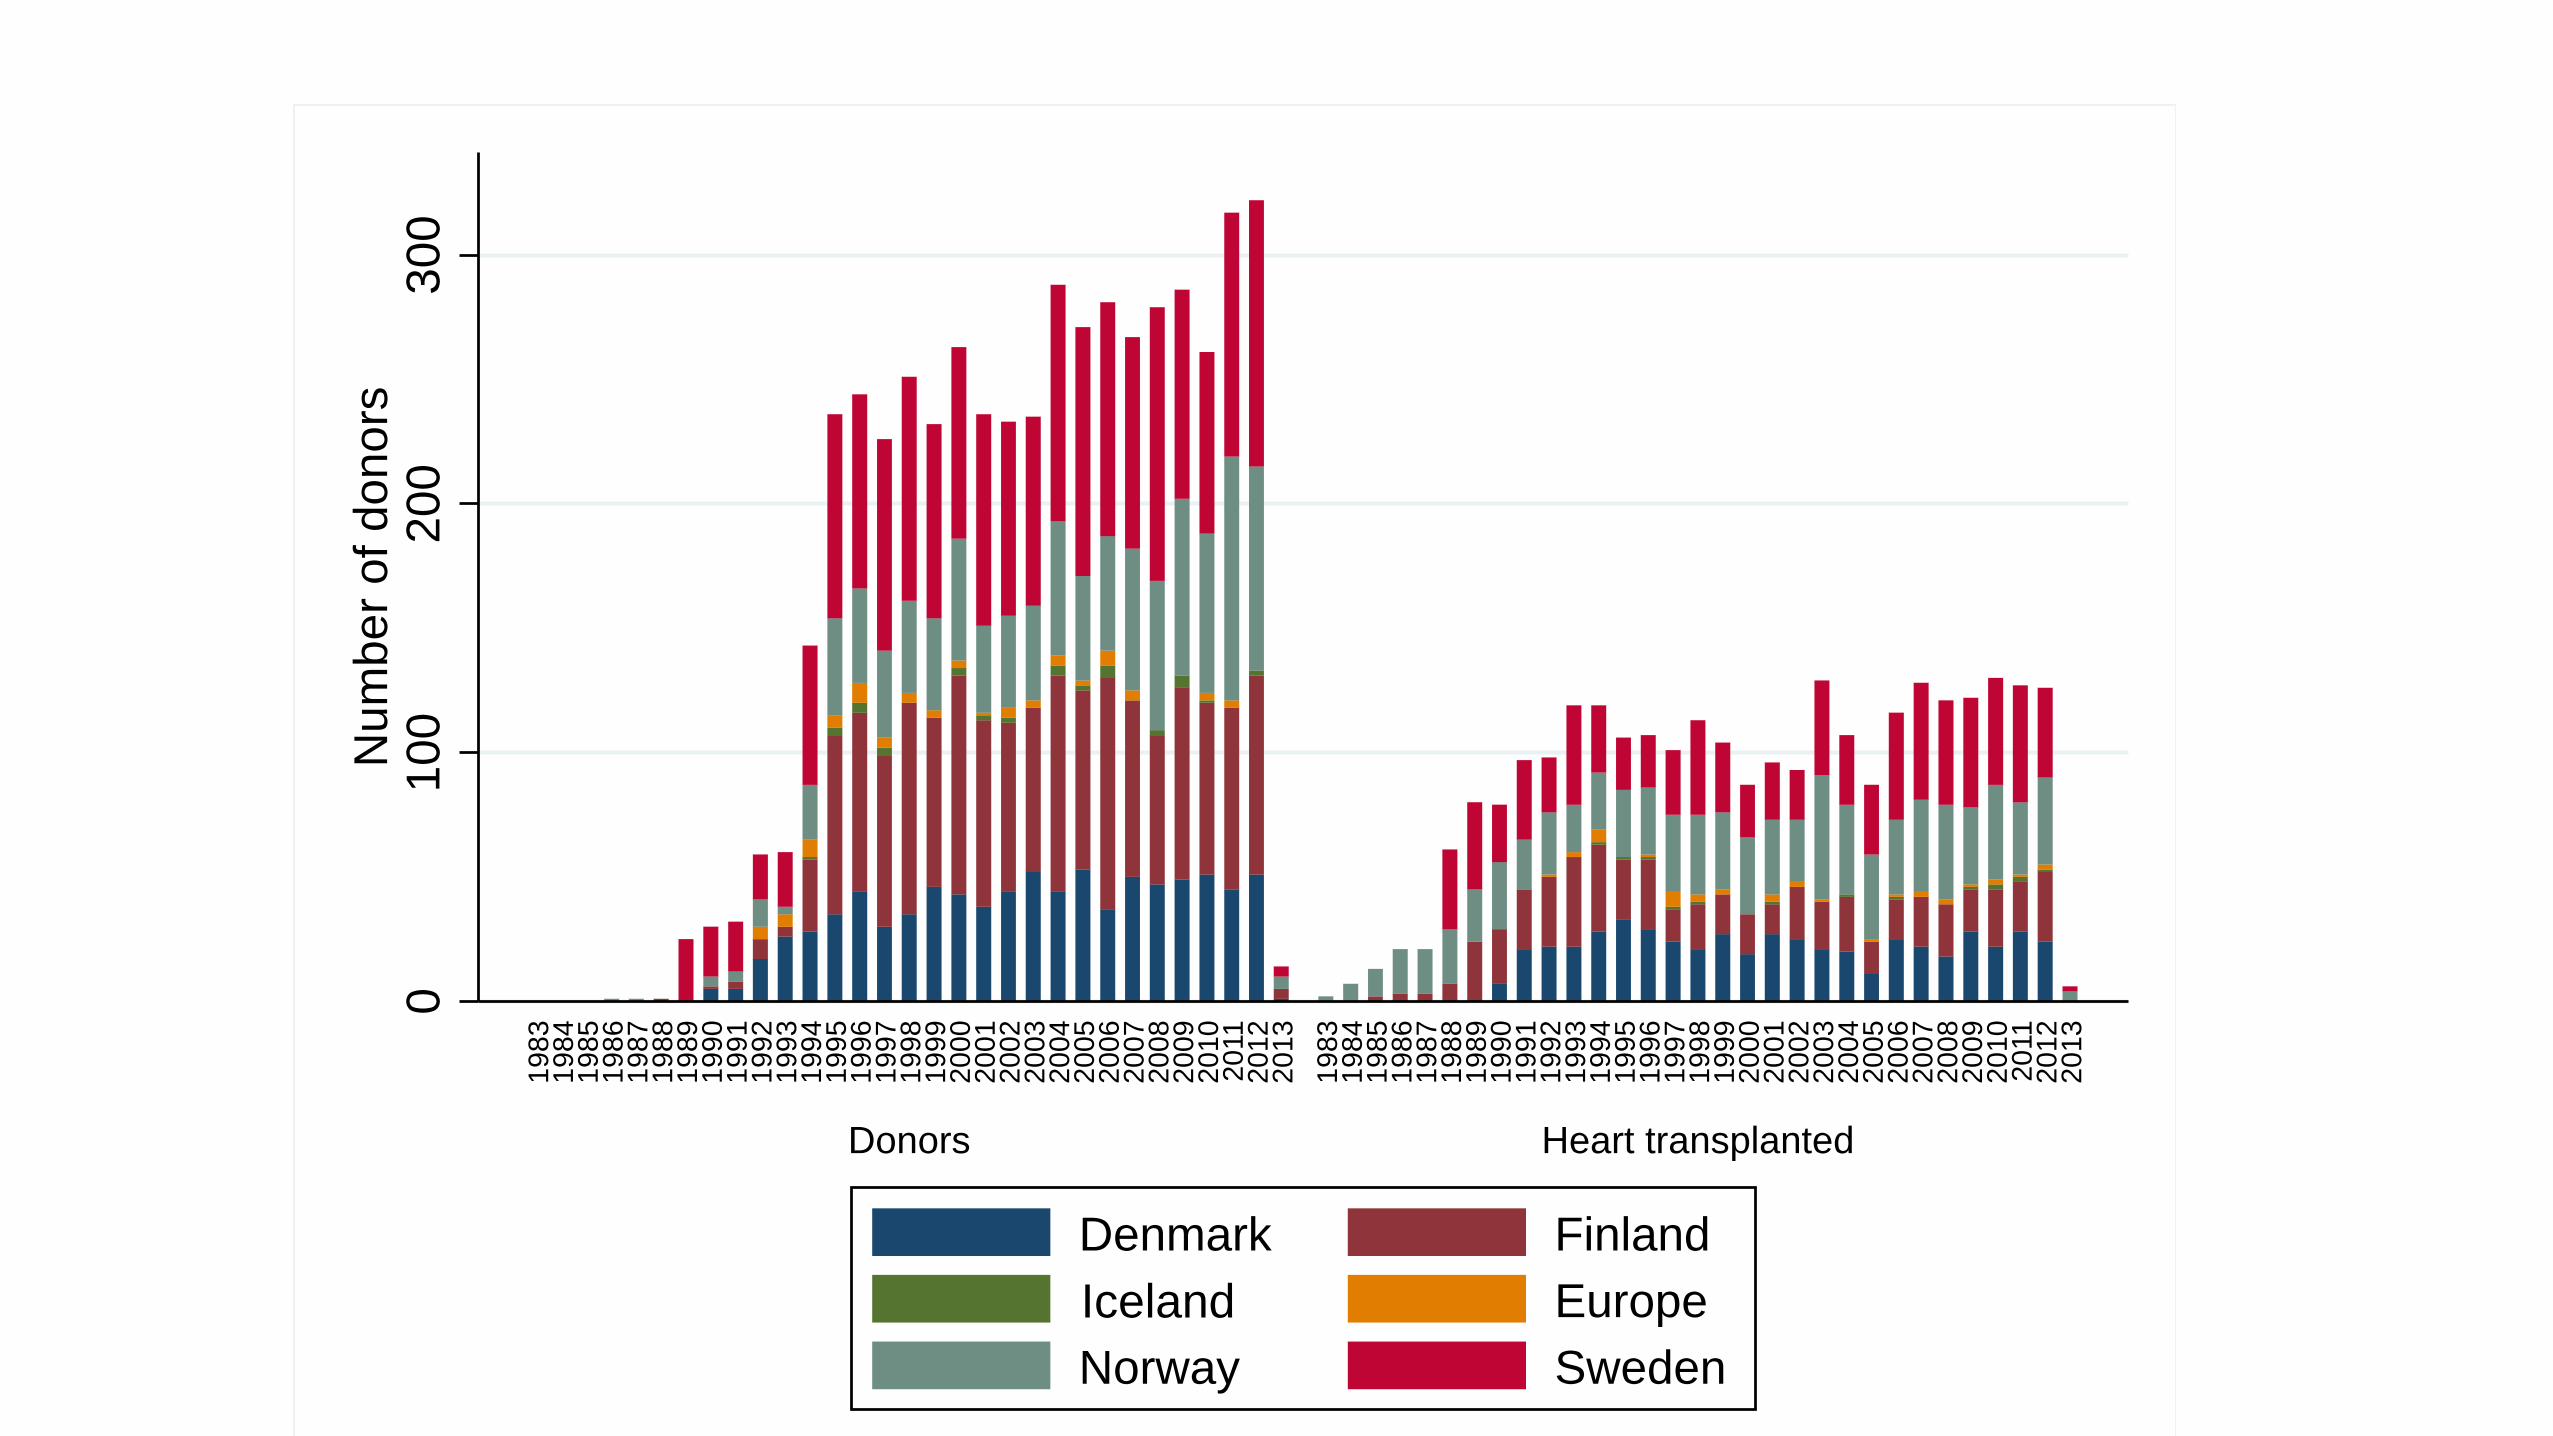
Adult and Pediatric Heart TransplantsKaplan-Meier Survival
(Transplants: January 1982 – June 2011)
Surv
ival
(%)
0
25
50
75
100
Years0 1 2 3 4 5 6 7 8 9 10 11 12 13 14 15 16 17 18 19 20 21 22 23 24 25 26
!Median survival = 11 years ! Median survival conditional on surviving 1st year= 13 years
N = 103,299N at risk at 26 years = 117
JHLT. 2013 Oct; 32(10): 951-964
2013

The Challenge
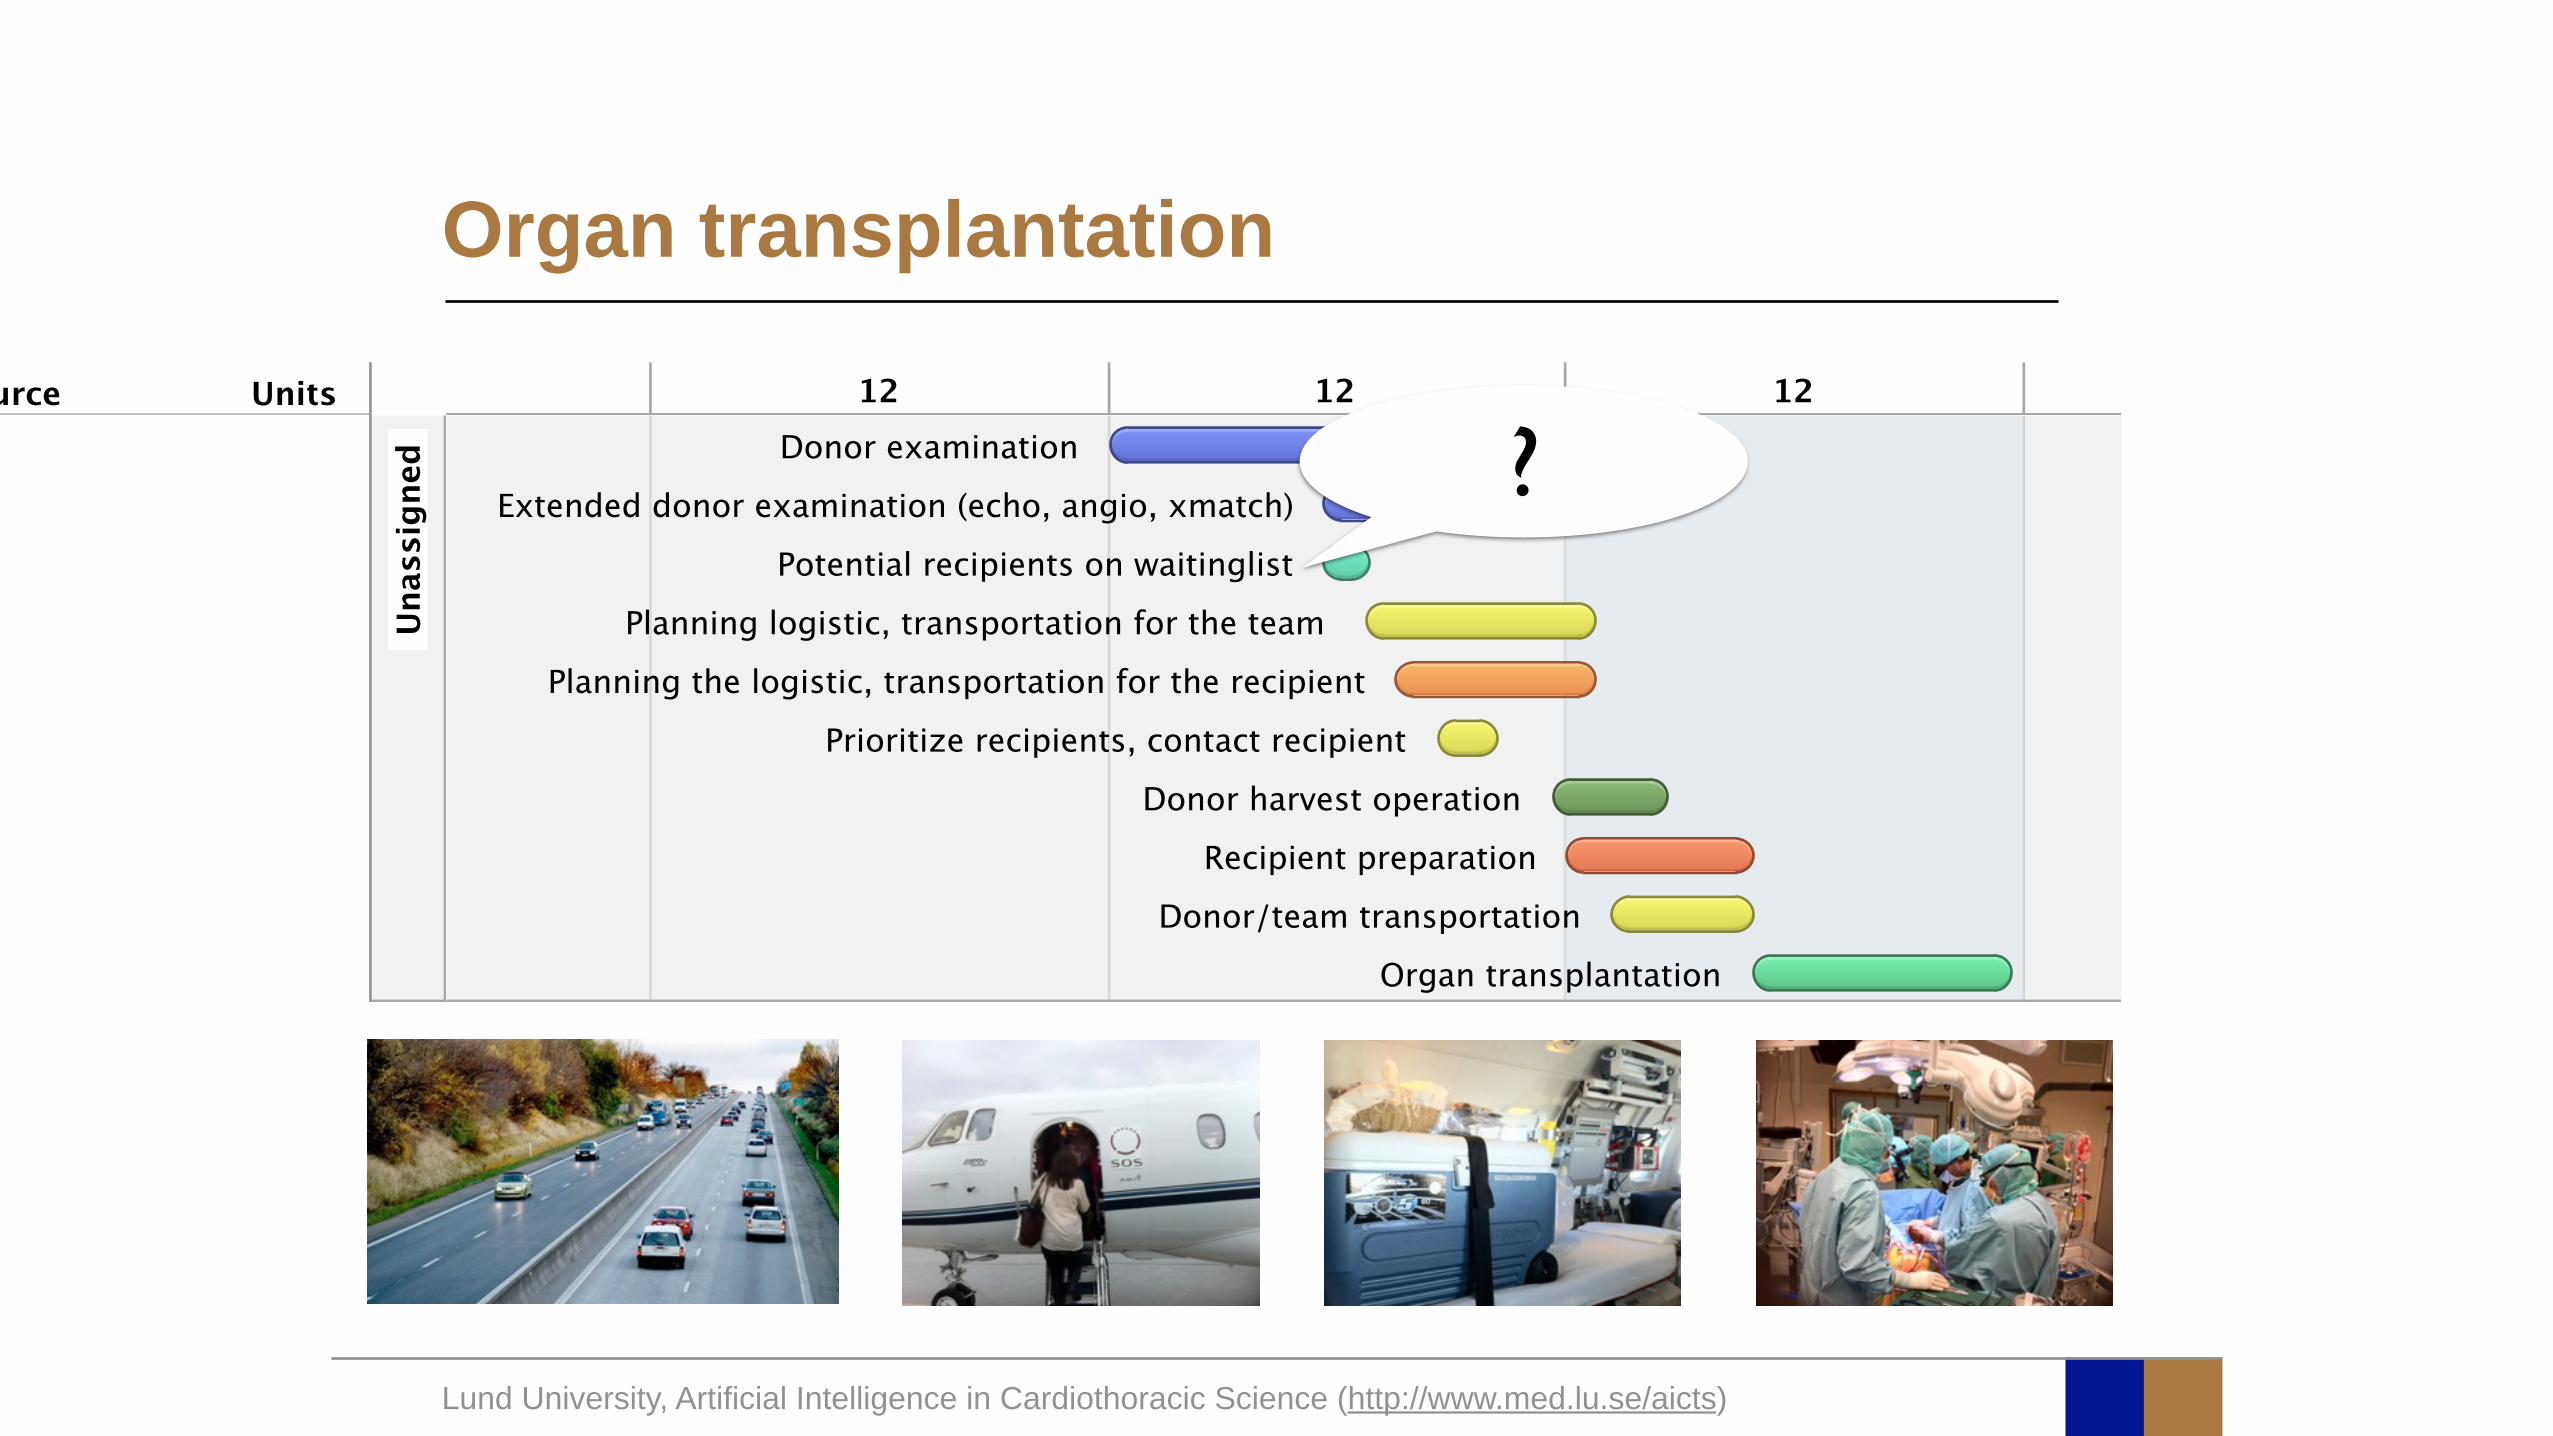
Lund University, Artificial Intelligence in Cardiothoracic Science (http://www.med.lu.se/aicts)
Type Resource UnitsUnassigned
Donor examination
Potential recipients on waitinglist
Extended donor examination (echo, angio, xmatch)
Prioritize recipients, contact recipient
Planning the logistic, transportation for the recipient
Planning logistic, transportation for the team
Donor harvest operation
Donor/team transportation
Recipient preparation
Organ transplantation
12 12 12 12 12
Organ transplantation
?
Lund University, Artificial Intelligence in Cardiothoracic Science (http://www.med.lu.se/aicts)
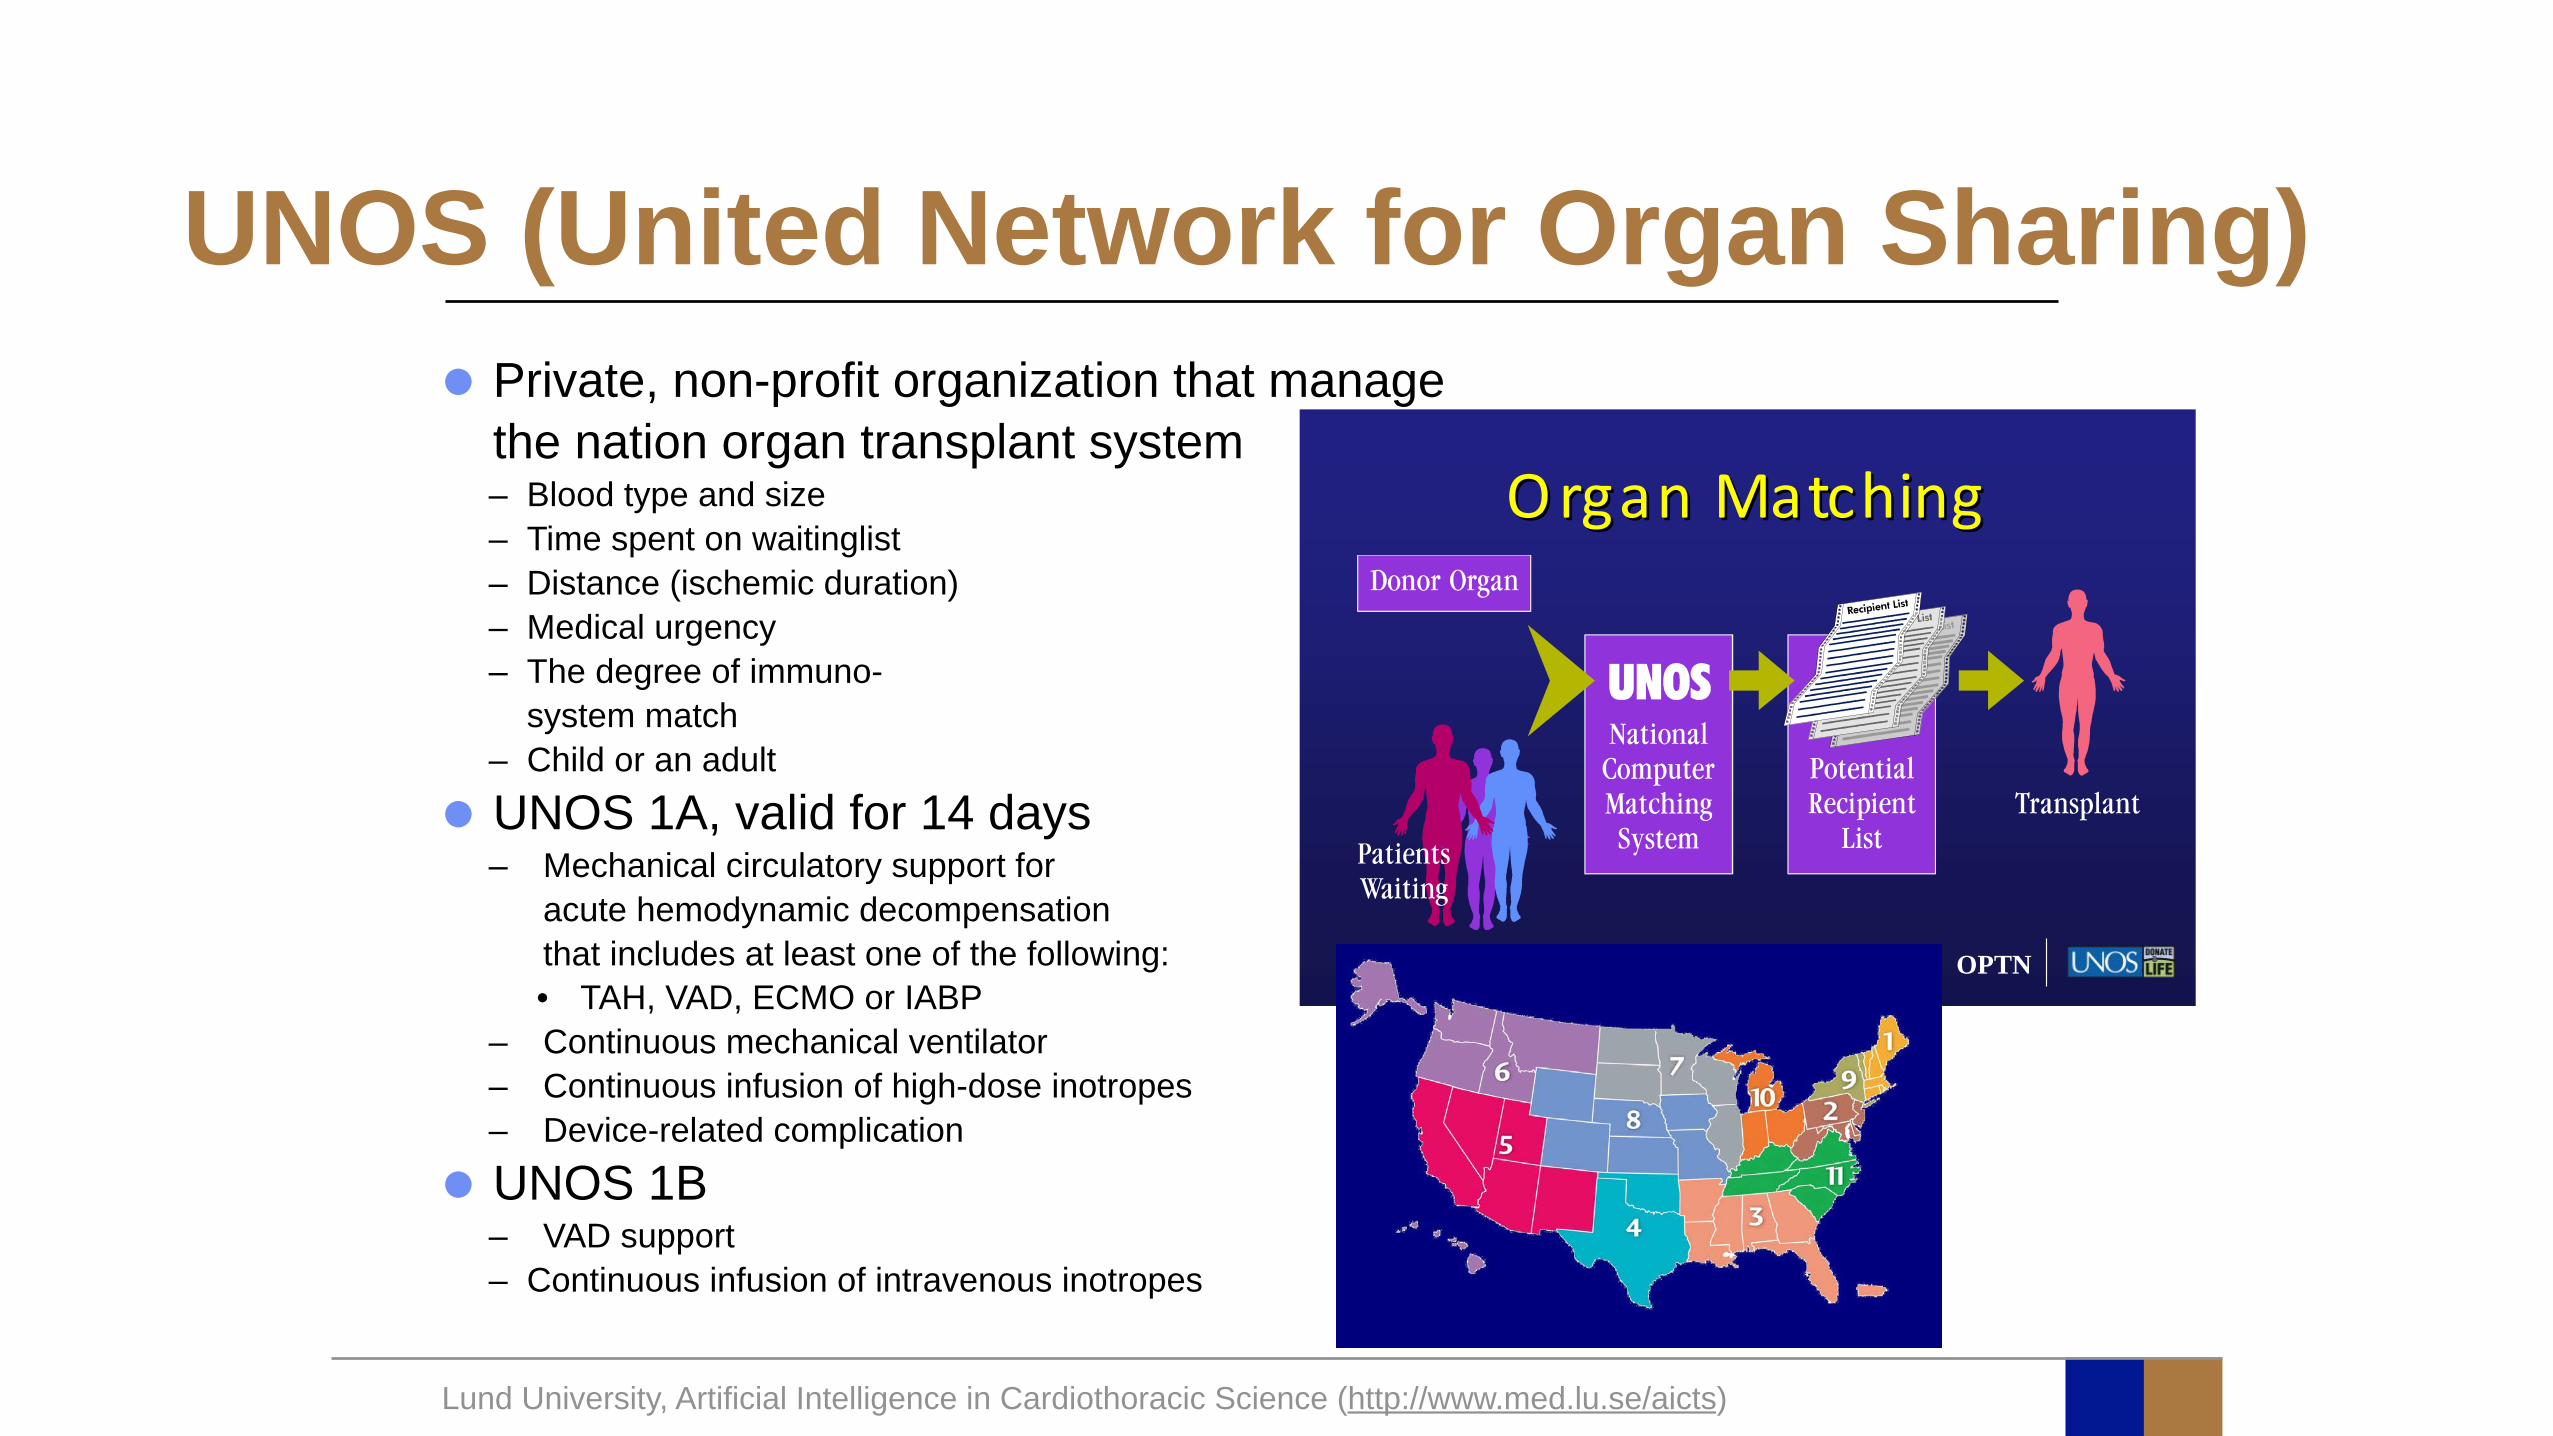
UNOS (United Network for Organ Sharing)• Private, non-profit organization that manage
the nation organ transplant system – Blood type and size – Time spent on waitinglist – Distance (ischemic duration) – Medical urgency – The degree of immuno-
system match – Child or an adult
• UNOS 1A, valid for 14 days – Mechanical circulatory support for
acute hemodynamic decompensation that includes at least one of the following: • TAH, VAD, ECMO or IABP
– Continuous mechanical ventilator – Continuous infusion of high-dose inotropes – Device-related complication
• UNOS 1B – VAD support – Continuous infusion of intravenous inotropes
OPTN
Organ&MatchingOrgan&Matching
How To Customize An Optimal Donor In Heart Transplantation?
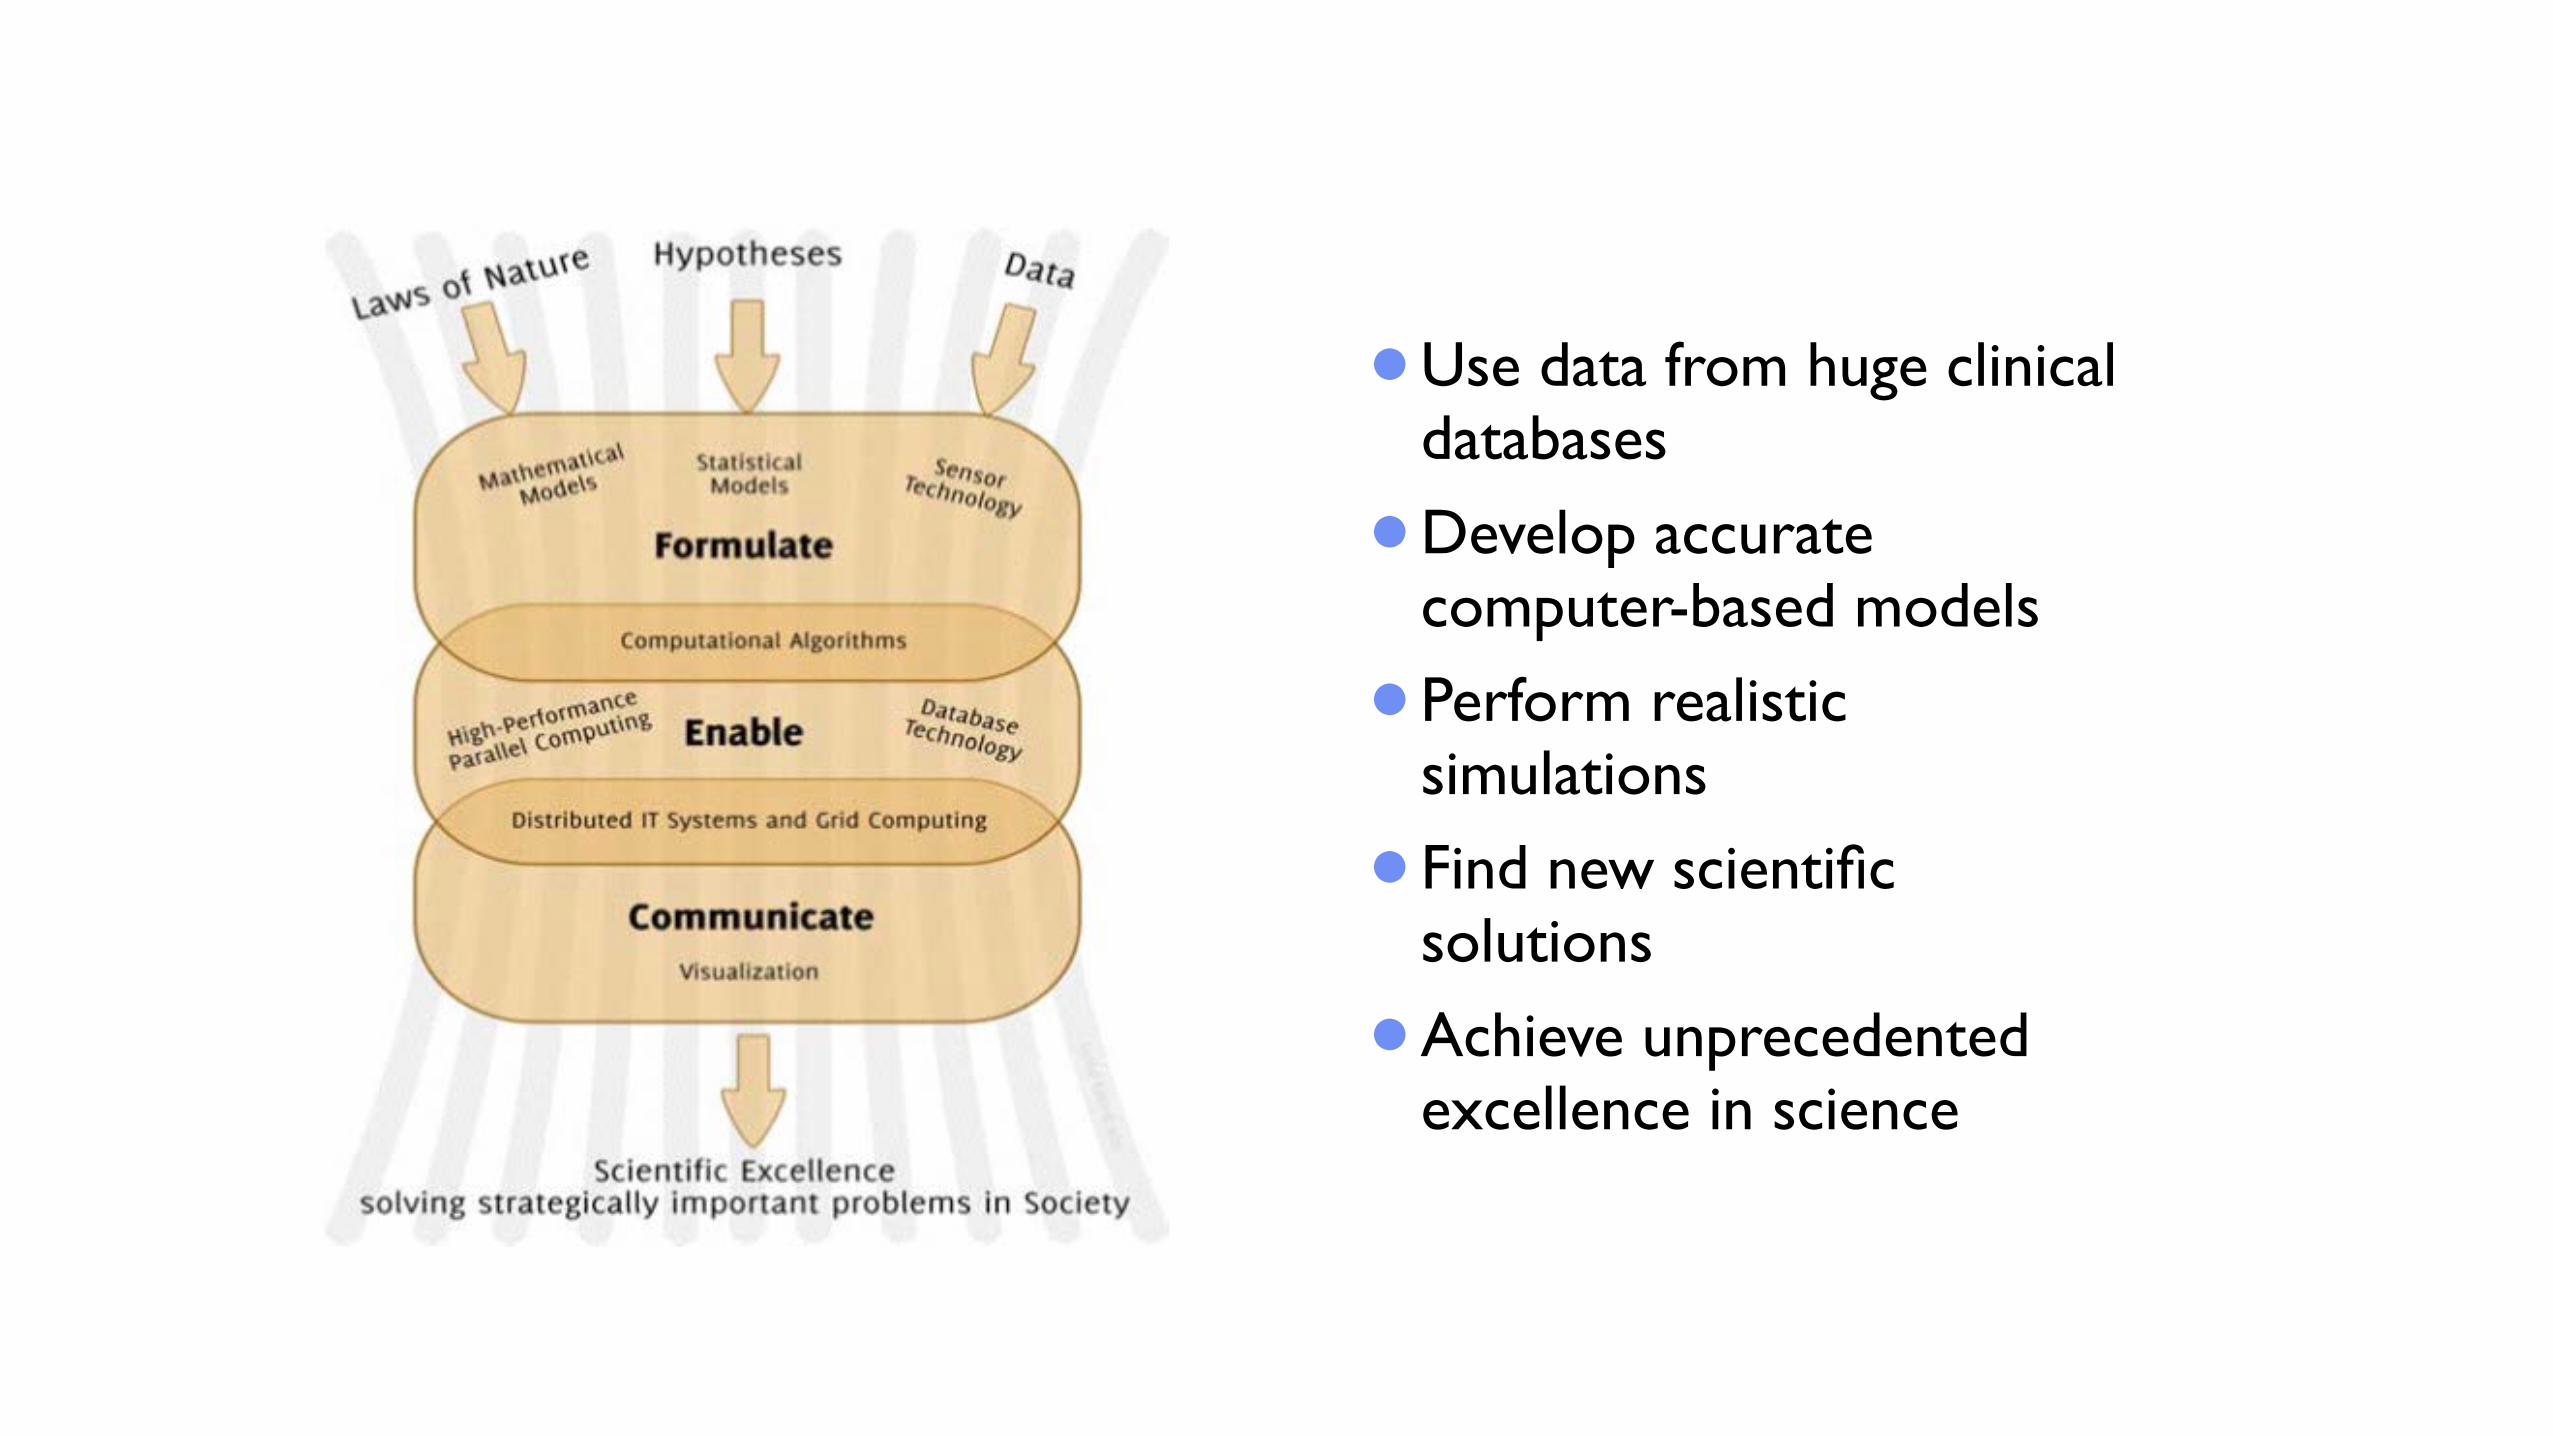
•Use data from huge clinical databases
•Develop accurate computer-based models
•Perform realistic simulations
•Find new scientific solutions
•Achieve unprecedented excellence in science
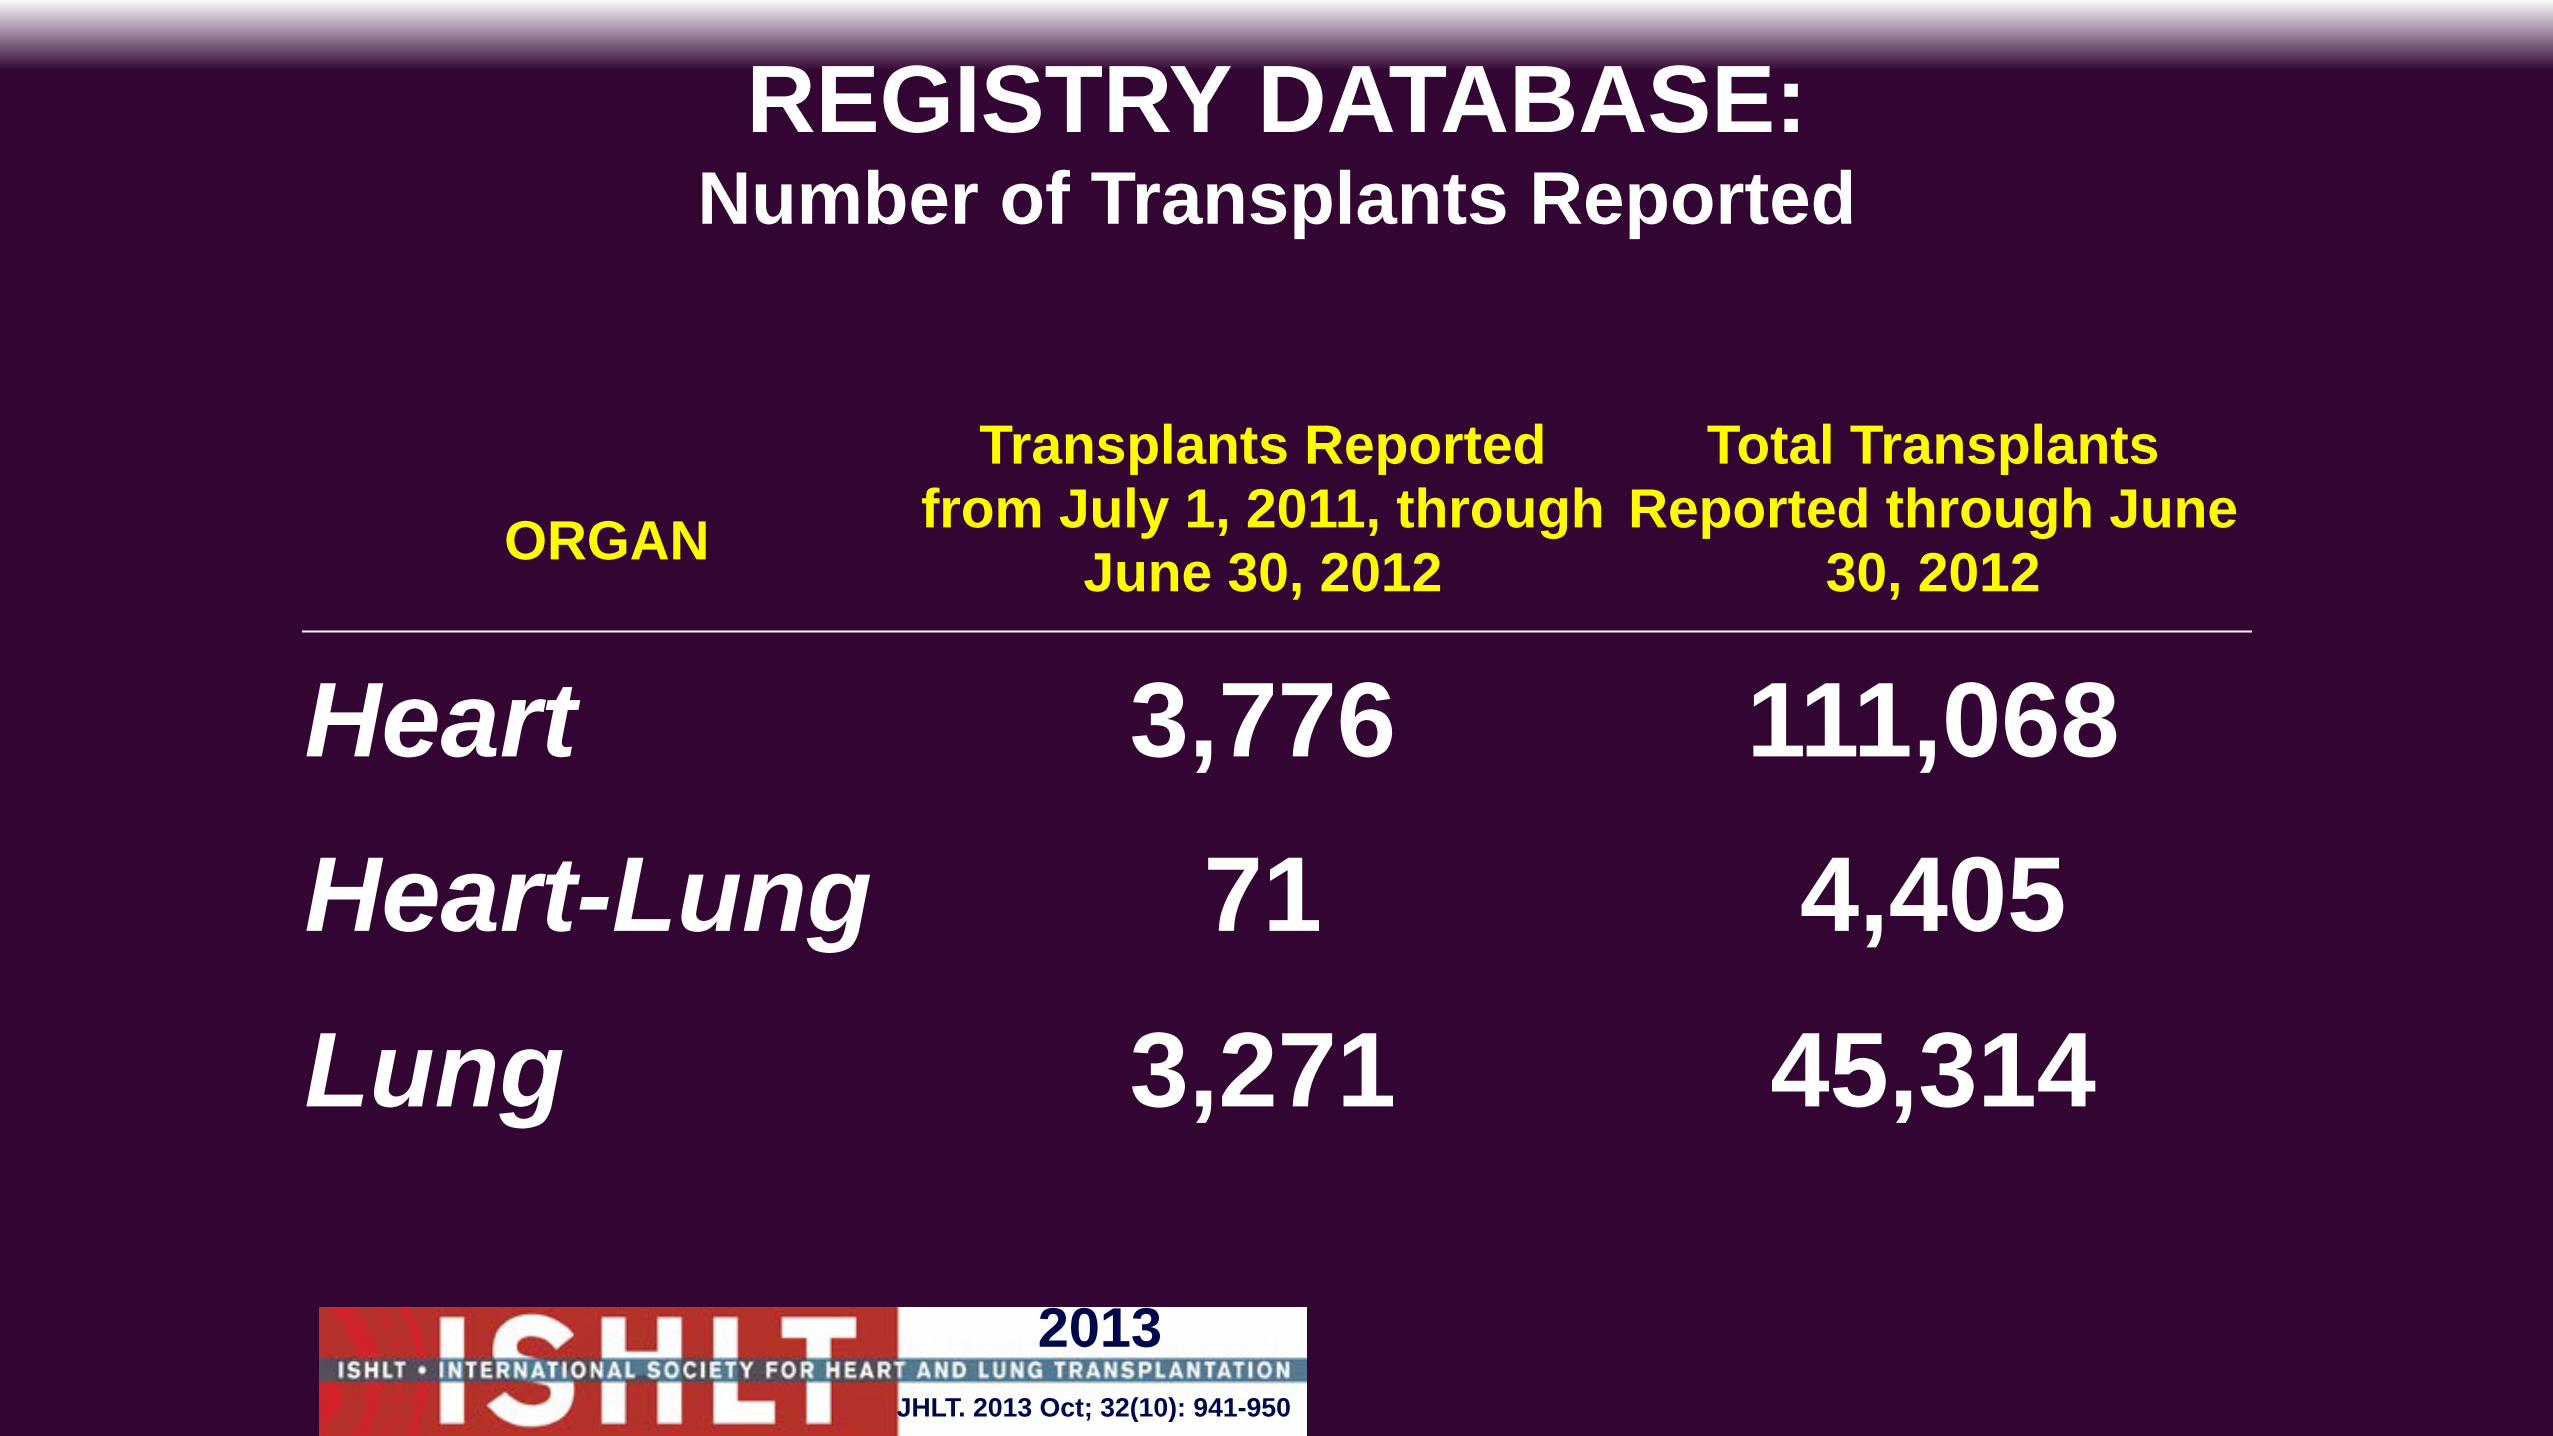
REGISTRY DATABASE:Number of Transplants Reported
ORGANTransplants Reported
from July 1, 2011, through June 30, 2012
Total Transplants Reported through June
30, 2012
Heart 3,776 111,068Heart-Lung 71 4,405Lung 3,271 45,314
JHLT. 2013 Oct; 32(10): 941-950
2013
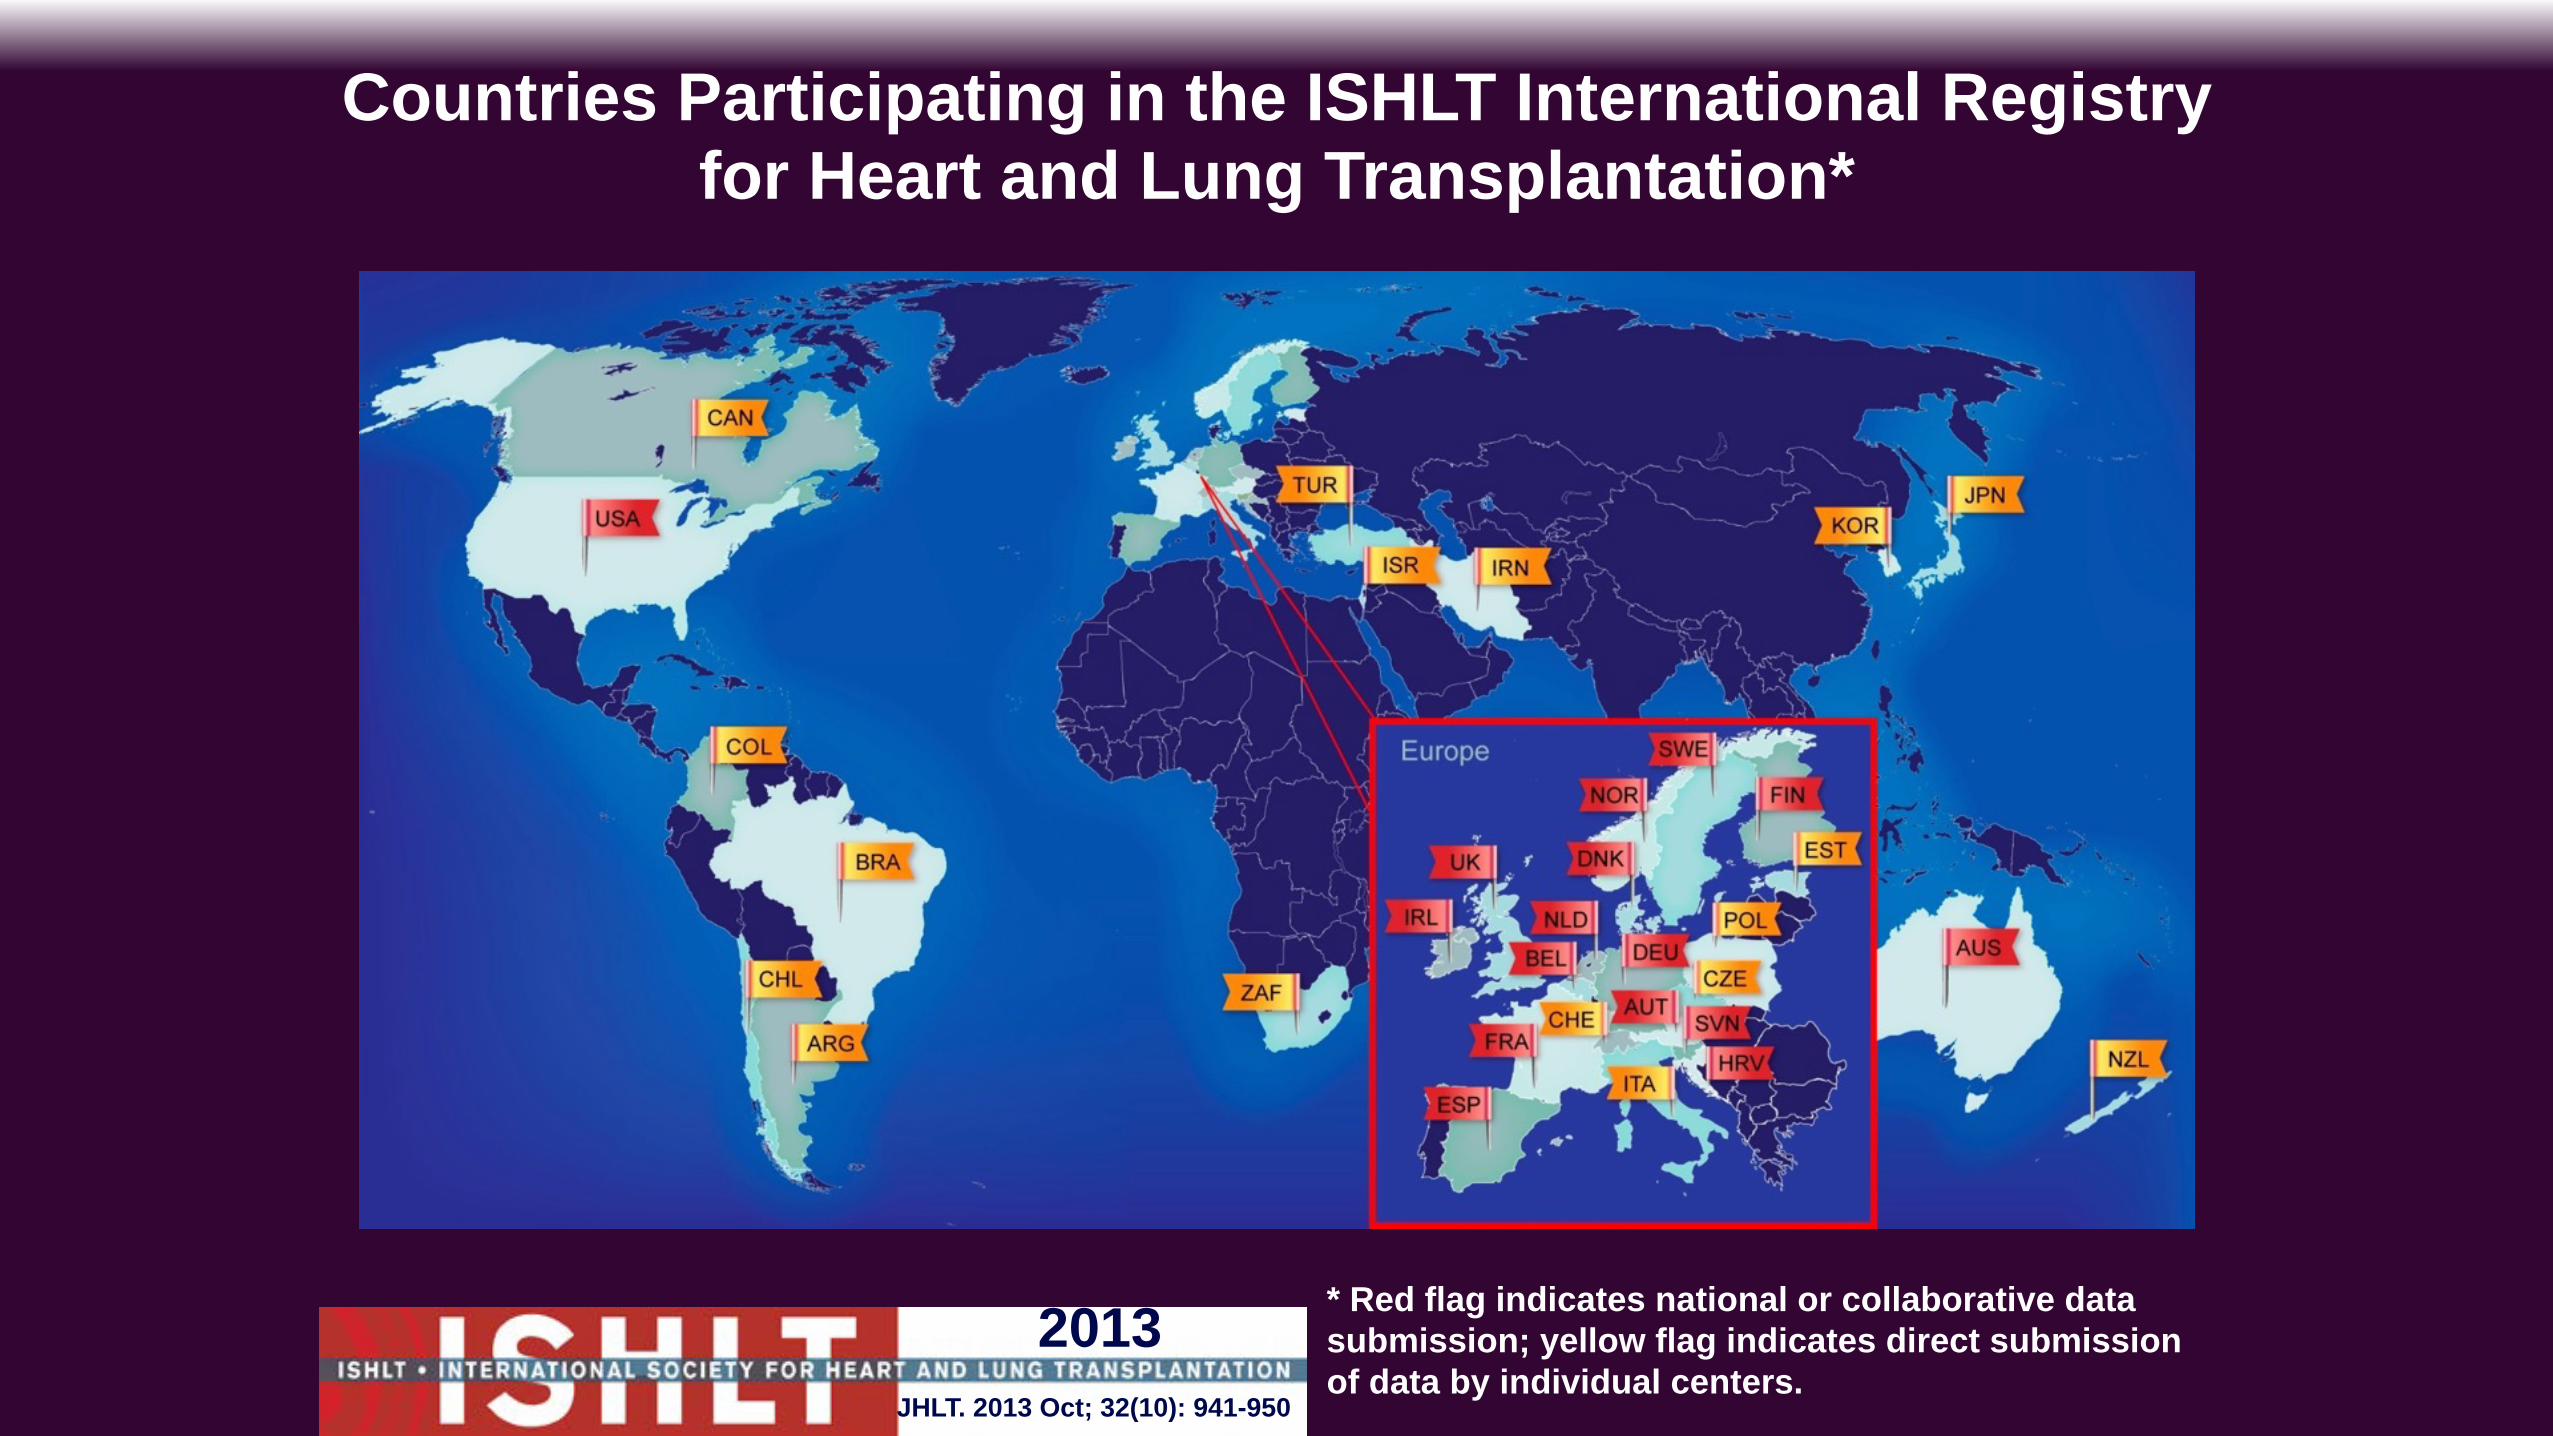
Countries Participating in the ISHLT International Registry for Heart and Lung Transplantation*
JHLT. 2013 Oct; 32(10): 941-950
2013 * Red flag indicates national or collaborative data submission; yellow flag indicates direct submission of data by individual centers.
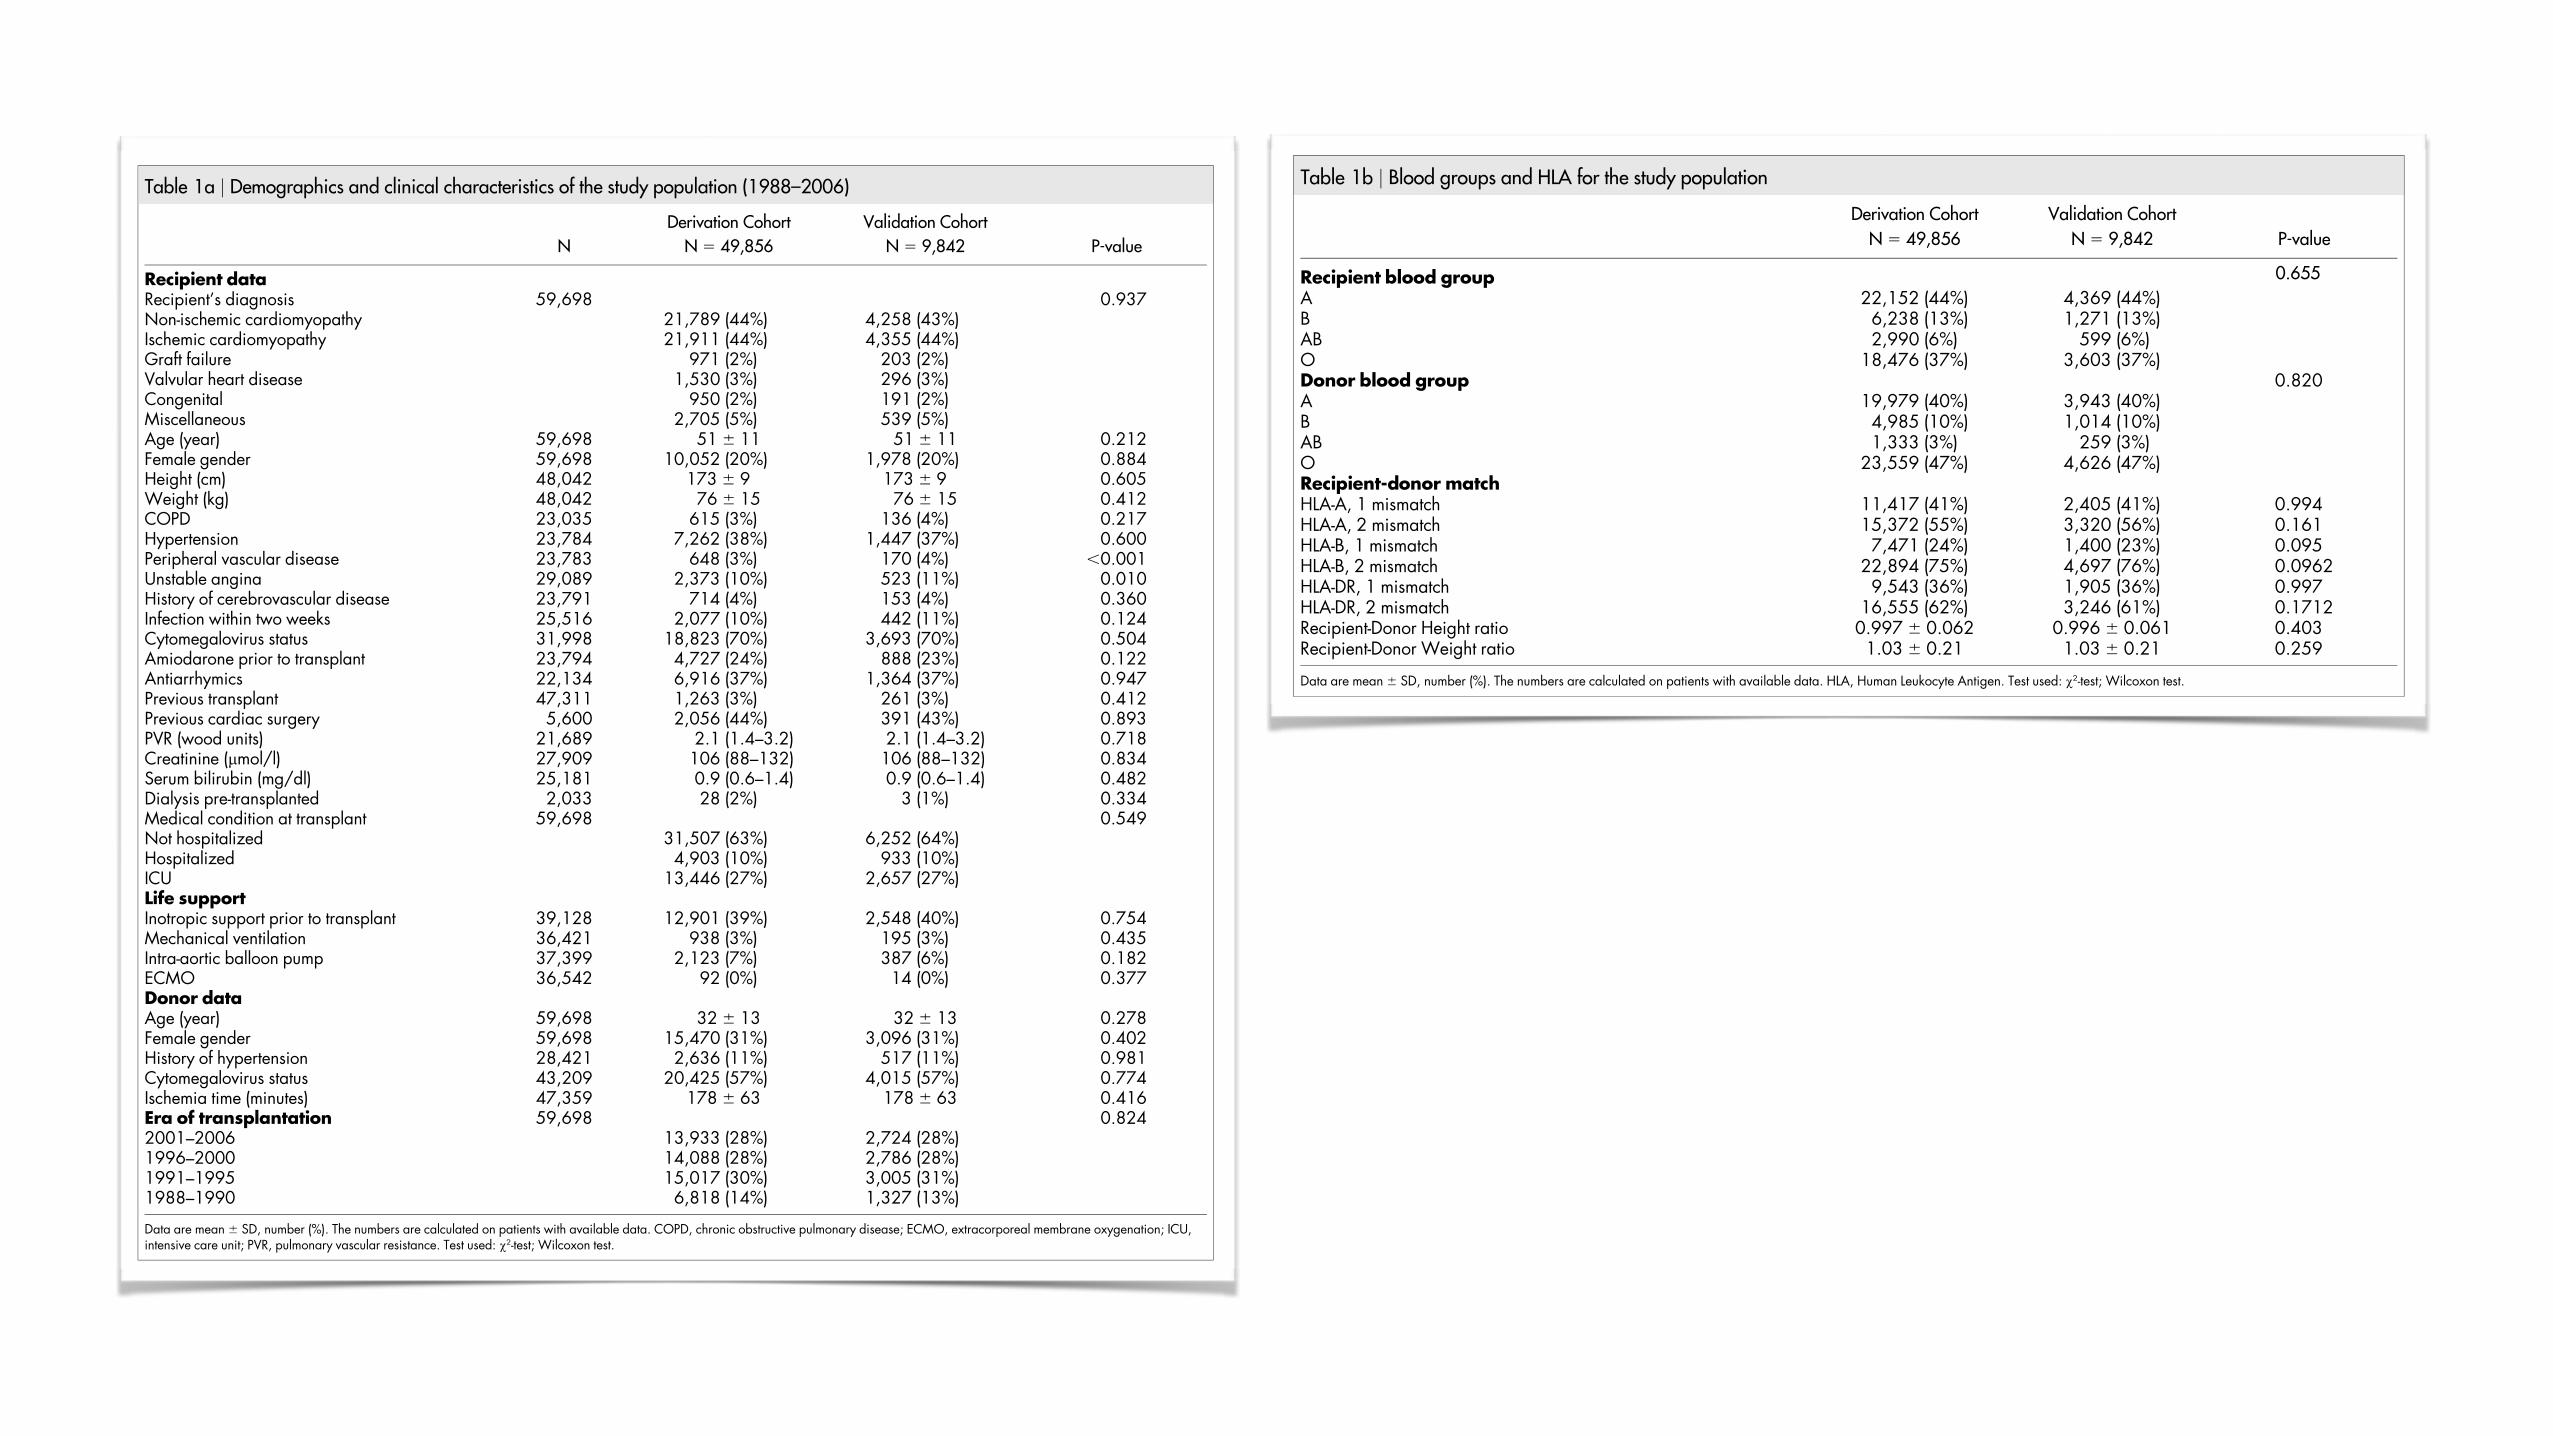
ResultsA total of 62,114 recipients of heart transplants from deceaseddonors were collected from the International Society for Heart andLung Transplantation (ISHLT) Registry during the 19-year studyperiod. After case records with incomplete mandatory data wereexcluded, the final study population comprised 59,698 patients.The mean age of the overall cohort was 51 6 11 years and 20% werewomen. The patient material comprised 318,904 patient-years, witha mean follow-up duration of 5.3 6 4.6 years (median 4.5, range 0–19.8 years). The most common indication for heart transplantationand cause of end-stage heart failure were ischemic cardiomyopathyin 26,266 patients (44%) and non-ischemic cardiomyopathy in26,047 patients (44%). The average donor age was 32 6 13 years.The majority of donors were men (69%). The study material wasrandomly divided in a derivation cohort (N 5 49,856) and an
independent validation cohort (N 5 9,842). The used variables inthe model development were based on which information is availableat the time of transplantation (Table 1A–B). The derivation and thevalidation cohorts were generally similar although a higher propor-tion of symptomatic peripheral vascular disease was registered in thevalidation group.
Calibration and discrimination of the ANN survival model. Theapplied ANN model (a generalization of the standard Cox pro-portional hazard model) is a flexible non-linear survival models.To improve the performance we used an ensemble (CommitteeMachine) of ANNs instead of a single prediction model14,15. Weoptimized the model by ranking and minimizing the number ofrisk variables, similar to a stepwise backwards elimination proce-dure (Figure 1A). The final model included 30 of the 38 candidate
Table 1a | Demographics and clinical characteristics of the study population (1988–2006)
Derivation Cohort Validation Cohort
N N 5 49,856 N 5 9,842 P-value
Recipient dataRecipient’s diagnosis 59,698 0.937Non-ischemic cardiomyopathy 21,789 (44%) 4,258 (43%)Ischemic cardiomyopathy 21,911 (44%) 4,355 (44%)Graft failure 971 (2%) 203 (2%)Valvular heart disease 1,530 (3%) 296 (3%)Congenital 950 (2%) 191 (2%)Miscellaneous 2,705 (5%) 539 (5%)Age (year) 59,698 51 6 11 51 6 11 0.212Female gender 59,698 10,052 (20%) 1,978 (20%) 0.884Height (cm) 48,042 173 6 9 173 6 9 0.605Weight (kg) 48,042 76 6 15 76 6 15 0.412COPD 23,035 615 (3%) 136 (4%) 0.217Hypertension 23,784 7,262 (38%) 1,447 (37%) 0.600Peripheral vascular disease 23,783 648 (3%) 170 (4%) ,0.001Unstable angina 29,089 2,373 (10%) 523 (11%) 0.010History of cerebrovascular disease 23,791 714 (4%) 153 (4%) 0.360Infection within two weeks 25,516 2,077 (10%) 442 (11%) 0.124Cytomegalovirus status 31,998 18,823 (70%) 3,693 (70%) 0.504Amiodarone prior to transplant 23,794 4,727 (24%) 888 (23%) 0.122Antiarrhymics 22,134 6,916 (37%) 1,364 (37%) 0.947Previous transplant 47,311 1,263 (3%) 261 (3%) 0.412Previous cardiac surgery 5,600 2,056 (44%) 391 (43%) 0.893PVR (wood units) 21,689 2.1 (1.4–3.2) 2.1 (1.4–3.2) 0.718Creatinine (mmol/l) 27,909 106 (88–132) 106 (88–132) 0.834Serum bilirubin (mg/dl) 25,181 0.9 (0.6–1.4) 0.9 (0.6–1.4) 0.482Dialysis pre-transplanted 2,033 28 (2%) 3 (1%) 0.334Medical condition at transplant 59,698 0.549Not hospitalized 31,507 (63%) 6,252 (64%)Hospitalized 4,903 (10%) 933 (10%)ICU 13,446 (27%) 2,657 (27%)Life supportInotropic support prior to transplant 39,128 12,901 (39%) 2,548 (40%) 0.754Mechanical ventilation 36,421 938 (3%) 195 (3%) 0.435Intra-aortic balloon pump 37,399 2,123 (7%) 387 (6%) 0.182ECMO 36,542 92 (0%) 14 (0%) 0.377Donor dataAge (year) 59,698 32 6 13 32 6 13 0.278Female gender 59,698 15,470 (31%) 3,096 (31%) 0.402History of hypertension 28,421 2,636 (11%) 517 (11%) 0.981Cytomegalovirus status 43,209 20,425 (57%) 4,015 (57%) 0.774Ischemia time (minutes) 47,359 178 6 63 178 6 63 0.416Era of transplantation 59,698 0.8242001–2006 13,933 (28%) 2,724 (28%)1996–2000 14,088 (28%) 2,786 (28%)1991–1995 15,017 (30%) 3,005 (31%)1988–1990 6,818 (14%) 1,327 (13%)
Data are mean 6 SD, number (%). The numbers are calculated on patients with available data. COPD, chronic obstructive pulmonary disease; ECMO, extracorporeal membrane oxygenation; ICU,intensive care unit; PVR, pulmonary vascular resistance. Test used: x2-test; Wilcoxon test.
www.nature.com/scientificreports
SCIENTIFIC REPORTS | 3 : 1922 | DOI: 10.1038/srep01922 2
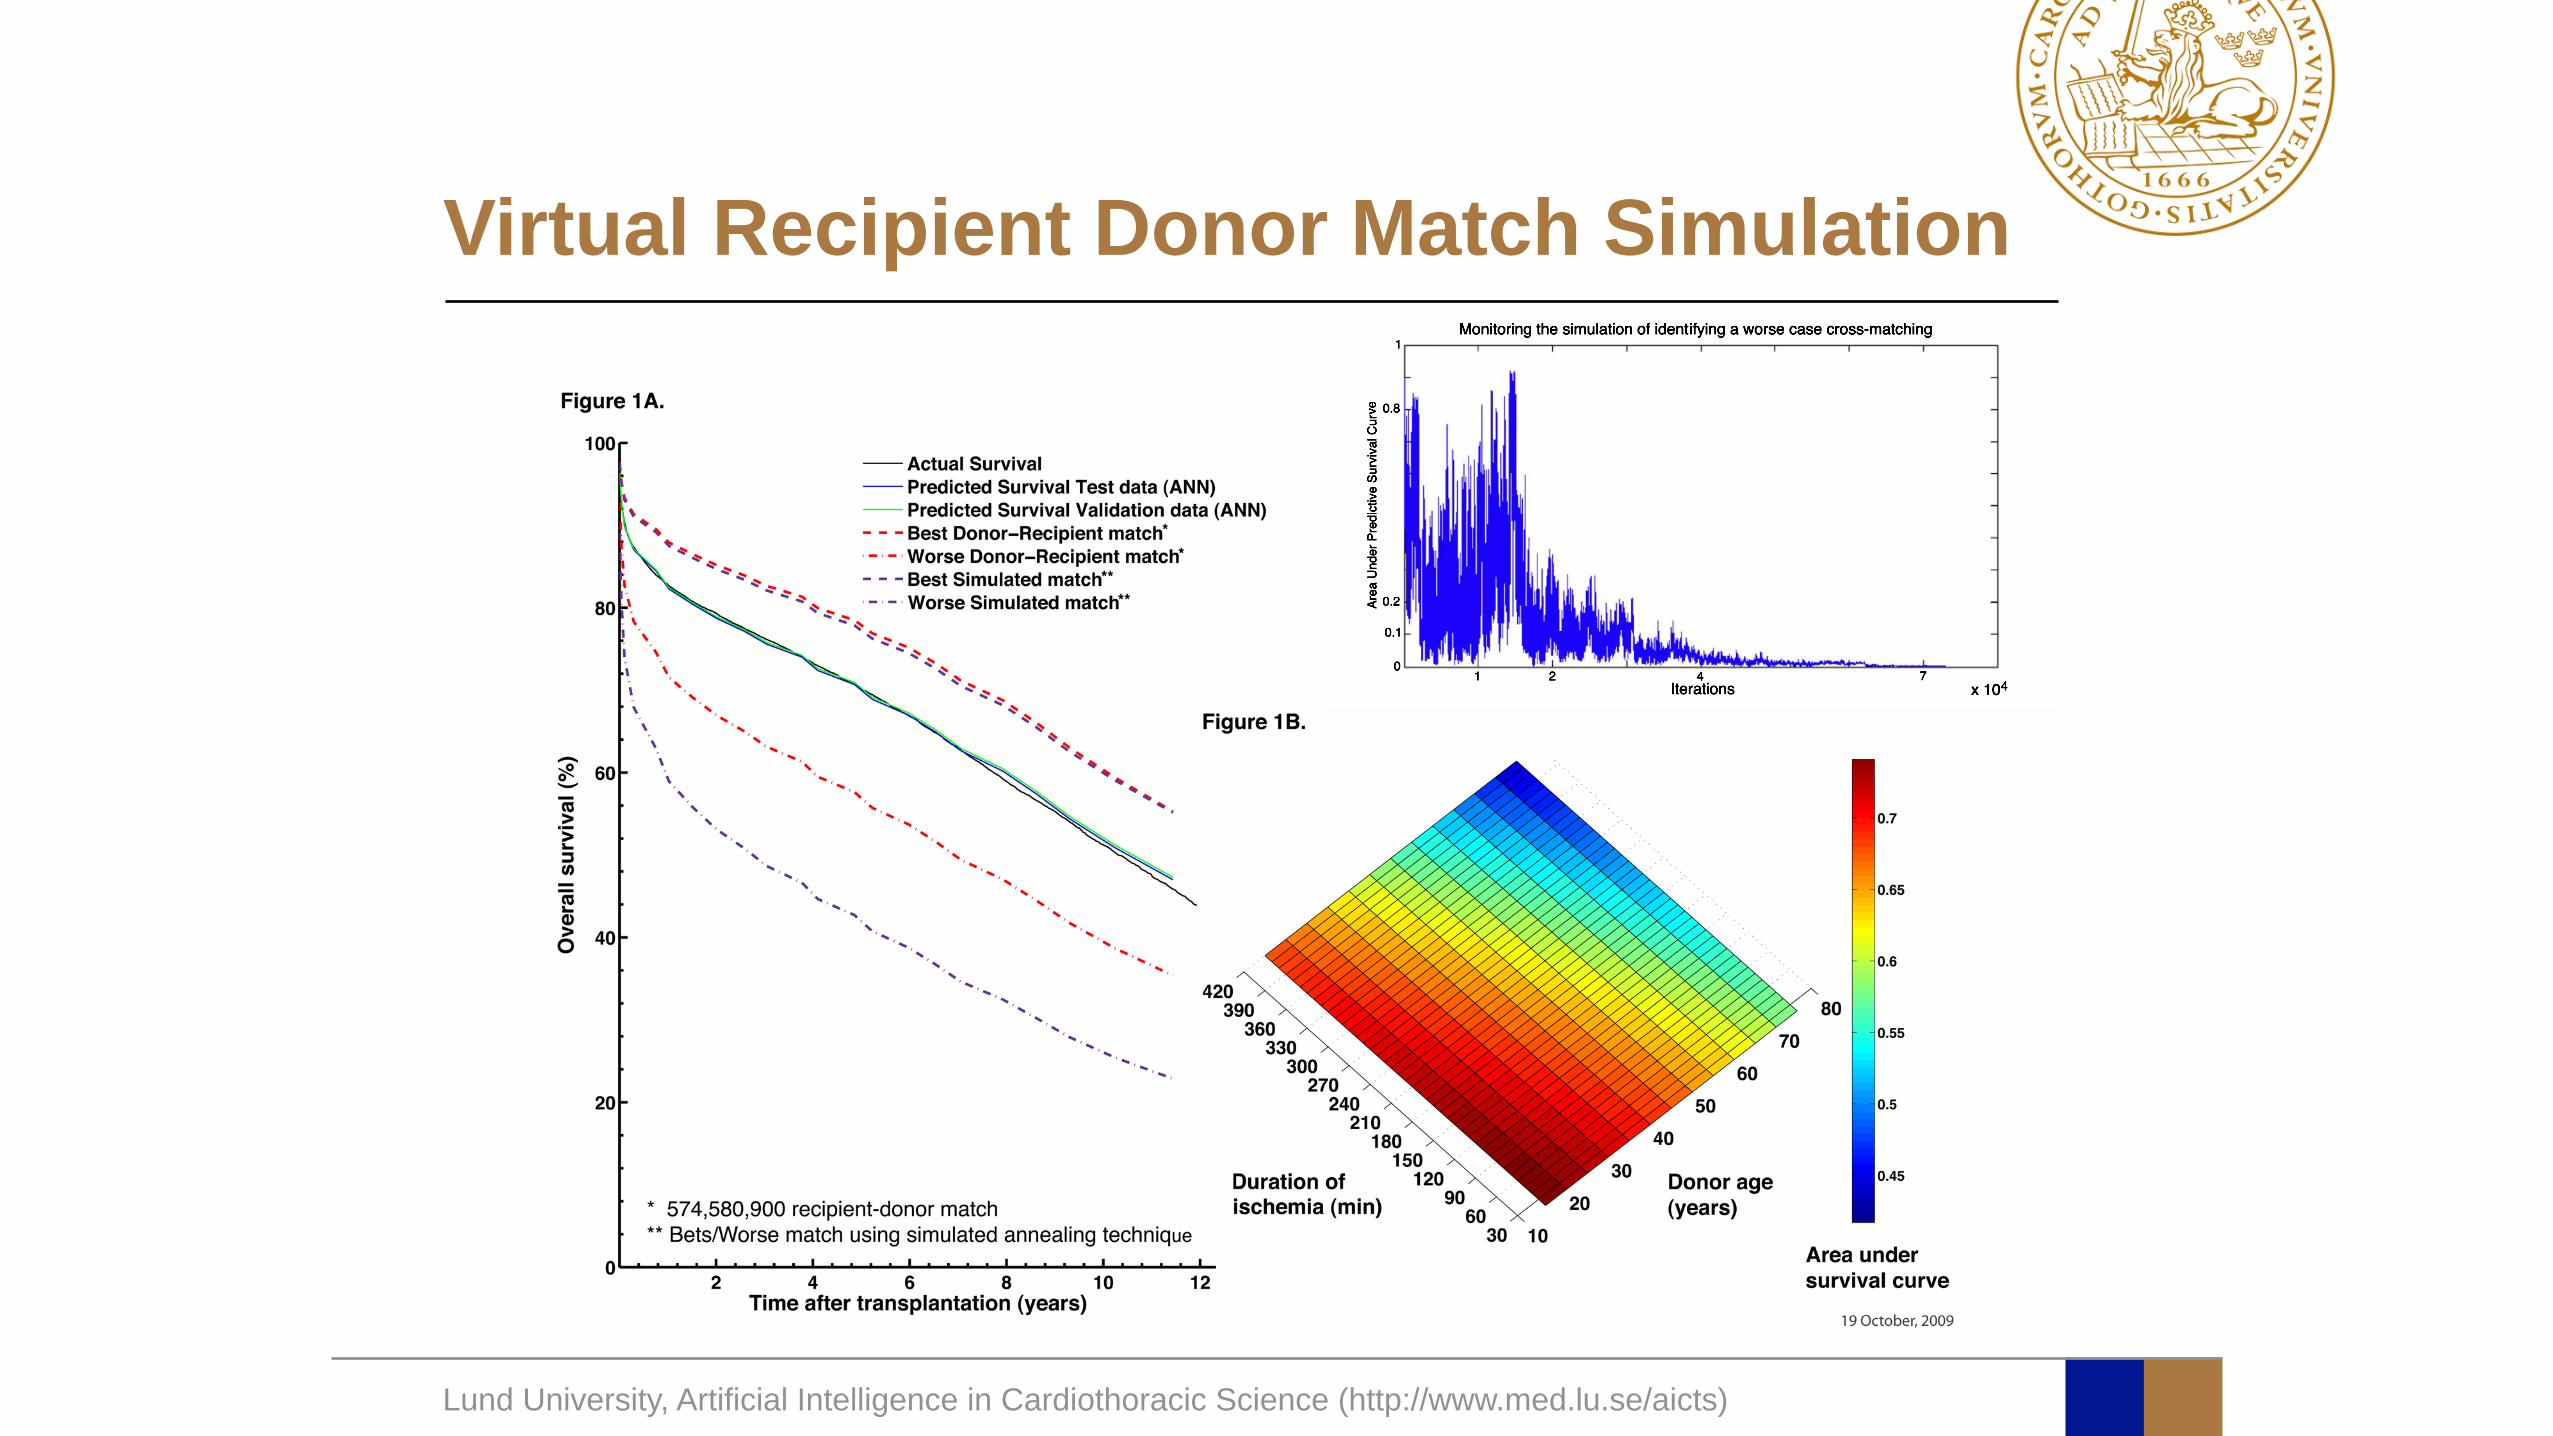
variables corresponding to 41 inputs. The hazard ratios (HR) for thetop confounding risk factors, ranked in order of influence upondiscriminatory power, are presented together with the mandatoryvariables in Table 2. The 12 mandatory variables (age, bloodgroup, gender, height and weight ratio) were not included in theranking because we wanted them incorporated in the ANN modelregardless of discriminatory power. We validated the model bypredicting the cumulative survival for each patient in the vali-dation cohort. The Harrell’s Concordance index for the ANNmodel was 0.59 (95% CI, 0.586–0.594) and the difference in areaunder the predicted survival curve was 1.4% compared with theKaplan-Meier survival curve (Figure 1B).
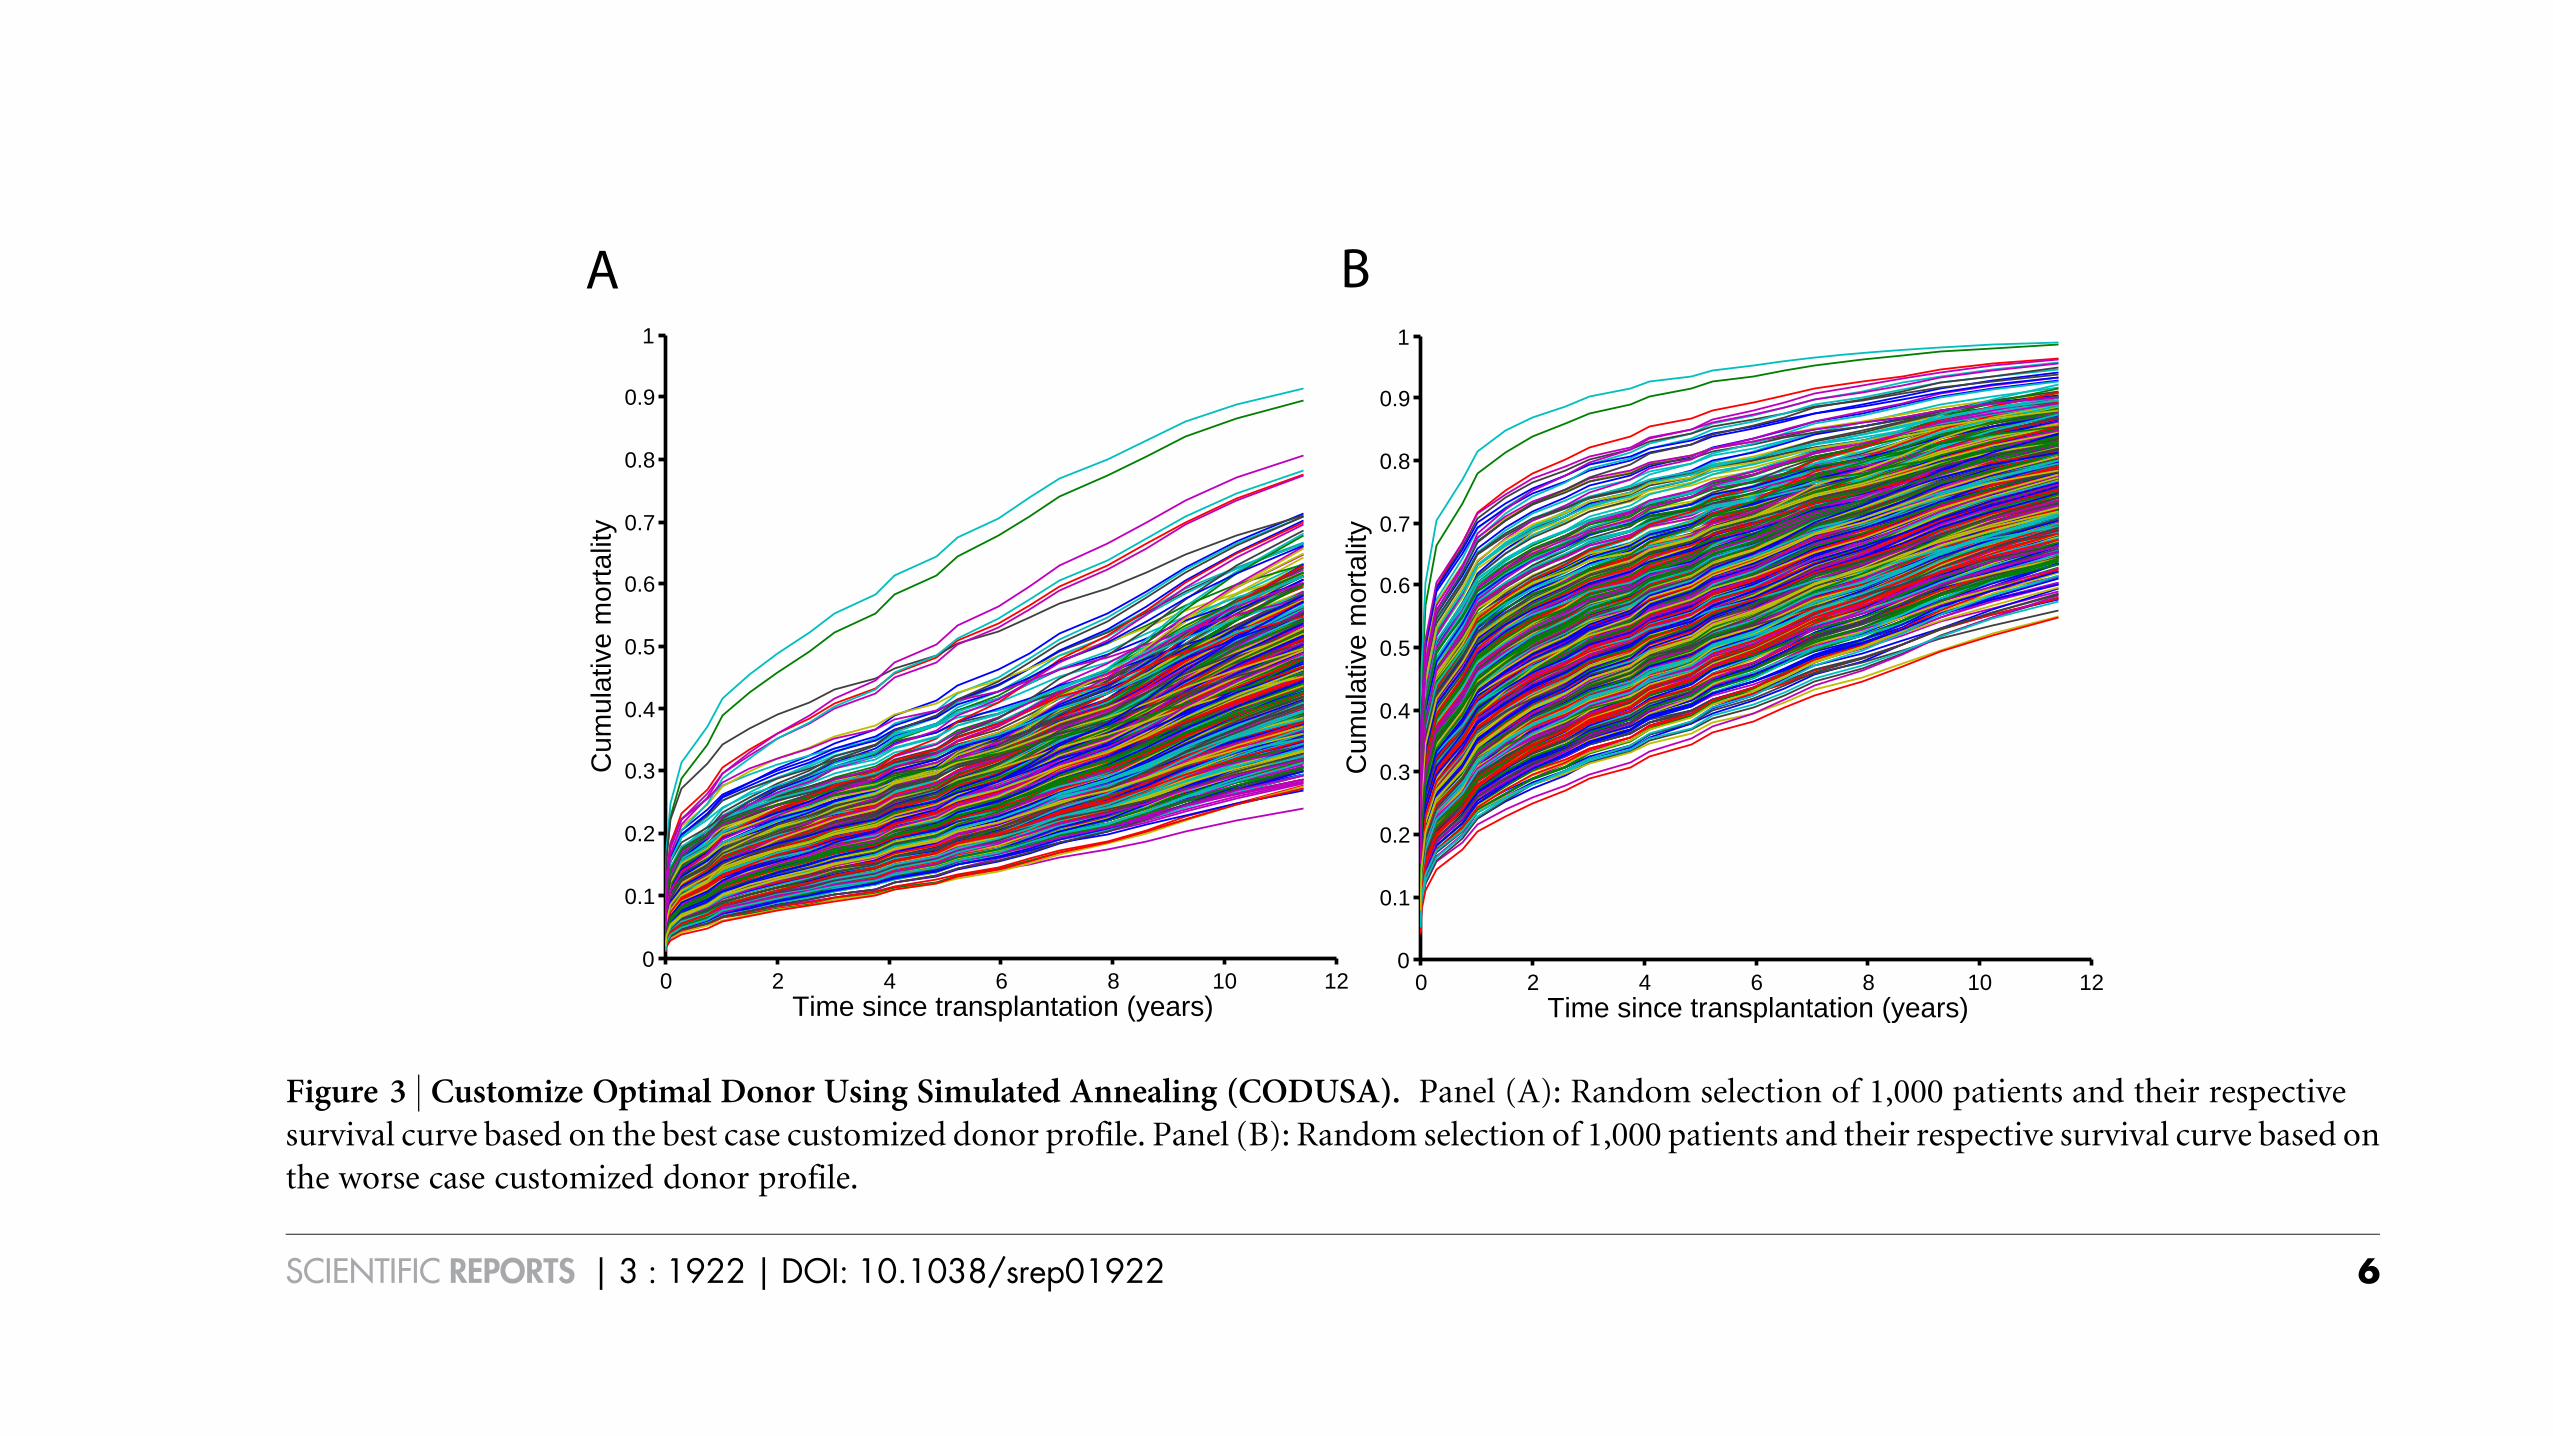
Customize an optimal donor using simulated annealing. We usedthe SA to ‘customize’ an optimal and worst donor, respectively, forthe recipients. The main feature of the SA algorithm is the ability toavoid being trapped in local minimum. This is done by letting thealgorithm accept not only better solutions but also worse solutions,‘‘uphill moves’’, with a given probability16. The SA algorithm isexpressed by a flowchart in Figure 2A. We tested the SA algorithmfor selecting best-case match (N 5 36,696) and worst-case match (N5 34,638) using the five donor variables: age, gender, blood group,height and weight. The area under the predicted survival curve(AUPSC) was calculated for each recipient-donor match.Figure 2B shows how much the AUPSC changes as one of the fivedonor variables is altered. Figure 2C shows the monitoring of the SAfunction that is looking for a best recipient-donor match for one ran-domly selected patient from the registry. At approximately 7,000iterations, the temperature was close to zero and an (approximate)optimum set of input values (the donor profile) was found. InFigure 3A, a plot of a random selection of 1,000 patients and theirrespective predicted survival curve from the experiment is drawnbased on the best-case donor variables. The corresponding plot forworst-case match is shown in Figure 3B.
Donor age was the variable that influenced outcome at most of thefive evaluated donor variables. All patients received extreme values.For best-case match the optimal donor age was 15 6 0.0 years com-pared with 32 6 13 years, P , 0.001, for the original recipient-donormatch. For the worse case match the donor age was 80 6 0.0 yearscompared with 32 6 13 years, P , 0.001, for the original recipient-donor match. Furthermore, in the best-case match only 57 female
hearts were given to 29,295 men while 1,568 (21%) female heartswere given to 7,384 women. Thus, not all women received a femaledonor organ. In the worst-case match, 27,652 (100%) female heartswere given to 27,668 men and 6,699 (96%) female hearts to 6,970women, Table 3.
The blood group matching was analysed and differences betweenoptimal and suboptimal outcomes were studied. Controversially,recipients with blood group B received identical matched bloodgroup in only 18% of best-case match and 68% in worst-case matchcompared with 73%, P , 0.001 for the original recipient-donormatch. We observed a similar finding for recipient with blood groupAB. The SA algorithm avoided donor blood group B in the best-casematch. Only 2% of these recipients were matched to donors withblood group B compared with 24%, P , 0.001, for the originalrecipient-donor match, Table 3.
The last of the five studied variables, weight ratio, showed a similarresult as donor age for the best-case match. 65% of the recipientsreceived an extreme value of a recipient-donor ratio of 0.5. For therecipients with non-extreme values (N 5 12,682) the optimal recipi-ent donor weight ration was 0.83 6 0.24. We could not see the sameresults for the recipient donor height ratio. In the best-case matchnone of the recipients achieved any extreme value. Instead, theoptimum ratio was 1.08 6 0.10. However, in the worst-case matchthe recipient donor height ration was 1.5 in 64% of the cases and 0.5in 36% of the cases, Table 3.
Prediction of conditional failure after heart transplantation.Figure 1B illustrates the mean value for all best-case and worst-case matches. By optimizing the donor profile, the survival couldbe improved with 33 months. In order to evaluate if the SA hadbeen able to improve the survival compared to ‘‘real-life’’ donorprofiles, we performed a virtual recipient-donor match (VRDM).The recipient was matched using all the different donor profilesfrom the registry. The recipient-donor combination with best-predicted survival was chosen. The procedure was repeated for allrecipients and the mean predicted survival curve for all best-casematches was plotted. We identified the worst combination in asimilar way. Of note, even if we created artificial combinations bychanging the five variables, we could not improve survival comparedto using VRDM combinations. On the other hand, we could identifymuch worse combinations using SA, Figure 1B.
Table 1b | Blood groups and HLA for the study population
Derivation Cohort Validation Cohort
N 5 49,856 N 5 9,842 P-value
Recipient blood group 0.655
A 22,152 (44%) 4,369 (44%)B 6,238 (13%) 1,271 (13%)AB 2,990 (6%) 599 (6%)O 18,476 (37%) 3,603 (37%)Donor blood group 0.820A 19,979 (40%) 3,943 (40%)B 4,985 (10%) 1,014 (10%)AB 1,333 (3%) 259 (3%)O 23,559 (47%) 4,626 (47%)Recipient-donor matchHLA-A, 1 mismatch 11,417 (41%) 2,405 (41%) 0.994HLA-A, 2 mismatch 15,372 (55%) 3,320 (56%) 0.161HLA-B, 1 mismatch 7,471 (24%) 1,400 (23%) 0.095HLA-B, 2 mismatch 22,894 (75%) 4,697 (76%) 0.0962HLA-DR, 1 mismatch 9,543 (36%) 1,905 (36%) 0.997HLA-DR, 2 mismatch 16,555 (62%) 3,246 (61%) 0.1712Recipient-Donor Height ratio 0.997 6 0.062 0.996 6 0.061 0.403Recipient-Donor Weight ratio 1.03 6 0.21 1.03 6 0.21 0.259
Data are mean 6 SD, number (%). The numbers are calculated on patients with available data. HLA, Human Leukocyte Antigen. Test used: x2-test; Wilcoxon test.
www.nature.com/scientificreports
SCIENTIFIC REPORTS | 3 : 1922 | DOI: 10.1038/srep01922 3
Lund University, Artificial Intelligence in Cardiothoracic Science (http://www.med.lu.se/aicts)
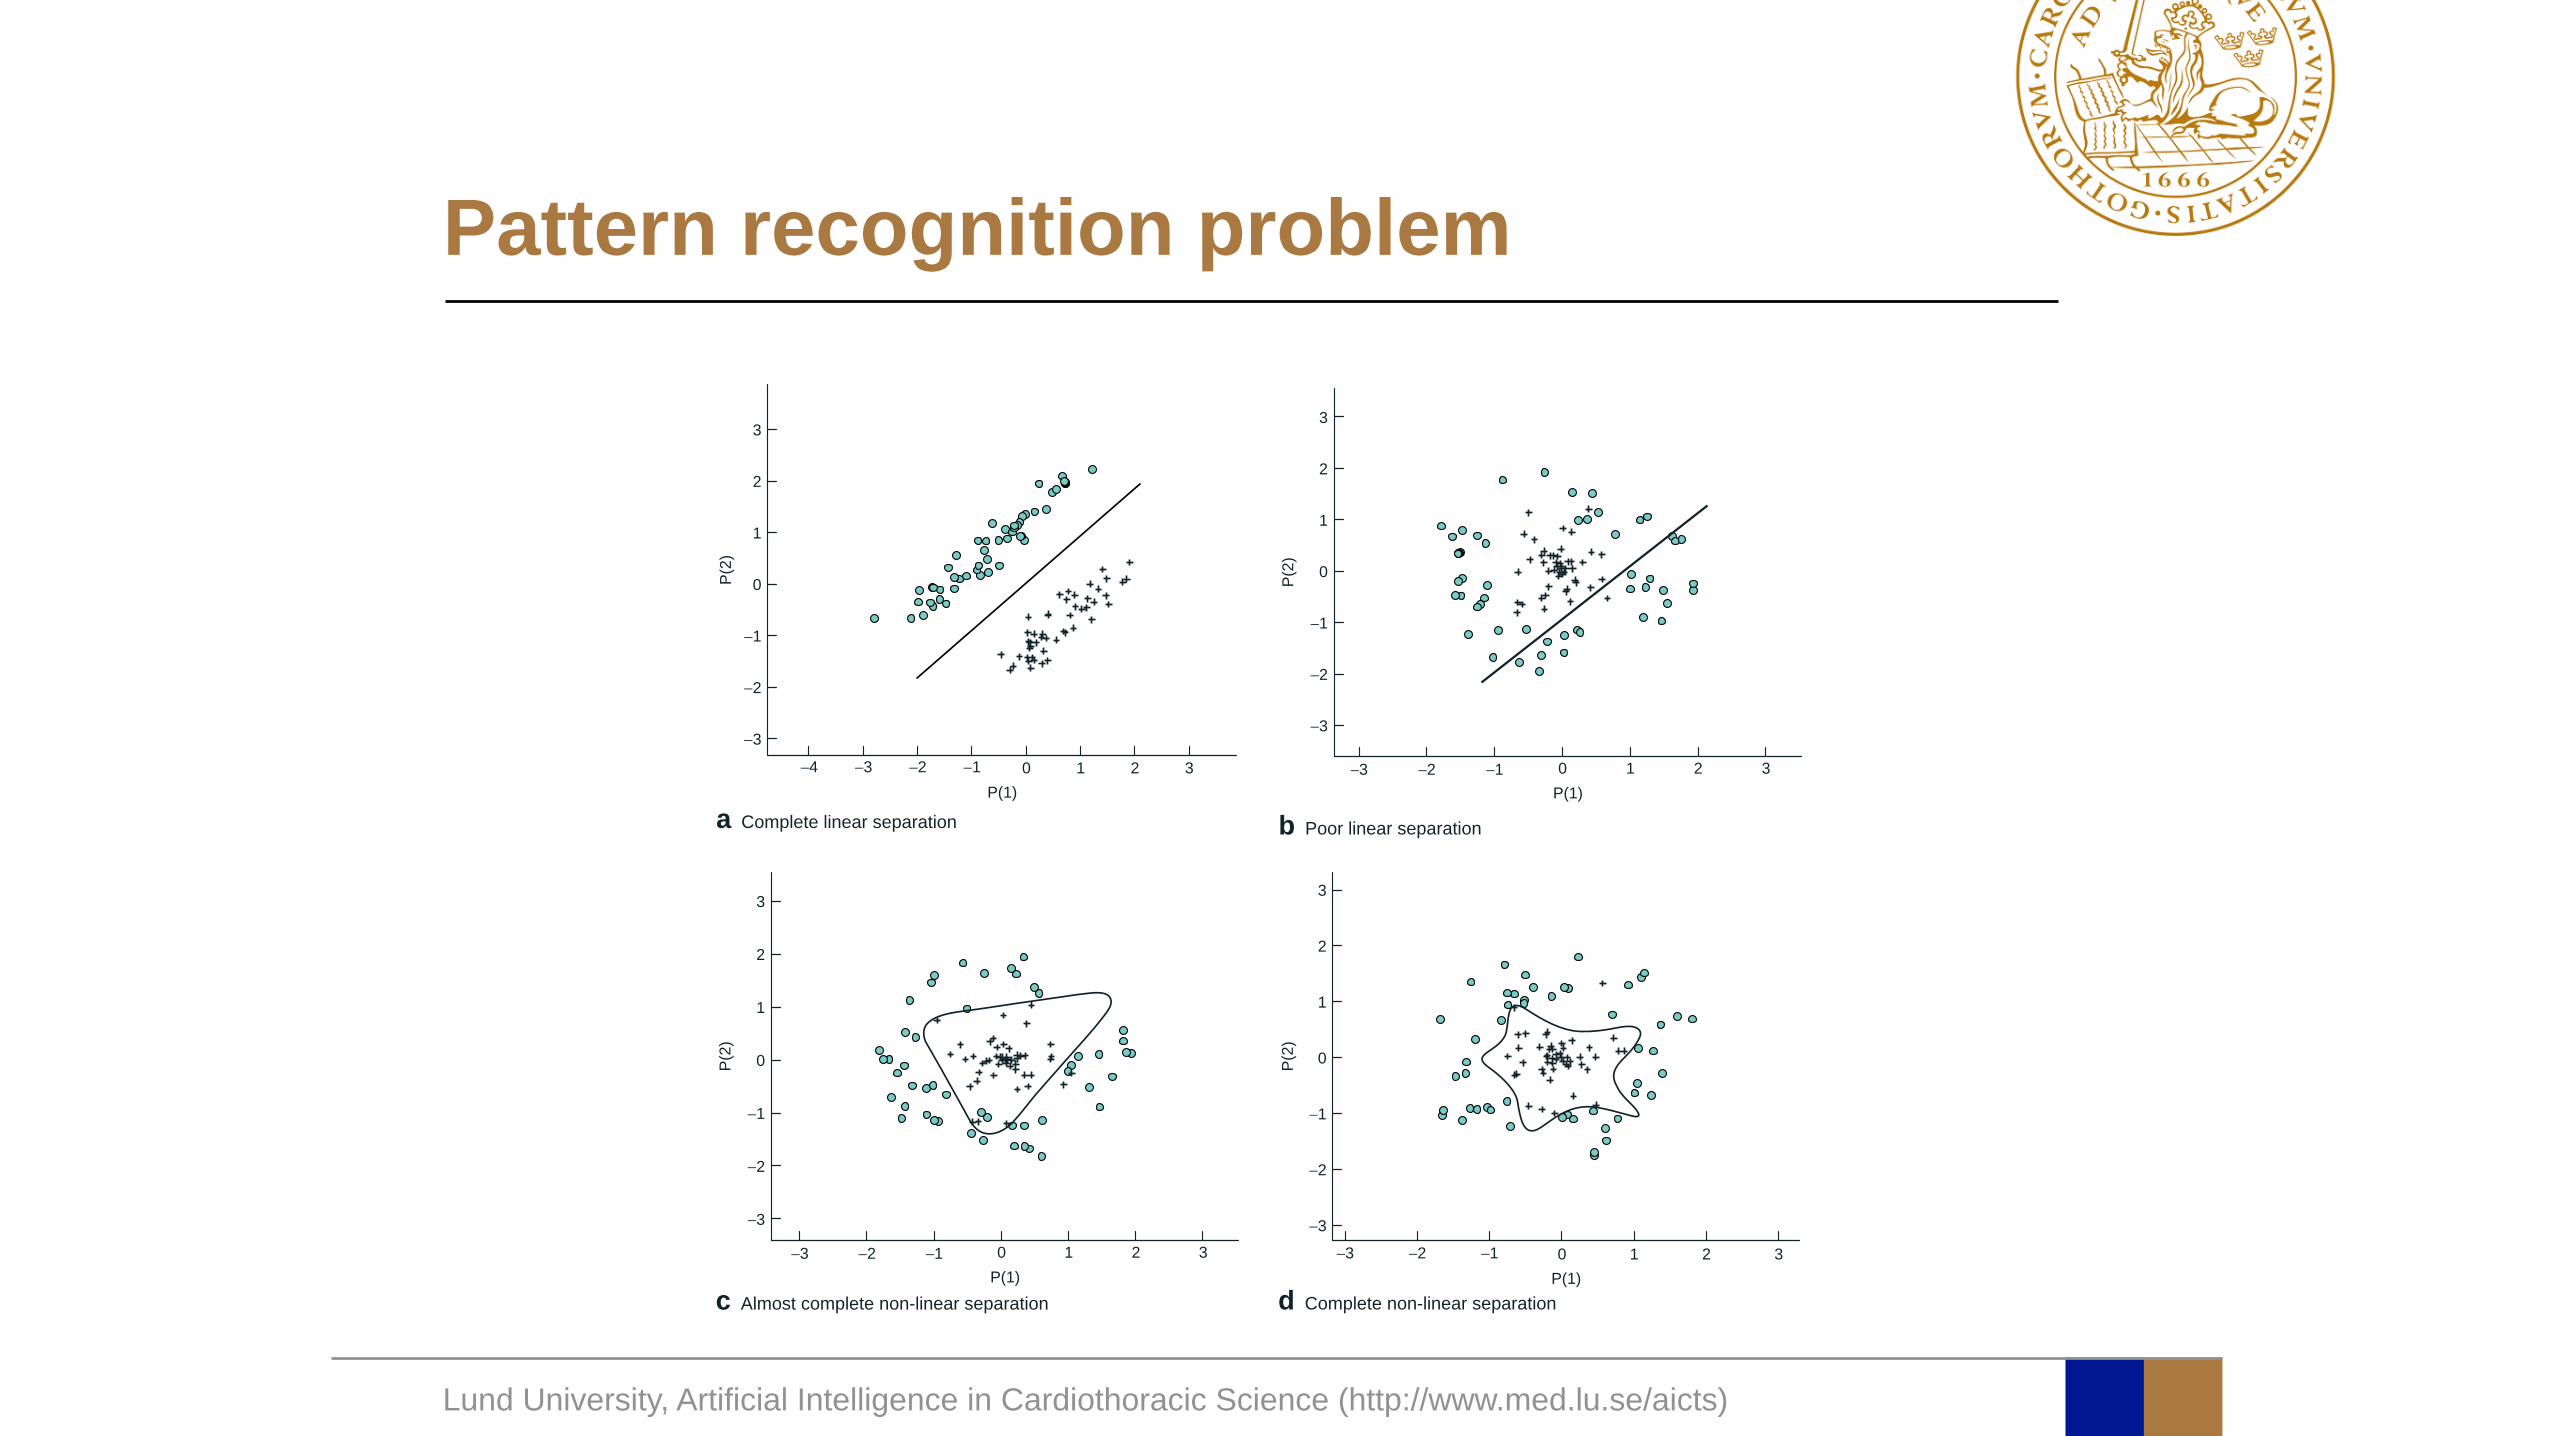
Pattern recognition problem
Artificial neural networks in pancreatic disease 819
via a set of weights (analogous to synaptic connections inthe nervous system) in a way that allows signals to travelthrough the network in parallel as well as serially. Thenodes are very simple computing elements and are basedon the observation that a neurone behaves like a switch;when sufficient neurotransmitter has accumulated in thecell body, an action potential is generated. This has beenmodelled mathematically (Table 1) as a weighted sum of
all incoming signals to a node. The weighted sum of thesignals is compared with a threshold. If the threshold isexceeded, the node fires; otherwise it remains inactive.
Computational power in a neural network doesnot derive from the complexity of each processingunit, but from the density and complexity of theinterconnections. Feed-forward neural networks, suchas the multilayer perceptron (Fig. 1), are popular and
3
2
1
0P(2)
−1
−2
−3
a Complete linear separation
−4 −3 −2 −1 0P(1)
1 2 3
3
2
1
0P(2)
−1
−2
−3
−3 −2 −1 0P(1)
1 2 3
b Poor linear separation
3
2
1
0P(2)
−1
−2
−3
−3 −2 −1 0P(1)
1 2 3
c Almost complete non-linear separation
3
2
1
0P(2)
−1
−2
−3−3 −2 −1 0
P(1)1 2 3
d Complete non-linear separation
Fig. 3 Solution for a two-dimensional classification problem. a Complete linear separation of the two classes, using a biostatisticalmethod based on a generalized linear model with assumptions of linear relationship – a rare or non-existent situation in medicine. bPoor linear separation of a non-linear classification problem, performed by the same linear model. c An almost complete non-linearseparation of the two classes, using a biostatistical method based on a non-linear model such as an artificial neural network (ANN) withfour hidden nodes. d Complete non-linear separation of the two classes, using an ANN with eight hidden nodes. (Reproduced withpermission from Nilsson J. Risk Stratification in Cardiac Surgery: Algorithms and Applications. Faculty of Medicine Doctoral DissertationSeries 2005. Lund University: Lund, 2005: 102)
Copyright © 2008 British Journal of Surgery Society Ltd www.bjs.co.uk British Journal of Surgery 2008; 95: 817–826Published by John Wiley & Sons Ltd
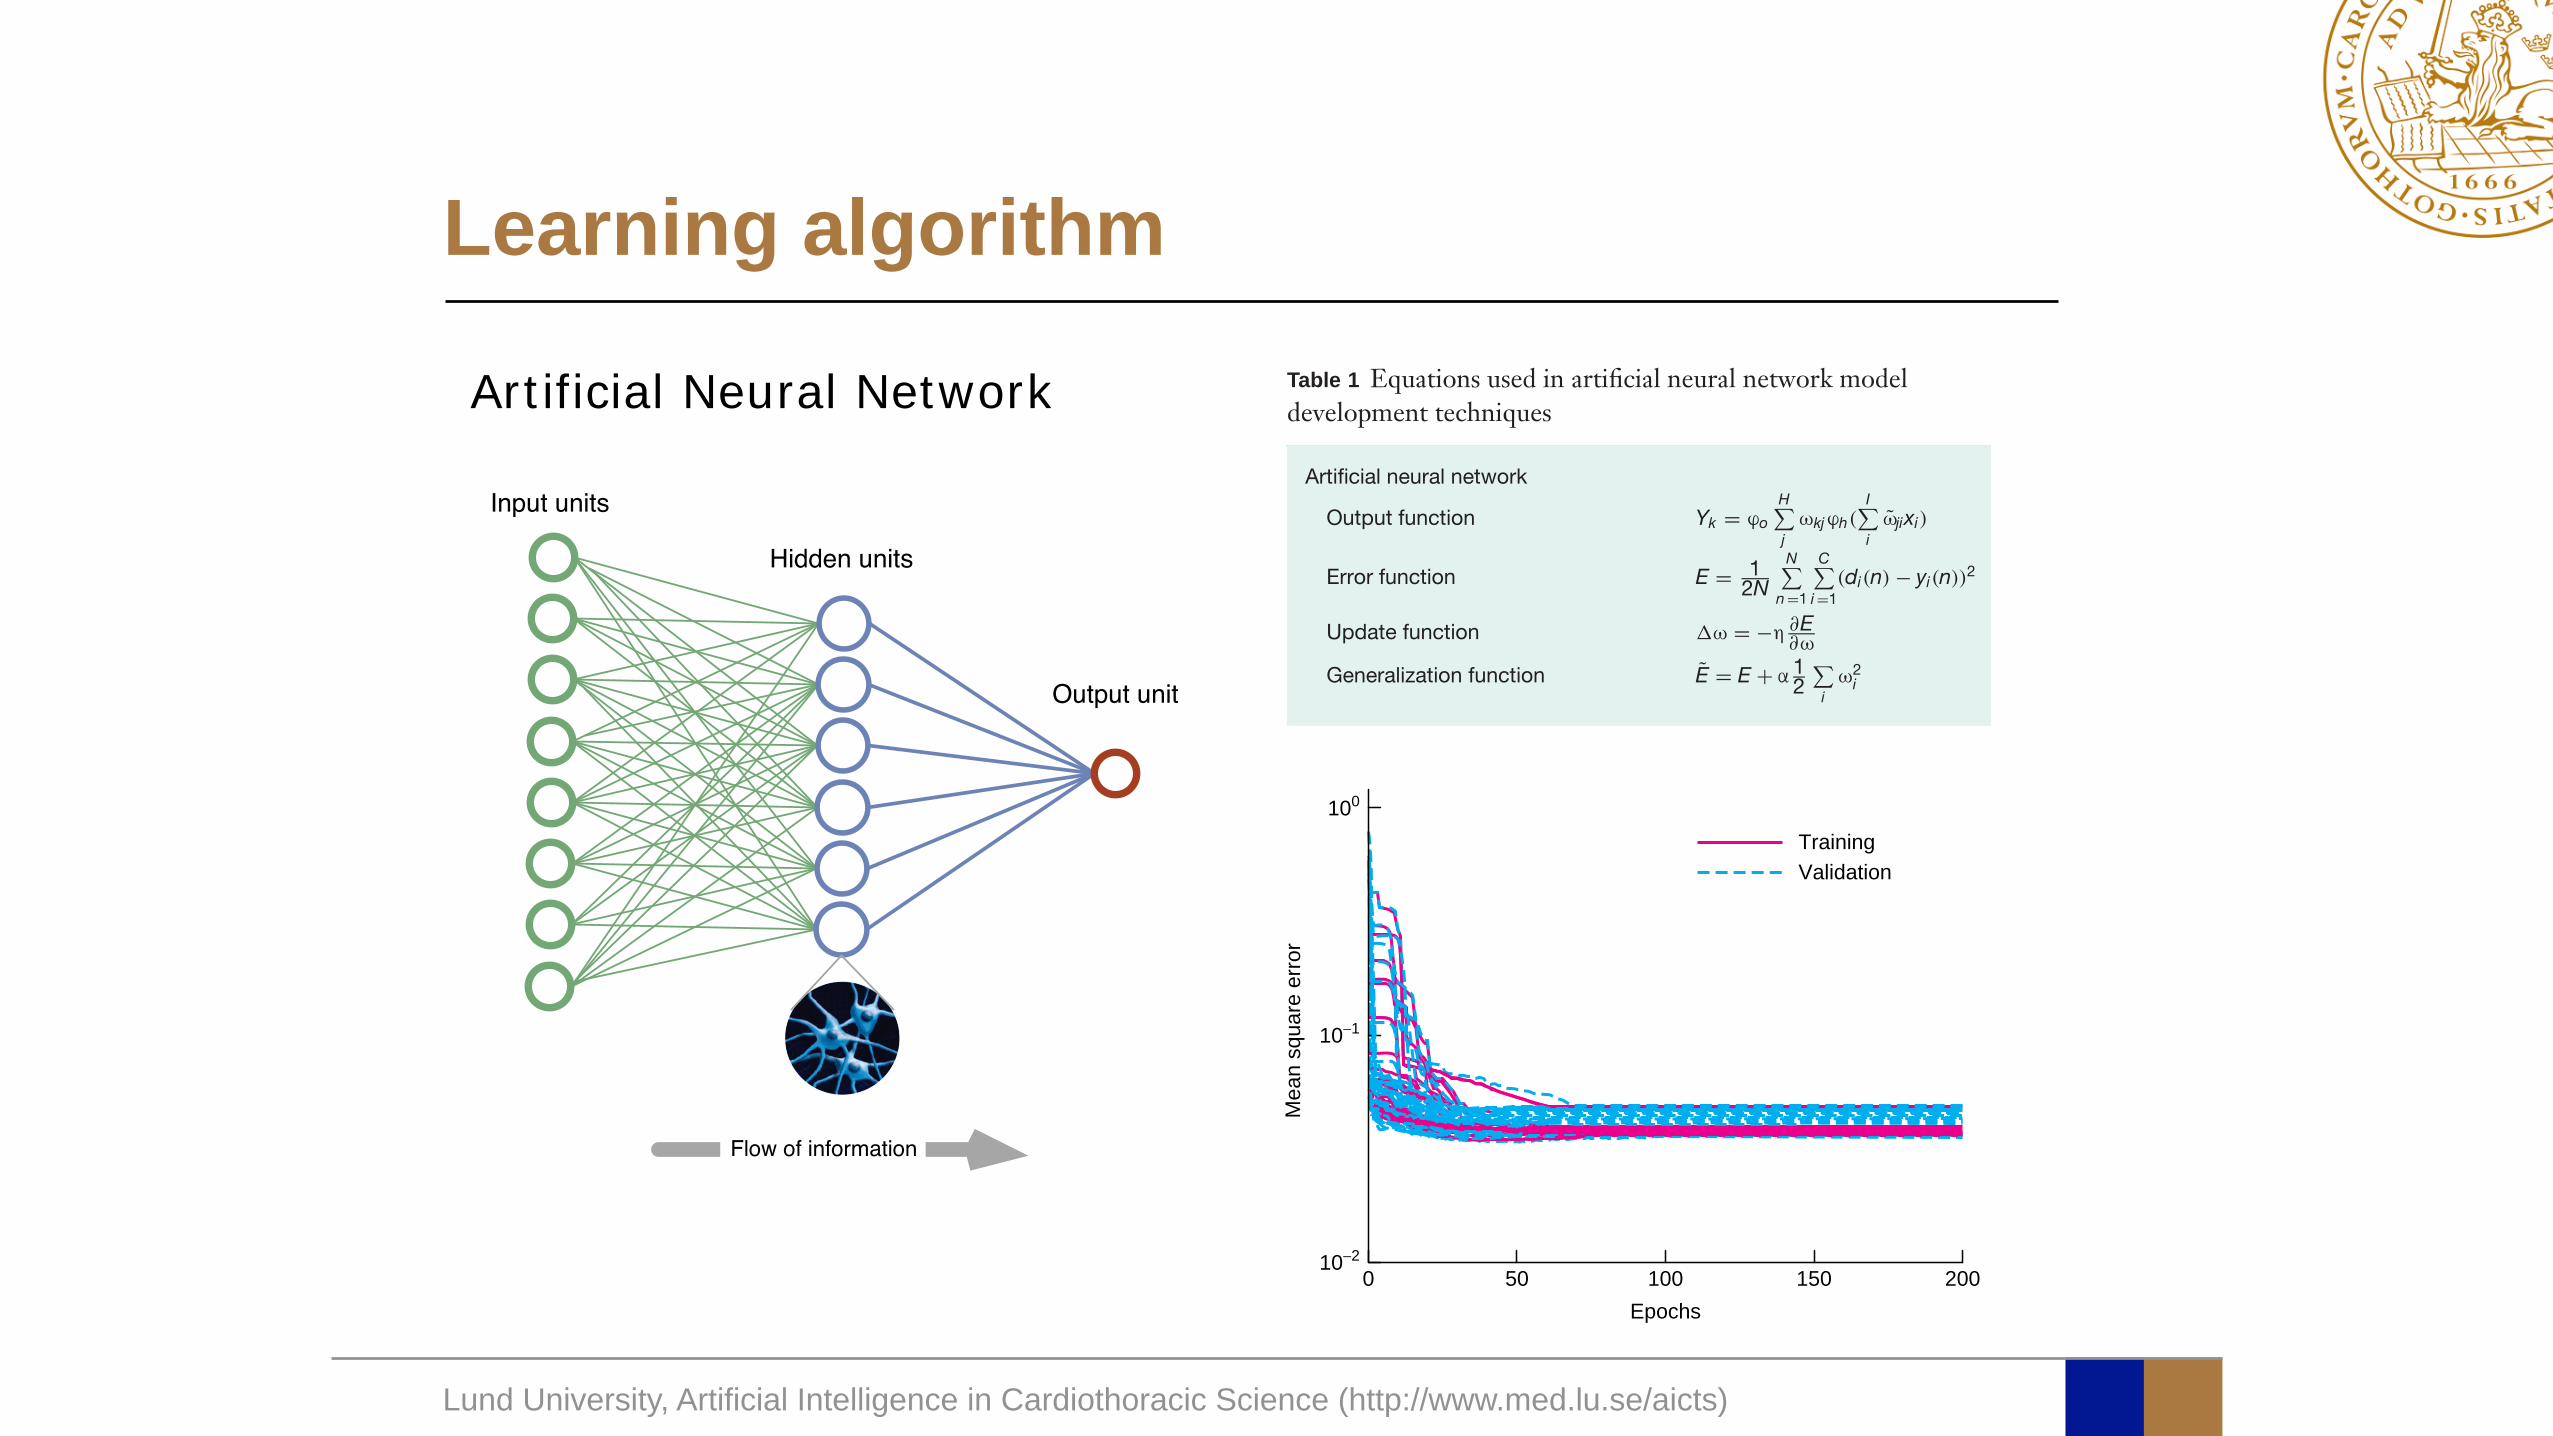
Input units
Hidden units
Output unit
Flow of information
Lund University, Artificial Intelligence in Cardiothoracic Science (http://www.med.lu.se/aicts)
Learning algorithm818 A. Bartosch-Harlid, B. Andersson, U. Aho, J. Nilsson and R. Andersson
The aim of this study was to perform a systematicreview of published reports of ANNs as predictive systemsin pancreatic disease. The experiences learned provide abasis for discussion of how ANNs can be used to improveboth diagnosis and prediction in acute pancreatitis andpancreatic cancer.
Methods
Electronic searches were conducted to identify reportsof published studies. Searches were restricted to articlespublished in English. The US National Library ofMedicine’s PubMed database, including Medline citationsfrom 1950 to 2007, was searched for articles onthe use of ANNs in pancreatic disease using theMeSH terms ‘neural networks (computer)’ combined
Input units
Hidden units
Output unit
Flow of information
Fig. 1 Diagram of a multilayer perceptron artificial neuralnetwork
Table 1 Equations used in artificial neural network modeldevelopment techniques
Artificial neural network
Output function Yk = ϕo
H!j
ωkjϕh(I!i
ωjixi)
Error function E = 12N
N!n =1
C!i =1
(di(n) − yi(n))2
Update function !ω = −η ∂E∂ω
Generalization function E = E + α 12
!i
ω2i
10−20 50 100
Epochs150 200
10−1
Mea
n sq
uare
erro
r
100
TrainingValidation
Fig. 2 Monitoring the calibration of 144 artificial neuralnetworks. The average classification error per sample (using asummed square error function) is plotted (y-axis) during thetraining iterations (x-axis) for both training and validationsamples. A pair of lines (training and validation) represents onemodel. The decrease in classification errors with increasingepochs demonstrates the learning of the models to distinguishbetween different outcomes. There is no sign of overtraining(overfit); if the models began to learn features in the training set,this would result in an increase in the error for validation at thatpoint, and the curves would diverge. (Reproduced withpermission from Nilsson J. Risk Stratification in Cardiac Surgery:Algorithms and Applications. Faculty of Medicine DoctoralDissertation Series 2005. Lund University: Lund, 2005: 102)
with ‘pancreatic neoplasms’, ‘pancreatitis’ or ‘pancreaticdiseases’. Additional articles were retrieved throughhyperlinks and by manually searching reference lists inoriginal published articles. A systematic review of thearticles was performed.
Artificial neural networks
An ANN17,18 consists of a set of processing units (nodes)that simulate neurones. These nodes are interconnected
Copyright © 2008 British Journal of Surgery Society Ltd www.bjs.co.uk British Journal of Surgery 2008; 95: 817–826Published by John Wiley & Sons Ltd
Artificial Neural Network
Lund University, Artificial Intelligence in Cardiothoracic Science (http://www.med.lu.se/aicts)
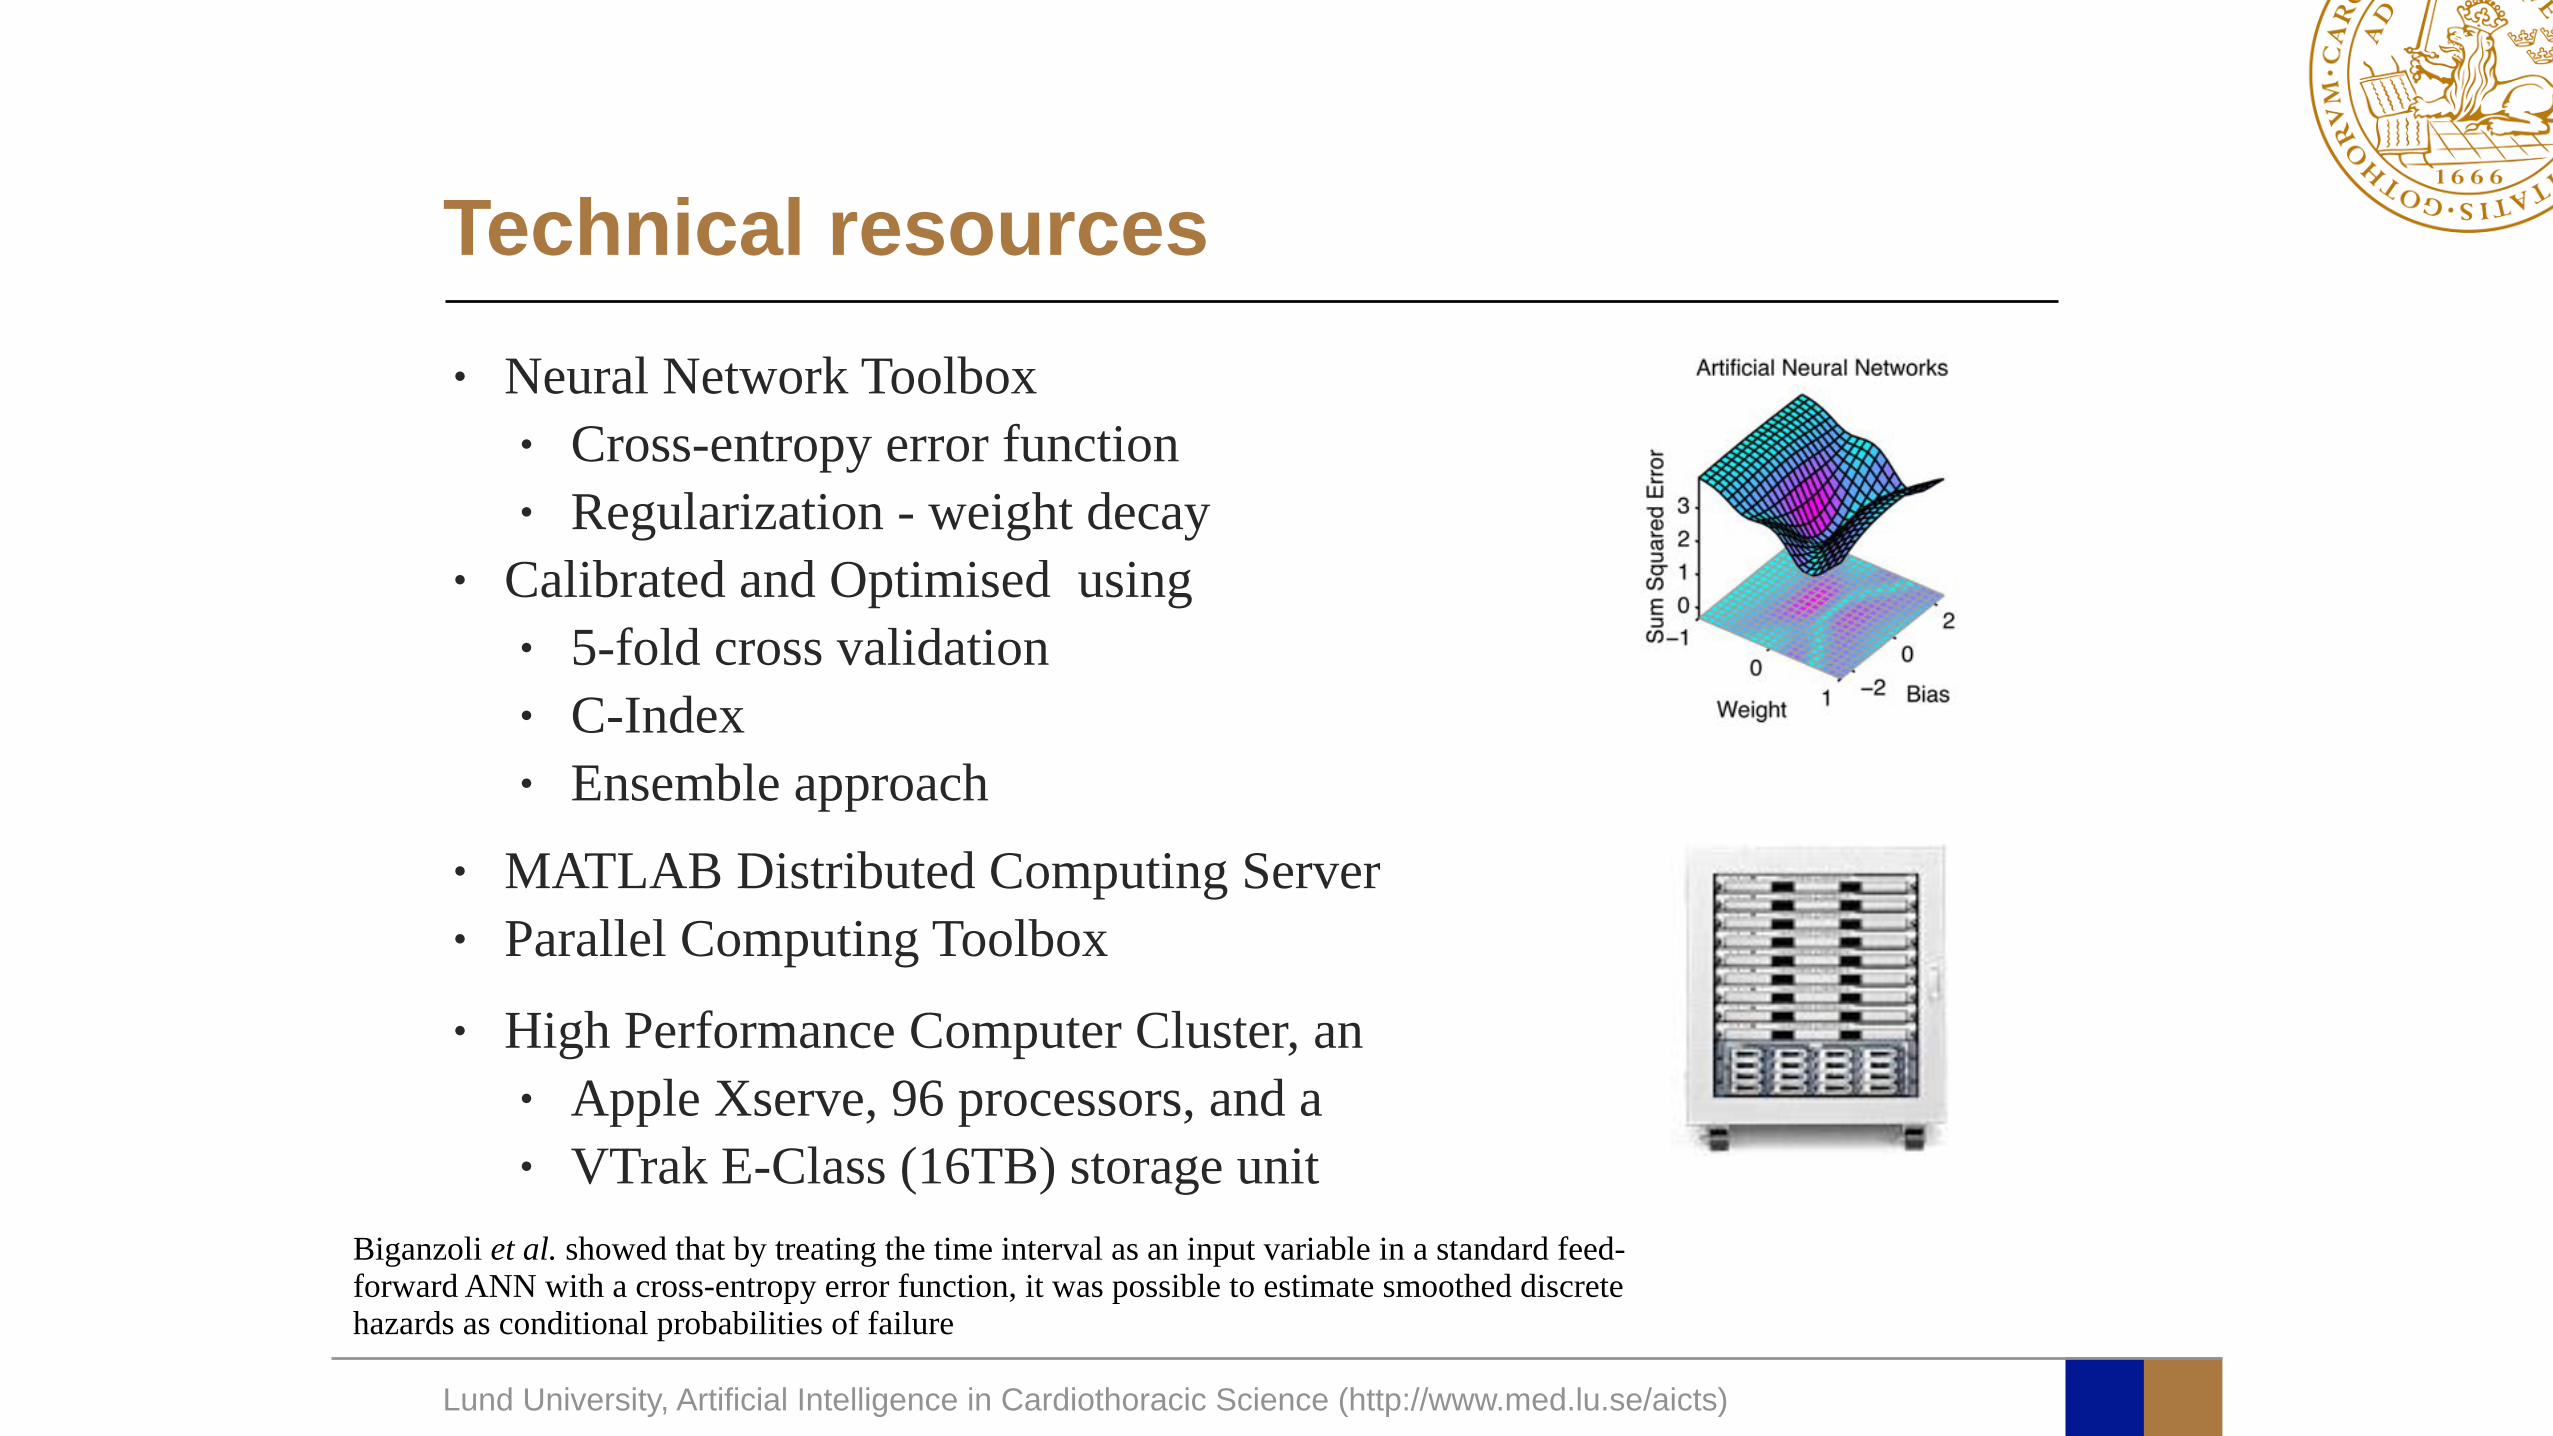
Technical resources• Neural Network Toolbox
• Cross-entropy error function• Regularization - weight decay
• Calibrated and Optimised using • 5-fold cross validation• C-Index• Ensemble approach
• MATLAB Distributed Computing Server• Parallel Computing Toolbox • High Performance Computer Cluster, an
• Apple Xserve, 96 processors, and a • VTrak E-Class (16TB) storage unit
Biganzoli et al. showed that by treating the time interval as an input variable in a standard feed-forward ANN with a cross-entropy error function, it was possible to estimate smoothed discrete hazards as conditional probabilities of failure
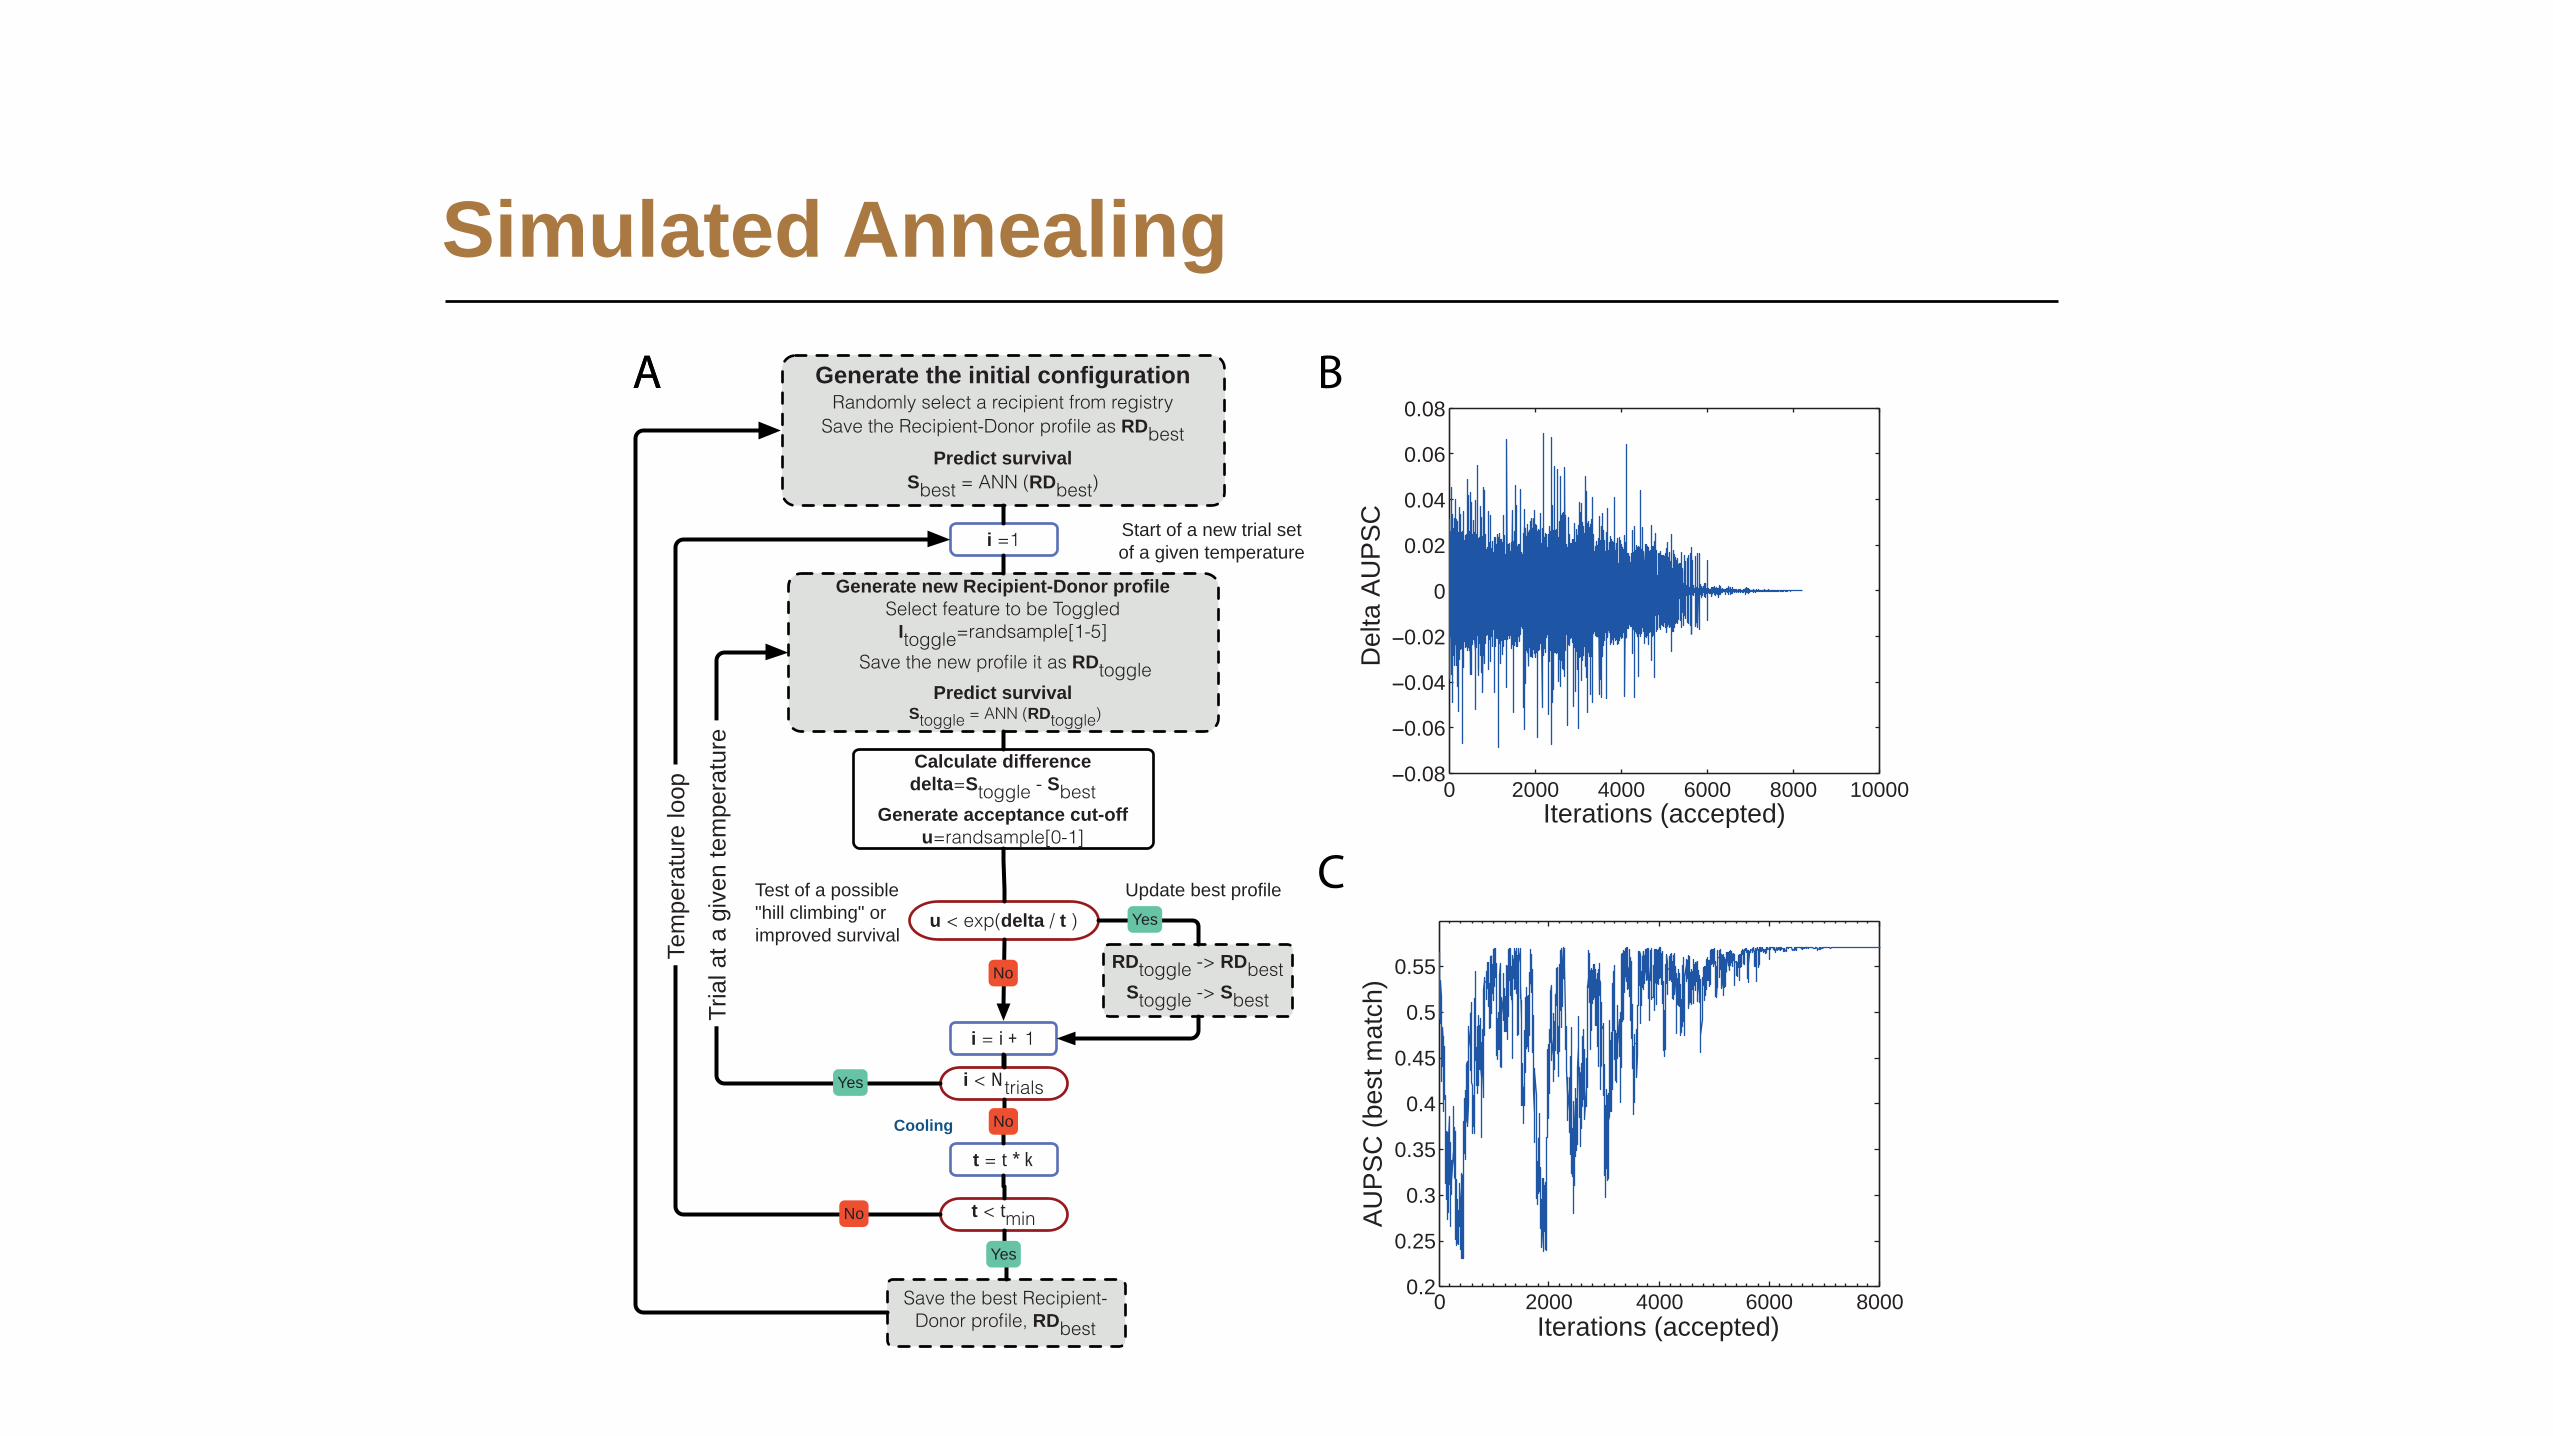
Generate new Recipient-Donor profile Select feature to be Toggled
Itoggle=randsample[1-5] Save the new profile it as RDtoggle
Predict survival Stoggle = ANN (RDtoggle)
i =1
Generate the initial configuration Randomly select a recipient from registry
Save the Recipient-Donor profile as RDbestPredict survival
Sbest = ANN (RDbest)
RDtoggle -> RDbestStoggle -> Sbest
t = t * k
t < tmin
Calculate differencedelta=Stoggle - Sbest
Generate acceptance cut-offu=randsample[0-1]
u < exp(delta / t )
i < Ntrials
Save the best Recipient-Donor profile, RDbest
No
i = i + 1
Tem
pera
ture
loop
Trial
at a
give
n te
mpe
ratu
re
Cooling
Test of a possible "hill climbing" or improved survival
Yes
Yes
No
No
No
Yes
Start of a new trial set of a given temperature
Update best profile
0 2000 4000 6000 8000 10000−0.08
−0.06
−0.04
−0.02
0
0.02
0.04
0.06
0.08
Iterations (accepted)
Delta
AUP
SC
0 2000 4000 6000 80000.2
0.25
0.3
0.35
0.4
0.45
0.5
0.55
Iterations (accepted)AU
PSC
(bes
t mat
ch)
AA B
C
Simulated Annealing

The Results
0 2 4 6 8 10 12
1
0.9
0.8
0.7
0.6
0.5
0.4
0.3
0.2
0.1
0
Time since transplantation (years)
Cum
ulativ
e m
orta
lity
0 2 4 6 8 10 12
1
0.9
0.8
0.7
0.6
0.5
0.4
0.3
0.2
0.1
0
Time since transplantation (years)
Cum
ulativ
e m
orta
lity
A B
Figure 3 | Customize Optimal Donor Using Simulated Annealing (CODUSA). Panel (A): Random selection of 1,000 patients and their respectivesurvival curve based on the best case customized donor profile. Panel (B): Random selection of 1,000 patients and their respective survival curve based onthe worse case customized donor profile.
Generate new Recipient-Donor profile Select feature to be Toggled
Itoggle=randsample[1-5]
Save the new profile it as RDtogglePredict survival
Stoggle = ANN (RDtoggle)
i =1
Generate the initial configuration Randomly select a recipient from registry
Save the Recipient-Donor profile as RDbestPredict survival
Sbest = ANN (RDbest)
RDtoggle -> RDbestStoggle -> Sbest
t = t * k
t < tmin
Calculate differencedelta=Stoggle - Sbest
Generate acceptance cut-offu=randsample[0-1]
u < exp(delta / t )
i < Ntrials
Save the best Recipient-Donor profile, RDbest
No
i = i + 1
Tem
pera
ture
loop
Trial
at a
give
n te
mpe
ratu
re
Cooling
Test of a possible "hill climbing" or improved survival
Yes
Yes
No
No
No
Yes
Start of a new trial set of a given temperature
Update best profile
0 2000 4000 6000 8000 10000−0.08
−0.06
−0.04
−0.02
0
0.02
0.04
0.06
0.08
Iterations (accepted)
Delta
AUP
SC
0 2000 4000 6000 80000.2
0.25
0.3
0.35
0.4
0.45
0.5
0.55
Iterations (accepted)
AUPS
C (b
est m
atch
)
AA
C
B
Figure 2 | Recipient donor match using simulation annealing (SA). Panel (A): The simulated annealing (SA) Monte Carlo algorithm: A recipient israndomly selected from the recipient registry. The predicted survival is calculated and the existed recipient-donor profile and the data are recorded. Thenthe simulation process is started. A donor variable and the value for this variable are selected at random. The difference (delta) between the predictedsurvival for this new recipient donor profile and the earlier best survival is calculated. If the predicted survival is better than the previous, the bestrecipient-donor profile and the best-predicted survival are updated. If not the test for allowance ‘‘uphill’’ moves are performed. The allowance for "uphill"moves saves the method from becoming stuck at local minima, which means that a worse value can be accepted in some cases. This procedure is repeated50 times and then the temperature is decreased with 4%. The whole procedure is started with 50 new trials at this new temperature. When the temperaturehas gone below 0.000025 the simulation for this patient is ended and a new is selected. The waiting list is updated with a new recipient, and the procedure isrepeated. Panel (B): Area under predicted survival curve (AUPSC) related to change in one of the SA variables. Panel (C): Monitoring of the simulatedannealing (SA) function as it is looking for a best-case match.
www.nature.com/scientificreports
SCIENTIFIC REPORTS | 3 : 1922 | DOI: 10.1038/srep01922 6
Lund University, Artificial Intelligence in Cardiothoracic Science (http://www.med.lu.se/aicts)
Virtual Recipient Donor Match Simulation
24
CODUSA - Customize Optimal DonorUsing Simulated Annealing In HeartTransplantationDaniel Ansari1, Bodil Andersson1, Mattias Ohlsson2, Peter Hoglund3, Roland Andersson1 & Johan Nilsson4
1Lund University and Skane University Hospital, Department of Clinical Sciences Lund, Surgery, 2Lund University, Department ofAstronomy and Theoretical Physics, Computational Biology and Biological Physics, 3Skane University Hospital, Department ofCompetence Centre for Clinical Research, 4Lund University and Skane University Hospital, Department of Clinical Sciences Lund,Cardiothoracic Surgery.
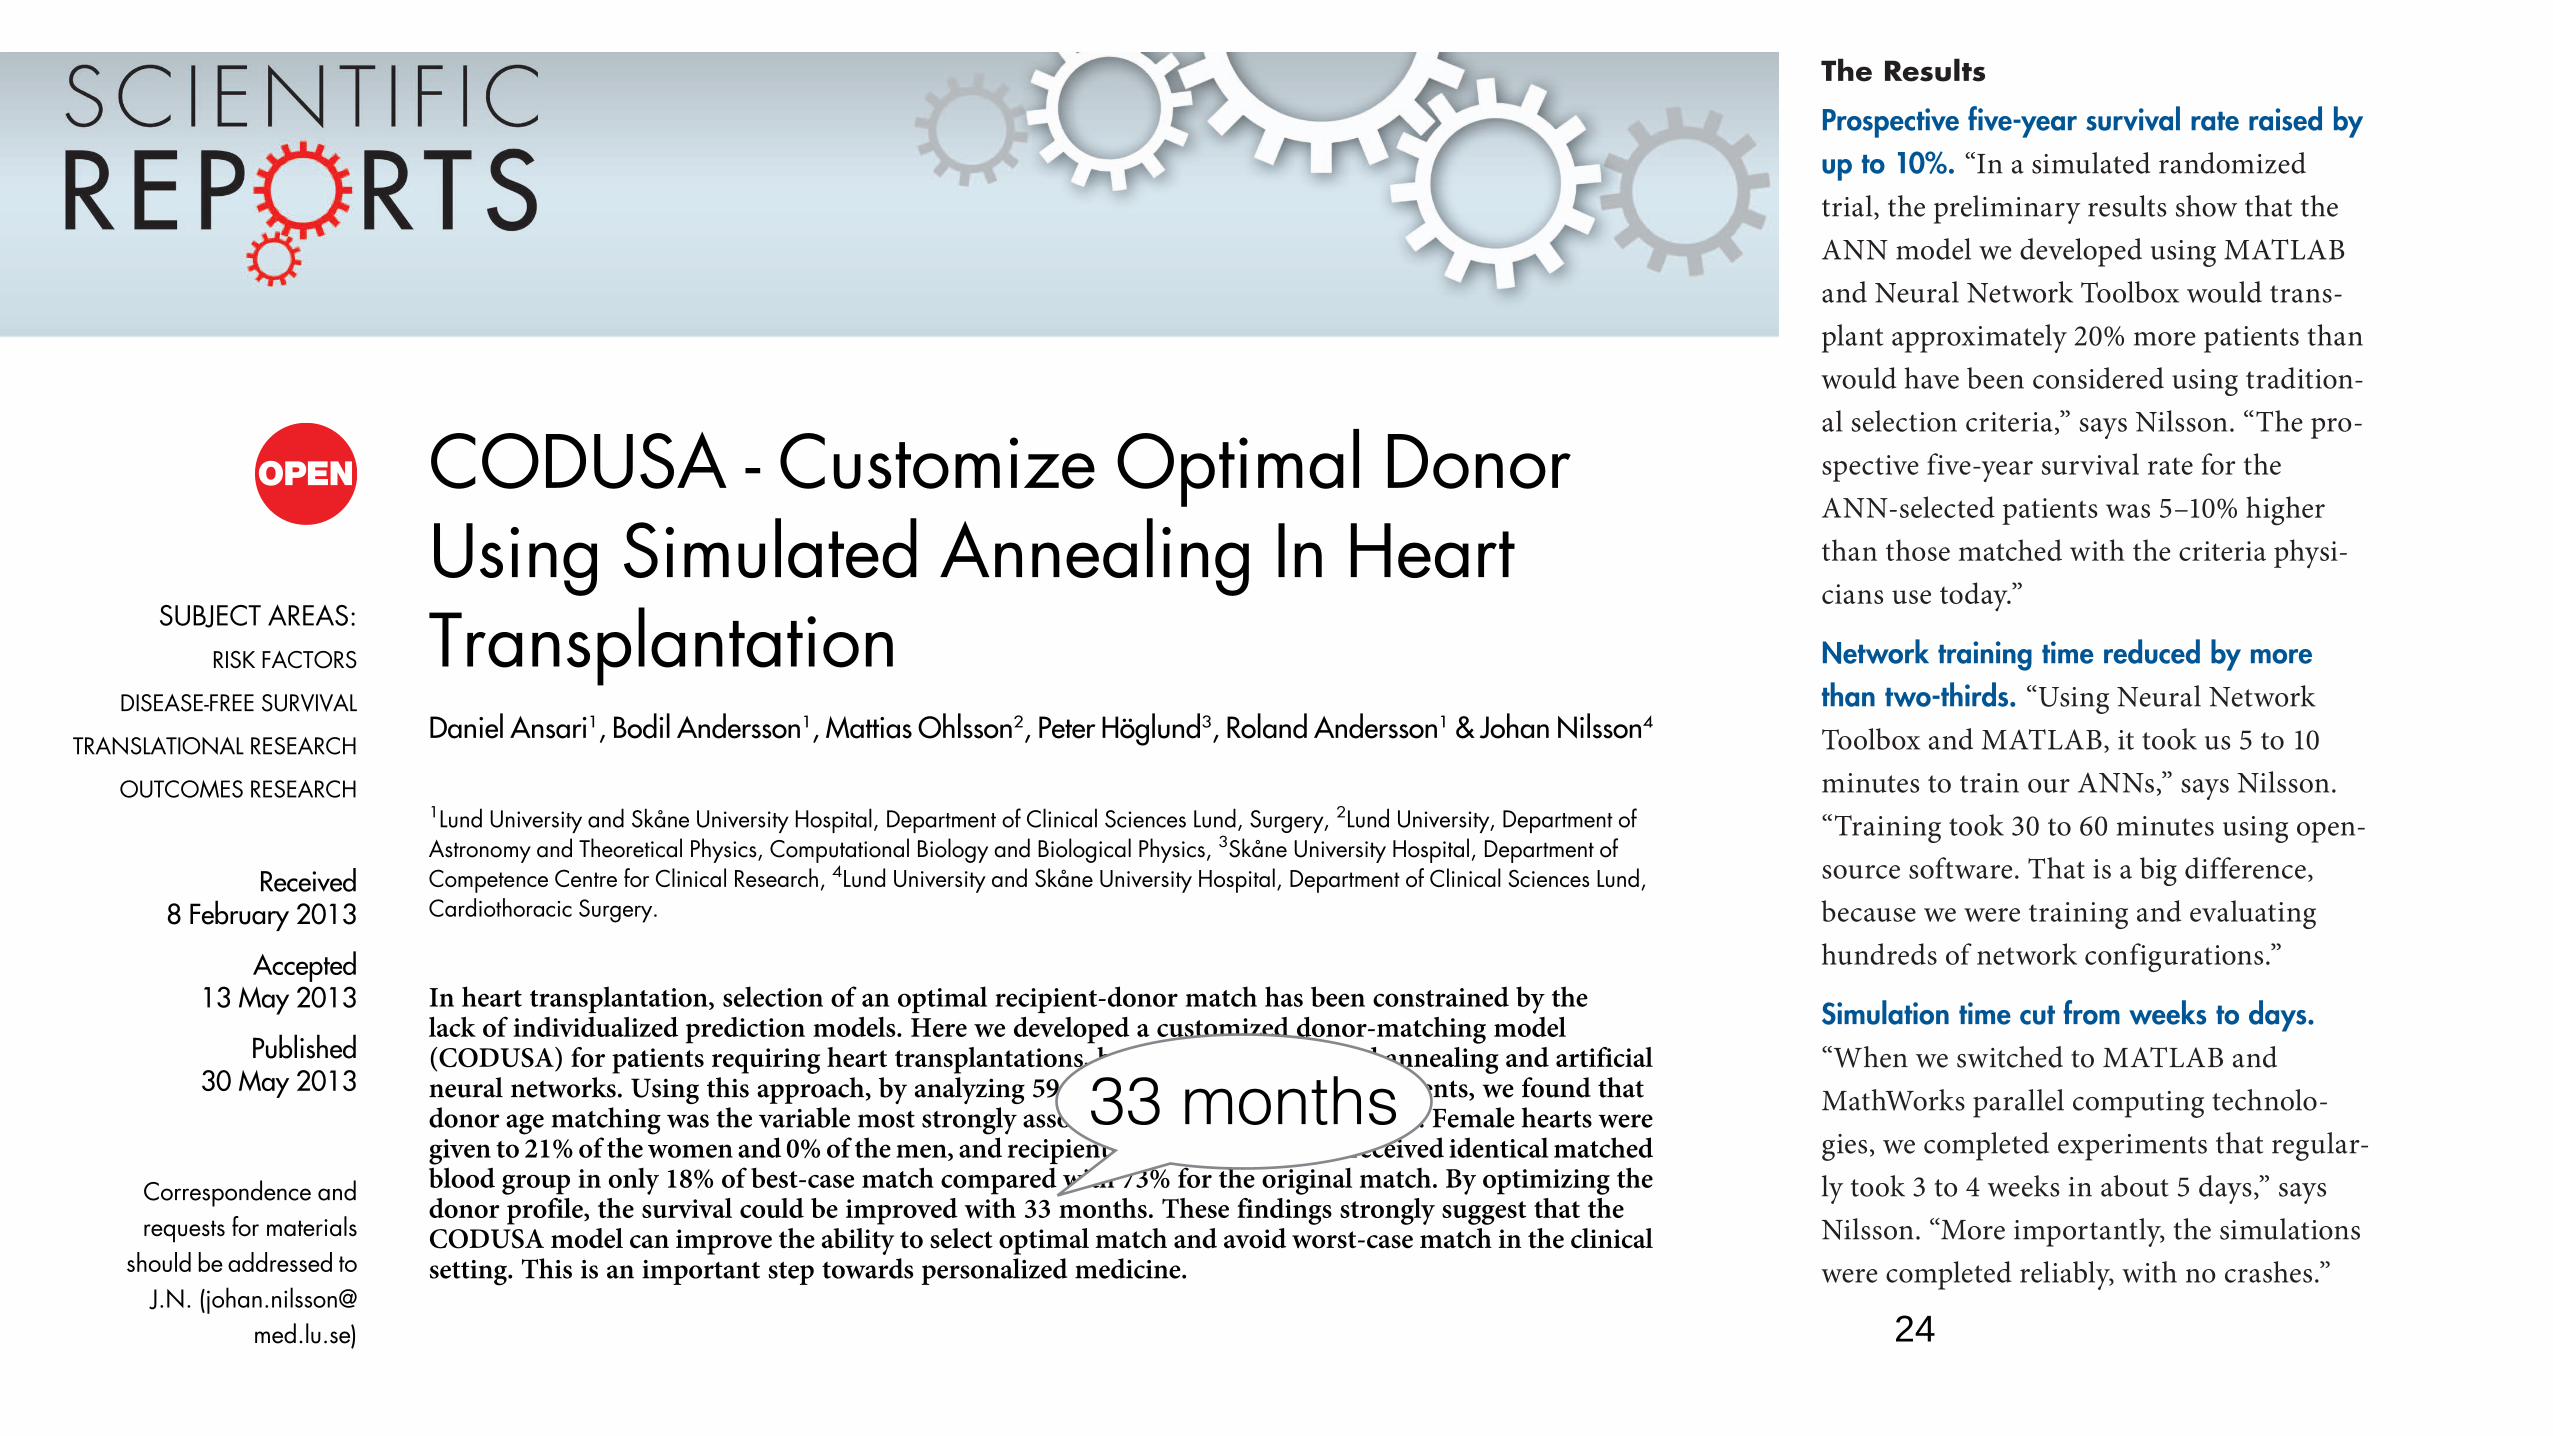
In heart transplantation, selection of an optimal recipient-donor match has been constrained by thelack of individualized prediction models. Here we developed a customized donor-matching model(CODUSA) for patients requiring heart transplantations, by combining simulated annealing and artificialneural networks. Using this approach, by analyzing 59,698 adult heart transplant patients, we found thatdonor age matching was the variable most strongly associated with long-term survival. Female hearts weregiven to 21% of the women and 0% of the men, and recipients with blood group B received identical matchedblood group in only 18% of best-case match compared with 73% for the original match. By optimizing thedonor profile, the survival could be improved with 33 months. These findings strongly suggest that theCODUSA model can improve the ability to select optimal match and avoid worst-case match in the clinicalsetting. This is an important step towards personalized medicine.
Heart transplantation is the only option for survival for selected patients with end-stage heart failure. Inrecent years, survival after heart transplantation has improved significantly. Reasons for improved out-come include refinement of donor and recipient selection methods, better donor organ preservation,
lower perioperative mortality rates, and enhanced immunosuppressive protocols1. The median survival is nowmore than 10 years2. However, donor scarcity is a major issue. In addition, suboptimal recipient-donor matchmay lead to acute rejection and cardiac allograft vasculopathy, leading to early and late mortality. Much researchhas been directed towards identifying factors predicting survival and optimal organ utilization.
Organ matching is primarily based on ABO blood group compatibility and patient size. Other factors such asgender, allograft ischemia time, medical conditions prior to transplant, and human leukocyte antigen (HLA)mismatch have all been implied as risk factors for acute rejection but may not be used in the organ matching2–5.Scant information exists concerning predictors of long-term survival after heart transplantation6. The long-termoutcome depends on several factors, and it is important to recognize that the influence from some of these variesover time. Because of the inherent complexity of coupled nonlinear biological systems, the development ofcomputational models may be necessary for achieving a quantitative understanding of the outcome7. Morecomplex analyses, including the interaction between several of the variables, are lacking and no study has todate created a personalized recipient donor matching model for identifying worst-case match, and to find bestpossible match in heart transplantation. Instead of using the traditional methodology based on standard linearmodel with the assumption of proportional hazards to predict the survival, a more flexible non-linear survivalmodel based on artificial neural networks (ANNs) is preferable8. Despite computational learning approachesbeing well suited for medical application there are only a few examples within the field of transplantation9.
The simulated annealing (SA) algorithm can be found in various research fields for parameter optimization.The SA algorithm developed by Kirkpatrick et al.10 has been previously applied to a wide range of medicalproblems, including microbial engineering, classification of cancer gene expression data and gamma knifeplanning11–13. SA is a random-search optimization technique for finding the global minimum of a cost function.SA is inspired by the physical process of controlled cooling of solid materials.
Here we show that SA could be used to ‘customize’ an optimal donor for the heart transplant recipients on thewaiting list, which makes it possible to avoid poor recipient-donor match, and identify the best possible match.
SUBJECT AREAS:RISK FACTORS
DISEASE-FREE SURVIVAL
TRANSLATIONAL RESEARCH
OUTCOMES RESEARCH
Received
8 February 2013
Accepted
13 May 2013
Published
30 May 2013
Correspondence andrequests for materials
should be addressed toJ.N. (johan.nilsson@
med.lu.se)
SCIENTIFIC REPORTS | 3 : 1922 | DOI: 10.1038/srep01922 1
recipient information from the databases, they verified the model’s accuracy by simu-lating outcomes for 10,000 patients that had
thousands of simulations in parallel to rank the 57 risk factors considered in the study
-
As a final step, the team developed an auto-
waiting list to identify the best candidates
Lund University researchers are using the
Leukocyte Antigen (HLA) genetic profiles
The Results
Prospective five-year survival rate raised by up to 10%. “In a simulated randomized trial, the preliminary results show that the ANN model we developed using MATLAB and Neural Network Toolbox would trans-plant approximately 20% more patients than would have been considered using tradition-al selection criteria,” says Nilsson. “The pro-spective five-year survival rate for the ANN-selected patients was 5–10% higher than those matched with the criteria physi-cians use today.”
Network training time reduced by more than two-thirds. “Using Neural Network Toolbox and MATLAB, it took us 5 to 10 minutes to train our ANNs,” says Nilsson. “Training took 30 to 60 minutes using open-source software. That is a big difference, because we were training and evaluating hundreds of network configurations.”
Simulation time cut from weeks to days. “When we switched to MATLAB and MathWorks parallel computing technolo-gies, we completed experiments that regular-ly took 3 to 4 weeks in about 5 days,” says Nilsson. “More importantly, the simulations were completed reliably, with no crashes.”
33 months
Lund University, Artificial Intelligence in Cardiothoracic Science (http://www.med.lu.se/aicts)
•ANN could be used to predict individual long-term survival
•A VRDM model using ANN allows transplant physicians to risk stratify risk-benefit analysis inherent to any donor offer
•Simulation of future outcome for each recipient on the waiting list would make it possible to avoid worse case match, and to choose best possible match in the clinical

Thank You!