Virginia Quiet Pavement Study - Virginia Department of ... Quiet Pavement Study (Fall 2012 Update)...
34
Virginia Quiet Pavement Study (Fall 2012 Update) Kevin McGhee Associate Principal Scientist Fall Asphalt Conference Richmond, VA 1
Transcript of Virginia Quiet Pavement Study - Virginia Department of ... Quiet Pavement Study (Fall 2012 Update)...

Virginia Quiet Pavement Study (Fall 2012 Update)
Kevin McGhee
Associate Principal Scientist
Fall Asphalt Conference
Richmond, VA
1

2
Quiet Pavement Technologies (2011)
Asphalt:
– Open-graded with 9.5mm top-size stone and rubberized AC (AR-PFC 9.5)/1-inch
– Open-graded with 9.5mm top-size stone and polymer-mod. AC (PFC 9.5)/1-inch
– Open-graded with 12.5mm top-size stone and polymer-mod. AC (PFC 12.5)/2-inch
Concrete:
– Conventional Diamond Grind (CDG)
– Next Generation Conc. Surf. (NGCS)

Noise Measurement
Tire-Pavement
(i.e. OBSI)


3 dB – just
noticeable
5 dB –
obvious
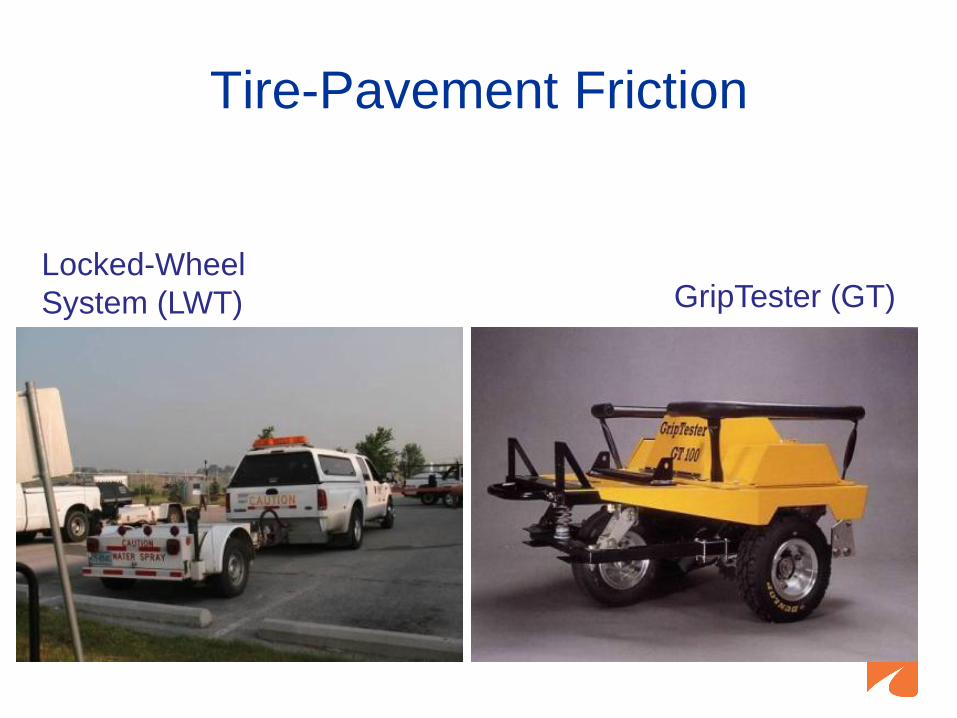
Locked-Wheel
System (LWT) GripTester (GT)
Tire-Pavement Friction
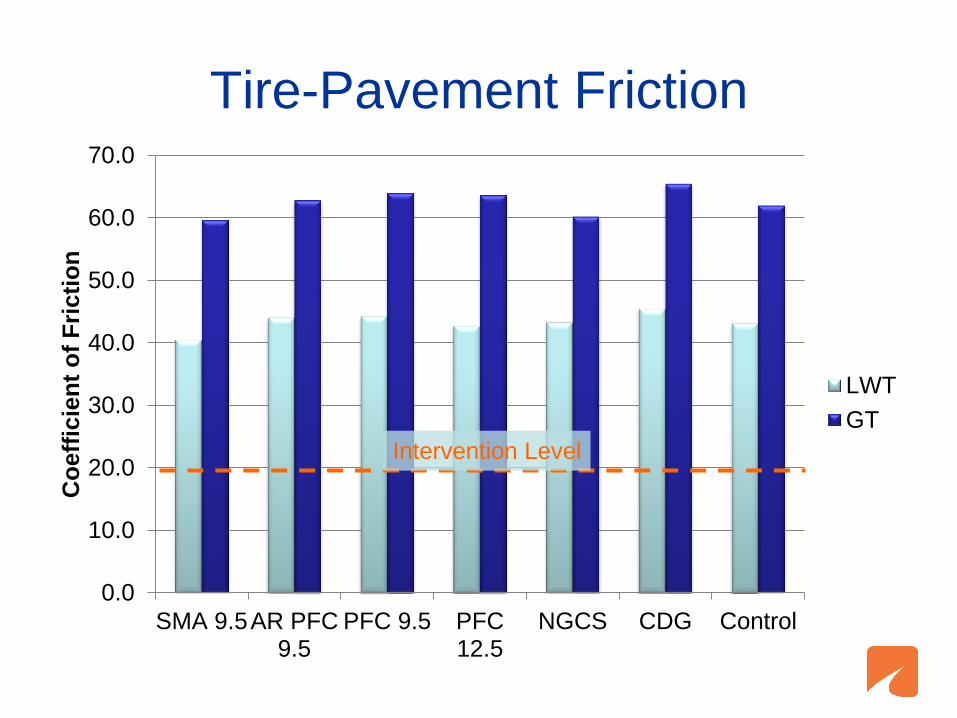
Tire-Pavement Friction
0.0
10.0
20.0
30.0
40.0
50.0
60.0
70.0
SMA 9.5AR PFC9.5
PFC 9.5 PFC12.5
NGCS CDG Control
Co
eff
icie
nt
of
Fri
cti
on
LWT
GT
Intervention Level

Macrotexture
0.0
0.2
0.4
0.6
0.8
1.0
1.2
1.4
1.6
1.8
SMA 9.5AR PFC9.5
PFC 9.5 PFC12.5
NGCS CDG Control
MP
D (
mm
)
RWP
BWP
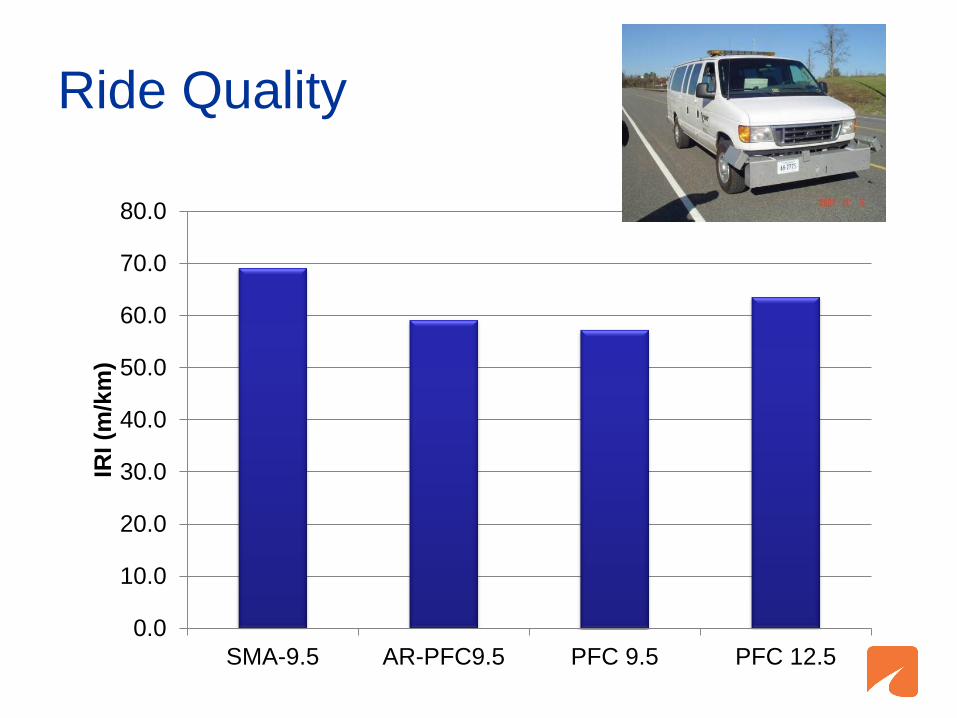
Ride Quality
0.0
10.0
20.0
30.0
40.0
50.0
60.0
70.0
80.0
SMA-9.5 AR-PFC9.5 PFC 9.5 PFC 12.5
IRI (m
/km
)

Pay Adjustment for Smoothness
-1.0
0.0
1.0
2.0
3.0
4.0
5.0
6.0
7.0
8.0
9.0
SMA-9.5 AR-PFC9.5 PFC 9.5 PFC 12.5
Incen
tive (
$/t
on
)

Summary – 2011 Demos
• QP technologies (asphalt) measurably less noisy than control, but on average not noticeably (≥ 3dB)
• QP Technologies exhibit excellent ride quality and skid resistance
• The QP technologies have reduced splash and spray with improved wet-weather visibility (word of mouth)
• There were no reports of compromised safety during winter weather with QP

For more information:
Links to Interim Report: http://www.virginiadot.org/VDOT/Projects/asset_upload_file884
_5721.pdf
12


NCAT 2012 Track Rebuild
- 2012 Virginia PFC
- 2012 Other PFC
- 2009 Other PFC
- 2012 Virginia SMA/DGA/Recycle

QP Use Strategy (the LCA)
• Cost components:
– QP technology as substitute for noise barriers?
– “Acoustic longevity” – QP replacement cycle?
– Additional maintenance costs – winter and periodic cleaning/vacuuming
• Value of benefits (?):
– lower noise
– improved safety & comfort
– Reduced rolling resistance

SMA Research Update
•Phase 1 – Network Performance Review
• 10 years full-scale production
•Phase 2 – Material & Lab Analysis
• “Underperforming” SMA 9.5
mixes/applications

Phase 1 - Service Life Models
0
2
4
6
8
10
12
14
16
18
20
Pre
dic
ted
Svc.
Lif
e (
yrs
.)
SM-9.5A SM-9.5D SM-12.5A SM-12.5D SM-12.5E SMA-12.5
Linear Euler

Field Review 2011 - Summary
Mix Category
Observed Distress Types
Reviewed Material Structural
SMA 9.5(70-22) 8 5 1
SMA 9.5(76-22) 4 2 2
SMA 12.5 (70-22) 14 1 6
SMA 12.5(76-22) 2 1 1
Totals* 28 9 10
*Includes RAP and Virgin Mixes

SMA-9.5 (Flushing,Shoving, and…)

SMA-9.5 (…Rutting)

Phase 2 – Material & Lab
• Design issues
– “Unpredictable” performance of the finer SMA (SMA 9.5) mixes.
– Both successful and not-so-successful in compliance (mostly) with design requirements.
• Application issues
– SMA mixes are performing well on high-volume facilities with signalized intersections but localized mixed failures have been observed at locations with high turning and stopping movements.

Phase 2 - What we did
• Identify mixtures with known performance
(good, bad, and marginal)
• Fabricate “reproduction” mixtures
• Conduct aggregate gradation analysis
• Conduct lab performance tests
– Dynamic modulus (to evaluate stiffness)
– Flow number (rutting susceptibility)
– Indirect tensile strength
– Asphalt pavement analyzer (rutting?)

Mixture details
Mix ID % Pbe
Fiber, %
by wt of
AC
% passing
No. 4
Field
Performance
GPM1 6.5 4.6 27.9 Good
GPM2 6.3 5.5 31.3 Good
MPM 6.3 5.5 29.5 Mixed
PPM 7.2 4.0 42.4 Poor
*Note: original plant mixtures except GPM1 had anti-strip but the
lab mixes did not have them. GPM 1 had 1% lime. All ‘D’ mixes
used PG 70-22 binder. MPM had 15% RAP.

Poor performing mixture
comparatively finer
Gradation

Poor performing mixture
comparatively finer
Stone-on- stone contact: PPM has least

Stone-on-stone contact: VCA

Dynamic Modulus Master
Curves

Flow Number at 54°C

Indirect tensile strength

APA rut

0
500
1000
1500
2000
2500
3000
3500
4000
4500
GPM1 GPM2 MPM PPM
FN
(cycle
s)
PG70-22 PG76-22
Flow Number – Polymer Modification

Conclusions
• Good performing SMA mixtures obeying the “30-20-10”
rule performed better in terms of |E*|, FN, and ITS
tests. Ranking of mixtures based on these performance
tests compared quite well with field performance.
Therefore, these tests could be useful for evaluating
SMA performance.
• SMA mixtures with good field performance were
associated with comparatively better aggregate
packing characteristics. The measured VCAmix for the
good performing mixtures ranged from 33.7 to 35.9
percent compared with 38.2 to 41.9 for the poor
performing mixtures.

Conclusions (II)
• The APA was found not to be sensitive to either binder
content or aggregate packing characteristics for the
mixtures considered. Therefore, care needs to be
taken when using the APA to evaluate SMA
performance in the lab.
• A combination of traffic characteristics (slow-moving,
turning, or stopped), poor aggregate packing (higher
VCAmix, higher percent passing No. 4 sieve), and
binder amount, may have contributed to the poor SMA
field performance.

Bottom Line
• MPM and PPM no longer produced
• Recent changes to SMA spec – gradation
band changes and break-point sieve –
supported by field and laboratory work
• New SMA 9.5 mixes are in production and
“looking good”
• We’ll take credit for it in the VCTIR final
report – early 2013


![Composite Pavement Virginia Tech 09 Cr2[1]](https://static.fdocuments.net/doc/165x107/577d36c61a28ab3a6b93fd5c/composite-pavement-virginia-tech-09-cr21.jpg)