Virginia Department of Corrections Older Inmate...
21
Virginia Department of Corrections Older Inmate Population October 17, 2011 Managing Geriatric Inmates Deerfield CC Warden, Keith Davis Geriatric Offenders in the SR Confined Population Deputy Director, Cookie Scott Releasing Geriatric Offenders Parole Board Chair, Bill Muse
Transcript of Virginia Department of Corrections Older Inmate...

Virginia Department of Corrections
Older Inmate Population
October 17, 2011
Managing Geriatric Inmates Deerfield CC Warden, Keith Davis
Geriatric Offenders in the SR Confined Population
Deputy Director, Cookie Scott
Releasing Geriatric Offenders Parole Board Chair, Bill Muse

Virginia Department of Corrections
Older Inmate Population
October 17, 2011
Managing Geriatric Inmates Deerfield CC Warden, Keith Davis

DOC Challenges of an Aging Inmate Population
• DOC legislatively obligated to meet inmates’ needs – Eighth Amendment to the U.S. Constitution – American with Disabilities Act (ADA) – Civil Rights of Institutionalized Persons Act (CRIPA)
• All inmates, regardless of age, are assessed for physical and mental
problems and accommodated accordingly
• Many older inmates have different physical or mental health requirements than younger inmates – Problems with mobility, medical conditions, hearing, vision and diet
create special needs in providing for their housing and care – Special security needs: victimized by younger inmates – Special programming and treatment needs – Discharge planning challenges: special housing and medical needs
3 VA DOC October 17, 2011

Special Needs Facility Deerfield Correctional Center
• Dedicated to housing inmates with special needs
• Has expanded from 497 to an Average Daily Population (ADP) of 1,072 in December 2010
• Assisted Living Unit increased from 40 to 57 beds in 2009
• Approximately 16 inmates are wheelchair dependent and an additional 61 require a wheelchair for distance
• 4 of 6 housing units are equipped with a nurses’ station for easy access
*Management Information Summary Annual Report Year Ending June 30, 2010, VADOC Division of Administration, Financial Management & Reporting Unit, p.36
4 VA DOC October 17, 2011

Re-Entry
• Throughout incarceration, the goal of VADOC is to prepare each inmate for a successful release and return to a productive life in society
• DOC strives to provide a seamless transition from incarceration to the community
• Successful Re-Entry is vital to promoting public safety
• Older inmates pose specific challenges to successful Re-Entry – Increasing number of medically and mentally disabled offenders returning to
the community
– Shrinking number of Assisted Living Facility (ALF) beds and inadequate number of Medicaid nursing home beds
– Lack of specialized housing for violent offenders and sex offenders
5 VA DOC October 17, 2011
Virginia Department of Corrections
Older Inmate Population
October 17, 2011
Geriatric Offenders in the SR Confined Population
Deputy Director, Cookie Scott

Defining Geriatric Offenders • Inmates are often considered to “age” more rapidly than the
general population
• To account for differences in physiological age, geriatric offender literature generally looks at offenders who are age 50 or older
• VA DOC looks at “geriatric” offenders for 2 groups: • Offenders age 50 to 64
• Offenders age 65+
VA DOC October 17, 2011
7

0%
20%
40%
60%
80%
100%
2001 2002 2003 2004 2005 2006 2007 2008 2009 2010
% o
f SR
Po
pu
lati
on
Fiscal Year
65+
45 - 64
25 - 44
Under 25
Age Distribution of State Responsible Population FY2001– FY2010
• 65+ year old group increased from 1% to 2% of the SR Confined Population
• 45 to 64 year old group increased from 16% to 26% of the SR Confined Population
• 25 to 44 year old group have decreased from 66% to 59% of the SR Confined Population
• Under 25 year old group have decreased from 17% to 13% of the SR Confined Population
8 VA DOC October 17, 2011

State Responsible Confined and Newly Committed Inmates Age 50+ FY1990 – FY2010*
FY90 FY92 FY94 FY96 FY98 FY00 FY02 FY04 FY06 FY08 FY10*
Confined 50+ 822 927 1,169 1,444 1,731 2,240 2,849 3,537 4,133 5,090 5,697
Confined 50+ Percent 5% 4% 5% 5% 6% 7% 8% 10% 11% 13% 15%
NCC 50+ 265 278 263 251 327 393 566 676 889 1,094 1,112
NCC 50+ Percent 3% 3% 3% 3% 4% 4% 5% 6% 7% 8% 9%
0%
3%
6%
9%
12%
15%
18%
• Confined inmates age 50+ have increased almost seven-fold from 822 to 5,697 over the past 20 years
• New commitments age 50+ have increased four-fold from 265 to 1,112 over the past 20 years
• 9% of the SR NCC and 15% of the SR Confined Population are age 50+
Source: RMS Inmate Data File, March 1, 2011. Confined Population information is as of June 30th of each year. NCC information is inmates sentenced within the fiscal years listed. *FY2010 NCC data is preliminary; Confined Population for FY2010 is as of May 2011.
VA DOC October 17, 2011
9

Primary Offense by Age Groups
0%
20%
40%
60%
80%
100%
Under 50 (n=32,067) 50 -64 (n=5,196) 65+ (n=513)
Drugs
Property/Public Order
Violent
• 82% of the age 65+ inmates and 62% of inmates in the 50-64 age group are incarcerated for a violent crime. This compares to only 57% of the younger inmates
• The most common offense for older inmates is rape/sexual assault (36% of the 65+ age group).
Source: RMS Inmate Data File, March 1, 2011. SR inmates incarcerated on July 7, 2010. Excludes <1% of each age group whose primary offense has not yet been reported.
10 VA DOC October 17, 2011

Number of Prior SR Incarcerations by Age Group
0% 20% 40% 60% 80% 100%
Under 50(n=32,067)
50 -64(n=5,196)
65+ (n=513)
First SR Incarceration One Prior SR Incarceration Two Prior SR Incarcerations Three or More Prior SR Incarcerations
• 75% of the 65+ group are serving their first SR incarceration
• 54% of the 50-64 group are serving their first SR incarceration
• 65% of the Under 50 group are serving their first SR incarceration
Source: RMS Inmate Data File, March 1, 2011. SR inmates incarcerated on July 7, 2010. Prior SR Incarcerations includes all prior periods of incarceration in Virginia for an SR sentence.
11 VA DOC October 17, 2011

FY2010 SR Confined Population Age at Sentencing by Age Groups
Inmate Age at Sentence
Under 50 in FY2010 50 – 64 in FY2010 65+ in FY2010
Under 18 755 2% 25 <1% 0 0%
18 – 24 11,236 35% 408 8% 10 2%
25 – 29 6,824 21% 391 8% 14 3%
30 – 34 4,903 15% 376 7% 32 6%
35 – 39 3,794 12% 412 8% 33 6%
40 – 44 3,079 10% 501 10% 36 7%
45 – 49 1,476 5% 1,047 20% 42 8%
50 – 54 0 0% 1,316 25% 45 9%
55 – 59 0 0% 588 11% 52 10%
60 – 64 0 0% 132 3% 94 18%
65+ 0 0% 0 0% 155 30%
Total 32,067 5,196 513
• Under 50 group: 83% sentenced between 18-39 (56% sentenced by age 29)
• 50-64 group: 66% sentenced between 40-59 (56% sentenced age 45+)
• 65+ group : 67% sentenced age 50+ (49% sentenced age 60+)
• Average Age of Total SR Confined population is 37.2
Source: RMS Inmate Data File, March 1, 2011. SR inmates incarcerated on July 7, 2010.
12 VA DOC October 17, 2011

SR Confined Population – FY2010 Projected Length of Stay1 by Age Groups
Under 50 50 – 64 65+
TIS (n=27,058)
PE (n=4,502)
TIS (n=3,652)
PE (n=1,995)
TIS (n=301)
PE (n=267)
Mean Projected Length of Stay* (years) 9.7 24.6 9.7 33.3 10.8 30.4
Median Projected Length of Stay* (years) 5.3 21.7 5.2 29.3 8.3 27.1
Death Sentences 11 (<1%) 0 (0%) 0 (0%)
Single or Multiple Life Sentences 671 (2%) 636 (14%) 153 (4%) 583 (29%) 19 (6%) 109 (41%)
Three Time Loser Sentences 179 (<1%) 22 (<1%) 101 (3%) 49 (2%) 6 (2%) 3 (1%)
• On average, older inmates have longer projected lengths of stay
• A higher percentage of the older inmates have life sentences
• Average Projected LOS is 11.8 years (Median = 6.2) • Average Projected LOS for Truth-In-Sentencing (TIS) Offenders is 9.7 years (Median = 5.3)
• Average Projected LOS for Parole Eligible (PE) Offenders is 27.0 years (Median = 23.9)
1Projected LOS is the total amount of time it is expected that an inmate will be incarcerated from the beginning of his incarceration (including Pre-Trial time spent in jail) until his projected release date (Good Time Release Date for TIS offenders; Mandatory Parole Release Date for PE offenders); those with life, death or three time loser sentences were excluded from the Projected LOS calculations because it is not known when they will be released. 2TIS category includes offenders with only TIS sentences; PE category includes BOTH offenders with only parole eligible sentences AND offenders with a combination of TIS and PE sentences (these offenders must satisfy the TIS portion of their sentence before satisfying the PE portion) Source: RMS Inmate Data File, March 1, 2011. SR inmates incarcerated on July 7, 2010.
13 VA DOC October 17, 2011

Costs of Managing Geriatric Inmates • Facilities: The FY2010 per capita expense at Deerfield was $29,600 while
most other Medium Security Dormitories (MSD) average $18,000
• Medical: – Medical expenditures have increased from 12% to 15% of the DOC’s Operating
expenditures between FY2006 and FY2010
– Most medical expenditure data is not available by age
Medical Cost Per Capita
% of Total DOC Operating Expenditures
FY2006 $3,637 11.9%
FY2007 $4,059 12.9%
FY2008 $4,393 12.9%
FY2009 $4,322 13.2%
FY2010 $4,827 14.9%
Per Capita Medical Expenditures
14 VA DOC October 17, 2011

FY2010* Off-site Medical Expenditures by Age Group
Age Group Total Combined
Expense** Average
Members*** Average Age
Group Expense
Under 18 $0 13 $0.00
18 – 24 $1,495,703 4,037 $370.48
25 – 29 $3,731,391 5,652 $660.18
30 – 34 $3,607,425 5,459 $660.83
35 – 39 $3,635,561 4,505 $807.02
40 – 44 $5,555,491 4,487 $1,238.02
45 – 49 $7,307,690 3,992 $1,830.39
Total Under 50 $795.27
50 – 54 $7,359,765 2,500 $2,944.00
55 – 59 $6,099,762 1,329 $4,590.89
60 – 64 $3,165,939 614 $5,158.35
65+ $3,873,469 440 $8,795.01
Total 50 and Older $5,372.06
Combined $1,387.68
• The off-site portion of medical
expenses is available by age group through the medical provider (Anthem Insurance)
• Off-site medical expenses would be greatly impacted by an aging population and would be reflective of the increased costs associated with an older group
• Off-site costs are almost 23% of the total medical expenditures ,NOT the total costs
• The average inmate under the age of 50 has annual off-site medical costs of $795
• The average inmate age 50 and older has annual off-site medical costs of $5,372
15
Based on DOC Actual and Annualized Medical Expenses by Gender and Age Category, May 2009-April 2010. *The data on this slide represents the time of May 2009-April 2010. **These costs are for off-site expenses only, excluding the costs of drugs and dental. ***A member is an inmate shown as enrolled in Anthem Insurance during the specified period.
VA DOC October 17, 2011

Virginia Department of Corrections
Older Inmate Population
October 17, 2011
Releasing Geriatric Offenders Parole Board Chair, Bill Muse
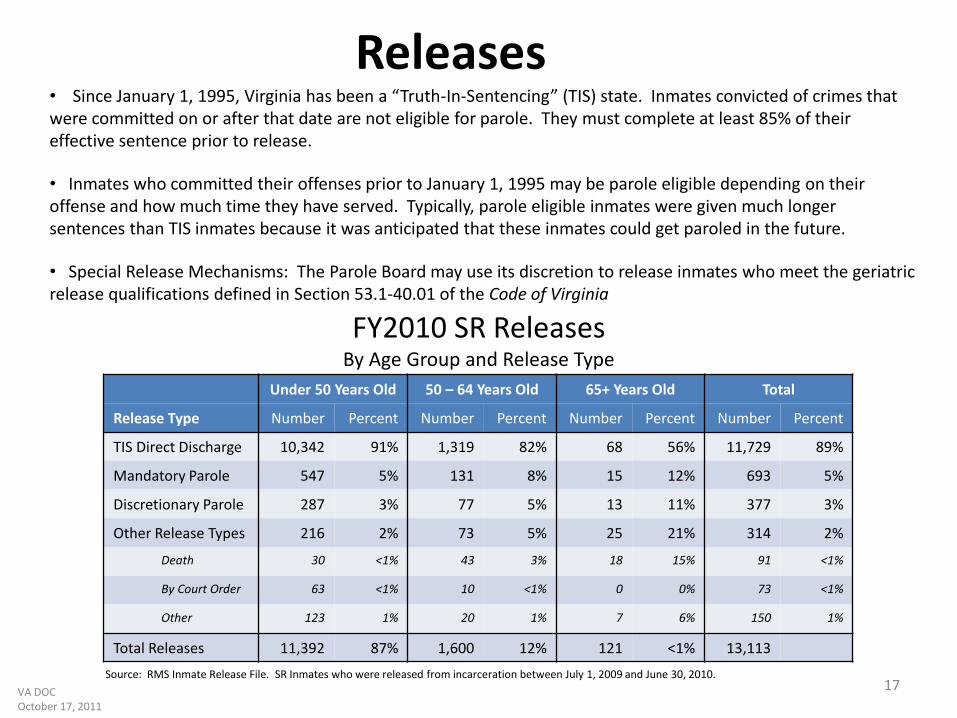
Releases • Since January 1, 1995, Virginia has been a “Truth-In-Sentencing” (TIS) state. Inmates convicted of crimes that were committed on or after that date are not eligible for parole. They must complete at least 85% of their effective sentence prior to release.
• Inmates who committed their offenses prior to January 1, 1995 may be parole eligible depending on their offense and how much time they have served. Typically, parole eligible inmates were given much longer sentences than TIS inmates because it was anticipated that these inmates could get paroled in the future.
• Special Release Mechanisms: The Parole Board may use its discretion to release inmates who meet the geriatric release qualifications defined in Section 53.1-40.01 of the Code of Virginia
Source: RMS Inmate Release File. SR Inmates who were released from incarceration between July 1, 2009 and June 30, 2010.
Under 50 Years Old 50 – 64 Years Old 65+ Years Old Total
Release Type Number Percent Number Percent Number Percent Number Percent
TIS Direct Discharge 10,342 91% 1,319 82% 68 56% 11,729 89%
Mandatory Parole 547 5% 131 8% 15 12% 693 5%
Discretionary Parole 287 3% 77 5% 13 11% 377 3%
Other Release Types 216 2% 73 5% 25 21% 314 2%
Death 30 <1% 43 3% 18 15% 91 <1%
By Court Order 63 <1% 10 <1% 0 0% 73 <1%
Other 123 1% 20 1% 7 6% 150 1%
Total Releases 11,392 87% 1,600 12% 121 <1% 13,113
FY2010 SR Releases By Age Group and Release Type
17 VA DOC October 17, 2011

Inmates Eligible for Geriatric Release Consideration
• Conditional Geriatric Release Clause (§53.1-40.01) allows certain inmates who were NOT convicted of a Class 1 Felony to apply for early release. To be eligible to apply for Geriatric Release:
• Must be at least 60 years old AND served at least 10 years OR
• Must be at least 65 years old AND served at least 5 years
• Between 2003 and 2010 there has been a 93% increase in the number of inmates eligible for Geriatric Release (339 to 653)
• 129 of 653 eligible inmates applied for Geriatric Release in CY2010 and only 9 (7%) were granted
• The majority of geriatric inmates released were released after completing their sentence, NOT through a special release mechanism
*Source: Virginia Parole Board Geriatric Caseload Summaries
2004 2006 2008 2010
60 to 64 191 50% 232 51% 295 51% 330 51%
65+ 194 50% 222 49% 283 49% 323 49%
Total Eligible 385 454 578 653
18 VA DOC October 17, 2011

Most Serious Offense of Inmates Considered for Geriatric Release CY2004 - 2010
• Most inmates considered for Geriatric Release between CY2004 and CY2010 committed either Homicide or Rape/Sexual Assault
Source: Virginia Parole Board Geriatric Caseload Summaries
2004 2006 2008 2010
Homicide 12 31% 15 42% 28 47% 58 45%
Rape/Sexual Assault 12 31% 10 28% 14 24% 37 29%
Abduction 1 3% 1 3% 2 3% 2 2%
Robbery 2 5% 1 3% 3 5% 9 7%
Assault 0 0% 4 11% 9 15% 2 2%
Weapons 0 0% 1 3% 0 0% 4 3%
Burglary/B&E 2 5% 0 0% 0 0% 2 2%
Larceny/Fraud 1 3% 1 3% 1 2% 6 4%
Sex Offense 1 3% 0 0% 1 2% 3 2%
Drug Sales/Possession 3 8% 3 8% 1 2% 6 4%
39 36 59 129
19 VA DOC October 17, 2011

Reasons for Geriatric Release Denial CY2004-2010
• Most inmates considered for Geriatric Release between CY2004 and CY2010 were denied due to seriousness of their crimes
• Reasons for not applying for Geriatric Release include annual discretionary parole reviews and inmates not wanting to be released
*Source: Virginia Parole Board Geriatric Caseload Summaries Other Type of Release includes Releases Due to Medical Reasons and Releases to Discretionary Parole
2004 2006 2008 2010
Denied – Serious Nature of Crimes 34 87% 31 86% 53 90% 116 90%
Denied – Risk to Community 1 3% 2 6% 1 2% 3 2%
Other Type of Release 2 5% 1 3% 0 0% 1 1%
Granted 2 5% 2 6% 5 8% 9 7%
Total Considered 39 36 59 129
20 VA DOC October 17, 2011

Geriatric Release Eligibility of the SR Confined Population as of June 30, 2010
21 VA DOC October 17, 2011
• Average current age for currently PE is 49.1 years, for PE in the Future is 45 years and for Not PE is 45.2 years.
• Average time from Geriatric Eligibility until expected release* for currently PE is 16.7 years, for PE in the Future is 10.3 years and for Not PE is 16.2 years.
•For parole eligible offenders, expected release date is set at the mandatory release date. However, these offenders may be discretionarily released prior to that date.