Virginia Amtrak Ridership Report Jeremy Latimer …...• Amtrak ridership is down nationwide •...
16
Virginia Amtrak Ridership Report Jeremy Latimer Director of Rail Programs
Transcript of Virginia Amtrak Ridership Report Jeremy Latimer …...• Amtrak ridership is down nationwide •...

Virginia Amtrak Ridership Report Jeremy LatimerDirector of Rail Programs

2
Year‐to‐Year Percent Change
Total VirginiaSponsoredRoutes
v.Amtrak Total
‐15%
‐10%
‐5%
0%
5%
10%
15%
20%Virginia Average Amtrak Average

3
‐15%
‐10%
‐5%
0%
5%
10%
15%
20%Virginia Average Amtrak Average
Jan 16 – 52,925Jan 17 – 61,871
Jan 17 – 61,871Jan 18 – 58,170
Mar 17 – 70,585Mar 18 – 66,945
Mar 16 – 78,661Mar 17 – 70,585 Apr 17 – 78,467
Apr 18 – 68,517
Apr 16 – 66,469Apr 17 – 78,467
Start of Discount Code Elimination
Year‐to‐Year Percent Change
Total VirginiaSponsoredRoutes
v.Amtrak Total
4
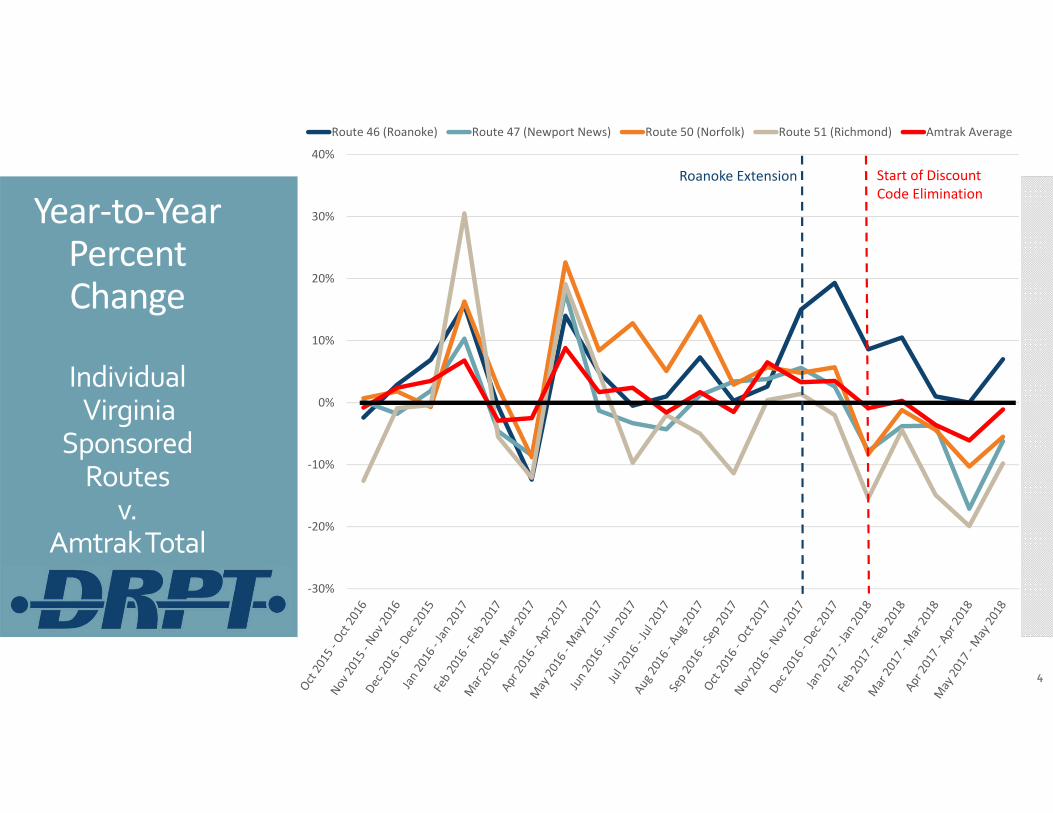
Year‐to‐Year Percent Change
IndividualVirginia
SponsoredRoutes
v.Amtrak Total
‐30%
‐20%
‐10%
0%
10%
20%
30%
40%
Route 46 (Roanoke) Route 47 (Newport News) Route 50 (Norfolk) Route 51 (Richmond) Amtrak Average
Start of Discount Code Elimination
Roanoke Extension

5
Summary Year‐to‐Year Ridership
March – May Trends
• Amtrak ridership is down nationwide• Virginia sponsored Amtrak routes are on a downward trend that is greater
than the national average.
System Average Mar 17 – Mar 18 Apr 17 – Apr 18 May 17 – May 18
Amtrak ‐3.6% ‐6.1% ‐1.1%North East Corridor ‐7.7% ‐5.2% ‐1.7%
Virginia Sponsored Routes ‐5.5% ‐11.8% ‐3.6%

6
SummaryMonth‐to‐Month
March – May Trends• Typically Virginia sponsored routes see a ridership increase of >30% from February
to March. However, in 2018 the increase was only 25.3% system wide.
• FY18 deviates from trends in ridership recovery compared to FY 15, 16, & 17.• Historically, the normal trend shows a high recovery in March followed by a
weaker recovery in April. • FY 18 was weaker in March than usual and even weaker in April suggesting a
downward trend in annual ridership.
Route Feb ‘15 – Mar ‘15 Feb ‘16 – Mar ‘16 Feb ‘17 – Mar ‘17 Feb ‘18 – Mar ‘18VA Average +40.9% +45.4% +32.9% +25.3%
Route Mar ‘15 – Apr’15 Mar ‘16 – Apr ‘16 Mar ‘17 – Apr ‘17 Mar ‘18 – Apr ‘18VA Average +2.9% ‐16.2% +10.7% +3.2%

7
SummaryMonth‐to‐Month
Feb – Apr Trends• Typically Virginia sponsored routes see a ridership increase of >30% from February to March. However, in 2018 the increase was
only 25.3% system wide.
• FY18 deviates from trends in ridership recovery compared to FY 15, 16, & 17. Historically, the normal trend shows a high recovery in March followed by a weaker recovery in April. FY 18 was weaker in March than usual and even weaker in April suggesting a downward trend in annual ridership.
Route Feb ‘15 – Mar ‘15 Feb ‘16 – Mar ‘16 Feb ‘17 – Mar ‘17 Feb ‘18 – Mar ‘18
46 Roanoke +41.7% +56.8% +38.2% +26.3%
47 Newport News +40.6% +39.7% +34% +34.1%
50 Norfolk +40.7% +45.7% +29.6% +25.3%
51 Richmond +40.5% +39.4% +29.7% +15.4%
VA Average +40.9% +45.4% +32.9% +25.3%
Route Mar ‘15 – Apr’15 Mar ‘16 – Apr ‘16 Mar ‘17 – Apr ‘17 Mar ‘18 – Apr ‘18
46 Roanoke ‐1.1% ‐17.6% +7.2% +6.1%
47 Newport News ‐3.4% ‐11.5% +13.9% ‐2%
50 Norfolk +0.4% ‐16.8% +11.8% +5%
51 Richmond +15.7% ‐18.9% +10% +3.6%
VA Average +2.9% ‐16.2% +10.7% +3.2%

8
SummaryNet RevenueYear‐to‐Date
Federal Fiscal Year‐to‐Date Trends
• Discount code eliminations: Amtrak’s initial projections showed that although ridership would suffer, revenue would increase.
• Ridership and revenue are both down on Virginia sponsored Amtrak routes year‐to‐date.
• The revenue increase on the Route 46 is likely due to the Roanoke extension in October.
Route
FFY 16YTD
Revenue
FFY 17 YTD
Revenue
FFY16‐FFY17YTD Revenue
Change
FFY16 – FFY17YTD Ridership
Change
FFY 17YTD
Revenue
FFY 18YTD
Revenue
FFY17‐FFY18YTD Revenue
Change
FFY17 – FFY18YTD Ridership
Change
46 Roanoke $8M $8.3M +2.9% +7.0% $8.3M $9.5M +13.6% +7.0%
47 NewportNews $13.9M $14.2M +1.4% ‐6.2% $14.2M $13.7M ‐3.2% ‐6.2%
50 Norfolk $5.7M $5.9M +4.3% ‐5.5% $5.9M $5.9M +1.3% ‐5.5%
51 Richmond $6M $6.2M +1.6% ‐9.8% $6.2M $5.9M ‐5.1% ‐9.8%
VA Total $33.6M $34.6M +2.3% ‐3.8% $34.6M $35M +1.3% ‐3.8%
9
Potential Reasons for
2018 Ridership Decline
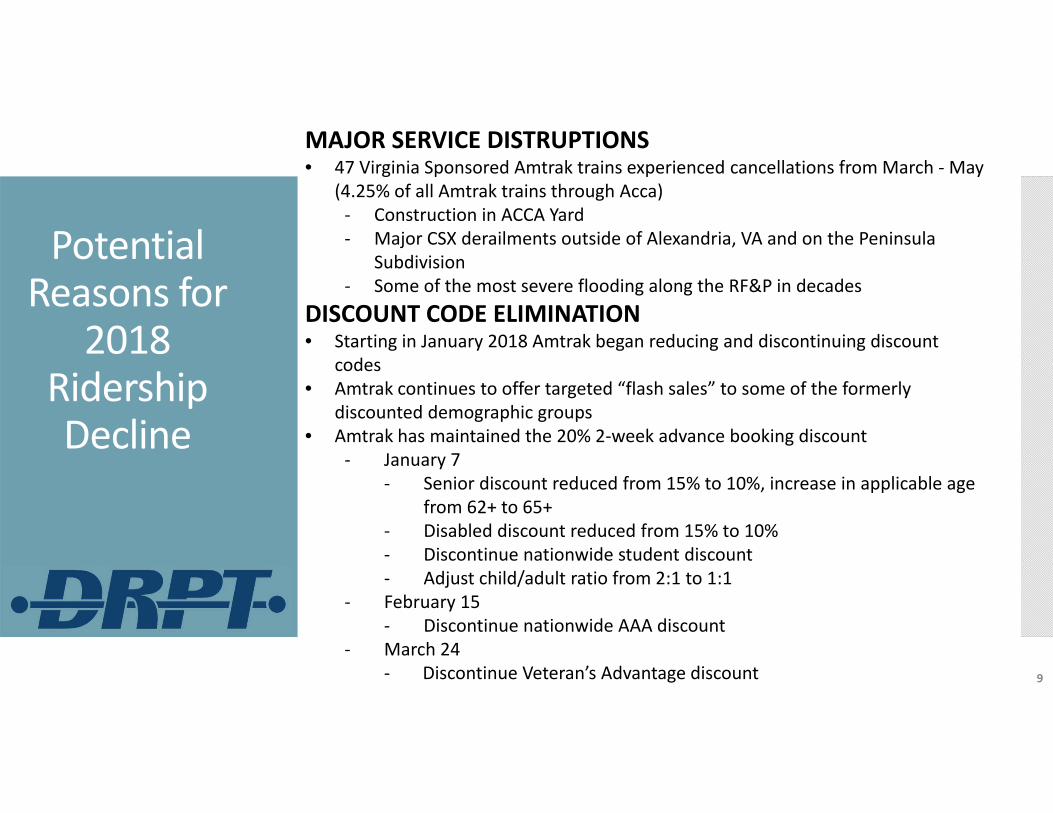
MAJOR SERVICE DISTRUPTIONS • 47 Virginia Sponsored Amtrak trains experienced cancellations from March ‐May
(4.25% of all Amtrak trains through Acca)‐ Construction in ACCA Yard‐ Major CSX derailments outside of Alexandria, VA and on the Peninsula
Subdivision‐ Some of the most severe flooding along the RF&P in decades
DISCOUNT CODE ELIMINATION• Starting in January 2018 Amtrak began reducing and discontinuing discount
codes • Amtrak continues to offer targeted “flash sales” to some of the formerly
discounted demographic groups• Amtrak has maintained the 20% 2‐week advance booking discount
‐ January 7‐ Senior discount reduced from 15% to 10%, increase in applicable age
from 62+ to 65+ ‐ Disabled discount reduced from 15% to 10% ‐ Discontinue nationwide student discount‐ Adjust child/adult ratio from 2:1 to 1:1
‐ February 15 ‐ Discontinue nationwide AAA discount
‐ March 24‐ Discontinue Veteran’s Advantage discount

10
Potential Reasons
DISCOUNT CODE ELIMINATION• Senior Discount (64,876 in FFY17).• Disabled discount (5,820 in FFY17).• Student discount (19,101 in FFY17).• Adjust child/adult ratio from 2:1 to 1:1 (12,854 in FFY17).• AAA discount (20,810 in FFY17).• Veteran’s Advantage discount (1,506 in FFY17).124,967 Discount Codes Used on Virginia Sponsored Amtrak Routes in FFY17.

11
Potential Reasons for
2018 Ridership Decline
Reason National Virginia
Decline in the Price of Gasoline
HeightenedCompetition from Airlines
Heightened Competition from Express Buses
Unreliable Arrivals & Departures
High ProfileAmtrak Accidents
Inclement Weather
AccaYard Construction
Source: Chaddick Institute for Metropolitan Development (2017). Ground Transportation Gaps. Chicago, IL: Depaul University.

12
Average Ticket Price FFY17:
Virginia Among the Highest
All State Supported Routes
$‐
$10.00
$20.00
$30.00
$40.00
$50.00
$60.00
$70.00
VA Sponsored Routes All Other State Sponsored Routes
State‐supported Amtrak services that connect to the high‐demand Northeast Corridor

13
Average Ticket Price per Mile
FFY17
Virginia Routes vs.
All Other State‐Sponsored
Routes$0.00
$0.10
$0.20
$0.30
$0.40
$0.50
$0.60
$0.70VA Sponsored Routes All Other State Sponsored Routes
State‐supported Amtrak services that connect to the high‐demand Northeast Corridor between Washington, D.C. and Boston
• Virginia Sponsored train ticket prices are some of the most expensive in the country.

On‐Time Performance: Decline in OTP
Potential Cause of
Ridership Loss in 2018?
14
40%45%50%55%60%65%70%75%80%85%90%95%100%
Q1 Q2 Q3 Q4 Q1 Q2 Q3 Q4 Q1 Q2 Q3 Q4
2015 2016 2017
Quarterly On‐Time Performance 2015‐2017
Lynchburg Newport News Norfolk Richmond

15
Opportunities to Improve Ridership
• Review Pricing on Virginia Sponsored Routes
• Review Marketing Approach
• Build Capacity to Improve Reliability

16
Questions&
Comments