VIRDOCD: a VIRtual DOCtor to Predict Dengue Fatality
22
VIRDOCD: A virtual doctor VIRDOCD: a VIR tual D OCtor to Predict D engue Fatality 1 Amit K Chattopadhyay and 2 Subhagata Chattopadhyay 1 Department of Mathematics, Aston University, Birmingham B4 7ET, UK 2 FAcculi Labs Pvt. Ltd. Bangalore 560098 Karnataka, India ABSTRACT: Clinicians make routine diagnosis by scrutinizing patients’ medical signs and symptoms, a skill popularly referred to as “Clinical Eye”. This skill evolves through trial-and-error and improves with time. The success of the therapeutic regime relies largely on the accuracy of interpretation of such sign-symptoms, analyzing which a clinician assesses the severity of the illness. The present study is an attempt to propose a complementary medical front by mathematically modeling the “Clinical Eye” of a VIRtual DOCtor, using Statistical and Machine Intelligence tools (SMI), to analyze Dengue epidemic infected patients (100 case studies with 11 weighted sign-symptoms). The SMI in VIRDOCD reads medical data and translates these into a vector comprising Multiple Linear Regression (MLR) coefficients to predict infection severity grades of dengue patients that clone the clinician’s experience-based assessment. Risk managed through ANOVA, the dengue severity grade prediction accuracy from VIRDOCD is found higher (ca 75%) than conventional clinical practice (ca 71.4%, mean accuracy profile assessed by a team of 10 senior consultants). Free of human errors and capable of deciphering even minute differences from almost identical symptoms (to the Clinical Eye), VIRDOCD is uniquely individualized in its decision- making ability. The algorithm has been validated against Random Forest classification (RF, ca 63%), another regression-based classifier similar to MLR that can be trained through supervised learning. We find that MLR-based VIRDOCD is superior to RF in predicting the grade of Dengue morbidity. VIRDOCD can be further extended to analyze other epidemic infections, such as COVID-19. KEYWORDS: Statistical modeling; Predictive modeling; Dengue; Case Fatality; Python; Multiple linear regressions; ANOVA; Random forest I. INTRODUCTION: Medical diagnosis is an art of combining supervised learning (as a learner of medical science) with unsupervised/experiential learning (as a practitioner). In both cases, doctors learn why, how and what to look for in analyzing the patterns and inter-relationships between sign-symptom (predictors), as this may vary from case-to-case, patient-to-patient, and even for the same ailment. Doctors then subjectively ascribe weightage to the sign-symptoms diagnosis to understand the morbidity load and its influence on the outcome/diagnosis. Such mental shredding of the symptoms to identify the disease level and nature is an integral component of every diagnostic process. The numerically translated sign-symptoms are self-narrative that lead to a clinical understanding of the illness in terms of its ‘severity’ or ‘grade’. Such a dynamic medical concept, thus developed within a clinician, is popularly known as the ‘Clinical eye’ (Shapiro, Rucker, & Beck, 2006) . Clinical eye matures as the clinician gains experience. Doctors with matured clinical eyes are able to diagnose a case with reasonably high accuracy, in fact, often pre-empting them (Brunyé, Drew, Weaver, & Elmore, 2019) . In the computer science linguistic, this Clinical eye is nothing but a set of conditional statements 1 Correspondence: [email protected] 1
Transcript of VIRDOCD: a VIRtual DOCtor to Predict Dengue Fatality
VIRDOCD: A virtual doctor
VIRDOCD: a VIRtual DOCtor to Predict Dengue Fatality
1Amit K Chattopadhyay and 2Subhagata Chattopadhyay
1Department of Mathematics, Aston University, Birmingham B4 7ET, UK
2FAcculi Labs Pvt. Ltd. Bangalore 560098 Karnataka, India
ABSTRACT:
Clinicians make routine diagnosis by scrutinizing patients’ medical signs and symptoms, a skill popularlyreferred to as “Clinical Eye”. This skill evolves through trial-and-error and improves with time. Thesuccess of the therapeutic regime relies largely on the accuracy of interpretation of such sign-symptoms,analyzing which a clinician assesses the severity of the illness. The present study is an attempt topropose a complementary medical front by mathematically modeling the “Clinical Eye” of a VIRtualDOCtor, using Statistical and Machine Intelligence tools (SMI), to analyze Dengue epidemic infectedpatients (100 case studies with 11 weighted sign-symptoms). The SMI in VIRDOCD reads medical dataand translates these into a vector comprising Multiple Linear Regression (MLR) coefficients to predictinfection severity grades of dengue patients that clone the clinician’s experience-based assessment. Riskmanaged through ANOVA, the dengue severity grade prediction accuracy from VIRDOCD is found higher(ca 75%) than conventional clinical practice (ca 71.4%, mean accuracy profile assessed by a team of 10senior consultants). Free of human errors and capable of deciphering even minute differences fromalmost identical symptoms (to the Clinical Eye), VIRDOCD is uniquely individualized in its decision-making ability. The algorithm has been validated against Random Forest classification (RF, ca 63%),another regression-based classifier similar to MLR that can be trained through supervised learning. Wefind that MLR-based VIRDOCD is superior to RF in predicting the grade of Dengue morbidity. VIRDOCDcan be further extended to analyze other epidemic infections, such as COVID-19.
KEYWORDS: Statistical modeling; Predictive modeling; Dengue; Case Fatality; Python; Multiple linearregressions; ANOVA; Random forest
I. INTRODUCTION:
Medical diagnosis is an art of combining supervised learning (as a learner of medical science) withunsupervised/experiential learning (as a practitioner). In both cases, doctors learn why, how and what tolook for in analyzing the patterns and inter-relationships between sign-symptom (predictors), as this mayvary from case-to-case, patient-to-patient, and even for the same ailment. Doctors then subjectivelyascribe weightage to the sign-symptoms diagnosis to understand the morbidity load and its influence onthe outcome/diagnosis. Such mental shredding of the symptoms to identify the disease level and nature isan integral component of every diagnostic process.
The numerically translated sign-symptoms are self-narrative that lead to a clinical understanding of theillness in terms of its ‘severity’ or ‘grade’. Such a dynamic medical concept, thus developed within aclinician, is popularly known as the ‘Clinical eye’ (Shapiro, Rucker, & Beck, 2006). Clinical eye matures as
the clinician gains experience. Doctors with matured clinical eyes are able to diagnose a case withreasonably high accuracy, in fact, often pre-empting them (Brunyé, Drew, Weaver, & Elmore, 2019). In
the computer science linguistic, this Clinical eye is nothing but a set of conditional statements
1 Correspondence: [email protected]
1
VIRDOCD: A virtual doctor
characterizing each numerical array, e.g., IF-THEN-ELSE serving as algorithmic equivalents of medicalsign-symptom ‘A’, ‘B’, ‘C’ further sub-graded by individual weights ‘Mild’ (M), ‘Moderate’ (M), and ‘Severe’(S) (Lu, Tong, Yu, Xing, Chen, & Shen, 2018), leading to Fatality/Severity/Grade prediction of the disease
that are identically characterized within the MMS architecture. A ‘specialist’ or ‘expert’ is a clinician whohas studied numerous such cases and has thus developed a robust (IF-THEN-ELSE) mental algorithmicmap that can relate symptoms to potential severity (also fatality) grade (Chattopadhyay, Banerjee, Rabhi,
& Acharya, 2013). An inherent feature of this mental mapping process is the ‘subjectivity index’ (Alessia
Alunno, 2018) whereby different doctors may read symptoms differently, ascribing different weights to the
incumbent factors, but eventually converging to a ‘global’ precision diagnosis that matches other cliniciansin the field. Understanding such ‘individuality’ is critically important in human bias prevention duringdecision making, especially to avoid undercutting or overdoing the therapeutic regimen (Acharya, Sree,
Ng, Chua, & Chattopadhyay, 2014).
Statistical modelling towards Machine Intelligence (SMI) is an evolving domain of Computer Science andInformation Technology. It is popularly used for decision making by a Computer that is trained on domainrules to extract causality driven outcomes within the individualized (patient specific) constraints
(Chattopadhyay S. , Neurofuzzy Models to Automate the Grading of Old-age Depression, 2014) . There
are several reasons for the increasing dependence on such SMI assisted clinical decision making tools,some of which are the following: a) as an assistive tool for a second opinion; b) as a nursing aid, topreempt a medical condition before therapeutic intervention; c) as a critical complementary supportsystem, particularly in developing countries, that suffer from acute shortage of medical professionals; d)as a telemedicine tool for beginning medical practitioners; e) as an omnipresent referencing guide, that is
ubiquitous in nature. There may be other drivers too. SMI algorithms have already been successfullyused in several healthcare domains, such as cardiology (Choi, Park, Ali, & Sungyoung, 2020; Xi he, 2020),
mental health (Ashish, Chattopadhyay, Gao, & Hui, 2019), neurology (Dashti & Dashti, 2020),
radiology/medical imaging techniques (Jin, et al., 2020; Chattopadhyay, Ray, & Acton, 2005) amongst
others. Specialized regression algorithms like pseudo Zernike moment and multinomial regression weresuccessfully used in Alzheimer detection (Wang, et al, 2017) and impending hearing loss (Wang, et al,2019), including prediction of antimicrobial resistance in ICU-admitted patients (Hernàndez-Carnerero &
Sànchez-Marrè, 2021) and (Hernàndez-Carnerero A. , Sànchez-Marrè, Mora Jiménez, Soguero Riuz,
Martínez Agüero, & Álvarez Rodríguez, 2020).
The post 2010 era saw a fast emerging landscape of SMI assisted infection modeling (Agrebi & Larbi,
2020) (Silver, et al., 2017). This relates to four key areas – (i) early detection, that can substantially curb
morbidity and mortality/case fatality, (ii) early start of treatment typically at the symptomatic stage, (iii)prognostic evaluations, and critically (iv) as a supplement to traditional prognosis tools when they fail toassociate events with future prediction of an epidemic due to (a) BIG data size, (b) data complexity,and/or (c) inherent clinical subjectivity (Chen & Asch, 2017). In most cases related to epidemics and
pandemics, early detection is of utmost importance in containing infection propagation, thereby reducingthe case fatality rate. This is even more pertinent for resource thrifty developing nations, where SMIbased tools can provide seamless and ubiquitous healthcare that is hitherto unavailable to the masses
(Daneshgar & Chattopadhyay, 2011).
The starting phase of the infection modeling studies relied on conventional Machine Learning (ML)algorithms, typically consisting of k-Nearest Neighbors as part of a supervised learning algorithm
2
VIRDOCD: A virtual doctor
(Watkins & Boggess, 2002), followed by creation of memory kernels for detecting repeated disease
threats (Cuevas, Osuna-Enciso, Zaldivar, Perez-Cisneros, & Sossa, 2012). Support Vector Machine has
also been used to accurately detect malarial parasites from RBC (Go, Kim, Byeon, & Lee, 2018). Evolution
of infection networks have used optimized Artificial Neural Networks to detect Kyasanur Forst (viral)Disease where the infection load is carried by ticks (Majumdar, Debnath, Sood, & Baishnab, 2018), Ebola
propagation severity/outcome (Colubri, Silver, Fradet, Retzepi, Fry, & Sabeti, 2016). The latest addition in
the lineage are the Multiple Regression classifiers, e.g. regression algorithm, linear regression model,gradient boosted regression tree algorithm, negative binomial regression model, and generalized additivemodel, that have shown promise in dengue forecasting in China.
In the recent past, various aspects of Dengue, both epidemiological and clinical pathophysiological, havebeen studied. Patients’ history, sign-symptoms, investigation results are considered as the independentvariables, whereas various types of Dengue fevers represent the dependent variables to develop theclassifiers. Decision Tree (DT) and Random Forest (RF) classifiers have been used by (Sarma, Hossain,
Mittra, Bhuiya, Saha, & Chakma, 2020) to predict Dengue fever. The study concludes that, with 79%
accuracy in prediction, DT-based classifier has outperformed RF-based classifier. Tiruveedhula et al(Tiruveedhula, Navya, Gayathri, & Reshma, 2018) applied Simple Classification and Regression Tree
(CART), Multilayer Perceptron (MLP), and C4.5 algorithms to analyze the normal and abnormal cases ofDengue using clinical parameters. CART-based classifier performed best with nearly 100% accuracy.
Other algorithms, like ML algorithms, Naïve Baye’s, J48, RF, Reduces Error Pruning (REP) Tree,Sequential Minimal Optimization (SMO), Locally Weighted Learning (LWL), AdaboostM1, and ZeroR,have also been used in classifying Dengue data (Rajathi, Kanagaraj, Brahmanambika, & Manjubarkavi,
2018).
Another study targeting early prediction of Dengue incidence in a larger population concluded that theML-based classifier could detect certain weeks of the year those were found to be vulnerable for dengueoutbreak, which would assist the administration and the healthcare setup to get prepared for managingthe ailments appropriately. In this study, humidity, wind speed, temperature and rainfall were taken as theindependent variables and fed into an SVM classifier whose prediction accuracy, precision, sensitivity,and specificity were found to be 70%, 56%, 14%, and 95%, respectively (Salim, et al., 2021).
In another study with similar objective, i.e., predicting the dengue outbreak timing in an year, authorsapplied a battery of ML classifiers, e.g., SVM, K-Nearest Neighbor (k-NN), Artificial Neural Network(ANN), Naïve Baye’s, DT, Logistic regressions, and LogitBoost ensemble classifier. LogitBoost ensembleclassifier was able to predict the outbreak with 92% accuracy (Iqbal & Islam, 2019).
SMI tools have also been used in other areas of data modeling, such as Support Vector Machine (SVM)learning algorithm, Cross-validation (LOOCV) method, and Nested One-versus-one (OVO) SVM. Thelatter was used to analyze gene sequences from bacteria in preference to the high-resolution melt (HRM)method. The combination of SVM and HRM has been shown to identify bacterial colonies (Fraley, et al.,
2016) with high accuracy (100%). SMI based epidemiological models are known to successfully
complement error ridden laboratory procedures relating to sample collection, preservation, distribution,and laboratory testing, e.g. assessing fatality due to pulmonary Tuberculosis, the second most frequentcause of deaths (Saybani, et al., 2015), especially of the multi-drug-resistant variety (Huddar, Svadzian,
Nafade, Satyanarayana, & Pai, 2020), or Cardiovascular (CVD) risk with lifestyle changes (Xi He, et al
3
VIRDOCD: A virtual doctor
2020). A topic that is assuming critical importance during the present Covid onslaught is the SMIinterpretation of herd immunity (O’Driscoll, et al., 2020), especially in predicting its emergence
(Chattopadhyay, et al 2021).
The state-of-the-art literature clearly points to three important knowledge gaps:
(i) None of the ML-based classifiers used in these analyzes integrate the rule-bases of thehuman clinicians with those from the model, thus making these studies less robust clinically.
(ii) The earlier studies use MLR, RF and other classifiers to classify the data points through aform of unsupervised learning. VIRDOCD conceptualizes MLR and RF-based classifiers as‘learning tools’, based on its coefficient values, entropies, as well as Gini index, to analyzedata modeled outcomes through the lenses of seasoned clinicians.
(iii) Many of these studies lack cross-validation against other classifiers, unlike in this study.
Structured on these three research questions, the key deliverable of this study is a tool that can easilyintegrate with a medical setup that is usable both by clinicians and nurses, thereby, doubling up as aVirtual Doctor (VIRDOCD). The aim is not to substitute or even downplay the role of human interventionbut rather to serve as a complementary diagnostic aid. A key technical novelty of this study is thereinvention of intelligent statistical modeling as an equally powerful diagnostic tool, substituting the morepopular choice of deep learning algorithms that are more complex and hence difficult to maneuver.VIRDOCD can be a layman’s tool, that is self-contained, and with attributes that can be sourced inindividualized healthcare.
Section II of the article outlines the Experimental design; section III illustrates the results obtained; sectionIV summarizes the conclusions from this virtual model and highlights on future extensions.
II. EXPERIMENTAL DESIGN:
The numerical experiment uses a 6-stage data modeling architecture that is divided into (A) Datacollection from various sources taking proper ethical measures (Chattopadhyay S. , 2012), (B) Data
preprocessing and fidelity check (Goforth, 2015), (C) Data mining – examining within group and between
group variations of the collected data by 1-WAY ANOVA, (Anwla, 2020) (D) Development of predictive
model using Multiple Linear Regressions (MLR) (Rao, 2020), (E) Testing the model performance on a set
of test cases where outputs are known, (F) Parametric study to observe how each of the individual inputparameters influences the prediction, as well as their cross-correlated cumulative contribution towards theprediction performance of the model, and (G) Comparing MLR-based classifier’s performance accuracywith a Random Forest (RF)-based classifier and then validating against human clinicians.
A. Data Collection: Primary data (N=100) were enumerated from bed tickets and prescriptions. Data collection processesand activities are outlined in Table 1 below.
Table 1. Data Collection parameters
Duration: Jan 2018 – Dec 2019 (Two years)
Source: Clinics, Nursing homes in the vicinity and hospitals
Diagnosis: confirmed with NS1 rapid test and Elisa IgM and IgG
Habit of substance abuse and alcoholism: ignored
Patient population: 150 Gender: Males - 98, Females –52
Age group: 18 yrs and Co-morbidities: ignored Socio-economic-condition:
4
VIRDOCD: A virtual doctor
above ignoredEthical measures and data privacy protection: Data source, doctors’ and patient names and address/telephone numbers remain anonymous.
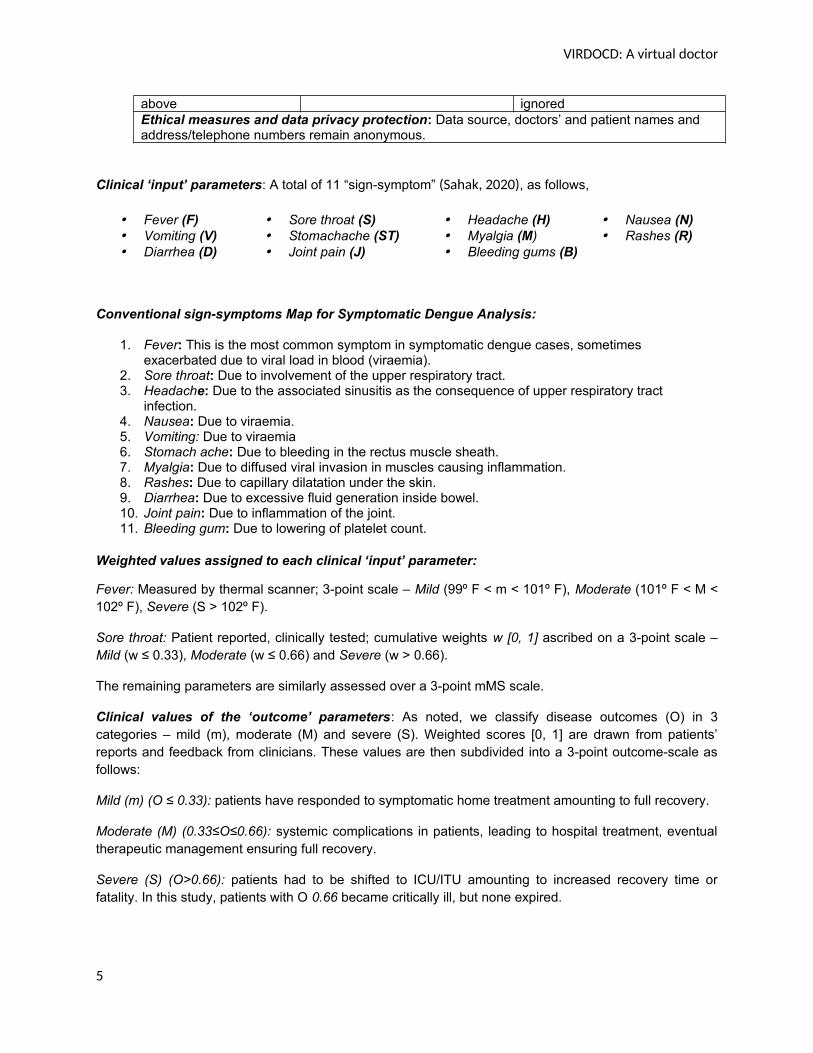
Clinical ‘input’ parameters: A total of 11 “sign-symptom” (Sahak, 2020), as follows,
Fever (F) Sore throat (S) Headache (H) Nausea (N) Vomiting (V) Stomachache (ST) Myalgia (M) Rashes (R) Diarrhea (D) Joint pain (J) Bleeding gums (B)
Conventional sign-symptoms Map for Symptomatic Dengue Analysis:
1. Fever: This is the most common symptom in symptomatic dengue cases, sometimes exacerbated due to viral load in blood (viraemia).
2. Sore throat: Due to involvement of the upper respiratory tract. 3. Headache: Due to the associated sinusitis as the consequence of upper respiratory tract
infection.4. Nausea: Due to viraemia.5. Vomiting: Due to viraemia6. Stomach ache: Due to bleeding in the rectus muscle sheath.7. Myalgia: Due to diffused viral invasion in muscles causing inflammation.8. Rashes: Due to capillary dilatation under the skin.9. Diarrhea: Due to excessive fluid generation inside bowel.10. Joint pain: Due to inflammation of the joint.11. Bleeding gum: Due to lowering of platelet count.
Weighted values assigned to each clinical ‘input’ parameter:
Fever: Measured by thermal scanner; 3-point scale – Mild (99º F < m < 101º F), Moderate (101º F < M <102º F), Severe (S > 102º F).
Sore throat: Patient reported, clinically tested; cumulative weights w [0, 1] ascribed on a 3-point scale –Mild (w ≤ 0.33), Moderate (w ≤ 0.66) and Severe (w > 0.66).
The remaining parameters are similarly assessed over a 3-point mMS scale.
Clinical values of the ‘outcome’ parameters: As noted, we classify disease outcomes (O) in 3categories – mild (m), moderate (M) and severe (S). Weighted scores [0, 1] are drawn from patients’reports and feedback from clinicians. These values are then subdivided into a 3-point outcome-scale asfollows:
Mild (m) (O ≤ 0.33): patients have responded to symptomatic home treatment amounting to full recovery.
Moderate (M) (0.33≤O≤0.66): systemic complications in patients, leading to hospital treatment, eventualtherapeutic management ensuring full recovery.
Severe (S) (O>0.66): patients had to be shifted to ICU/ITU amounting to increased recovery time orfatality. In this study, patients with O 0.66 became critically ill, but none expired.
5

VIRDOCD: A virtual doctor
Together, this 3-point classification of severity calibration is defined as ‘mMS’. Note that the cut-off valuesused (0.33 and 0.66) relate to one-third and two-thirds number density of cases; different cut-off markerscould also be subjectively implemented.
The statistical modeling and predictive ML algorithm in this study were implemented through Python, setwithin the panda, matplotlib, scipy, numpy, math and sklearn environments (data and code to be releasedthrough open access repositories).
B. Data pre-processing and fidelity check:
Input data, presented as csv spreadsheet, comprise clinical parameters recorded from inputs by attendingclinicians. The result was expressed as a 3-dimensional (N X P x K) asymmetric matrix, where ‘N’ (=100)denotes the number of cases/patients, ‘P’(=11) the clinical parameters and ‘K’ (=3) refers to thecorresponding 3-point outcome possibilities (mild, moderate, severe). The operator matrix is thusrepresented as follows
N 1 x M j→K k (1)
Data “x” thus collected were (column) normalized between [0,1] using ‘Max-Min normalization’ method
(McCaffrey, 2020), leading to a min-shifted data set normalized within the maximum-minimum values:
y = (x – min) / (max – min), (2)
where ‘min’ is the minimum cell value and ‘max’ is the maximum cell value correspond to parameters ‘P’and ‘K’, as defined in Eq (1). This technique linearly maps the variable ‘x’ to ‘y’ in a continuous numberspace varying between 0 and 1 without any data loss, which is a significant advantage. Note, our choiceof ‘min’ value is one that is close to the baseline ‘0’ but not exactly at ‘0’ while ‘max’ approaches ‘1’ but isnot exactly at ‘1’. The uncertainty windows around the two limiting values account for subjectivity indiagnosis that are known to fluctuate both with patients and clinicians alike.
Parameters ‘Pi’ (i = 1, 2 …, 11) and outcomes ‘Kj’ (j = 1, 2, 3) follow the same 3-point mMS scale asbefore - ‘mild’ (m<0.33), ‘moderate’ (0.34<M<0.66) and ‘severe’ (0.66<S<1.0, marked by the cell colorred).. Table 2 depicts a representative data set of the mMS responses.
Representative pre-processed (normalized) data of the 100 dengue cases are shown in Table. 2. TheVIRDOCD algorithm was trained to adapt to the 3-point weighted sign-symptoms based dengue markersas advised by the clinicians. The target was to develop a VIRtual DOCtor through supervised learning thatcan self-sufficiently ascribe severity scores to patients, independent of clinicians, thus ensuring‘independent’ unbiased decision making rid of human subjectivity errors in diagnosis.
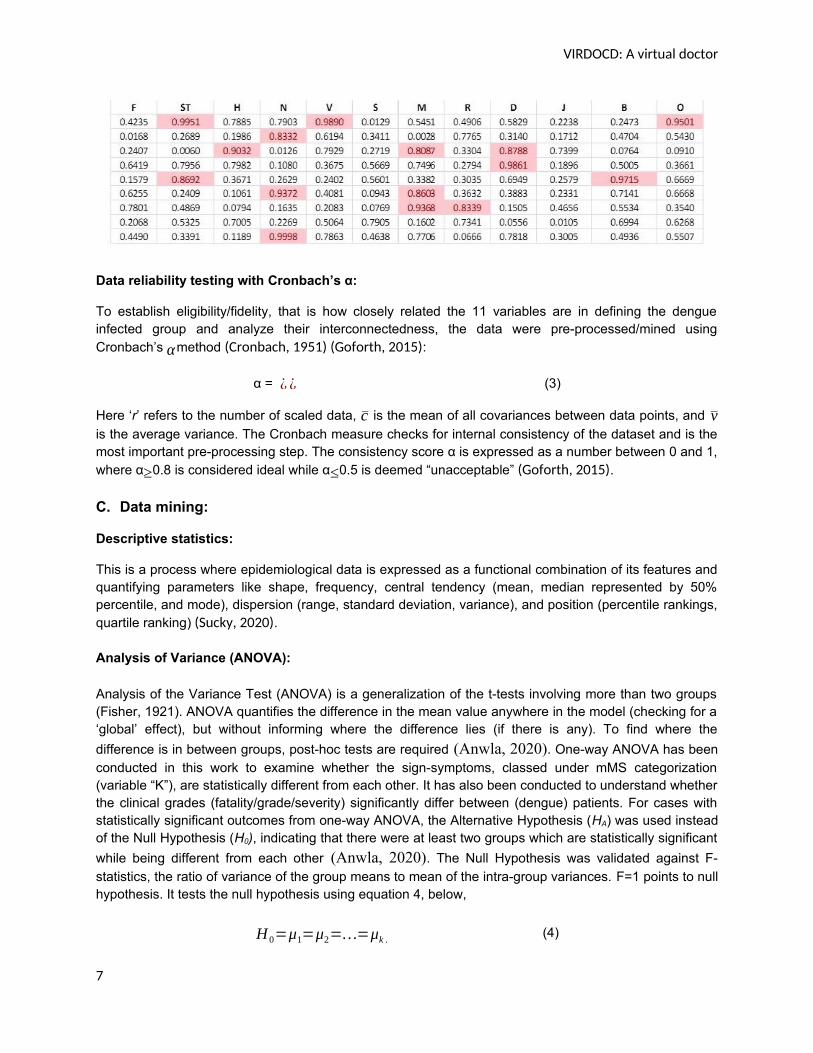
Table 2. Glimpse of a set of pre-processed data after ‘column-wise’ max-min normalization
6
VIRDOCD: A virtual doctor
Data reliability testing with Cronbach’s α:
To establish eligibility/fidelity, that is how closely related the 11 variables are in defining the dengueinfected group and analyze their interconnectedness, the data were pre-processed/mined usingCronbach’s αmethod (Cronbach, 1951) (Goforth, 2015):
α = ¿ ¿ (3)
Here ‘r’ refers to the number of scaled data, c is the mean of all covariances between data points, and vis the average variance. The Cronbach measure checks for internal consistency of the dataset and is themost important pre-processing step. The consistency score α is expressed as a number between 0 and 1,where α≥0.8 is considered ideal while α≤0.5 is deemed “unacceptable” (Goforth, 2015).
C. Data mining:
Descriptive statistics:
This is a process where epidemiological data is expressed as a functional combination of its features andquantifying parameters like shape, frequency, central tendency (mean, median represented by 50%percentile, and mode), dispersion (range, standard deviation, variance), and position (percentile rankings,quartile ranking) (Sucky, 2020).
Analysis of Variance (ANOVA):
Analysis of the Variance Test (ANOVA) is a generalization of the t-tests involving more than two groups(Fisher, 1921). ANOVA quantifies the difference in the mean value anywhere in the model (checking for a‘global’ effect), but without informing where the difference lies (if there is any). To find where the
difference is in between groups, post-hoc tests are required (Anwla, 2020). One-way ANOVA has beenconducted in this work to examine whether the sign-symptoms, classed under mMS categorization(variable “K”), are statistically different from each other. It has also been conducted to understand whetherthe clinical grades (fatality/grade/severity) significantly differ between (dengue) patients. For cases withstatistically significant outcomes from one-way ANOVA, the Alternative Hypothesis (HA) was used insteadof the Null Hypothesis (H0), indicating that there were at least two groups which are statistically significant
while being different from each other (Anwla, 2020). The Null Hypothesis was validated against F-statistics, the ratio of variance of the group means to mean of the intra-group variances. F=1 points to nullhypothesis. It tests the null hypothesis using equation 4, below,
H 0=μ1=μ2=…=μk . (4)
7
VIRDOCD: A virtual doctor
Here µ represents the mean of the group and k measures the number of such groups. If, however, theone-way ANOVA returns a statistically significant result, the Alternative Hypothesis (HA) is acceptedinstead of the Null Hypothesis (H0), indicating that there are at least two group which are statisticallysignificantly while being different from each other (Anwla, 2020).
F-statistic (the ratio of variance of the group means / mean of the within group variances) equals to ‘one’accepts null hypothesis, else it accepts alternative hypothesis. For this work, F-static values (Anwla,
2020) are shown in the Results section.
D. Development of VIRDOCD with Multiple Linear Regressions (MLR):
Multiple Linear Regression (MLR) is an extension of the linear regression model (Rao, 2020) that combines
multiple explanatory variables to predict one or more response functions. VIRDOCD uses MLR supervisedlearning strategy, trained by the ‘Clinical eyes’ i.e., the knowledge base accorded by a set of experiencedhuman doctors. Unlike human intervention, a key motivation behind this strategy is to outline a diagnosticregime that can stay unperturbed (i.e., the retention of ‘individuality’ in clinical decision making) to changesin rule/knowledge bases according to the judgments of individual clinicians. If Y represents the predictedoutput i.e. the weighted Case fatality grade of a set of N patients with sign-symptoms Xi, (i =1, 2, ..,11)weighted by w[0,1]), the working principle of the MLR model is given by
Y = B0+B1X1+B2 X2+…+B pX p, (5)
where the B’s are the slope coefficients for individual predictors. The entries for variables X i are obtainedfrom hospital inventory, a represented set of which is shown in Table 2. The aim is to find the best-fit Bvalues that minimize the error functions extrapolating the best line or hyperplane depending on the numberof input variables/predictors (weighted sign-symptoms). Null hypothesis is accepted when all coefficients(B) are zero, else we accept alternative hypothesis, that is, when at least one B value is non-zero, thatamounts to linearly independent variables. Predicted degree of dengue fatality using the Coefficient values(B) and 11 sign-symptoms (X values) for few cases are described in the Results section.
E. Testing the performance of VIRDOCD:
VIRDOCD was trained on 75% of the dengue data i.e. 75 patients, mimicking the ‘Clinical Eyes’ or ‘Rulebase’ (represented as the IF-THEN rules) of ten experienced clinicians. The model was then tested for itspredictive power by using the remaining 25% and comparing the predictions against medical prognosis(by the same medical team). ‘Ten-fold cross validation’ was conducted by randomly partitioning thedataset into 10 equal sized compartments. Of the 10 compartments, one was retained fordata validation and associated testing of the model; the remaining 9 compartments were used for trainingdata (de Rooij & Weeda, 2020).
Prediction errors were measured using the Root Mean Square (RMS) formula (√ 1N∑i
X i2). RMS Error
(RMSE) was preferred over Mean Square Error (MSE) as RMSE accord relatively higherweights to large errors. This means RMSE is a more accurate measure of fluctuation whenlarge errors are undesirable, which is expected and desired in clinical decision making (Willmott &
Matsuura, 2005). RMSE thus obtained has been shown in Table 3.
F. Parametric study to check the sensitivity (robustness) of the model:
8
VIRDOCD: A virtual doctor
VIRDOCD was calibrated for robustness using a 2-stage strategy:
(a) Single-factor influence, where predictions by VIRDOCD and other doctors were compared byvarying the weights of only one predictor (sign-symptom) for any given dengue case.
(b) Cumulative influence, where comparisons have been made by varying weights of all the sign-symptoms for any given dengue case.
G. Validation of VIRDOCD:
VIRDOCD’s performance in predicting Dengue is validated using a two-stage approach,
(a) Comparing its performance with an ‘RF-based classifier’ developed in this study, workingprinciple of which is detailed below.
(b) Comparing with the human clinicians’ accuracy of prediction.
Random Forest (RF) regression:
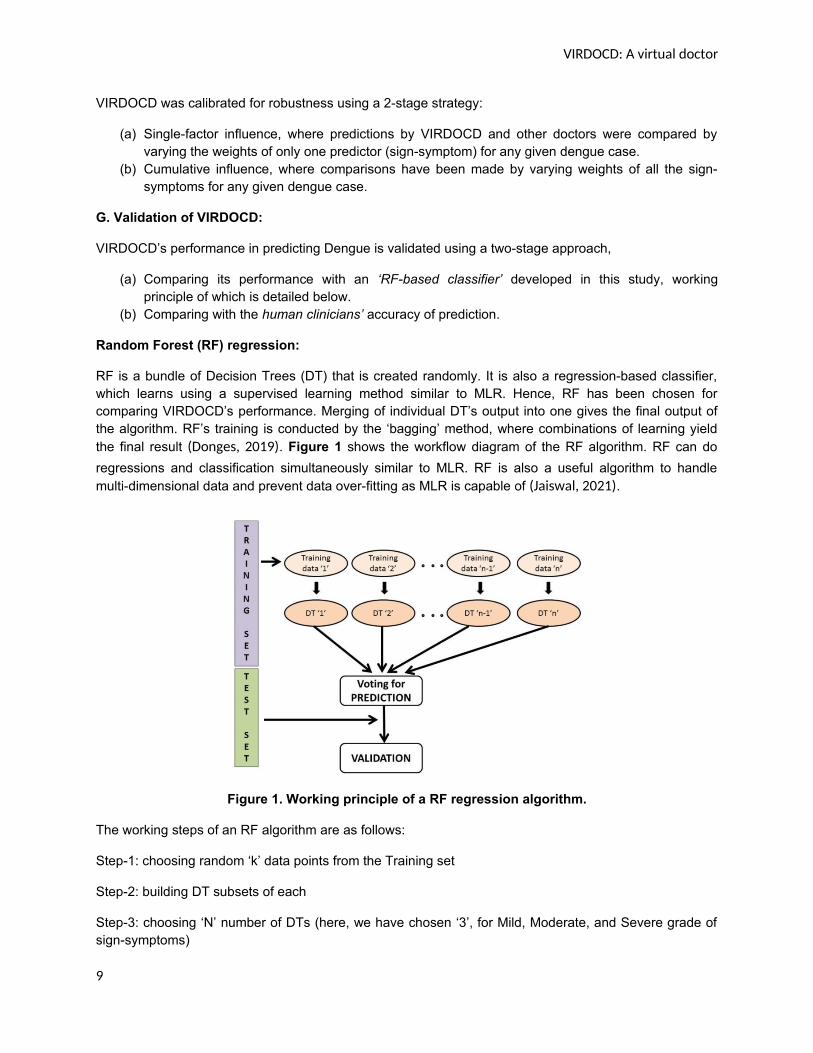
RF is a bundle of Decision Trees (DT) that is created randomly. It is also a regression-based classifier,which learns using a supervised learning method similar to MLR. Hence, RF has been chosen forcomparing VIRDOCD’s performance. Merging of individual DT’s output into one gives the final output ofthe algorithm. RF’s training is conducted by the ‘bagging’ method, where combinations of learning yieldthe final result (Donges, 2019). Figure 1 shows the workflow diagram of the RF algorithm. RF can do
regressions and classification simultaneously similar to MLR. RF is also a useful algorithm to handlemulti-dimensional data and prevent data over-fitting as MLR is capable of (Jaiswal, 2021).
Figure 1. Working principle of a RF regression algorithm.
The working steps of an RF algorithm are as follows:
Step-1: choosing random ‘k’ data points from the Training set
Step-2: building DT subsets of each
Step-3: choosing ‘N’ number of DTs (here, we have chosen ‘3’, for Mild, Moderate, and Severe grade ofsign-symptoms)
9

VIRDOCD: A virtual doctor
Step-4: repeat Step-1 to 3
Step-5: for each test data point, finding predicted values of each tree
Step-6: assigning the test data points to the category that wins the maximum vote.
The RF-regression is computed by estimating the MSE using the following Eqn. (6), where pi and ti
indicate the predicted and target outputs respectively, such that 1<i<N.
MSE = 1N∑i=1
N
( pi−t i )2 … (6)
Classification using RF can be made by calculating the Gini-index (GI) as in Eqn. (7) below, where fi
represents the relative frequency of a class and ‘c’ the number of such classes.
GI = 1- ∑j=1
c
f j2 … (7)
Entropy (E) has been measured to analyze nodal branching in the DT. This follows Eqn. (8) below:
E = ∑i=1
c
− f i . log2 ( f i ) … (8)
The results of all experiments are outlined in the following section.
III. EXPERIMENTAL DESIGN: RESULTS AND DISCUSSIONS
In this section the results of the experiments have been showcased with necessary analysis of the results.
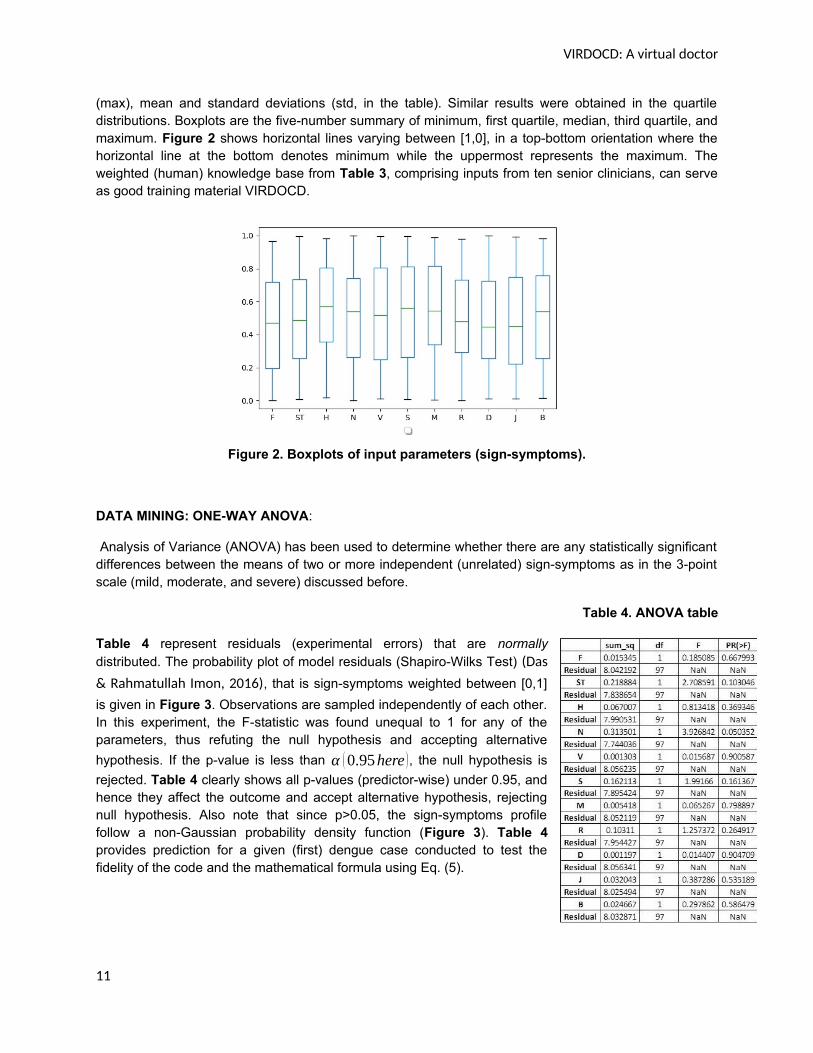
A. Cronbach’s α: A score of 0.8311 indicates that the data is internally consistent. Table 3 below showsparameter-wise (sign-symptom-wise) representation of the evenly distributed medical data (refer toboxplots in Figure 2 for visualization) without noticeable difference between the minimum (min),maximum (max), mean and standard deviations (std in the table). Similar results were obtained in thequartile distributions. Boxplots represent the five-number summary of minimum, first quartile, median,third quartile, and maximum.
Descriptive statistics: below Table 3 shows the descriptive statistics of all parameters undertest. Table 3. Descriptive statistics
Table 3 presents sign-symptoms (parameters) data with min-max-std fluctuations (refer to boxplots inFigure 2 for improved visualization) without much difference between the minimum (min), maximum
10
VIRDOCD: A virtual doctor
(max), mean and standard deviations (std, in the table). Similar results were obtained in the quartiledistributions. Boxplots are the five-number summary of minimum, first quartile, median, third quartile, andmaximum. Figure 2 shows horizontal lines varying between [1,0], in a top-bottom orientation where thehorizontal line at the bottom denotes minimum while the uppermost represents the maximum. Theweighted (human) knowledge base from Table 3, comprising inputs from ten senior clinicians, can serveas good training material VIRDOCD.
Figure 2. Boxplots of input parameters (sign-symptoms).
DATA MINING: ONE-WAY ANOVA:
Analysis of Variance (ANOVA) has been used to determine whether there are any statistically significantdifferences between the means of two or more independent (unrelated) sign-symptoms as in the 3-pointscale (mild, moderate, and severe) discussed before.
Table 4. ANOVA table
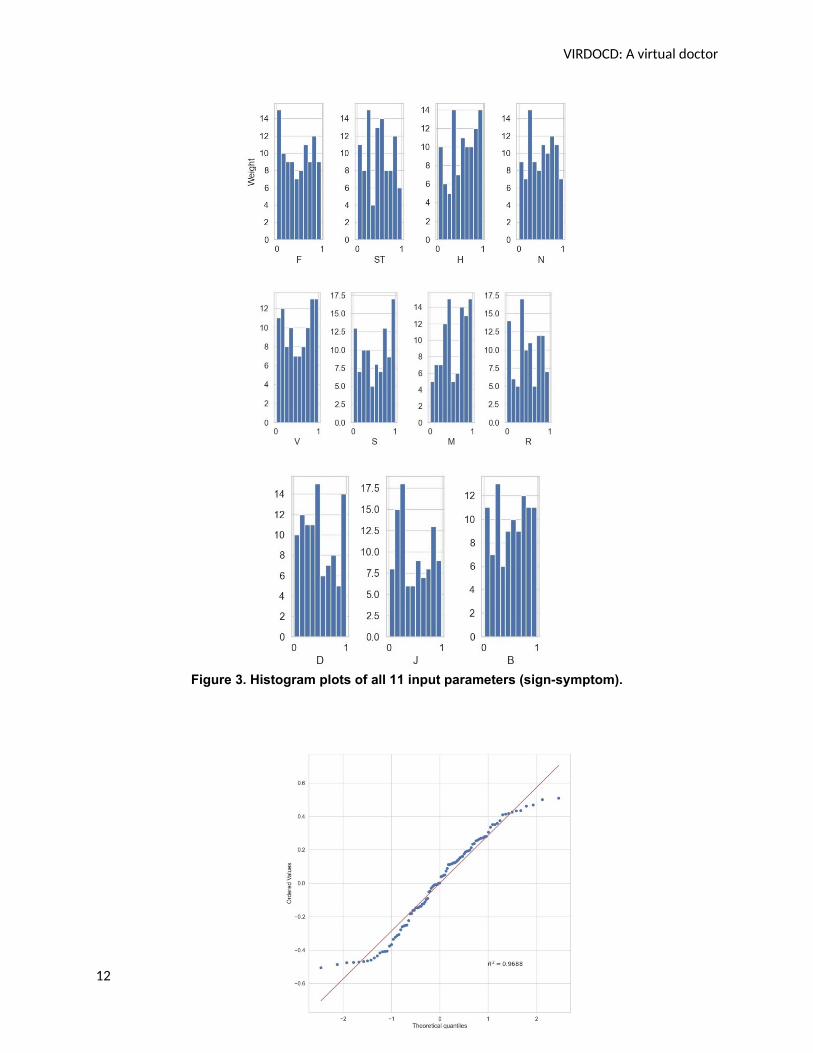
Table 4 represent residuals (experimental errors) that are normallydistributed. The probability plot of model residuals (Shapiro-Wilks Test) (Das
& Rahmatullah Imon, 2016), that is sign-symptoms weighted between [0,1]
is given in Figure 3. Observations are sampled independently of each other.In this experiment, the F-statistic was found unequal to 1 for any of theparameters, thus refuting the null hypothesis and accepting alternative
hypothesis. If the p-value is less than α (0.95here ), the null hypothesis is
rejected. Table 4 clearly shows all p-values (predictor-wise) under 0.95, andhence they affect the outcome and accept alternative hypothesis, rejectingnull hypothesis. Also note that since p>0.05, the sign-symptoms profilefollow a non-Gaussian probability density function (Figure 3). Table 4provides prediction for a given (first) dengue case conducted to test thefidelity of the code and the mathematical formula using Eq. (5).
11
VIRDOCD: A virtual doctor
Figure 3. Histogram plots of all 11 input parameters (sign-symptom).
12
VIRDOCD: A virtual doctor
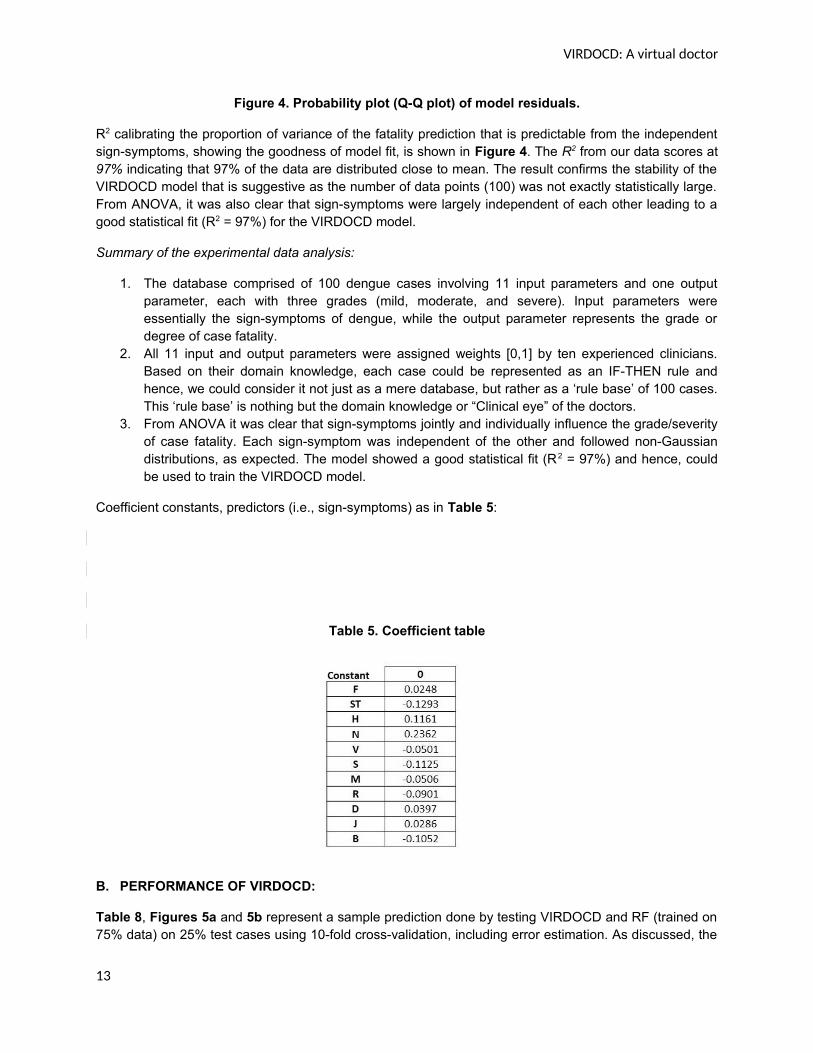
Figure 4. Probability plot (Q-Q plot) of model residuals.
R2 calibrating the proportion of variance of the fatality prediction that is predictable from the independentsign-symptoms, showing the goodness of model fit, is shown in Figure 4. The R2 from our data scores at97% indicating that 97% of the data are distributed close to mean. The result confirms the stability of theVIRDOCD model that is suggestive as the number of data points (100) was not exactly statistically large.From ANOVA, it was also clear that sign-symptoms were largely independent of each other leading to agood statistical fit (R2 = 97%) for the VIRDOCD model.
Summary of the experimental data analysis:
1. The database comprised of 100 dengue cases involving 11 input parameters and one outputparameter, each with three grades (mild, moderate, and severe). Input parameters wereessentially the sign-symptoms of dengue, while the output parameter represents the grade ordegree of case fatality.
2. All 11 input and output parameters were assigned weights [0,1] by ten experienced clinicians.Based on their domain knowledge, each case could be represented as an IF-THEN rule andhence, we could consider it not just as a mere database, but rather as a ‘rule base’ of 100 cases.This ‘rule base’ is nothing but the domain knowledge or “Clinical eye” of the doctors.
3. From ANOVA it was clear that sign-symptoms jointly and individually influence the grade/severityof case fatality. Each sign-symptom was independent of the other and followed non-Gaussiandistributions, as expected. The model showed a good statistical fit (R2 = 97%) and hence, couldbe used to train the VIRDOCD model.
Coefficient constants, predictors (i.e., sign-symptoms) as in Table 5:
Table 5. Coefficient table
B. PERFORMANCE OF VIRDOCD:
Table 8, Figures 5a and 5b represent a sample prediction done by testing VIRDOCD and RF (trained on75% data) on 25% test cases using 10-fold cross-validation, including error estimation. As discussed, the
13
VIRDOCD: A virtual doctor
target of this study is to deliver a Virtual “Clinical Eye”, which is nothing but the product of the coefficientvalues of the weighted sign-symptoms and the added ‘bias’ value, obtained from equation 5. Thecoefficient values are the numerical representations of individual ‘perception’ based judgement. Since nohuman judgement is completely bias-free, to make VIRDOCD’s clinical judgement close to human-judgment, the bias value obtained from equation 5 has been added to the score line. The cumulativescores (Y) for each test case is hence the product of coefficient values (B) and weighted sign-symptoms(X), added with bias (B0).
Table 5 tabulates the Coefficient values for each sign-symptom (B0 = 0) as outlined in Eqn. (5). VIRDOCDoutput, designated as Calc_Out in Table 6 (column 2), is evaluated by combining the parameters fromTable 5 (blue)with remaining 25% of data {F=0.9650, ST=0.3397, H=0.8671, …, J=0.0882, B=0.4717}(green):
Calc_Out = 0 + 0.0248 x 0.9650 + (-0.1293) x 0.3397 + 0.1161 x 0.8671 + … + 0.0286 x 0.0882 + (-0.1052) x 0.4717 = 0.4562 (moderate outcome),
where ‘Calc_Out’ (2nd column) and ‘Target_Out’ (3rd column) for the 1st test case (1st row, denoted by 0)matches real data.
C. PARAMETRIC STUDY FOR TESTING THE ROBUSTNESS:Detailed parametric study is an important step to examine the ‘individuality’ in decision making byVIRDOCD. The study was done in two stages
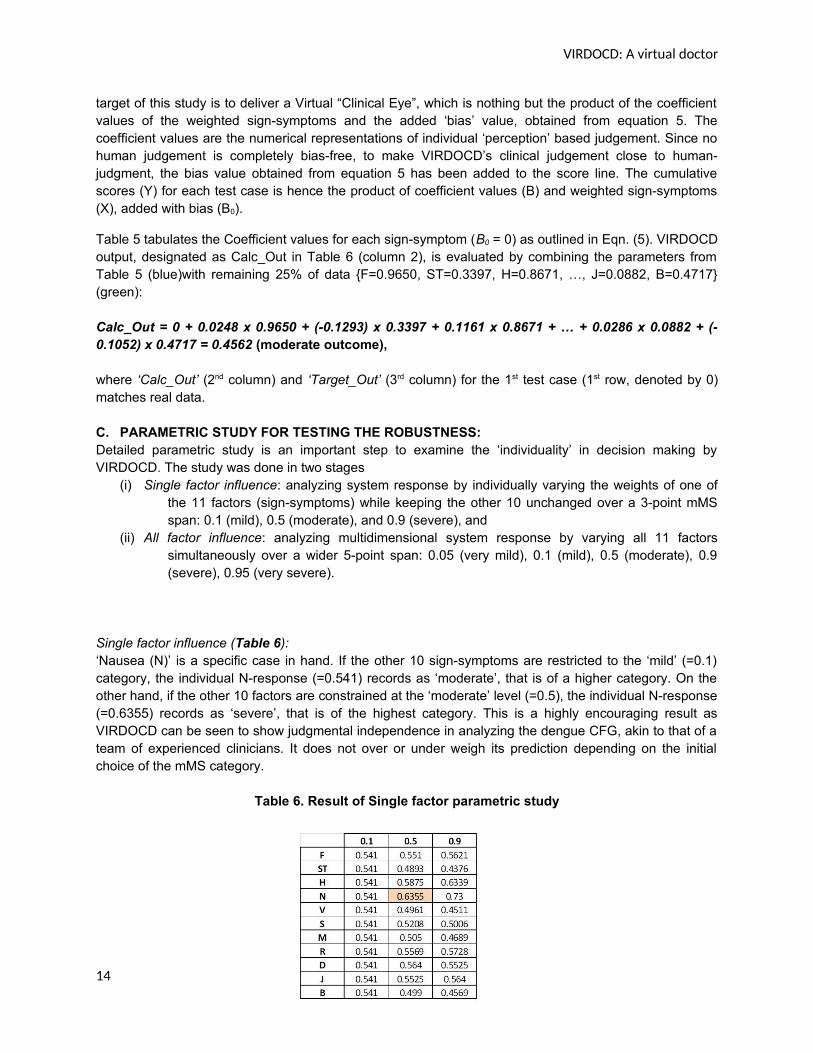
(i) Single factor influence: analyzing system response by individually varying the weights of one ofthe 11 factors (sign-symptoms) while keeping the other 10 unchanged over a 3-point mMSspan: 0.1 (mild), 0.5 (moderate), and 0.9 (severe), and
(ii) All factor influence: analyzing multidimensional system response by varying all 11 factorssimultaneously over a wider 5-point span: 0.05 (very mild), 0.1 (mild), 0.5 (moderate), 0.9(severe), 0.95 (very severe).
Single factor influence (Table 6): ‘Nausea (N)’ is a specific case in hand. If the other 10 sign-symptoms are restricted to the ‘mild’ (=0.1)category, the individual N-response (=0.541) records as ‘moderate’, that is of a higher category. On theother hand, if the other 10 factors are constrained at the ‘moderate’ level (=0.5), the individual N-response(=0.6355) records as ‘severe’, that is of the highest category. This is a highly encouraging result asVIRDOCD can be seen to show judgmental independence in analyzing the dengue CFG, akin to that of ateam of experienced clinicians. It does not over or under weigh its prediction depending on the initialchoice of the mMS category.
Table 6. Result of Single factor parametric study
14
VIRDOCD: A virtual doctor
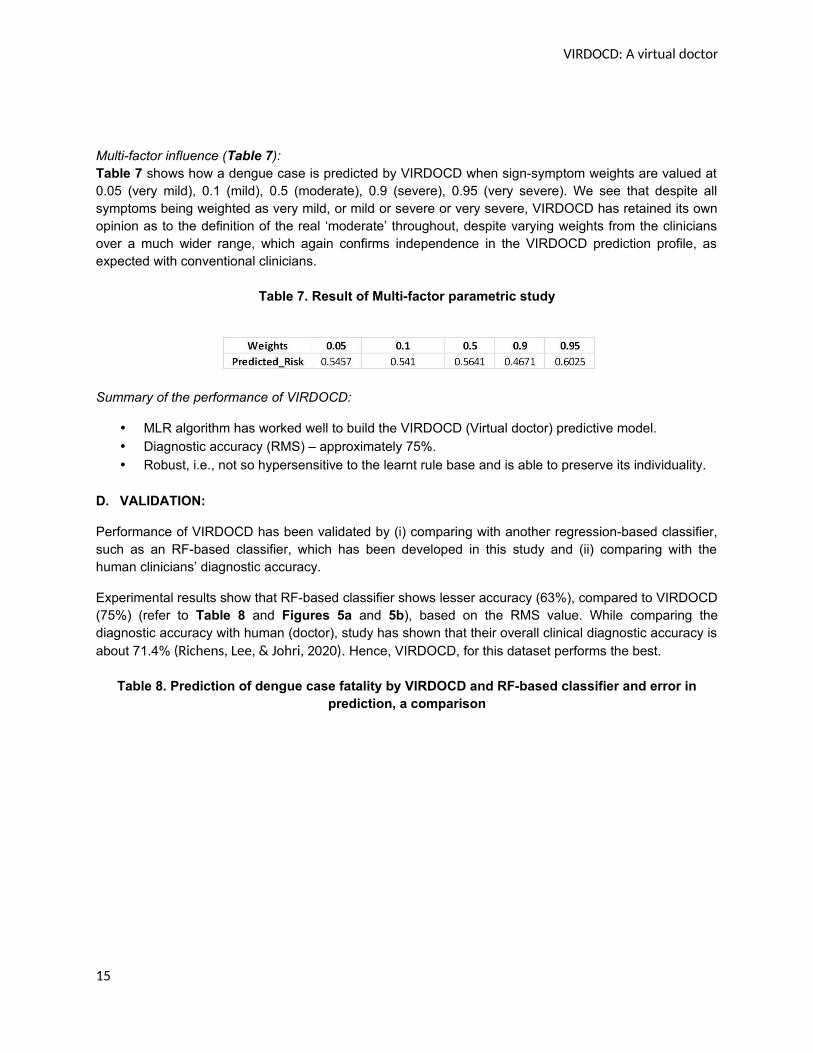
Multi-factor influence (Table 7): Table 7 shows how a dengue case is predicted by VIRDOCD when sign-symptom weights are valued at0.05 (very mild), 0.1 (mild), 0.5 (moderate), 0.9 (severe), 0.95 (very severe). We see that despite allsymptoms being weighted as very mild, or mild or severe or very severe, VIRDOCD has retained its ownopinion as to the definition of the real ‘moderate’ throughout, despite varying weights from the cliniciansover a much wider range, which again confirms independence in the VIRDOCD prediction profile, asexpected with conventional clinicians.
Table 7. Result of Multi-factor parametric study
Summary of the performance of VIRDOCD:
MLR algorithm has worked well to build the VIRDOCD (Virtual doctor) predictive model. Diagnostic accuracy (RMS) – approximately 75%. Robust, i.e., not so hypersensitive to the learnt rule base and is able to preserve its individuality.
D. VALIDATION:
Performance of VIRDOCD has been validated by (i) comparing with another regression-based classifier,such as an RF-based classifier, which has been developed in this study and (ii) comparing with thehuman clinicians’ diagnostic accuracy.
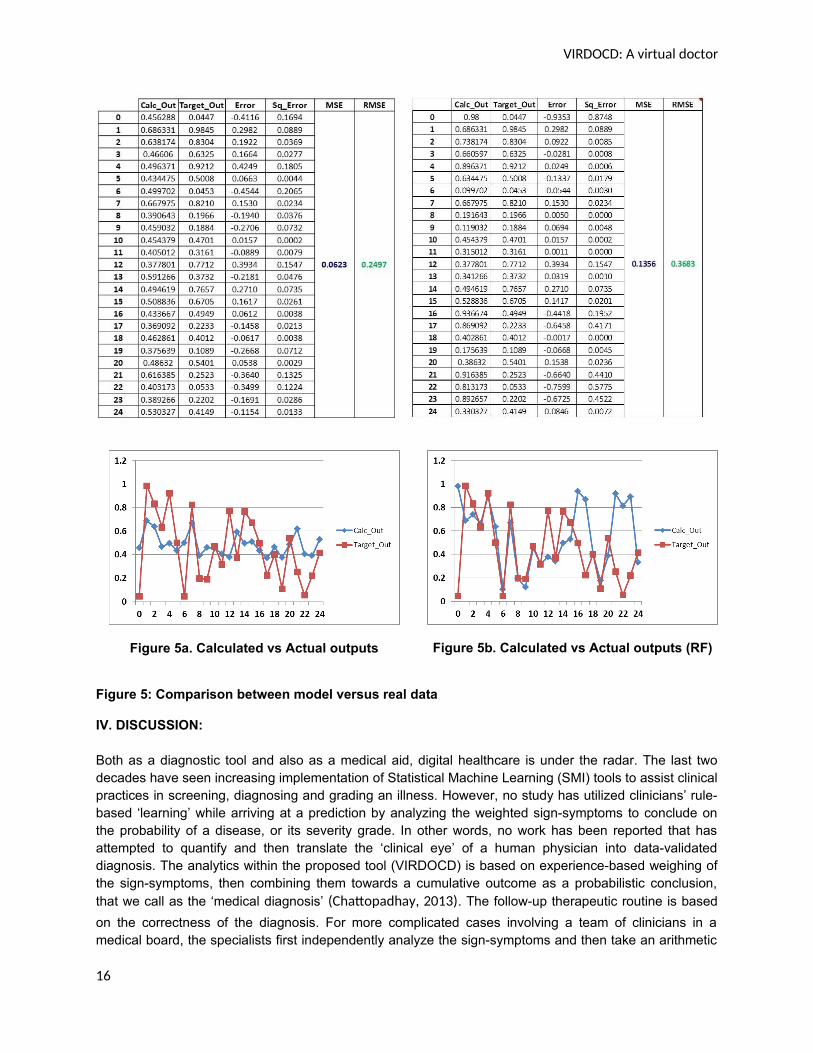
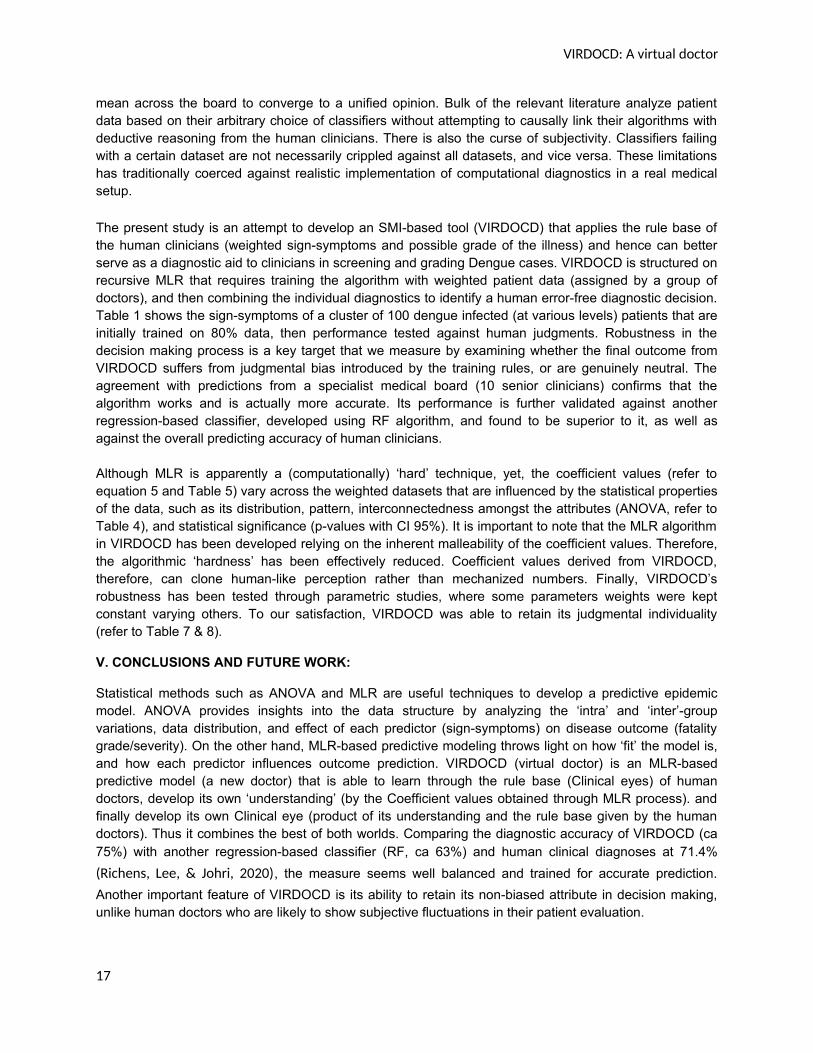
Experimental results show that RF-based classifier shows lesser accuracy (63%), compared to VIRDOCD(75%) (refer to Table 8 and Figures 5a and 5b), based on the RMS value. While comparing thediagnostic accuracy with human (doctor), study has shown that their overall clinical diagnostic accuracy isabout 71.4% (Richens, Lee, & Johri, 2020). Hence, VIRDOCD, for this dataset performs the best.
Table 8. Prediction of dengue case fatality by VIRDOCD and RF-based classifier and error inprediction, a comparison
15
VIRDOCD: A virtual doctor
Figure 5a. Calculated vs Actual outputs Figure 5b. Calculated vs Actual outputs (RF)
Figure 5: Comparison between model versus real data
IV. DISCUSSION:
Both as a diagnostic tool and also as a medical aid, digital healthcare is under the radar. The last twodecades have seen increasing implementation of Statistical Machine Learning (SMI) tools to assist clinicalpractices in screening, diagnosing and grading an illness. However, no study has utilized clinicians’ rule-based ‘learning’ while arriving at a prediction by analyzing the weighted sign-symptoms to conclude onthe probability of a disease, or its severity grade. In other words, no work has been reported that hasattempted to quantify and then translate the ‘clinical eye’ of a human physician into data-validateddiagnosis. The analytics within the proposed tool (VIRDOCD) is based on experience-based weighing ofthe sign-symptoms, then combining them towards a cumulative outcome as a probabilistic conclusion,that we call as the ‘medical diagnosis’ (Chattopadhay, 2013). The follow-up therapeutic routine is based
on the correctness of the diagnosis. For more complicated cases involving a team of clinicians in amedical board, the specialists first independently analyze the sign-symptoms and then take an arithmetic
16
VIRDOCD: A virtual doctor
mean across the board to converge to a unified opinion. Bulk of the relevant literature analyze patientdata based on their arbitrary choice of classifiers without attempting to causally link their algorithms withdeductive reasoning from the human clinicians. There is also the curse of subjectivity. Classifiers failingwith a certain dataset are not necessarily crippled against all datasets, and vice versa. These limitationshas traditionally coerced against realistic implementation of computational diagnostics in a real medicalsetup.
The present study is an attempt to develop an SMI-based tool (VIRDOCD) that applies the rule base ofthe human clinicians (weighted sign-symptoms and possible grade of the illness) and hence can betterserve as a diagnostic aid to clinicians in screening and grading Dengue cases. VIRDOCD is structured onrecursive MLR that requires training the algorithm with weighted patient data (assigned by a group ofdoctors), and then combining the individual diagnostics to identify a human error-free diagnostic decision.Table 1 shows the sign-symptoms of a cluster of 100 dengue infected (at various levels) patients that areinitially trained on 80% data, then performance tested against human judgments. Robustness in thedecision making process is a key target that we measure by examining whether the final outcome fromVIRDOCD suffers from judgmental bias introduced by the training rules, or are genuinely neutral. Theagreement with predictions from a specialist medical board (10 senior clinicians) confirms that thealgorithm works and is actually more accurate. Its performance is further validated against anotherregression-based classifier, developed using RF algorithm, and found to be superior to it, as well asagainst the overall predicting accuracy of human clinicians.
Although MLR is apparently a (computationally) ‘hard’ technique, yet, the coefficient values (refer toequation 5 and Table 5) vary across the weighted datasets that are influenced by the statistical propertiesof the data, such as its distribution, pattern, interconnectedness amongst the attributes (ANOVA, refer toTable 4), and statistical significance (p-values with CI 95%). It is important to note that the MLR algorithmin VIRDOCD has been developed relying on the inherent malleability of the coefficient values. Therefore,the algorithmic ‘hardness’ has been effectively reduced. Coefficient values derived from VIRDOCD,therefore, can clone human-like perception rather than mechanized numbers. Finally, VIRDOCD’srobustness has been tested through parametric studies, where some parameters weights were keptconstant varying others. To our satisfaction, VIRDOCD was able to retain its judgmental individuality(refer to Table 7 & 8).
V. CONCLUSIONS AND FUTURE WORK:
Statistical methods such as ANOVA and MLR are useful techniques to develop a predictive epidemicmodel. ANOVA provides insights into the data structure by analyzing the ‘intra’ and ‘inter’-groupvariations, data distribution, and effect of each predictor (sign-symptoms) on disease outcome (fatalitygrade/severity). On the other hand, MLR-based predictive modeling throws light on how ‘fit’ the model is,and how each predictor influences outcome prediction. VIRDOCD (virtual doctor) is an MLR-basedpredictive model (a new doctor) that is able to learn through the rule base (Clinical eyes) of humandoctors, develop its own ‘understanding’ (by the Coefficient values obtained through MLR process). andfinally develop its own Clinical eye (product of its understanding and the rule base given by the humandoctors). Thus it combines the best of both worlds. Comparing the diagnostic accuracy of VIRDOCD (ca75%) with another regression-based classifier (RF, ca 63%) and human clinical diagnoses at 71.4%
(Richens, Lee, & Johri, 2020), the measure seems well balanced and trained for accurate prediction.
Another important feature of VIRDOCD is its ability to retain its non-biased attribute in decision making,unlike human doctors who are likely to show subjective fluctuations in their patient evaluation.
17
VIRDOCD: A virtual doctor
Work is ongoing to introduce a chromatic RGB-styled sign-symptom grading, which can vary continuouslybetween 0 and 1 to make medical predictions objectively subjective. We are in the process of introducing‘stochastic assessment kernels’ before and after VIRDOCD data training that could then distributenumbers within these intermediate regimes generalizing the 3-point scale to a higher dimensionalconstruct.
CONFLICTS OF INTEREST:
None
DATA AVAILABILITY STATEMENT:
The data used in this work have been collected and curated by a team of clinicians, including Dr SChattopadhyay. These are real human data and hence confidential that cannot be shared evenanonymously due to hospital data embargo. All codes used in this work have been personally written byDr S Chattopadhyay using Python 3.8.3 and Spyder editor version 4.1.5 in Windows 10 Pro 64 bits OS,Processor – Intel (R) Core (TM) i5 3360M CPU@ 2.80GHz, 8GB RAM. Data presented in plots may bepersonally shared on request.
REFERENCES
Acharya, U. R., Sree, V., Ng, E. Y., Chua, C. K., & Chattopadhyay, S. (2014). Higher order Spectra Analysis
of Breast Thermograms for the Identification of Breast Cancer. Expert Systems: the Journal of
Knowledge Engineering, 31(1), 37-47.
Agrebi, S., & Larbi, A. (2020). Use of artificial intelligence in infectious diseases. Artificial Intelligence in
Precision Health, 415–438.
Alessia Alunno, E. B. (2018). Discrepancy between subjective symptoms, objective measures and disease
activity indexes: the lesson of primary Sjögren's syndrome . Clinical Experimental Rheumatology,
36(3), 210-214.
Anwla, P. K. (2020, June). Introduction to ANOVA for Statistics and Data Science (with COVID-19 Case
Study using Python). Retrieved January 12, 2021, from Analytics Vidhya:
https://www.analyticsvidhya.com/blog/2020/06/introduction-anova-statistics-data-science-
covid-python/
Ashish, K., Chattopadhyay, S., Gao, X. Z., & Hui, N. B. (2019). Neural Network-based Diagnostic Tool for
Identifying the Factors Responsible for Depression. International Journal of Computational
Intelligence and Applications, 18(2), 195001 – 14.
Brunyé, T., Drew, T., Weaver, D. L., & Elmore, J. G. (2019). A review of eye tracking for understanding
and improving diagnostic interpretation. Cognitive Research: Principles and Implications, 4(1), 7.
CDC. (2019). About dengue: what you need to know | dengue | CDC. Retrieved January 11, 2021, from
https://www.cdc.gov/dengue/about/index.html [Updated-05-06T02:28:51Z/
18
VIRDOCD: A virtual doctor
Chattopadhay, S. (2013). Mathematical Modelling of Doctors’ Perceptions in the Diagnosis of
Depression: A Novel Approach . International Journal of Biomedical Engineering and Technology,
11(1), 1 – 17.
Chattopadhyay, A. K., Ray, N., & Acton, S. T. (2005). Universality in the merging dynamics of parametric
active contours: a study in MRI based lung segmentation. New Journal of Physics, 7, 148.
Chattopadhyay, S. (2012). A Mathematical Model of Suicidal-Intent-Estimation in Adults. American
Journal of Biomedical Engineering, 2(6), 251-262.
Chattopadhyay, S. (2014). Neurofuzzy Models to Automate the Grading of Old-age Depression. Expert
Systems: the Journal of Knowledge Engineering, 31(1), 48-55.
Chattopadhyay, S., Banerjee, S., Rabhi, F. A., & Acharya, R. U. (2013). A Case-based Reasoning System for
Complex Medical Diagnoses. Expert Systems: the Journal of Knowledge Engineering, 30(1), 12-
20.
Chen, J. H., & Asch, S. M. (2017). Machine learning and prediction in medicine—beyond the peak of
inflated expectations. New England Journal of Medicine, 376(26), 2507–2509.
Choi, D. J., Park, J. J., Ali, T., & Sungyoung, L. (2020). Artificial intelligence for the diagnosis of heart
failure. npj Digital Medicine, 3(54).
Colubri, A., Silver, T., Fradet, T., Retzepi, K., Fry, B., & Sabeti, P. (2016). Transforming clinical data into
actionable prognosis models: machine-learning framework and field-deployable app to predict
outcome of Ebola patients. . PLOS Neglected Tropical Diseases, 10(3).
Cronbach, L. J. (1951). Coefficient alpha and the internal structure of tests. Psychometrika, 16, 297-334.
Cuevas, E., Osuna-Enciso, V., Zaldivar, D., Perez-Cisneros, M., & Sossa, H. (2012). Multi-threshold
segmentation based on artificial immune systems. . Mathematical Problems in Engineering, 1-
20.
Daneshgar, F., & Chattopadhyay, S. (2011). A Framework for Crisis Management in Developing Countries
. Intelligent Decision Technologies: an international journal , 5(2), 189-199.
Das, K. R., & Rahmatullah Imon, A. H. (2016). A Brief Review of Tests for Normality. American Journal of
Theoretical and Applied Statistics, 5(1), 5-12.
Dashti, S. M., & Dashti, S. F. (2020). An Expert System to Diagnose Spinal Disorders. The Open
Bioinformatics Journal, 13, 57-73.
de Rooij, M., & Weeda, W. (2020). Cross-Validation: A Method Every Psychologist Should Know.
Advances in Methods and Practises in Psychological Science, 3(2), 248-263.
Donges, N. (2019, June 16). A Complete Guide to the Random Forest Algorithm. Retrieved June 10, 2021,
from builtin.com/data-science: https://builtin.com/data-science/random-forest-algorithm
19
VIRDOCD: A virtual doctor
Fraley, S. I., Masek, B. J., Hardick, J., Carroll, K. C., Hsieh, Y., Rothman, R. E., et al. (2016). Nested machine
learning facilitates increased sequence content for large-scale automated high resolution melt
genotyping. Scientific Repoerts, 6.
Go, T., Kim, J. H., Byeon, H., & Lee, S. J. (2018). Machine learning-based in-line holographic sensing of
unstained malaria-infected red blood cells. Journal of Biophotonics, 11(9).
Goforth, C. (2015). University of Virgina Research Data Services + Sciences. Retrieved January 11, 2021,
from Using and Interpreting Cronbach’s Alpha: https://data.library.virginia.edu/using-and-
interpreting-cronbachs-alpha/
Guo, P., Liu, T., Zhang, Q., Wang, L., Xiao, J., Zhang, Q., et al. (2017). Developing a dengue forecast model
using machine learning: A case study in China. PLOS Neglected Tropical Diseases. PLOS
Neglected Tropical Diseases, 11(10), e0005973.
Hernàndez-Carnerero, A., & Sànchez-Marrè, M. (2021). Antimicrobial resistance prediction in intensive
care unit for pseudomonas aeruginosa using temporal data-driven models. , 6(5), 1.
International Journal Of Interactive Multimedia And Artificial Intelligence, 6(5), 119-133.
Hernàndez-Carnerero, A., Sànchez-Marrè, M., Mora Jiménez, I., Soguero Riuz, C., Martínez Agüero, S., &
Álvarez Rodríguez, J. (2020). Modelling temporal relationships in pseudomonas aeruginosa
antimicrobial resistance prediction in intensive care unit. ECAI Workshop on Singular Problems
for Healthcare Workshop. "Proceedings of the First International AAI4H, Advances in Artificial
Intelligence for Healthcare Workshop: co-located with the 24th European Conference on Artificial
Intelligence (ECAI 2020): (pp. 60-67). Santiago de Compostela, Spain: CEUR-WS.org.
Huddar, S., Svadzian, A., Nafade, V., Satyanarayana, S., & Pai, M. (2020). Tuberculosis case fatality in
India: a systematic review and meta-analysis. British Medical Journal Global Health, 5(1), 1-9.
Iqbal, N., & Islam, M. (2019). Machine Learning for Dengue Outbreak Prediction: A Performance
Evaluation of Different Prominent Classifiers. Informatica, 43(2019), 363–371.
Jaiswal, S. (2021). machine-learning-random-forest-algorithm. Retrieved June 10, 2021, from
javatpoint.com: https://www.javatpoint.com/machine-learning-random-forest-algorithm.
Janreung, S., Chinviriyasit, W., & Chinviriyasit, S. (2020). Mathematical evaluation of the role of cross
immunity and nonlinear incidence rate on the transmission dynamics of two dengue serotypes.
Advances in Difference Equations, 147, 1-32.
Jin, C., Chen, W., Cao, Y., Xu, Z., Tan, Z., Zhang, X., et al. (2020). Development and evaluation of an
artificial intelligence system for COVID-19 diagnosis. Nature Communications, 11, 5088.
Lu, W., Tong, Y., Yu, Y., Xing, Y., Chen, C., & Shen, Y. (2018). Applications of Artificial Intelligence in
Ophthalmology: General Overview. Journal of Ophthalmology, 2018, 1-15.
20
VIRDOCD: A virtual doctor
Majumdar, A., Debnath, T., Sood, S. K., & Baishnab, K. L. (2018). Kyasanur forest disease classification
framework using novel extremal optimization tuned neural network in fog computing
environment. Journal of Medical Systems, 42(187).
McCaffrey, J. (2020, April 08). Data Prep for Machine Learning: Normalization. Retrieved 01 18, 2021,
from https://visualstudiomagazine.com/Articles:
https://visualstudiomagazine.com/Articles/2020/08/04/ml-data-prep-normalization.aspx?p=1
O’Driscoll, M., Ribeiro Dos Santos, G., Wang, L., Cummings, D. A., Azman, A. S., Paireau, J., et al. (2020).
Age-specific mortality and immunity patterns of SARS-CoV-2. Nature.
Rajathi, N., Kanagaraj, S., Brahmanambika, R., & Manjubarkavi, K. (2018). Early Detection of Dengue
Using Machine Learning Algorithms. International Journal of Pure and Applied Mathematics,
118(18), 3881-3887.
Rao, S. S. (2020). Stock Prediction Analysis by using Linear Regression Machine Learning Algorithm.
International Journal of Innovative Technology and Exploring Engineering, 9(4), 841-844.
Richens, J. G., Lee, C. M., & Johri, S. (2020). Improving the accuracy of medical diagnosis with causal
machine learning. Nature Communications, 11, 1-9.
Sahak, M. N. (2020). Dengue fever as an emerging disease in Afghanistan: Epidemiology of the first
reported cases. International Journal of Infectious Diseases, 99, 23-27.
Salim, N. A., Wah, Y. B., Reeves, C., Smith, M., Yaacob, W. F., Mudin, R. N., et al. (2021). Prediction of
dengue outbreak in Selangor Malaysia using machine learning techniques. Scientific Reports, 11,
939 (2021).
Sarma, D., Hossain, S., Mittra, T., Bhuiya, M. A., Saha, I., & Chakma, R. (2020). Dengue Prediction using
Machine Learning Algorithms. 2020 IEEE 8th R10 Humanitarian Technology Conference (R10-
HTC) (pp. 1-6). IEEE.
Saybani, M. R., Shamshirband, S., Hormozi, S. G., Wah, T. Y., Aghabozorgi, S., Pourhoseingholi, M. A., et
al. (2015). Diagnosing tuberculosis with a novel support vector machine-based artificial immune
recognition system. Iranian Red Crescent Medical Journal, 17(4), e24557.
Shapiro, J., Rucker, L., & Beck, J. (2006). Training the clinical eye and mind: using the arts to develop
medical students' observational and pattern recognition skills. Medical Education, 40(3), 263-8.
Silver, D., Schrittwieser, J., Simonyan, K., Antonoglou, I., Huang, A., Guez, A., et al. (2017). Mastering the
game of Go without human knowledge. Nature, 550, 354–359.
Sucky, R. N. (2020, November 10). Introduction to the Descriptive Statistics. Clear and Detail
Understanding of the Most Basic and Widely Used Descriptive Statistics Measures . Retrieved
January 11, 2021, from Towards Data Science: https://towardsdatascience.com/introduction-to-
the-descriptive-statistics-a050b5ec99fb
21
VIRDOCD: A virtual doctor
Sun, G., Matsui, T., Hakozaki, Y., & Abe, S. (2015). An infectious disease/fever screening radar system
which stratifies higher-risk patients within ten seconds using a neural network and the fuzzy
grouping method. 70(3), 230–236.
Tiruveedhula, S., Navya, M., Gayathri, Y. V., & Reshma, N. (2018). Classification of Dengue using Machine
Learning Techniques. International Journal of Engineering & Technology , 7(2.32), 212.
Watkins, A., & Boggess, L. (2002). A new classifier based on resource limited artificial immune systems.
Proceedings of Congress on Evolutionary Computation, Part of the 2002 IEEE World Congress on
Computational Intelligence (pp. 1546-1551). Honolulu, HI, USA: IEEE, University of Michigan.
Willmott, C. J., & Matsuura, K. (2005). Advantages of the Mean Absolute Error (MAE) over the Root
Mean Square Error (RMSE) in Assessing Average Model Performance. Climate Research, 30(1),
79.
World Health Organization. (n.d.). Retrieved January 11, 2021, from World Health Organization Web
site: https://www.who.int/news-room/fact-sheets/detail/dengue-and-severe-
dengue#:~:text=Severe%20dengue%20is%20a%20leading,an%20acute%20flu%2Dlike%20illness.
Xi he, R. M. (2020). CHD Risk Minimization through Lifestyle Control: Machine Learning Gateway.
Scientific Reports, 10, 4090.
22