Vipdomet, alogliptin+metformin hydrochloride - European Medicines
136
7 Westferry Circus ● Canary Wharf ● London E14 4HB ● United Kingdom An agency of the European Union Telephone +44 (0)20 7418 8400 Facsimile +44 (0)20 7523 7455 E-mail [email protected] Website www.ema.europa.eu 25 July 2013 EMA/CHMP/207158/2013 Committee for Medicinal Products for Human Use (CHMP) CHMP assessment report Vipdomet International non-proprietary name: alogliptin / metformin Procedure No. EMEA/H/C/002654/0000
Transcript of Vipdomet, alogliptin+metformin hydrochloride - European Medicines

7 Westferry Circus ● Canary Wharf ● London E14 4HB ● United Kingdom
An agency of the European Union
Telephone +44 (0)20 7418 8400 Facsimile +44 (0)20 7523 7455
E-mail [email protected] Website www.ema.europa.eu
25 July 2013 EMA/CHMP/207158/2013 Committee for Medicinal Products for Human Use (CHMP)
CHMP assessment report
Vipdomet
International non-proprietary name: alogliptin / metformin
Procedure No. EMEA/H/C/002654/0000

CHMP assessment report
EMA/CHMP/207158/2013 Page 2/136
Table of contents
1. Background information on the procedure .............................................. 6
1.1. Submission of the dossier ...................................................................................... 6
1.2. Manufacturers ...................................................................................................... 7
1.3. Steps taken for the assessment of the product ......................................................... 7
2. Scientific discussion ................................................................................ 8
2.1. Introduction......................................................................................................... 8
2.2. Quality aspects .................................................................................................... 9
2.2.1. Introduction ...................................................................................................... 9
2.2.2. Active Substance ............................................................................................. 10
Alogliptin Benzoate ................................................................................................... 10
Metformin Hydrochloride ............................................................................................ 12
2.2.3. Finished medicinal product ................................................................................ 13
Pharmaceutical Development ..................................................................................... 13
Adventitious agents ................................................................................................... 14
Manufacture of the product ........................................................................................ 14
Product Specification ................................................................................................. 14
Stability of the product .............................................................................................. 14
2.2.4. Discussion on chemical, pharmaceutical and biological aspects .............................. 15
2.2.5. Conclusions on the chemical, pharmaceutical and biological aspects ...................... 15
2.2.6. Recommendation for future quality development ................................................. 15
2.3. Non-clinical aspects ............................................................................................ 15
2.3.1. Introduction .................................................................................................... 15
2.3.2. Pharmacology ................................................................................................. 17
2.3.3. Pharmacokinetics............................................................................................. 22
2.3.4. Toxicology ...................................................................................................... 30
2.3.5. Ecotoxicity/environmental risk assessment ......................................................... 38
2.3.6. Discussion on non-clinical aspects...................................................................... 41
2.3.7. Conclusion on the non-clinical aspects ................................................................ 46
2.4. Clinical aspects .................................................................................................. 47
2.4.1. Introduction .................................................................................................... 47
2.4.2. Pharmacokinetics............................................................................................. 50
2.4.3. Pharmacodynamics .......................................................................................... 61
2.4.4. Discussion on clinical pharmacology ................................................................... 64
2.4.5. Conclusions on clinical pharmacology ................................................................. 66
2.5. Clinical efficacy .................................................................................................. 67
2.5.1. Dose response studies...................................................................................... 69
2.5.2. Main studies ................................................................................................... 70
2.5.3. Analysis performed across trials (pooled analyses and meta-analysis) .................... 93
2.5.4. Clinical studies in special populations ................................................................. 94

CHMP assessment report
EMA/CHMP/207158/2013 Page 3/136
2.5.5. Supportive studies ........................................................................................... 95
2.5.6. Discussion on clinical efficacy ............................................................................ 96
2.5.7. Conclusions on the clinical efficacy ................................................................... 100
2.6. Clinical safety .................................................................................................. 100
2.6.1. Submitted data ............................................................................................. 100
2.6.2. Patient exposure ........................................................................................... 101
2.6.3. Adverse events ............................................................................................. 104
2.6.4. Serious adverse events and deaths .................................................................. 108
2.6.5. Adverse Events of Special Interest ................................................................... 109
CV Safety .............................................................................................................. 109
Hypersensitivity reactions ........................................................................................ 111
Acute Pancreatitis ................................................................................................... 112
Malignancies .......................................................................................................... 113
Pancreatic Cancer ................................................................................................... 113
Hypoglycaemia ....................................................................................................... 114
2.6.6. Comparative safety by dose ............................................................................ 116
2.6.7. Laboratory findings ........................................................................................ 116
2.6.8. Vital signs and electrocardiogram evaluations ................................................... 117
2.6.9. Safety in special populations ........................................................................... 117
2.6.10. Safety related to drug-drug interactions and other interactions.......................... 119
2.6.11. Post marketing experience ............................................................................ 119
2.6.12. Discussion on clinical safety .......................................................................... 120
2.6.13. Conclusions on the clinical safety ................................................................... 125
2.7. Pharmacovigilance ............................................................................................ 125
2.8. Risk Management Plan ...................................................................................... 125
2.9. User consultation ............................................................................................. 128
3. Benefit-Risk Balance ........................................................................... 129
Benefits ................................................................................................................. 129
Beneficial effects ..................................................................................................... 129
Uncertainty in the knowledge about the beneficial effects ............................................ 130
Risks ..................................................................................................................... 131
Unfavourable effects ............................................................................................... 131
Uncertainty in the knowledge about the unfavourable effects ....................................... 133
Benefit-risk balance ................................................................................................ 133
Importance of favourable and unfavourable effects ..................................................... 133
Discussion on the benefit-risk balance ....................................................................... 134
4. Recommendations ............................................................................... 135

CHMP assessment report
EMA/CHMP/207158/2013 Page 4/136
List of abbreviations
niddBCS Biopharmaceutics Classification System
CEP Certificate of Suitability to the Monographs of the European Pharmacopoeia
CHMP Committee for Medicinal Products for Human Use
CPP Critical Process Parameter
CQA Critical Quality Attribute
DoE Design of Experiments
DPP4 Dipeptidyl peptidase-4
EU European Union
FDC Fixed Dose Combination
FMEA Failure Mode Effects Analysis
GC Gas Chromatography
HPLC High Performance Liquid Chromatography
ICH International Conference on Harmonisation of Technical Requirements for
Registration of Pharmaceuticals for Human Use
INN International Non-proprietary Name
IR Infrared Spectroscopy
NMR Nuclear Magnetic Resonance Spectroscopy
NMT Not More Than
PCTFE Polychlorotrifluoroethylene
Ph. Eur. European Pharmacopoeia
PVC Polyvinyl Chloride
QbD Quality by Design
QTPP Quality Target Product Profile
RH Relative Humidity
RTRT Real Time Release Testing
SmPC Summary of Product Characteristics
TSE Transmissible Spongiform Encephalopathy
USP United States Pharmacopoeia
UV Ultraviolet Spectroscopy

CHMP assessment report
EMA/CHMP/207158/2013 Page 5/136
XRD X-ray Diffraction

CHMP assessment report
EMA/CHMP/207158/2013 Page 6/136
1. Background information on the procedure
1.1. Submission of the dossier
The applicant Takeda Global Research and Development Centre (Europe) Limited submitted on 30
May 2012 an application for Marketing Authorisation to the European Medicines Agency (EMA) for
Vipdomet, through the centralised procedure falling within the Article 3(1) and point 3 of Annex of
Regulation (EC) No 726/2004 . The eligibility to the centralised procedure was agreed upon by the
EMA/CHMP on 20 October 2011. During the procedure the applicant has changed to Takeda
Pharma A/S.
The applicant applied for the following indication:
“Vipdomet is indicated in the treatment of adult patients aged 18 years and older with type 2
diabetes mellitus:
as an adjunct to diet and exercise to improve glycaemic control in adult patients,
inadequately controlled on their maximal tolerated dose of metformin alone, or those already
being treated with the combination of alogliptin and metformin.
in combination with pioglitazone (i.e. triple combination therapy) as an adjunct to diet and
exercise in adult patients inadequately controlled on their maximal tolerated dose of
metformin and pioglitazone.
in combination with insulin (i.e. triple combination therapy) as an adjunct to diet and exercise
to improve glycaemic control in patients when insulin at a stable dose and metformin alone do
not provide adequate glycaemic control.”
The legal basis for this application refers to:
New active substance (Article 8(3) of Directive No 2001/83/EC). The applicant indicated that
alogliptin was considered to be a new active substance.
The application submitted is a new fixed combination medicinal product composed of
administrative information, complete quality data, a clinical bioequivalent study with the individual
tablets, non-clinical and clinical data based on applicants’ own tests and studies and/or
bibliographic literature substituting/supporting certain tests or studies.
Information on Paediatric requirements
Pursuant to Article 7 of Regulation (EC) No 1901/2006, the application included an EMA Decision
P/165/2011 on the granting of a (product-specific) waiver.
Information relating to orphan market exclusivity
Similarity
Pursuant to Article 8 of Regulation (EC) No. 141/2000 and Article 3 of Commission Regulation (EC)

CHMP assessment report
EMA/CHMP/207158/2013 Page 7/136
No 847/2000, the applicant did not submit a critical report addressing the possible similarity with
authorised orphan medicinal products because there is no authorised orphan medicinal product for
a condition related to the proposed indication.
New active Substance status
The applicant requested the active substance alogliptin contained in the above medicinal product
to be considered as a new active substance in itself, as the applicant claims that it is not a
constituent of a product previously authorised within the Union
Scientific Advice
The applicant received Scientific Advice from the CHMP on 29 September 2009 and 16 December
2010. The Scientific Advice pertained to quality, non-clinical and clinical aspects of the dossier.
Licensing status
Vipdomet has been given a Marketing Authorisation in the US on 25 January 2013.
A new application was filed in the following countries: Australia, Brazil, Canada, and Switzerland.
1.2. Manufacturers
Manufacturer responsible for batch release
Takeda Ireland Ltd.
Bray Business Park Kilruddery Co. Wicklow
Ireland
1.3. Steps taken for the assessment of the product
The Rapporteur and Co-Rapporteur appointed by the CHMP were:
Rapporteur: Pieter de Graeff Co-Rapporteur: Kristina Dunder
CHMP Peer reviewer(s): Karsten Bruins Slot
• The application was received by the EMA on 30 May 2012.
• The procedure started on 20 June 2012.
• The Rapporteur's first Assessment Report was circulated to all CHMP members on 24
September 2012. The Co-Rapporteur's first Assessment Report was circulated to all CHMP
members on 7 September 2012.
• During the meeting on 18 October 2012, the CHMP agreed on the consolidated List of
Questions to be sent to the applicant. The final consolidated List of Questions was sent to
the applicant on 18 October 2012. As a result of minor updates a final updated consolidated

CHMP assessment report
EMA/CHMP/207158/2013 Page 8/136
List of Questions was sent to the applicant on 12 November 2012.
• The applicant submitted the responses to the CHMP consolidated List of Questions on
20 December 2012.
• The Rapporteurs circulated the Joint Assessment Report on the applicant’s responses to the
List of Questions to all CHMP members on 22 January 2013.
• During the CHMP meeting on 21 February 2013, the CHMP agreed on a list of outstanding
issues to be addressed in writing by the applicant.
• The applicant submitted the responses to the CHMP List of Outstanding Issues on 22 March
2013.
• The Rapporteurs circulated the Joint Assessment Report on the applicant’s responses to the
List of Questions to all CHMP members on 02 April 2013.
• During the CHMP meeting on 25 April 2013, the CHMP agreed on a 2nd list of outstanding
issues to be addressed in writing and/or oral explanation by the applicant.
• The applicant submitted the responses to the CHMP 2nd List of Outstanding Issues on 23 May
2013.
• The Rapporteurs circulated the Joint Assessment Report on the applicant’s responses to the
List of Questions to all CHMP members on 18 July 2013.
• During the meeting on 25 July 2013, the CHMP, in the light of the overall data submitted and
the scientific discussion within the Committee, issued a positive opinion for granting a
Marketing Authorisation to Vipdomet.
2. Scientific discussion
2.1. Introduction
The prevalence of T2DM has increased dramatically throughout the world, and is expected to
continue to raise from approximately 366 million adults in 2011 to 552 million adults by 2030. T2DM
is a chronic illness associated with a number of long-term microvascular (ie, nephropathy,
retinopathy, and neuropathy) and macrovascular (i.e. cardiovascular [CV] disease, stroke, and
peripheral vascular disease) complications.
Current pharmacologic interventions for T2DM include a diverse range of antidiabetic medications
with different mechanisms of action, developed to manage the 2 different aspects of the disease:
reduced insulin secretion and peripheral insulin resistance. The main classes of oral agents include
biguanides (e.g. MET), SUs (e.g. glipizide), TZDs (e.g. pioglitazone), and other DPP-4 inhibitors
(e.g. sitagliptin). Insulin and glucagon like peptide-1 (GLP-1) analogs (e.g. exenatide and
liraglutide) are also commercially available and are administered by injection. Many therapies have
clinically important side effects, such as hypoglycaemia (SUs), weight gain, fluid retention and
heart failure (TZDs), and gastrointestinal effects and lactic acidosis (MET).

CHMP assessment report
EMA/CHMP/207158/2013 Page 9/136
The application concerns a FDC of alogliptin and metformin at a dose of alogliptin 12.5 mg in
combination with metformin 850 mg or 1000 mg for twice daily (BID) dosing in adults with T2DM.
Originally an application was submitted for four strengths: 6.25 mg+850 mg, 6.25 mg+1000 mg,
12.5 mg+850 mg, or 12.5 mg+1000 mg of the drug substances alogliptin (as benzoate) and
metformin hydrochloride, respectively. During the procedure, the applicant withdrew its application
for the 6.25 mg+850 mg, 6.25 mg+1000 mg strengths.
Metformin is approved for use in the treatment of T2DM in many countries including the European
Union (EU), the US, and Japan, and is used as first-line treatment as monotherapy, and in
combination with insulin, SUs, TZDs, and DPP-4 inhibitors.
Alogliptin belongs to a relatively new class of agents, DPP-4 inhibitors, which has emerged as a
novel treatment to help manage T2DM. In patients with T2DM, actions of the incretin hormones
GLP-1 and glucose-dependent insulinotropic polypeptide (GIP) are blunted, which contributes to
hyperglycaemia. GLP-1 and GIP are released into the bloodstream in response to meals/glucose
levels, but are quickly inactivated by DPP-4. Inhibition of DPP-4 increases circulating blood levels of
GLP-1 and GIP, thereby increasing insulin levels and decreasing glucagon levels.
The aim of the clinical program was to investigate the therapeutic effect and safety profile in the
target population of T2DM subjects. As such, phase III studies were designed to evaluate the
efficacy, safety, and tolerability of alogliptin compared with placebo and active comparators when
used in combination with widely used and effective antidiabetic agents, MET, SU, TZD, and insulin.
The clinical program was also designed to support global registration of alogliptin as a monotherapy
product and in combination with the approved oral antidiabetic medications pioglitazone and MET,
as fixed-dose combination (FDC) tablets.
Alogliptin and the alogliptin/pioglitazone FDC were first approved in Japan in April 2010 and
July 2011, respectively (25 mg with 12.5 and 6.25 mg for renally impaired patients and 25/15 mg
and 25/30 mg alogliptin/pioglitazone).
For this MAA, key guidance documents considered in the design of the clinical development program
included the Committee for Proprietary Medicinal Products (CPMP) Note for Guidance on Clinical
Investigation of Medicinal Products in the Treatment of Diabetes Mellitus (May 2002), and the
program is also largely consistent with the later draft guidance (September 2011).
2.2. Quality aspects
2.2.1. Introduction
Vipdomet is a fixed-dose combination (FDC) product. The drug product is a film-coated
immediate-release tablet containing alogliptin benzoate and metformin hydrochloride. Four
strengths were originally proposed: alogliptin 6.25 mg (as benzoate) and metformin hydrochloride
850 mg; alogliptin 6.25 mg (as benzoate) and metformin hydrochloride 1000 mg; alogliptin 12.5
mg (as benzoate) and metformin hydrochloride 850 mg; alogliptin 12.5 mg (as benzoate) and
metformin hydrochloride 1000 mg. All strengths are oblong bioconvex, and strength is
distinguished by size, film colour, and debossed markings. The tablets are presented in PCTFE/PVC
blisters with push through aluminium lidding foil.

CHMP assessment report
EMA/CHMP/207158/2013 Page 10/136
2.2.2. Active Substance
The drug product contains two active substances: alogliptin benzoate (a DPP-4 inhibitor) and
metformin hydrochloride (a biguanide). Metformin hydrochloride is a well-known active substance
described in Ph. Eur. A valid certificate of suitability to the Ph. Eur. monographs (CEP) has been
submitted by the single manufacturer described in this application. The information provided
regarding the manufacturing process and control of metformin hydrochloride was assessed and
approved by the European Directorate for the Quality of Medicines and satisfactory quality is
ensured through the CEP.
Alogliptin benzoate is a new active substance which is also the active ingredient of Vipidia
(EMEA/H/C/2182 – a standalone therapy) and Incresync (EMEA/H/C/2178 – an FDC product with
pioglitazone hydrochloride), marketing authorisations for which are sought in separate parallel
marketing authorisation applications.
Alogliptin Benzoate
The active substance alogliptin benzoate (INN: alogliptin) is a white crystalline odourless powder,
soluble in e.g. dimethylsulfoxide, sparingly soluble in methanol, slightly soluble in e.g.
tetrahydrofuran, and practically insoluble in e.g. toluene and diethyl ether. The aqueous solubility is
high and independent of pH between 3 and 11. The chemical name is
2-({6-[(3R)-3-aminopiperidin-1-yl]-3-methyl-2,4-dioxo-3,4-dihydropyrimidin-1(2H)-yl}methyl)-
benzonitrile monobenzoate, also known as
2-[[6-[(3R)-3-Amino-1-piperidinyl]-3,4-dihydro-3-methyl-2,4-dioxo-1(2H)-pyrimidinyl]methyl]be
nzonitrile monobenzoate and has the structural formula C25H27N5O4. It is a 1:1 salt between
alogliptin and benzoic acid.
The structure of alogliptin benzoate was unambiguously confirmed by NMR, UV, and IR
spectroscopy, mass spectrometry, elemental analysis, and an X-ray crystal structural study.
Physico-chemical properties such as crystalline form optical rotation and partition coefficients have
been detailed. Although alogliptin exhibits polymorphism, a single stable polymorphic form is
routinely delivered by the manufacturing process. The active substance is not hygroscopic. It has a
single chiral centre and is manufactured as the R enantiomer.
The chemical structure of alogliptin benzoate is:

CHMP assessment report
EMA/CHMP/207158/2013 Page 11/136
Manufacture
Alogliptin is synthesized in three steps from commercially available, well-defined starting materials.
The active substance is then milled to attain the desired particle size. Detailed information about the
manufacturing process, control of starting materials, reagents and solvents, control of critical steps
and intermediates along with process development and validation has been provided.
The manufacturing process is adequately described. The full 3-step process can be carried out in its
entirety at one manufacturer. Alternatively, step 1 is carried out at a different manufacturer.The
synthetic scheme, including the raw materials suppliers and process descriptions is identical for all
manufacturing sites although the scales differ.
The starting materials are well-defined, commercially available and purchased from vendors who
have demonstrated the ability to supply materials that consistently meet the established
acceptance criteria. Appropriate specifications have been adopted for the starting materials, taking
into account their route of synthesis and impact on active substance quality. The applicant has
discussed the formation and control of potential and actual impurities, including genotoxins,
degradants, and residual solvents at each step of the synthesis. Critical process parameters were
identified for each step and appropriate limits defined. All relevant impurities have been
appropriately characterised and are well controlled by the process and intermediate specifications.
Therefore, the manufacturer has good control over the manufacturing process and the described
in-process controls and specifications are considered adequate to ensure the required quality of
active substance.
Specification
The active substance specification includes the following parameters: appearance (visual and XRD),
identification (UV, IR, HPLC), heavy metals (USP method), content of (S)-enantiomer (chiral HPLC),
related substances (HPLC), residual solvents (GC), water (Ph. Eur. 2.5.12), residue on ignition (Ph.
Eur. 2.4.14), assay (HPLC) and particle size (laser diffraction). The specifications have been
adequately justified and are in compliance with the ICH guidelines including ICH Q3A(R2) and ICH
Q3C for residual solvents. The potential effect of alogliptin benzoate particle size on the dissolution
properties of Vipdomet tablets was investigated, and it was found to be negligible within the range
evaluated.
The analytical results of 46 batches of alogliptin (manufactured and used in development,
preclinical, clinical, stability studies as well as used for the purpose of validation and registration)
have been provided. Results were found within the set specification. Analytical methods have been
described and non-compendial methods validated in accordance with ICH guidelines.
Stability
Three pilot-scale batches of the active substance stored in the commercial packaging were put on
stability studies under long-term (25 °C / 60% RH) for up to 60 months and accelerated (40 °C /
75% RH) for up to 6 months as per ICH guidelines. Additional stress studies (heat (50, 60 oC),
humidity (93% RH) and photostability (white fluorescent and UV light) in line with ICH option 2)
were performed on one batch for 3 months. The parameters tested in the stability studies were
appearance, crystallinity, identification, (S)-enantiomer, related substances,

CHMP assessment report
EMA/CHMP/207158/2013 Page 12/136
(R)-3-aminopiperidine, water content, assay and microbiological limit testing. The analytical
procedures were detailed and validated. No significant changes were observed to any of the
monitored parameters under any of the tested conditions. Furthermore, stability of the polymorphic
form was demonstrated.
Forced degradation studies were also carried out and identified several degradation products
formed under acidic, basic, and oxidative aqueous conditions. The drug substance was shown to be
stable in neutral aqueous solution, even on exposure to light.
The stability studies indicate that the drug substance manufactured by the proposed supplier is
sufficiently stable. The stability results justify the proposed retest period in the proposed container.
Metformin Hydrochloride
Metformin hydrochloride is a 1:1 salt of hydrochloric acid and metformin which is achiral. Metformin
hydrochloride is a white, almost odourless crystalline powder, which is freely soluble in water,
slightly soluble in alcohol, and practically insoluble in acetone and dichloromethane. Two
polymorphic forms of metformin hydrochloride are described in the literature. The proposed
supplier routinely manufactures polymorphic form I which is the most thermodynamically stable
form at room temperature.
The chemical structure of metformin hydrochloride is:
The specification includes all of the controls specified in the monograph for metformin hydrochloride
performed using the pharmacopoeial test methods indicated in the CEP, as well as additional
specifications for particle size. The release specifications include tests for appearance (Ph. Eur.),
identification (Ph. Eur.), appearance of solution (Ph. Eur.), loss on drying (Ph. Eur.), sulphated ash
(Ph. Eur.), heavy metals (Ph. Eur.), assay (Ph. Eur.), related substances and impurity A (Ph. Eur.),
any other impurity (HPLC) and particle size (Ph. Eur. 2.9.38).
Qualification of all analytical methods has been performed by the applicant.
Batch analytical data demonstrating compliance with the drug substance specification have been
provided for three batches from the proposed manufacturer. The proposed particle size limits are
comparable to those batches of metformin hydrochloride used in the manufacture of batches of
Vipdomet used in clinical and bioequivalence studies.
According to literature data, metformin hydrochloride is very stable in the solid state. Degradation
studies were carried out to confirm the literature data. Regular production batches of metformin
hydrochloride packed in the intended commercial packaging were put on stability testing as per ICH
conditions by the manufacturer: eight batches were stored under long term conditions (25 °C / 60%
RH) for up to 60 months, and two were stored under accelerated conditions (40 °C / 75% RH) for
up to 6 months. Stability was also tested under stressed conditions in the solid state (UV light (254

CHMP assessment report
EMA/CHMP/207158/2013 Page 13/136
nm) and heat degradation (100 oC)) and in solution (50% aqueous solution, 100 oC / pH 2, 6, 12.3
or 100 oC / H2O2). The following parameters were tested: description; solubility; melting point; loss
on drying; assay; related impurities (HPLC). Additionally, metformin hydrochloride is routinely
tested against the specifications of the finished product manufacturer before use.
No significant changes were observed in any of the monitored parameters under long-term or
accelerated storage conditions. The active substance is stable in the solid state at temperature and
under UV irradiation, thus confirming the literature data. Metformin hydrochloride degrades in
aqueous solution at all pHs and under oxidative conditions.
The stability studies indicate that the drug substance manufactured by the proposed supplier is
sufficiently stable. The stability results justify the proposed retest period in the proposed container.
2.2.3. Finished medicinal product
Pharmaceutical Development
The objective was to develop an immediate release orally available formulation containing a fixed
dose combination of alogliptin benzoate and metformin hydrochloride. Good stability and
dissolution characteristics were required for both active substances and the formulation needed to
be adaptable to produce different strength doses with only minor adjustments to composition. A
film coating was required to mask the bitter taste of both active substances.
Metformin hydrochloride (BCS class III) is freely soluble in aqueous media. Alogliptin benzoate
(BCS class I) is sparingly soluble in water from pH 3-11 and particle size was demonstrated to have
no effect on dissolution profile. Nonetheless, a specification for alogliptin benzoate is included to
ensure the particle size distribution falls within a justified range. Excipients were chosen to
maximise hardness, reduce friability, and maximise disintegration and dissolution time but also
based on their compatibility with the active substances, which were also shown to be mutually
stable.
Pharmaceutical development of the finished product contains QbD elements. The applicant has
stated the quality target product profile (QTPP) based on the above requirements and justified the
identified critical quality attributes (CQA) of the finished product. A failure mode effects analysis
(FMEA) was undertaken to identify potential critical process parameters (CPP) of the tablet
manufacturing process and these were investigated experimentally. Multi-variate analysis of the
CPPs was undertaken using a design of experiments (DoE) approach on development scale, but
none of the factors investigated were shown to be critical. The identified factors were further
investigated on commercial scale and finished product of acceptable quality was produced when the
process was operated within the claimed operating ranges. Furthermore, the applicant has
demonstrated that the process operated within the claimed conditions is capable of delivering drug
product of all strengths in acceptable quality. The applicant’s proposed PARs for each of the drug
product manufacturing steps are therefore acceptable.
Bioequivalence for all strengths of the fixed dose combination product was demonstrated in
comparison to the standalone parent formulations in a pivotal clinical bioequivalence study.

CHMP assessment report
EMA/CHMP/207158/2013 Page 14/136
All of the chosen excipients are compendial and widely used in film-coated tablets. The excipients
include microcrystalline cellulose, mannitol, povidone, magnesium stearate, crospovidone,
hypromellose 2910, talc, titanium dioxide, iron oxide red, and iron oxide yellow. All the excipients
are controlled in accordance with Ph. Eur. except for iron oxide red which is in accordance with
quality standard 95/45/EC (E172).
The film-coated tablets are packaged in blisters comprised of PCTFE/PVC clear film with an
aluminium foil push-through lidding material to seal the film surface. The materials comply with Ph.
Eur. and EU regulation requirements.
Adventitious agents
Magnesium stearate is the only excipient potentially of animal origin. The applicant certifies that
only magnesium stearate of plant origin is used in the finished product manufacture.
Manufacture of the product
The manufacturing process for Vipdomet is considered to be non-standard as defined in the CHMP
guideline on non-standard processes (CPMP/QWP/2054/03), since the alogliptin benzoate is as low
as 0.5% of the tablet weight, and is equivalent for all strengths. The holding time for bulk tablets
before packaging has been justified based on stability.
A disintegration test is used by the applicant as a real time release test (RTRT) for the tablet cores.
This method is compendial (Ph. Eur. 2.9.1, apparatus A), the applicant has demonstrated its
equivalence to a standard dissolution test for each individual active substance, and its use is
therefore deemed acceptable. The manufacturing process has been validated on commercial scale
and in commercial equipment.
Product Specification
The finished product specifications for release and shelf-life are appropriate for film-coated tablets
and include tests for: appearance (visual description and tablet dimensions), identification (HPLC
and UV), related substances (HPLC), content uniformity (HPLC), disintegration (Ph. Eur. 2.9.1),
assay (HPLC) and microbiological examination.
Batch analysis data from eighteen commercial scale batches, including three of each proposed
strength of drug product, (and a further three each of different strengths which won’t be
commercialised, as supporting evidence), confirm the consistency of the manufacturing process
and its ability to consistently produce finished product within the intended specifications.
Stability of the product
For all proposed commercial strengths, stability data from three commercial scale batches, stored
in the proposed commercial packaging under long-term conditions (25 ºC / 60% RH) for up to 36
months, and under accelerated conditions (40 ºC / 75% RH) for up to 6 months according to ICH
guidelines were provided. Additionally, supportive stability data from three commercial scale
batches of further strengths (not planned for commercialization) stored in the proposed commercial

CHMP assessment report
EMA/CHMP/207158/2013 Page 15/136
packaging under long-term conditions (25 ºC / 60% RH) for up to 36 months, and under
accelerated conditions (40 ºC / 75% RH) for up to 6 months according to ICH guidelines were
provided. Samples were tested for appearance, assay, related substances, alogliptin (S)-isomer,
dissolution, moisture content, hardness, and microbiological content. The analytical procedures
used were stability indicating. The only observed trend was a slight decrease in alogliptin assay, and
a concomitant increase in related substances after 36 months under long term conditions and 6
months under accelerated conditions. However, measured values remain well within the proposed
specifications. A slight increase in moisture content was also noted over time under both storage
conditions, but since this has no effect on tablet hardness, microbial content, or dissolution profile,
this test is not included in the finished product specifications.
Photostability studies were also performed according to ICH Q1B guidelines and revealed no
significant changes in any of the tested parameters. Bulk tablet stability was also investigated in the
proposed intermediate packaging. The trends observed were analogous to those observed for
tablets in the final commercial packaging and therefore, the proposed bulk storage shelf-life is
acceptable.
Based on available stability data, the shelf-life and storage conditions as stated in the SmPC are
acceptable. In addition, future commercial lots will be placed on stability annually, and the applicant
will continue on-going stability studies on registration batches for the duration of the proposed
shelf-life.
2.2.4. Discussion on chemical, pharmaceutical and biological aspects
Information on development, manufacture and control of the active substance and finished product
has been presented in a satisfactory manner. The results of tests carried out indicate consistency
and uniformity of important product quality characteristics, and these in turn lead to the conclusion
that the product should have a satisfactory and uniform performance in clinical use.
2.2.5. Conclusions on the chemical, pharmaceutical and biological aspects
The quality of this product is considered to be acceptable when used in accordance with the
conditions defined in the SmPC. Physicochemical and biological aspects relevant to the uniform
clinical performance of the product have been investigated and are controlled in a satisfactory
manner. Data has been presented to give reassurance on viral/TSE safety.
2.2.6. Recommendation for future quality development
N/A
2.3. Non-clinical aspects
2.3.1. Introduction
The alogliptin/metformin fixed-dose combination (FDC) tablet containing alogliptin and metformin
hydrochloride is being developed by Takeda for the treatment of type 2 diabetes mellitus (T2DM).

CHMP assessment report
EMA/CHMP/207158/2013 Page 16/136
Alogliptin is a potent and highly selective inhibitor of the dipeptidyl peptidase (DPP)-4 enzyme that
is being developed as an antihyperglycemic agent. Metformin improves glucose tolerance in
patients with T2DM by lowering both basal and postprandial plasma glucose; reduces hepatic
glucose production by inhibiting gluconeogenesis and glycogenolysis; improves peripheral glucose
uptake and utilization in muscle by increasing insulin sensitivity; delays intestinal absorption of
glucose; and stimulates intracellular glycogen synthesis by acting on glycogen synthase and
increases the transport capacity of all types of membrane glucose transporters (GLUT).
Alogliptin has been characterized in a battery of in vitro and in vivo pharmacodynamic,
pharmacokinetic, and toxicologic studies. Alogliptin, as synthesized, exists predominantly as the
(R)-enantiomer (>99%). In vivo chiral conversion to (S)-alogliptin is minimal. Alogliptin is
metabolized to 2 metabolites, an N-demethylated metabolite (M-I) and an N-acetylated metabolite
(M-II). M-I has DPP-4 inhibitory activity that is similar to alogliptin, whereas the (S)-enantiomer has
minimal DPP-4 inhibitory activity, and M-II does not inhibit DPP-4 in vitro.
Pivotal toxicity and safety pharmacology studies were conducted in compliance with the good
laboratory practice (GLP).
The intended clinical route of administration is oral; therefore, with the exception of an IV single
dose toxicity study in rats, IV and paravenous tolerance studies in rabbits, and an IP micronucleus
study in mice, alogliptin was administered orally (gavage or capsule) in the in vivo toxicological
evaluations.
Non-clinical studies assessing immunotoxicity, including in vitro assessments for immune function
and immunophenotyping of leukocyte populations, were not conducted with alogliptin.
Metformin is a member of the biguanide class of compounds, which includes phenformin and
buformin, and was introduced into clinical practice for the treatment of T2DM in 1957. The mode of
action for metformin is not fully understood; however, it is considered to be multifactorial,
potentiating insulin action mainly through a post receptor mechanism resulting in a reduction in
insulin resistance. Metformin is considered an insulin sensitizer since it lowers glucose levels
without increasing insulin secretion.
Metformin pharmacodynamic information presented in this document was obtained from published
literature. No new nonclinical studies were conducted with metformin alone to support this FDC
submission.
To support an FDC of alogliptin and metformin primary pharmacodynamic studies were conducted
to evaluate the effects of concomitant treatment with alogliptin and metformin in diabetic rat
models. Additionally, a pharmacodynamic drug interaction study evaluated the effects of treatment
with alogliptin, pioglitazone, and metformin combined.

CHMP assessment report
EMA/CHMP/207158/2013 Page 17/136
2.3.2. Pharmacology
2.3.2.1. Primary pharmacodynamic studies
Alogliptin
In vitro Pharmacodynamic assays
The primary pharmacological activity of alogliptin was determined in various enzyme assays. The
target enzyme, dipeptidyl peptidase-4, was inhibited in vitro by alogliptin with an IC50 (nM) ranging
from 6 to 18 depending on source of enzyme. The assays demonstrated that alogliptin is a potent
and specific inhibitor of rat, dog, and human DPP-4 activity. Similar to alogliptin, the M-I metabolite
is equipotent and a selective inhibitor of DPP-4. No inhibitory activity was noted for M-II, while weak
DPP-4 inhibition was noted for the (S)-enantiomer of alogliptin. The R-enantiomer is 1000-times
more active than the (S)-enantiomer.
An assay comparing the potency and selectivity of alogliptin with other DPP-4 inhibitors (vildagliptin
and sitagliptin) showed that alogliptin was more potent, and generally more selective; mean IC50
values for DPP-4 inhibition for alogliptin, vildagliptin, and sitagliptin were 6.9 nmol/L, 23.8 nmol/L,
and 12.1 nmol/L, respectively.
In Vivo Primary Pharmacodynamic Assays
The effects of alogliptin on DPP-4 activity were assessed in normal, euglycemic animals and in
various animal models of T2DM. These in vivo studies evaluated the effects of alogliptin on diabetic
parameters such as GHb, glucose tolerance, and plasma glucose and insulin levels, as well as
effects on endocrine pancreatic function and morphology. In vivo, alogliptin was pharmacologically
active in normoglycemic mice, rats, dogs, and cynomolgus monkeys and in mouse and rat models
of T2DM. Alogliptin improved glucose tolerance and increased plasma insulin levels in normal mice.
A single dose of alogliptin to wild-type C57BL/6 mice decreased the normalized plasma glucose area
under the plasma concentration-time curve from time 0 to 90 minutes (AUC(0-90min)) to 75% of
control values and increased plasma insulin levels to 146% of control values. When administered in
the diet to diabetic ob/ob mice for 4 weeks, alogliptin decreased GHb and increased plasma insulin
levels, plasma insulin/glucose ratio, and pancreatic insulin levels.
In established rat models of T2DM, female Wistar fatty rats and nonobese N-STZ-1.5 rats, alogliptin
produced a dose-dependent improvement in glucose tolerance and a dose-dependent increase in
plasma immunoreactive insulin (IRI) levels.
Oral administration of alogliptin to normal cynomolgus monkeys increased insulin and GLP-1 levels
and decreased glucagon levels with no notable effect on plasma glucose.
Alogliptin increased pancreatic insulin content in ob/ob mice and male N-STZ-1.5 rats.
Immunohistochemical analyses of pancreatic β-cell and α-cell morphology in the ob/ob mice
following 4 weeks of daily exposure to alogliptin revealed increased staining of the β-cells for
insulin-like immunoreactivity. Apparent changes in β-cell number and size in the islets could not be
CHMP assessment report
EMA/CHMP/207158/2013 Page 18/136
detected, suggestive of a lack of β-cell proliferation or hypertrophy. There were no apparent
changes in α-cell morphology.
Metformin
The regulatory effects of metformin on glucose involve suppression of hepatic glucose output,
increased peripheral glucose utilization, reduced fatty acid utilization, and increased glucose
turnover, particularly in the splanchnic bed. In addition, metformin alters glucose handling by
erythrocytes and reduces hypertriglyceridemia. The primary route is via decreased hepatic glucose
production (gluconeogenesis). Studies in isolated, perfused livers and hepatocytes from animals
show that metformin acts directly in the liver to reduce gluconeogenesis from a range of substrates
including lactate, pyruvate, alanine, glutamine, and glycerol. In addition to this effect, metformin
also reduces hepatic glucose output by decreasing the overall rate of glycogenolysis; in diabetic
mice, metformin increased glycogen synthase and glycogen phosphorylase in the liver indicating
increased glycogen turnover. Both gluconeogenesis and glycogenolysis probably reflect, in part, a
suppressive effect by metformin on hepatic glucagon activity.
Metformin increased insulin-stimulated glucose utilization, mainly in skeletal muscle, under
conditions of hyperglycaemia and/or insulin resistance. Metformin is found in high concentrations in
the wall of the small intestine and may decrease intestinal absorption, thereby affecting
postprandial hyperglycaemia. Metformin reduces the rate of fatty acid oxidation which correlates
approximately with suppression of hepatic glucose production; this suggests that reduced fatty acid
oxidation contributes to reduce gluconeogenesis. Metformin also reduces circulating triglyceride
levels in hypertriglyceridemic patients resulting in reductions in triglyceride levels reduce insulin
resistance.
At the cellular level, metformin increases the functional activity of glucose transporters (GLUT-1
and GLUT-4) and influences membrane events affecting tyrosine kinase activity that leads to the
augmentation of a range of insulin signals. The glucose lowering effect of metformin has been
demonstrated in STZ-induced diabetic mice, normal and mildly hyperglycemic rats,
insulin-resistant Zucker rats, and normal dogs.
2.3.2.2. Secondary pharmacodynamic studies
Alogliptin
Secondary activity of alogliptin at concentrations of 1 and 10 µmol/L was evaluated in vitro in
receptor binding assays and enzyme activity screening. At the high concentration alogliptin caused
a 50% inhibition of naloxane binding at the opioid receptor in the rat cerebral cortex. No activity
equal to or exceeding 50% was evident on other receptors, ion channels or enzymes.
GLP-1 has been associated with decreased gastrointestinal (GI) motility and appetite. In vivo
studies have shown that a single dose of alogliptin is effective in lowing plasma glucose levels,
increasing plasma intact GLP-1 levels, and increasing plasma IRI levels in Wistar fatty rats.
However, in this same strain (Wistar fatty rat), exposure to alogliptin for 8 consecutive weeks did
not produce notable changes in body weight or in metabolic indices. Plasma total cholesterol (TC)
was statistically decreased (p≤ 0.025) at the highest dose evaluated (10 mg/kg/day). Unlike the

CHMP assessment report
EMA/CHMP/207158/2013 Page 19/136
DPP-4 inhibition that occurred in this model after a single dose of alogliptin, only minimal DPP-4
inhibition was observed after 8 consecutive weeks of treatment.
A study to investigate effect of alogliptin or metformin on xylose absorption in male Wistar fatty rats
was conducted. Metformin or alogliptin (1 mg/kg) were administered 1 hour prior to xylose
challenge. No effect of alogliptin on xylose absorption was noted while metformin dose-dependently
inhibited xylose absorption.
Metformin
Cardiovascular pathology is the major determining factor of morbidity and mortality in type II
diabetic patients. Metformin appears to possess potentially beneficial vascular properties, in
addition to an effect on serum lipid profiles. In the United Kingdom Prospective Diabetes Study,
metformin was found to be associated with reduced macrovascular complications and all-cause
mortality in overweight type II diabetic patients. Studies in animal models of T2DM demonstrated
the vasculoprotective effects of metformin. Anti-ischemic effects have been demonstrated in
non-diabetic hamsters, rats, and humans. The beneficial effects in both diabetic and non-diabetic
subjects indicate that the effect is independent of the antihyperglycemic activity of metformin. A
model of ischemia in rabbit hearts showed that both metformin and pioglitazone have a
cardioprotective effect mediated by nitric oxide (NO).
Regarding the antihypertensive effects of metformin, most studies in animals have been positive
showing a reduction in various models of hypertension, but results in diabetic and non-diabetic
human subjects have been less clear cut. A hypotensive response for metformin (administered IV)
in hypertensive and normotensive rats, suggested withdrawal of sympathetic activity.
Metformin reduces triglyceride, total cholesterol, and free fatty acid levels in patients with type II
diabetes. In animal models of atherosclerosis, metformin shows anti-atherogenic properties.
Several mechanisms appear to be involved including a reduction in lipid accumulation in the arterial
wall, and cellular events including inhibition of leukocyte-endothelial interaction, foam cell
formation, smooth muscle proliferation, and platelet aggregation.
2.3.2.3. Safety pharmacology programme
Alogliptin
The potential of alogliptin to elicit unintended pharmacological activity in non-target systems has
been investigated. With the exception of preliminary, investigative hERG assays with the HCl and
TFA salts and the action potential duration assay; the core safety pharmacology studies were
conducted in compliance with GLPs.
Central Nervous System
Alogliptin is unlikely to have untoward pharmacologic activity in the central nervous system (CNS).
Although alogliptin inhibited naloxone binding at nonselective opioid receptors in vitro in the rat
cerebral cortex, it did not show any binding affinity for human receptors typically associated with
abuse potential (human recombinant opiate receptors). In vivo, no noteworthy

CHMP assessment report
EMA/CHMP/207158/2013 Page 20/136
alogliptin-related effects on general behavior and activity were observed in rats at doses of up to
300 mg/kg/day for 4 consecutive weeks. The evaluations were performed at day -1, day 1 and day
25 and included open-field observations, forelimb and hindlimb grip strength, hindlimb splay and
pain perception.
Respiratory and Cardiovascular Systems
Alogliptin is not expected to interfere with respiratory or cardiovascular function at the proposed
clinical dosage of 25 mg/day. The IC50 value for the in vitro inhibition of human ether
a-go-go-related gene (hERG) channel currents by alogliptin was >30 μmol/L. At concentrations up
to 30 μmol/L, alogliptin did not delay action potential repolarization in isolated canine Purkinje
fibers, and no alogliptin-related effects on resting membrane potential, action potential amplitude,
or the maximum rate of depolarization were noted. The sensitivity of these in vitro assays was
confirmed by the appropriate positive controls.
Alogliptin had no effect on body temperature, heart rate, blood pressure (systolic, diastolic, and
mean arterial pressure), or electrocardiogram (ECG) parameters (PR or RR intervals, QRS duration,
QT interval or corrected QT interval [QTc] value) in telemetrized beagle dogs given oral gavage
doses of up to 25 mg/kg. No alogliptin-related cardiovascular effects were noted in dogs in the
repeat-dose toxicity studies at oral doses of up to 200 mg/kg/day for up to 39 weeks.
Alogliptin did not affect cardiac troponin (I or T isoform) concentrations in dogs. The 200 mg/kg/day
dose to beagle dogs for 26 weeks provides an estimated exposure margin of alogliptin, based on
area under the plasma concentration-time curve from time 0 to 24 hours (AUC(0-24)), of
approximately 227-fold higher than the clinical dose of 25 mg/day.
Respiratory function of rats administered a single oral dose of 10 to 100 mg/kg alogliptin was
unaffected.
Metformin
No formal safety pharmacology studies have been performed on metformin. No such studies are
considered necessary in view of the extensive clinical experience accumulated over several decades
of use. Lactic acidosis has been shown to be a risk with the biguanides, which may arise because of
increased lactate production (hypoxia) or decreased elimination. However, among patients taking
metformin, lactic acidosis is of very rare occurrence.
2.3.2.4. Pharmacodynamic drug interactions
Alogliptin
Because T2DM is a progressive disease, combination therapies are used to achieve better glycemic
control. Combination treatment with alogliptin, which stimulates insulin secretion, and pioglitazone,
which enhances insulin sensitivity or with alogliptin and glibenclamide, which enhances insulin
secretion, could augment their effects on glycemic control. Similarly, combination treatment with
alogliptin and metformin or alogliptin and voglibose, therapeutic agents that affect intestinal
glucose absorption, may provide better efficacy than treatment with either agent alone.
CHMP assessment report
EMA/CHMP/207158/2013 Page 21/136
Combined treatment with alogliptin and pioglitazone to db/db mice resulted in additive decreases in
plasma GHb levels, plasma triglyceride (TG) levels, plasma nonesterified fatty acid (NEFA) levels,
and plasma glucose area under the plasma concentration time curve (AUC) values, and an additive
increase in the insulinogenic index. This treatment synergistically decreased plasma glucose and
synergistically increased pancreatic insulin content and, immunohistochemical analyses of
pancreatic tissues revealed intense expression of insulinlike immunoreactivity (IR), normal
β-cell/α-cell distributions, and overall expression of insulin promoter transcription factor
(pdx-1)-like IR. Combined treatment with alogliptin and pioglitazone in ob/ob mice additively
decreased GHb, fed and fasting plasma glucose levels, and plasma NEFA and additively increased
plasma insulin, fed and fasting plasma/insulin glucose ratios, and pancreatic insulin content.
Additionally, treatment with alogliptin alone or in combination with pioglitazone decreased plasma
glucagon levels.
Combination treatment with alogliptin and glibenclamide to N-STZ-1.5 rats additively decreased
plasma glucose levels and additively increased plasma insulin levels.
Combined treatment with alogliptin and voglibose to db/db mice additively decreased plasma DPP-4
activity, synergistically increased plasma intact GLP-1 levels and pancreatic insulin content, and
additively prevented deterioration of glycemic control while additively preserving plasma insulin
levels. Immunohistochemical analyses of the pancreatic tissue from these mice showed that
combination treatment with alogliptin and voglibose effectively preserved islet architecture and
islet cell composition in db/db mice.
Metformin
Changes in mean arterial pressure (MAP) and heart rate (HR) occurred during IV metformin
administration concomitant with administration of an α-adrenergic (phentolamine), β-adrenergic
(propranolol), muscarinic (atropine), ganglionic (hexamethonium), NO synthase
(NG-methyl-L-arginine acetate salt), or combination ganglionic plus α-adrenergic plus β-adrenergic
blockade in spontaneously hypertensive rats. The hypotensive actions of metformin in
spontaneously hypertensive rats were abolished and reversed into pressor responses by
hexamethonium, phentolamine, or by combination ganglionic plus adrenergic blockade. Neither
propranolol, nor atropine, nor NG-methyl-L-arginine acetate salt affected hypotensive responses to
metformin. Acute IV metformin administration decreased MAP by causing withdrawal of
sympathetic activity. The increase in MAP uncovered by hexamethonium and phentolamine
suggested that the original depressor response to metformin is buffered by mechanisms unrelated
to the autonomic nervous system.
Alogliptin combined with metformin
Combination treatment with alogliptin and metformin to Wistar fatty rats additively decreased
plasma glucose, synergistically increased plasma active GLP-1 levels, and enhanced insulin
secretion. In Wistar fatty rats, combination treatment with alogliptin and metformin or
pre-treatment with pioglitazone followed by treatment with alogliptin or metformin decreased the
plasma glucose AUC(0-120min) by 37% to 38% and, pre-treatment with pioglitazone followed by
treatment with alogliptin and metformin combined, decreased the plasma glucose AUC(0-120min)
by up to 55%.

CHMP assessment report
EMA/CHMP/207158/2013 Page 22/136
2.3.3. Pharmacokinetics
2.3.3.1. Performed studies
Alogliptin
The pharmacokinetics of alogliptin were determined after oral or IV administration to rats, dogs and
cynomolgus monkeys. The disposition of 14C-alogliptin was studied in rats and dogs. Plasma
protein binding in mouse, rat, dog and human plasma was determined in vitro, and tissue
distribution (including distribution to the eyeball and the placenta) of 14C-alogliptin was evaluated
in rats. The absorption, distribution, metabolism, and excretion of alogliptin and its metabolites
were studied in rats and dogs. The biotransformation of alogliptin was investigated extensively in
vitro and in vivo in rats and dogs. A milk excretion study was also conducted in rats. Non-clinical
pharmacokinetic and metabolism studies used formulations that were similar, or identical, to those
used in toxicology and pharmacodynamic studies.
The kinetics of alogliptin were also investigated when co-administered with pioglitazone and
metformin. The effect on the kinetics of the combination of alogliptin with sulphonylurea or triple
therapies was not investigated in the pre-clinical species.
Validated LC-MS-MS methods having acceptable linear range, LLOQ, intra assay accuracy and
precision were used to analyse Alogliptin, Alogliptin M-I and Alogliptin M-II in mouse plasma, rat
plasma, rat fetal serum, rat milk, rabbit plasma, dog plasma or monkey plasma. Acceptable and
validated methods were also developed for analysis of (S)-alogliptin in rat and dog plasma.
For LC/MS/MS assays, alogliptin-d4 TFA salt and M-I-d4 were used as the internal standards for
quantitation of alogliptin and M-I.
For rat metabolism studies, a bioanalytical method based on HPLC with liquid scintillation detection
and counting of radioactivity was used.
Metformin
Metformin has been approved in the European Union for over 50 years for the treatment of type 2
Diabetes Mellitus. Therefore, only few publications relating to the non-clinical pharmacokinetics of
metformin have been found in literature searches. The pharmacokinetic properties from literature
searches were presented and discussed. Analysis of metformin was performed using validated and
acceptable analytical methods.
Alogliptin combined with metformin
No new non-clinical pharmacokinetic studies on the combination of alogliptin and metformin were
conducted.

CHMP assessment report
EMA/CHMP/207158/2013 Page 23/136
2.3.3.2. Absorption
Alogliptin
Caco-2 permeability
Alogliptin has low permeability as the apparent permeability (Papp) coefficients were comparable to
those of mannitol, which is a reference compound for low permeable compounds. The Papp ratios
were different at each time point (1 and 2 hours) and were relatively low compared with those of
digoxin. Therefore, the involvement of P-glycoprotein in the transport of alogliptin was not clear in
a Caco-2 assay but expected to be limited.
Single-dose pharmacokinetics
The single-dose pharmacokinetics of alogliptin was studied in rats, dogs, monkeys and humans via
PO and IV routes of administration.
Alogliptin was absorbed in rats, dogs and monkeys following PO dose administration. The oral
bioavailability of alogliptin in the non-clinical species evaluated differed across species 41-45% in
rats, 69-85% in dogs and 72-88% in monkeys. Studies with radiolabeled alogliptin benzoate
showed an oral absorption ratio of 61.1% in rats and 88.6% in dogs based on AUC0-24hr values. In
rats, ~30% of the dose radioactivity was absorbed via the jejunal loop within 2 hours after
administration of 14C-alogliptin benzoate (3 mg freebase/kg) into the jejunal loop suggesting that
the jejunum is one of the major absorption sites in rats.
Alogliptin was poorly absorbed (<0.1% at 24 hours post-dose) via the lymph after a single PO
administration of 3 mg free base/kg radiolabeled alogliptin to rats.
The terminal elimination half-life (T½) of alogliptin after IV administration was a little bit shorter in
rats and dogs (1.1-1.4 hours and 1.5-2.9 hours, respectively) when compared to monkeys (5.7
hours). In studies with PO (3 mg/kg) or IV (1 mg/kg) administered 14C-alogliptin, the half-life of the
measured radioactivity was found to be 4.9 and 3.4 hours after oral and IV dosing, respectively, in
rats and 6.7 and 5.3 hours, respectively, in dogs. The volume of distribution of alogliptin after IV
dosing was ~2.6 – 3.9 L/kg in all pre-clinical species used. Plasma clearance values were higher in
rats (~3.0 – 3.3 L/kg/hr) and dogs (~1.3 – 2.4 L/kg/hr) than in monkeys (~0.5 L/kg/hr).
After a single PO administration of alogliptin benzoate in male rats and dogs, Cmax and AUC0-24hr
values increased dose-proportional between 0.3 to 3 mg/kg in dogs, and more than
dose-proportional between 3 to 30 mg/kg in dogs and between 3 to 100 mg/kg in rats. Tmax and T½
values were generally constant over the tested dose range, but in dogs T½ was lower (~2-fold) at
0.3 mg/kg and Tmax higher (~3-fold) at 30 mg/kg compared to the other doses tested.
Among the several salts of alogliptin that were evaluated, the benzoate salt showed the best
bioavailability in rats and dogs. Therefore, it was selected for toxicity studies.

CHMP assessment report
EMA/CHMP/207158/2013 Page 24/136
Repeated-dose pharmacokinetics of alogliptin and its metabolites (M-I & M-II)
The repeated-dose pharmaco- and toxicokinetics of alogliptin were determined after repeated PO
dosing in mice, rats, dogs and monkeys. Alogliptin was rapidly absorbed in all species studies.
In mice and monkeys, exposure to alogliptin was generally dose-proportional. For male mice, the
exposure was higher than expected at the 200 mg/kg dose leading to dose non-proportionality on
visual inspection, which was the result of the high, but largely variable plasma concentrations at 8
hours and 12 hours post-dose on Day 1 and Day 90, respectively. In rats and dogs, the increase in
alogliptin exposure was more than dose-proportional. In addition, there was an increase in T½ at
increasing dose in rats.
In general, no significant accumulation of alogliptin was observed in mice and monkeys after
repeated dosing with alogliptin. In rats, accumulation of alogliptin was observed with accumulation
ratios mostly in the range of 1.7-2.8. In dogs, a slight accumulation was seen for alogliptin after
repeated dosing with accumulation ratios ranging between 1.1 and 1.7.
As only up to 1% of alogliptin will be present in vivo as [S]-alogliptin, its pharmaco- and
toxicokinetics will not influence the pharmacological effects of alogliptin.
Less than ~3.2% of alogliptin was converted to M-I in mice at all dose levels when the AUC values
were compared and decreased with increasing dosages. On the other hand, in rats, the
metabolite-to-parent ratio (in %) was maximally 33.8% with lower contribution of the metabolite to
total exposure at increasing dosage. The elimination of M-I in rats seemed to be saturable since its
T½ increased with increasing dose. Following a low oral dose of 10 mg/kg alogliptin, the 24-hour
total exposure to M-I was 76 and 85% of that to the parent drug in female and male dogs,
respectively. With increasing dose, the contribution of the metabolite exposure decreased (to
20-40%). A saturable formation of the metabolite may be responsible for the decrease of M-I
contribution with increasing dose. The 24-hour total exposure to M-I in monkeys was 11 and 12.6%
of that to the parent drug for females and males, respectively, at the low dose and decreased to 2.5
and 1.6%, respectively, at the high dose suggesting saturation of metabolism.
No significant accumulation of M-I was observed in mice, rats, dogs and monkeys after oral
repeated dosing with alogliptin.
In all species for which data on M-II was present, AUC0-24hr values showed that M-II was only formed
to a small extent: 0.5% in monkeys and <3% in rats. In rats, slight accumulation occurred at all
dose levels except at 400 mg/kg/day in male rats with accumulation ratios up to ~2.6. In monkey,
no accumulation of M-II was observed.
Repeated-dose pharmacokinetics in pregnant animals
Pregnancy had an impact on total exposure of alogliptin in pregnant rats and rabbits leading to
differences in exposure to alogliptin and alogliptin metabolites most likely due to increases in
distribution volume and differences in elimination.
After oral dosing with 250, 500 and 1000 mg/kg in pregnant rats, Tmax and systemic exposure of
alogliptin were generally higher on gestation day (GD) 17 compared to GD6. Plasma half-life was
generally ~2.2 to 4 hours, but was ~49 hours at the highest dose on GD6 and not determinable on
GD17.
CHMP assessment report
EMA/CHMP/207158/2013 Page 25/136
In pregnant rabbits, exposures were slightly lower on GD6 than on GD18 at doses of 100 and 200
mg/kg but comparable at higher doses of 500 and 700 mg/kg which may indicate less absorption at
the late stage of gestation for higher doses.
Repeated-dose pharmacokinetics in juveniles
The toxicokinetic effects of alogliptin in juvenile rats were assessed in an oral 4-week and 8-week
toxicity study with dose levels of 30, 100 and 300 mg/kg. AUC0-24hr values for alogliptin and M-II
increased more than dose-proportional with increases in dose and AUC0-24hr values for M-I less than
dose-proportional with dose, and tended to increase with repeated doses (up to max. ~3-fold).
Pharmacokinetics when concomitantly administered with metformin or pioglitazone
The combination treatment of alogliptin and metformin was investigated in one single-dose study
and in two repeated-dose toxicity studies of 4 and 13 weeks, respectively. No effects on the
toxicokinetics of metformin were observed when co-administered with alogliptin. The effects of
concomitant treatment with alogliptin and pioglitazone on the toxicokinetic parameters of both
compounds were assessed in a single-dose and two repeated-dose studies for 4 weeks and 13
Weeks, respectively. These studies showed no toxicokinetic interactions regarding the kinetic
parameters of alogliptin.
Metformin
Uptake of metformin was facilitated by over-expression of hOCT1 and hOCT2 and showed saturable
processes, indicating that metformin is a substrate of these transporters. The inhibitory effects on
metformin uptake by OCT-inhibition were greater for hOCT2 than for hOCT1. In vivo, plasma
concentrations of metformin were elevated only by the co-administration of tetraalkylammoniums
with higher affinities for OCTs (Choi et al. 2007a).
The pharmacokinetics of metformin in rats after IV and oral administration were determined by Choi
et al. (2006a). After oral administration, absorption of metformin from the gastro-intestinal (GI)
tract was rapid with Tmax being 15-120 minutes. Absolute bioavailability values of metformin were
low, ~30-34%, which was mainly due to considerable GI tract first-pass effects. The intestinal and
gastric first-pass effects of metformin were ~32 and 24% of dose. AUC values of metformin were
dose-proportional between among doses of 50 and 200 mg/kg independent of the route of
administration. Total clearance and volume of distribution, determined after IV administration,
were ~25 ml/min/kg and 0.6 L/kg, respectively.
After administration of oral and IV doses of metformin to alloxan-induced diabetic and normal male
Wistar rats, the serum concentrations of metformin followed a 2-compartment open model of
absorption for both IV and oral administration. Peak serum concentrations of metformin after oral
doses of 100 and 200 mg/kg were of the order of 9 and 15 µg/mL, respectively in normal rats and
10 and 25 µg/mL, respectively in diabetic rats. Following oral administration, the extent of
absorption ranged from 31 to 59% in alloxan rats and 14 to 19% in normal rats. The apparent
volume of distribution was calculated to be in the region of 0.6 L/kg for both normal and diabetic
rats (Kakemi et al., 1983).

CHMP assessment report
EMA/CHMP/207158/2013 Page 26/136
In the study of Stepensky et al. (2002) intraduodenal administration produced larger response than
intraportal metformin infusion, and the lowest response was observed following IV administration,
despite the similarity in the concentration-time profiles obtained for different routes of metformin
administration. This finding indicates that a significant first-pass effect, which occurs in the
pre-systemic sites of action, contributes to the overall glucose-lowering response of metformin.
The study of Chou (2000) revealed that hepatic uptake is rate-limited by a permeability barrier and
although metformin is accumulated in the liver, the organ does not extract it.
2.3.3.3. Distribution
Alogliptin
Protein binding
In vitro plasma protein binding of alogliptin was studied in mice, rats, dogs and humans. The results
indicate that alogliptin has low protein binding (<60% in all species) and was concentration
dependent. Plasma protein binding of M-I was also low (<40% in all species).
Red blood cell partitioning
Following PO administration of 3 mg free base/kg 14C-alogliptin benzoate to rats, concentrations of
radioactivity in red blood cells were 35% to 41% and were almost constant from 1 to 24 hours
post-dose. In dogs, the distribution ratio of radioactivity into blood cells constantly decreased from
1 to 8 hours post-dose from 38% to 23% when dosed with 3 mg free base/kg 14C-alogliptin.
Tissue distribution
Distribution was studied in rats following PO administration of a single dose of 14C-alogliptin
benzoate (3 mg freebase/kg) to male albino and male pigmented rats. Radioactivity was absorbed
rapidly with most matrices reaching Cmax at 4 hours post dose. In albino rats, the tissues with the
highest mean Cmax values at 4 hours, excluding the gastrointestinal (GI) tract tissues, were
kidneys, liver, lungs, pituitary gland, and submaxillary glands. The tissues with the lowest Cmax
values were brain and spinal cord. By 72 hours post dose, concentrations of radioactivity were low
in all tissues except the kidneys.
In pigmented rats, the concentrations of radioactivity in the plasma showed a similar profile to that
in albino rats. The concentrations of radioactivity in the eyes of pigmented rats, however, were
much higher than those in the eyes of albino rats. These results suggest that alogliptin-related
materials have an affinity to melanin and Alogliptin accounted for most of the residual radioactivity
in sclera of pigmented rats after a single PO administration of 14C-alogliptin benzoate.
Placental transfer
On gestation day (GD) 18, pregnant rats were administered 14C-alogliptin benzoate (3 mg free
base/kg) via PO (322-00246). Radioactivity was quickly absorbed and Cmax was reached at 4 hours.

CHMP assessment report
EMA/CHMP/207158/2013 Page 27/136
The Cmax of total radioactivity in fetal tissues (136 ng equiv/g) was lower than the corresponding
value in maternal plasma (191 ng equiv/g). The Cmax of total radioactivity in placenta was higher
(639 ng equiv/g) than that in maternal plasma.
Elimination of total radioactivity in fetal plasma, amniotic fluid, and fetal tissues was rapid (0.004,
0.002, 0.003 ng equiv/g at 24 hours post-dose, respectively). The concentration-time profiles of
radioactivity in the fetuses and fetal plasma were parallel to those in the maternal plasma. The
radioactivity in the placenta was higher than that in maternal plasma or in amniotic fluid. However,
elimination of total radioactivity in placenta was also rapid. The concentrations of radioactivity in
the fetuses and fetal plasma were lower than those in the maternal plasma at all the time points
examined, suggesting that the transfer of radioactive compounds from the maternal side to the
fetal side was quantitatively restricted by placental passage. Based on these results, it can be
concluded that 14C-alogliptin-derived radioactivity is able to cross the blood-placental barrier.
Metformin
Protein binding
The plasma protein binding of metformin was very low. In rat plasma, only about 15% was reported
to be protein bound in vitro (Choi et al., 2006).
Red blood cell partitioning
In rat blood, metformin is slightly more distributed into plasma than into red blood cells. The
equilibrium plasma-to-blood cells partition ratios of metformin were independent of initial blood
metformin concentrations in the concentration range of 1 to 20 μg/mL (Choi et al., 2006).
Tissue distribution
Mehnert (1969) found that, in mice, the highest concentrations of metformin were observed in the
liver, kidney, adrenals and pancreas. Metformin was not bound to serum protein in blood.
In the Wilcock and Bailey study (1994), tissue accumulation of metformin was examined after oral
administration to normal and STZ diabetic mouse. Administration of 50 mg/kg radiolabeled
metformin via intragastric gavage resulted in maximum plasma concentrations at 0.5 hours, which
declined to <5% of maximum by 24 hours. The greatest accumulation of metformin occurred in
tissues of the small intestine, where maximum concentrations were reached at 0.5 to 2 hours, but
declined to <2% of maximum by 24 hours. High concentrations were also noted in stomach, colon,
salivary gland, kidney and liver, which accumulated metformin more than 2-fold, and
concentrations of the drug in heart and skeletal muscle were greater than plasma concentrations on
some occasions up to 8 hours.
In a normal mouse IV study, IV bolus administration of 50 mg/kg metformin produced a maximum
inferior vena cava plasma concentration at 0.5 hours, which declined rapidly at 4 hours. Metformin
was selectively accumulated by tissues of the small intestine, with maximum values noted at 0.5
hours. Thus, retention of metformin by tissues of the small intestine may represent a deep
compartment for the drug (Wilcock and Bailey, 1994).

CHMP assessment report
EMA/CHMP/207158/2013 Page 28/136
Distribution into the liver
The subcellular localization of metformin in livers of 18 hour fasted rats treated orally with 50 mg/kg 14C-metformin was studied by Wilcock (1991). Sequential determination of 14C-radioactivity
showed that maximum concentrations of metformin in plasma (15 µmol/L) and liver (50 µmol/kg)
were achieved at 60 and 30 minutes, respectively, and approximately half-maximal concentrations
were achieved at 4 hours. The higher concentration in liver compared with plasma suggests that
metformin enters hepatocytes via a specific mechanism, and is distributed mainly within the
cytosol.
2.3.3.4. Metabolism
Alogliptin
Alogliptin was stable in all metabolic systems investigated (human, rat, dog, and monkey
cryopreserved hepatocytes and rat, dog, monkey, and human liver microsomes) with the exception
of dog and rat hepatocytes (approximately 50% and 65% of the parent compound remained after
2-hour incubation with dog and rat hepatocytes, respectively).
Identification of the metabolites showed that alogliptin is considered to be biotransformed to M-I by
N-demethylation, and to M-II by acetylation of the amino group. M-I is an N-demethylated
metabolite and a pharmacologically active metabolite with a DPP-4 inhibitory activity similar to that
of alogliptin (IC50: 14 and 10 nmol/L, respectively in human plasma). M-II is an N-acetylated
metabolite and has no DPP-4 inhibitory activity and thus a pharmacologically inactive metabolite.
Both M-I and M-II are minor human metabolites with an exposure to these 2 identified minor
metabolites in plasma, relative to unchanged drug, of <1% and <6%, respectively. All metabolites
found in humans were also found in rats and dogs and there are thus no unique human metabolites
of alogliptin.
When the exposure to M-I was compared following oral (gavage) administration of alogliptin to
Sprague Dawley rats, beagle dogs and monkeys during a 28-day toxicity study Cmax levels of M-I
were found to be much higher in dogs (day 26) as compared to rats (day 28) and monkeys (day 1).
The in vivo chiral conversion of [R]-alogliptin to [S]-alogliptin was negligible (<1%) in rats and dogs
in both plasma and urine samples.
Metformin
Metformin was reported as not being metabolized in all species. However in a recent study of Choi
et al. (2006b), it was shown that metformin is metabolized by CYP2C11, CYP2D1 and CYP3A1/2 in
rats as demonstrated by concomitant administration with relevant CYP inhibitors and inducers.

CHMP assessment report
EMA/CHMP/207158/2013 Page 29/136
2.3.3.5. Excretion
Alogliptin
Following PO administration of 14C-alogliptin benzoate to rats and dogs, the major route of
elimination of total radioactivity was via the feces in both species.
In rat alogliptin and M-I were the major components in the urine and feces, M-II was a minor
component in feces. A study to evaluate the potential enterohepatic recirculation of alogliptin
indicated that alogliptin-related radioactivity undergoes some enterohepatic recirculation in rats. In
dogs alogliptin and M-I were the major components in urine and feces and M-II was not detected.
After PO administration of 14C-alogliptin benzoate (3 mg freebase/kg) to lactating rats on Lactation
Day (LD) 14, the concentrations of radioactivity in the plasma reached a maximum of 0.170 μg
equiv/mL at 0.5 hours post dose and rapidly decreased to 0.006 μg equiv/mL at 24 hours post dose,
followed by a gradual decrease to 0.003 μg equiv/mL 48 hours postdose. The concentrations of
radioactivity in the milk reached a maximum of 0.316 μg equiv/mL at 0.5 hours postdose and
rapidly decreased to 0.012 μg equiv/mL at 24 hours postdose, followed by a gradual decrease to
0.003 μg equiv/mL at 48 hours postdose. These results indicate that alogliptin and its related
compounds were secreted into the milk of lactating rats after a single PO administration of 14C-alogliptin benzoate.
Metformin
Twenty-four hours after oral administration of 100 mg/kg of labelled metformin to mice, about 75%
of activity can be recovered in the urine and approximately 10% in the faeces. Rats excrete about
10% less in the urine and, therefore more in the faeces. Less than 1% of the radioactivity was found
in the bile. Unchanged metformin was the only substance which appeared in the urine of rats and
mice (Mehnert, 1969).
2.3.3.6. Pharmacokinetic drug interactions
Alogliptin
In vitro, alogliptin is a weak direct CYP2D6 inhibitor at concentrations ≥40 µM (=~14 µg/mL).
Metabolism-dependent inhibition of CYP3A4/5 was observed for alogliptin with an IC50 value of 78
µM (=~26 µg/mL). These concentrations are however much higher than the human Cmax of 0.483
µg/mL reached after a 100 mg dose, which is four times higher than the clinical recommended dose
of 25 mg. Therefore, alogliptin is not expected to be an inhibitor of CYP2D6 and CYP3A4/5 in vivo in
humans as is underlined by the results of the clinical drug-drug interaction study with midazolam
(CYP3A4) and dextromorphan (CYP2D6). CYPs 1A2, 2C8, 2C9, 2C19 were not inhibited in vitro by
alogliptin as is supported by the observation that alogliptin does not interact with rosiglitazone,
glyburide or glipizide.
Induction of CYP enzymes by alogliptin was only observed for CYP3A4/5 at a concentration of 100
µM based on testosterone 6ß-hydroxylase activity, although this was not statistically significant.
However, the induction potential was about a fourth of the effectiveness of the known inducer

CHMP assessment report
EMA/CHMP/207158/2013 Page 30/136
rifampin, and no induction was observed clinically. Therefore, no CYP induction is expected in
humans.
The applicant investigated if alogliptin is an in vitro inhibitor of OAT1, OAT3 and OCT2. The study
included both control cells and cells transfected with the specific transporter of interest. Further, the
used probe substrates (PAH, E3S and metformin) and positive control inhibitors (probenecid,
probenecid and quinidine) are appropriate. No clinically relevant inhibition by alogliptin (based on
its Cmax of 0.3 µM) was seen for any of the investigated transporters.
The inhibitory effect of alogliptin on BCRP was examined using BCRP expressed cells. After
incubation of [3H]prazosin (0.01 μmol/L), a substrate for BCRP, at 37°C with alogliptin at
concentrations of 0, 0.3, 1, 3, 10, 30, and 100 μmol/L, the Papp ratios of [3H]prazosin (0.01
μmol/L) were 12.5, 12.6, 11.2, 12.0, 10.6, 12.8, and 11.9×10⁻⁶ cm/sec across the
BCRP-expressing cells, and were 1.3, 1.3, 1.2, 1.3, 1.2, 1.3, and 1.3×10⁻⁶ cm/sec across the
control cells, respectively. The corrected Papp ratios were 9.6, 9.7, 9.3, 9.2, 8.8, 9.8, and 9.2,
respectively. These results suggest that alogliptin had no inhibitory effect on BCRP-mediated efflux
activity. Therefore, alogliptin is not an inhibitor of BCRP.
No in vitro studies were performed with MATE and OATP. A clinical study was performed to study the
interaction potential between alogliptin and cyclosporine (inhibitor of OATP1B1/OATP1B3, BCRP
and P-glycoprotein). Whether alogliptin is a substrate and/or an inhibitor of MATE1 and MATE2 was
investigated in a clinical study in healthy volunteers with cimetidine and metformin. (Please see
clinical pharmacology section for further details)
Metformin
Although metformin is mainly excreted unchanged via urine, limited metabolism by CYP2C11, 2D1
and 2A1/2 occurs in the rat. Several studies in rat have demonstrated that metformin kinetics may
be altered in disease models, for example where hepatic expression levels of these CYPs are
changed, e.g. streptozotocin induced diabetes in rats or challenge of E. coli LPS or with Klebsiella
pneumoniae endotoxin in rats (Choi et al., 2007b; Cho et al., 2009; Choi et al., 2008), or where rats
suffered from acute renal failure (Choi et al., 2010). Further, altered body functions due to lifestyle
may affect the pharmacokinetics of metformin by increasing hepatic OCT1 expression in mice fed a
high-fat diet (Jang et al., 2010) or by decreased urinary excretion due to dehydration in rats (Choi
et al. 2007c). Another study showed that swimming before administration of metformin
significantly improved insulin sensitivity and the rate of metformin absorption in insulin-resistent
rats (Chien et al., 2008).
2.3.4. Toxicology
The safety of alogliptin has been investigated in a battery of nonclinical toxicity studies including
single- and repeat-dose toxicity studies in mice, rats, and dogs, reproductive toxicity studies in rats
and rabbits, and in vitro and in vivo genotoxicity studies. Two-year carcinogenicity studies were
conducted in mice and rats. Repeat-dose toxicity studies were also conducted in juvenile rats (4
weeks of age at dose initiation), including one study specifically aimed at evaluating the possible
toxicity on male reproductive organs. Local tolerance studies assessing the hemocompatibility of a
parenteral formulation of alogliptin in human blood/plasma and the IV and paravenous tolerance of

CHMP assessment report
EMA/CHMP/207158/2013 Page 31/136
alogliptin were performed in rabbits. Special toxicity studies (4- and 13-week) were conducted in
monkeys to evaluate the potential dermal toxicity of alogliptin. The potential of alogliptin to induce
phototoxicity was evaluated in a hairless mouse model.
In addition repeat-dose toxicity studies (4- and 13 week) in rats and an embryo-fetal development
toxicity study in rats were conducted to assess the toxicity of combination treatments with alogliptin
and pioglitazone and with alogliptin and metformin.
2.3.4.1. Single dose toxicity
Alogliptin
The lethal single oral and IV doses of alogliptin in rats were greater than 1471 mg/kg and 25 mg/kg,
respectively. The lethal single oral dose in dogs was greater than 368 mg/kg. There were no
sex-related differences in the single-dose toxicity of alogliptin. Clinical signs were observed in dogs
only. Reddened skin around the ears and face were observed in males following oral doses of ≥ 92
mg/kg and in females at ≥ 221 mg/kg. Warm to touch and/or decreased activity were observed at
doses of ≥ 221 mg/kg. A female dosed with 368 mg/kg also exhibited swelling around the face, skin
cold to touch, salivation, and emesis; this female also lost weight during the 2-week post dose
observation period.
Metformin
Toxicity was found to be very variable in the rat. The oral LD50 values in all species are high in
relation to a human dose of 12 mg/kg, based on 850 mg dose and 70 kg body weight. Deaths
occurring at massive doses generally resulted from hypoglycaemia.
Alogliptin combined with metformin
Sprague-Dawley rats (2/sex/group, 6 weeks of age) were administered oral gavage doses of 100,
300, or 1000 mg/kg metformin; 100 mg/kg alogliptin; or 100 mg/kg alogliptin with 1000 mg/kg
metformin. This was an investigative, non-GLP study. Plasma levels of metformin were not affected
by alogliptin exposure; however, alogliptin plasma levels were reduced following concomitant
treatment with metformin.
2.3.4.2. Repeat dose toxicity
Alogliptin
Low toxicity was showed for mice, with a NOAEL of about 50 times the intended human exposure
based on AUC. In mice, several deaths occurred in the repeat-dose toxicity studies. Although
pathologic examinations could not confirm the exact cause of these deaths, the incidence increased
dose dependently at doses of 400 mg/kg/day and higher. Alogliptin-related observations were
noted in male mice and included yellow discoloured fur and unkempt appearance at 200 mg/kg/day

CHMP assessment report
EMA/CHMP/207158/2013 Page 32/136
and higher, and swelling in the anogenital area at 400 mg/kg/day and higher. Decreased RBC, HCT,
and HGB were also noted at 600 mg/kg/day.
Most important alogliptin-related histopathologic findings in rats were noted in the liver, kidneys,
and urinary bladder. Increased ALP, increased liver weights, and centrilobular hepatocellular
hypertrophy were noted in rats administered doses of ≥900 mg/kg/day. With the exception of
increased liver weights, liver-related findings were fully reversible. Mortality was observed in rats
administered repeat doses of ≥1000 mg/kg/day. The The clinical pathologic findings observed
included increased WBC, LYM, RET, or MON and decreased RBC, HCT, and HGB at 900 mg/kg/day
and higher, and increased phosphorus and cholesterol at 1000 mg/kg/day and higher. Decreased
ALB and A/G (albumin/globulin) ratio were also observed at 1333 mg/kg/day and higher. NOAEL for
6 months exposure was 400 mg/kg/day, which is about 50 – 150 times the intended human
exposure.
In the repeat-dose toxicity studies in dogs, occasional and transient occurrences of reddened ears
and facial swelling without associated histopathologic changes were observed at doses of
30 mg/kg/day and higher. In the 39-week repeat-dose toxicity study, dogs administered
200 mg/kg/day (highest dose evaluated) lost weight during the first month of the treatment period;
these losses resulted in a decrease in mean body weight during the treatment period. The overall
NOAEL in dogs was 200 mg/kg/day; at this dose, the AUC(0-24) was 400 µg·hr/mL (combined
sexes).
The effects of concomitant treatment with alogliptin and pioglitazone on the toxicokinetic
parameters of both compounds were assessed in a single-dose and two repeated-dose studies for
4 weeks and 13 Weeks, respectively. These studies showed no toxicokinetic interactions regarding
the kinetic parameters of alogliptin. In addition, the incidence and magnitude of the findings seen in
rats administered alogliptin and pioglitazone in combination for 13 weeks were comparable to rats
that received pioglitazone alone. Combination treatment with alogliptin and pioglitazone did not
produce new toxicities, and did not exacerbate any pioglitazone-related findings.
Metformin
Literature reveals that repeated exposure to metformin for 13 weeks in rats resulted in decreased
body weights in males at ≥600 mg/kg/day and mortality at ≥900 mg/kg/day. Increased serum
lactate and β-hydroxybutyric acid and decreased serum bicarbonate and urine pH occurred at ≥600
mg/kg/day. Histopathologic findings included an increased incidence of minimal necrosis with
minimal to slight inflammation of the parotid salivary gland in males at 1200 mg/kg/day. The
NOAEL was 200 mg/kg/day. Toxicokinetic data showed no sex- or duration-related differences in
metformin plasma levels.
No toxic effects were observed in the liver, kidneys, spleen, adrenal glands, or bone marrow after
administration of metformin for 12 months or longer to rats (10 mg/kg/day orally), rabbits (10 to
50 mg/kg/day SC or up to 100 mg/kg/day orally), or dogs (50 mg/kg/day SC). No abnormalities
were noted in dogs dosed at 50 mg/kg/day SC for 2 years.

CHMP assessment report
EMA/CHMP/207158/2013 Page 33/136
Alogliptin combined with metformin
Repeat-dose toxicity studies with alogliptin and metformin in rats for up to 13-weeks slightly
augmented metformin-related effects on plasma lactic acid levels and increased the incidence of
metformin-related effects in the adrenal gland, liver, heart, and submandibular gland (males),
although it did not affect the severity of the changes. These effects were shown only at the
combination of alogliptin with the high dose of 1000 mg/kg metformin.
2.3.4.3. Genotoxicity
Alogliptin
Alogliptin was evaluated for its potential to induce reverse mutations in S typhimurium and E coli,
its mutagenic potential in vitro in L5178Y/TK+/- mouse lymphoma cells, and its mutagenic potential
in vivo in a mouse bone marrow micronucleus study. Where appropriate, positive controls were
used to confirm the sensitivity of the assay. Based on the results of these studies, alogliptin does
not pose a mutagenic or clastogenic risk to humans.
Metformin
According to literature, no evidence of genotoxicity was found in Ames test (S typhimurium),
mammalian gene mutation assay in mouse lymphoma cells, chromosomal aberration test in human
lymphocytes, or in a mouse bone marrow micronucleus test.
2.3.4.4. Carcinogenicity
Alogliptin
Alogliptin was shown to be not oncogenic or carcinogenic in mice, and the NOAEL of the 2-year
carcinogenicity study was 300 mg/kg/day. Slightly, statistically non-significant, increased incidence
in malignant lymphoma in female mice was observed at doses of 150 mg/kg/day when compared
with historical control data.
In rats, a slight, statistical non-significant increase in the incidence of thyroid C-cell tumours was
noted in males at ≥ 400 mg/kg/day. This was weakly supported by increments of adenomas and
hyperplasia. However, the incidence of these findings in this study was within the variability
suggested by the historical control. Moreover, a rodent-specific mechanism through increased
calcitonin release has been suggested for increases in C-cell tumours seen for GLP1 analogues
(Knudsen et.al. Endocrinology 151:1473-86). Therefore, a weak increase in C-cell tumours after
alogliptin treatment could be explained by the indirect impact on GLP1 levels following the
administration of this DPP4 inhibitor.
Minimal to mild simple transitional cell hyperplasia in the urinary bladder was noted in 2, 6, 10, and
14 males at 0, 75, 400, and 800 mg/kg/day, respectively. In the male historical control series,
simple transitional cell hyperplasia in the urinary bladder was reported for several studies and was

CHMP assessment report
EMA/CHMP/207158/2013 Page 34/136
seen in 6/60 males in one study. NOAEL for simple transitional cell hyperplasia in the urinary
bladder was considered to be 75 mg (males) and 400 mg (females)/kg/day.
Also, alogliptin-related non-neoplastic histopathologic changes were seen in the liver, lung, and
urinary bladder of males and females, and in the testes, epididymides, and prostate of males. The
NOAEL for nonneoplastic changes was 75 mg/kg/day for males and 400 mg/kg/day for females. The
safety factors based on AUC are about 25 and >200 respectively.
Metformin
Long-term carcinogenicity studies have been performed in rats (≤900 mg/kg/day for 104 weeks)
and in mice (≤1500 mg/kg/day for 91 weeks). No evidence of carcinogenicity was found in male or
female mice or in male rats. In female rats, there was an increased incidence of benign stromal
uterine polyps at the highest dose.
2.3.4.5. Reproduction Toxicity
Alogliptin
In a rat fertility study with dose levels of 0, 100, 500, 1000 mg/kg bw/day, maternal toxicity was
observed at 500-1000 mg/kg/day, and paternal toxicity at 100 – 1000 mg/kg/day. In male rats,
dose related increase of absolute and relative cauda epididymis weight, relative epididymis weight,
relative weight of seminal vesicle with coagulating glands and relative testes weight and an
increased % of abnormal sperm were observed, however, without any effect on fertility. At the
highest dose of 1000 mg/kg increased post implantation loss and decreased number of viable
foetuses occurred.
Two embryo-foetal developmental reproduction toxicity studies were done, one in rats and one in
rabbits. In rats, doses 250, 500, and 1000 mg/kg/day induced maternal toxicity and foetal toxicity.
It is likely that the foetal toxicity (bent ribs, decreased ossification) was secondary to the maternal
effects (decreased food consumption and gravid uterine weight change). In rabbits, high doses
resulted in maternal deaths (highest doses) and toxicity signs (lower food consumption and body
weight and body weight and gravid uterine weight). The only observed foetal effect was decreased
number of viable foetuses in the only surviving doe at the highest dose level, which can be
considered a consequence of maternal toxicity.
An embryo-foetal developmental toxicity study in rats was also done with the combination of
alogliptin with pioglitazone. The combination only showed a slight potentiation of foetal growth
inhibition.
A pre/postnatal developmental study in rats revealed maternal toxicity in the form of decreased
gestation body weights, gestation body weight changes, lactation body weight, food consumption
during lactation at doses of 500 – 1000 mg/kg/day. At 1000 mg/kg, developmental toxicity was
found, consisting of increased stillborn index, decreased pup viability and effects on motor activity,
learning, memory in F1 males. At 500-1000 mg/kg/day, decreased pup body weight was observed
up to PND28 and through pre/post mating of F1.

CHMP assessment report
EMA/CHMP/207158/2013 Page 35/136
Two rat juvenile toxicity studies were performed, one with a treatment duration of 4 weeks and one
with a treatment duration of 8 weeks, both with the same dose levels of 30, 100 and 300
mg/kg/day. In the 4-week study some slight effects were found on haematological and
blood/urinary chemistry and slight hepatocyte hypertrophy, but these changes were not considered
toxicologically significant and were not replicated in the second longer study.
Metformin
The fertility of male and female rats was unaffected by metformin administration at doses as high
as 600 mg/kg/day.
Metformin was not teratogenic in rats and rabbits at daily doses up to 600 mg/kg/day.
In an early study Tuchmann-Duplessis and Mercier-Parot dosed rats orally from GD 1 to 12 at 500
or 1000 mg/kg/day. At 500 mg/kg/day, there was a 19% decrease in the average number of
fetuses per litter; 2 fetuses from 60 dams had severe malformation. There were no adverse effects
at 1000 mg/kg/day. In a recent report by Bedaiwy et al (2001), embryotoxicity was observed in
vitro in a mouse embryo model at the highest concentration of 100 µg/mL but not at 25 and 5
µg/mL, the latter concentration being similar to a maximum clinical serum level.
No study of potential for peri- and post-natal toxicity appears to have been performed.
Alogliptin combined with metformin
Fertility and early embryonic development and pre- and postnatal development studies were
conducted with alogliptin alone and fertility studies were conducted with metformin alone; no
additional studies were conducted with alogliptin/metformin.
The range-finding embryo-fetal toxicity study was conducted in rats at doses of up to 100/2000
mg/kg/day (alogliptin/metformin). The 100/2000 mg/kg/day dose was lethal to all dams dosed and
1 of 6 dams administered 100/1000 mg/kg/day died. A decrease in the number of ossified
sacro-caudal vertebrae were noted in fetuses from dams administered doses of 100/500
mg/kg/day and 100/1000 mg/kg/day.
Based on the range-finding study, the highest dose evaluated in the definitive embryo-fetal
developmental toxicity study in rats was 100/500 mg/kg/day. In this study, 5 abnormal fetuses
were observed from dams administered 100/500 mg/kg/day (alogliptin/metformin). Four of the
fetuses were from a single litter: 3 of the 4 fetuses had microphthalmia and the 4th fetus had a
misshapen tail and absent sacral vertebra. The fifth fetus, from a second litter, had multiple
abnormalities (microphthalmia, cleft palate, microglossia, and mandibular micrognathia). No
treatment-related fetal abnormalities occurred following concomitant treatment with 100/150
mg/kg/day alogliptin/metformin or when either alogliptin or metformin was administered alone.

CHMP assessment report
EMA/CHMP/207158/2013 Page 36/136
2.3.4.6. Toxicokinetic data
Alogliptin
Systemic exposure and maximum plasma concentrations increased generally more than
dose-proportional in rats and dogs, except at low doses (0.3 to 3 mg/kg) in dogs over which dose
range the kinetics were linear. This was observed both after single and repeated dosing to which
saturation of metabolic pathways may be contributing in these species. An increase in elimination
half-life and the less-than-dose-proportional increase in the exposure to M-I (and M-II) with
increasing alogliptin doses support the idea of saturable metabolism. In mice and monkeys,
exposure to alogliptin was generally dose-proportional where exposure to M-I was less than
dose-proportional.
The formation of the pharmacologically active metabolite M-I differed across the non-clinical
species: total 24-hour exposure to M-I was <3.2%, <34%, <85% and 13% of respective of
alogliptin exposure in mice, rats, dogs and monkeys, respectively, with decreasing M-I contribution
to total exposure with increasing dose. The formation of M-I is thus saturable. However, as M-I is
pharmacologically active with a similar mode of action as alogliptin, the systemic exposures of both
compounds need to be added up in the pre-clinical species for determining the total exposure to
active substance in vivo.
Metformin
Toxicokinetic data collected from a 13 weeks repeat dose toxicity study in rats showed no sex- or
duration-related differences in metformin plasma levels.
Alogliptin combined with metformin
Repeated concomitant treatment with alogliptin and metformin in rats for up to 13-weeks showed
that the toxicokinetics of neither compound was affected by combination treatment.
2.3.4.7. Local Tolerance
Alogliptin
A parenteral formulation of alogliptin in physiological saline was not hemolytic in human blood and
did not cause any macroscopic flocculation, precipitation, or coagulation in human plasma. A 2.5
mg/mL solution of alogliptin in physiological saline was well tolerated following IV or paravenous
injection to rabbits.
Metformin
No published data were available on the local tolerance of metformin. Given that metformin has
been approved for >50 years as an oral drug, ensuring that its toxicity in the human population has
been thoroughly characterized, and a nonclinical local tolerance study was considered not required.

CHMP assessment report
EMA/CHMP/207158/2013 Page 37/136
2.3.4.8. Other toxicity studies
2.3.4.8.1. Immunotoxicity
Alogliptin
Non-clinical studies assessing immunotoxicity, including in vitro assessments for immune function
and immunophenotyping of leukocyte populations, were not conducted with alogliptin. No evidence
of drug-induced immunosuppression or enhancement was seen in the non-clinical toxicity studies
with alogliptin.
2.3.4.8.2. Phototoxicity
Alogliptin
Although alogliptin has been shown to bind to melanin in the eyes of pigmented rats, it only has
minor or negligibly low absorbance in the ultraviolet B (UVB) range of 290 to 320 nm and the
ultraviolet A (UVA) range of 320 nm and longer, and single doses of up to 800 mg/kg (a dose that
exceeded the maximum-tolerated dose [MTD]) did not produce cutaneous phototoxicity in hairless
mice. The positive control (lomefloxacin HCl) produced the expected response (erythema, edema,
and flaking).
2.3.4.8.3. Dermal toxicity
Alogliptin
Repeated doses of up to 30 mg/kg/day administered to cynomolgus monkeys for 4 and 13
consecutive weeks did not produce alogliptin-related dermal toxicity. No alogliptin-related lesions
were seen histopathologically in sections of skin obtained from the thoracic region, tail, left fore-
and hindlimbs, left auricle, nasal area, and scrotum. The NOAEL was the highest dose evaluated (30
mg/kg/day). In the 13-week study, the mean AUC(0-24) at the NOAEL was 47 μg·hr/mL. This
plasma concentration provides an exposure margin of approximately 27-fold higher than the clinical
dose of 25 mg/day.
2.3.4.8.4. Dependence
Alogliptin
Abuse liability studies were not conducted with alogliptin. Although alogliptin inhibited naloxone
binding at nonselective opioid receptors in vitro in the rat cerebral cortex, it did not show any
binding affinity for human receptors typically associated with abuse potential. Additionally, no
noteworthy alogliptin-related effects on general behavior and activity were observed in rats at
doses of up to 300 mg/kg/day for 4 consecutive weeks.

CHMP assessment report
EMA/CHMP/207158/2013 Page 38/136
2.3.4.8.5. Metabolites
Alogliptin
When plasma profiles were evaluated, humans were primarily exposed to alogliptin and exposure to
M-I was minimal. The plasma metabolic profiles of mice, rats, dogs, and monkeys were broadly
similar to that of humans except that a very low level of M-II was found in dog plasma. Based on
current guidelines, both M-I and M-II are classified as minor human metabolites, since they account
for plasma levels of less than 10 percent of systemic exposure in humans. No extra toxicological
studies on metabolites have been performed.
2.3.4.8.6. Studies on impurities
Alogliptin
Impurities measured in the alogliptin drug substance and drug product are below the Qualification
Thresholds specified in ICH guidances Q3A and Q3B; therefore, toxicity studies with the individual
impurities are not required . The impurity profiles of alogliptin drug substance used in the pivotal
toxicity studies, and for alogliptin, pioglitazone, and metformin drug substances used in the pivotal
combination toxicity studies were comparable to the impurity profiles for the drug substances used
in the clinical formulations.
Metformin/Alogliptin in combination with metformin
The impurity profiles of alogliptin drug substance and metformin drug substance used in the pivotal
combination toxicity studies were comparable to the impurity profiles for the drug substances used
in the clinical formulations.
2.3.5. Ecotoxicity/environmental risk assessment
2.3.5.1. Phase I
The applicant has submitted an ERA for Vipdomet (alogliptin/ metformin fixed dose combination).
Alogliptin is a dissociating molecule; the amine moiety is deprotonated at a pKa of 8.5. The
molecule becomes predominantly neutral at pH values around 10 and higher. The pH metric method
was used to determine the apparent log P vs. pH profile. Log P is 0.6 at pH 10, 11 and 12. Hence,
log Kow of alogliptin is 0.6. This corresponds with a high water solubility (approx. 20 g/L) and a
QSAR estimate for log Kow of 0.9 (Biobyte's ClogP).
Need for PBT-assessment
Parameter Substance Study ID/GLP
Protocol Results Criteria Conclusion
Bioaccumulation alogliptin [1]/N pH metric method
log Kow 0.6 log Kow > 4.5
not B
Bioaccumulation metformin [1]/N pH metric method
log Kow -2.6 log Kow > 4.5
not B

CHMP assessment report
EMA/CHMP/207158/2013 Page 39/136
Based on the above results neither alogliptin nor metformin meet the screening criterion for the
bioaccumulation. It can be concluded that both alogliptin and metformin are not qualifying for PBT
(persistence, bioaccumulation, and toxicity) assessment.
Calculation of PECsurface water
DILUTIONWASTEW
FDOSEPEC
inhab
pen
SW
ai
DOSEai = 25 (mg alogliptin patient-1 d-1) DOSEai = 1560 (mg metformin patient-1 d-1)
Fpen = 0.01 (patient inh-1) WASTEWinhab = 200 (L inh-1 d-1)
DILUTION = 10 (–)
Vipdomet is indicated to improve glycaemic control in adult patients (≥ 18 years old) with type 2
diabetes mellitus. The recommended dose of is 25 mg alogliptin / 1700 mg metformin per patient,
to be taken daily.
The applicant has used the default Fpen of 0.01. The resulting PECsw is 0.125 µg/L and 7.8 µg
metformin/L. Based on these results a Phase II assessment was considered appropriate for both
compounds.
2.3.5.2. Phase II, Tier A
The applicant performed a phase II Tier A ERA for alogliptin. For metformin, no phase II ERA was
performed. The applicant justified no further assessment of metformin by the absence of increased
environmental exposure. Vipdomet is prescribed to patients already taking existing metformin
products which no longer provide adequate glycaemic control.
Alogliptin
The results of the phase II Tier A ERA for alogliptin are summarized in the below table.
Summary of main study results Substance (INN/Invented Name): alogliptin benzoate
CAS-number (if available): 850649-62-6
PBT screening Result Conclusion
Bioaccumulation potential – log Kow
pH metric method 0.6 Potential PBT: N
PBT-assessment
Parameter Result relevant for conclusion
Conclusion
Bioaccumulation log Kow 0.6 not B
Persistence ready biodegradability
not readily biodegradable
DT50water DT50sediment
DT50system
1.8 and 6.9 d at 20°C > 100 d at 20°C > 100 d at 20°C
P
Toxicity NOEC algae NOEC Daphnia NOEC fish
56 mg/L ≥ 10 mg/L ≥ 10 mg/L
CMR not CMR not T

CHMP assessment report
EMA/CHMP/207158/2013 Page 40/136
PBT-statement The compound is considered not PBT, not vPvB
Phase I
Calculation Value Unit Conclusion
PEC surfacewater , default or refined (e.g. prevalence, literature)
0.125 µg/L > 0.01 threshold
Other concerns (e.g. chemical class)
not investigated (Y/N)
Phase II Physical-chemical properties and fate
Study type Test protocol Results Remarks
Adsorption-Desorption OECD 106 Koc = 25.2 and 18.7 L/kg two sludges
OECD 106 PM
Ready Biodegradability Test OECD 301 not readily biodegradable
Aerobic and Anaerobic Transformation in Aquatic Sediment systems
OECD 308 DT50, water = 1.8 and 6.9 d DT50, sediment = >100 d DT50, whole system = >100 d % shifting to sediment = 84 and 86%
all values determined at 20°C
Phase IIa Effect studies
Study type Test protocol Endpoint value Unit Remarks
Algae, Growth Inhibition Test / P. subcapitata
OECD 201 NOEC EC10
56 67
mg/L mg/L
growth rate
Daphnia sp. Reproduction Test OECD 211 NOEC ≥ 10 µg/L survival, reproduction, growth
Fish, Early Life Stage Toxicity Test / P. promelas
OECD 210 NOEC ≥ 10 mg/L egg survival, embryo development, hatching survival, growth
Activated Sludge, Respiration Inhibition Test
OECD 209 NOEC ≥ 73.5 mg/L
Sediment dwelling organisms/ Species
OECD 218 PM PM PM
Alogliptin has a Kow value below the trigger for an assessment of the potential for bioconcentration.
A risk assessment for the soil compartment was not triggered as Koc, sludge <10,000 L/kg.
Since >10% of alogliptin shifted to sediment in the water/sediment simulation study, a Phase IIB
assessment was triggered. However, alogliptin is not very toxic to aquatic organisms and based on
the PECsediment and PNECsediment values derived from the equilibrium partitioning method the
PECsediment/PNECsediment ratio indicates alogliptin is unlikely to represent a risk to the sediment
compartment.
In conclusion alogliptin poses an acceptable risk to sewage treatment facilities, all standard surface
water species and groundwater.
Metformin
No increased environmental exposure of metformin hydrochloride is expected based on the use
pattern of Vipdomet. Therefore, no toxicity data for metformin were provided. Metformin does not
meet the bioaccumulation criterion and is neither PBT, nor vPvB.

CHMP assessment report
EMA/CHMP/207158/2013 Page 41/136
2.3.6. Discussion on non-clinical aspects
2.3.6.1. Pharmacology
Alogliptin
The primary pharmacodynamics of alogliptin is well characterised. Alogliptin is shown to be a
selective and potent DDP4-inhibitor, as compared to the first gliptins on the market, sitagliptin and
vildagliptin. The R-isomer is the active one as the S-isomer is 1000-times less active. From the
metabolites the M-I is also showing activity. From a pharmacodynamic point of view (DPP4
inhibition) the duration of action is relatively long, e.g. in monkeys is lasting at least 24 hours, which
suggests that a once-day administration in humans might be sufficient.
Not only the primary effect DPP4 inhibition has been shown in vivo, but also the resulting
physiological consequences such as enhancement of GLP-1, and increase of insulin, and the
decrease of glucose after a glucose infusion, supporting the use of alogliptin as an antidiabetic drug.
The nonclinical data do not suggest any clinically relevant effects of alogliptin on immunological
parameters in healthy animals.
From a safety point of view there are no concerns about the secondary pharmacology or on the
safety pharmacology. Over a wide range of receptors and enzymes alogliptin appears to be a
specific DPP4 inhibitor.
Combination pharmacodynamic studies confirmed the additive and/or synergistic effects of
concomitant treatment with alogliptin and pioglitazone, alogliptin and metformin, alogliptin and
glibenclamide, and alogliptin and voglibose.
Metformin
Effects of metformin on glucose involve suppression of hepatic glucose output, increased peripheral
glucose utilization, reduced fatty acid utilization, and increased glucose turnover. In addition,
metformin alters glucose handling by erythrocytes and reduces hypertriglyceridemia. The primary
route is via decreased hepatic glucose production (gluconeogenesis). Metformin increased
insulin-stimulated glucose utilization, mainly in skeletal muscle, under conditions of
hyperglycaemia and/or insulin resistance. Metformin reduces the rate of fatty acid oxidation which
correlates approximately with suppression of hepatic glucose production; this suggests that
reduced fatty acid oxidation contributes to reduce gluconeogenesis. At the cellular level, metformin
increases the functional activity of glucose transporters (GLUT-1 and GLUT-4) and influences
membrane events affecting tyrosine kinase activity that leads to the augmentation of a range of
insulin signals. The glucose lowering effect of metformin has been demonstrated in STZ-induced
diabetic mice, normal and mildly hyperglycaemic rats, insulin-resistant Zucker rats, and normal
dogs. Metformin appears to possess potentially beneficial vascular properties, in addition to an
effect on serum lipid profiles.

CHMP assessment report
EMA/CHMP/207158/2013 Page 42/136
Alogliptin in combination with metformin
In combination with metformin, alogliptin has a superior, additive effect on glycaemic control
compared to the respective monotherapies.
2.3.6.2. Pharmacokinetics
Alogliptin
Kinetics of alogliptin was well investigated by the applicant.
Alogliptin has two enantiomers of which the [R]-enantiomer is clinically relevant. Chiral conversion
into the [S]-enantiomer hardly occurs.
Alogliptin was well absorbed, with the jejunal loop being one of the major absorption sites, in the
non-clinical species following oral dosing. Absorption into the lymphatic circulation hardly occurs.
Oral bioavailability was moderate to high and differed across species.
Kinetics of alogliptin was generally linear in mouse and monkeys and in dogs in the dose range 0.3
to 3 mg/kg. In rats and at higher doses in dogs, kinetics were more than dose-proportional caused
by saturation of metabolic pathways. In line with this, exposure to M-I displayed less than
dose-proportional kinetics and its formation decreased with increasing alogliptin doses in all
species.
Alogliptin is moderately bound to plasma proteins (<60%) and widely distributed among tissues,
including passage over the blood testes barrier and placenta, as is expected by a high volume of
distribution.
Metabolism: Identification of the metabolites showed that alogliptin is considered to be
biotransformed to M-I by N-demethylation, and to M-II by acetylation of the amino group. Alogliptin
and M-I are the major circulating components in dog plasma at dosages of 10 mg/kg and higher.
Alogliptin is excreted in milk from lactating rats and mainly present as unchanged parent and M-I.
Elimination of alogliptin in rats and dogs is both by hepatic clearance and renal clearance.
Enterohepatic circulation is also possible.
Interactions: CYPs 2D6 and 3A4/5 were inhibited in vitro by alogliptin via direct inhibition and
metabolism-dependent inhibition, respectively, but at concentrations much higher than the clinical
Cmax. CYP induction by alogliptin is not found in vitro or in vivo.
In humans, alogliptin is mainly eliminated by the kidneys with some evidence of activerenal
secretion. Therefore, the main focus of the in vitro transporter studies was in the transporters
associated with renal clearance.
The applicant investigated if alogliptin is an in vitro inhibitor of OAT1, OAT3 and OCT2. The study
included both control cells and cells transfected with the specific transporter of interest. Further, the
used probe substrates (PAH, E3S and metformin) and positive control inhibitors (probenecid,
probenecid and quinidine) are appropriate. No clinically relevant inhibition by alogliptin (based on
its Cmax of 0.3 µM) was seen for any of the investigated transporters.

CHMP assessment report
EMA/CHMP/207158/2013 Page 43/136
Alogliptin was not an in vitro inhibitor of BCRP at clinically relevant concentrations 12 µM (= 50 ×
Cmax,unbound = 50 × 0.24 µM = 12 µM) and 29.5 µM (=0.1 × dose/250 mL = 0.1 × 25 mg/250
mL = 10 µg/mL = 29.5 µM) for liver and intestinal transporter concentrations, respectively.
Therefore, clinically relevant interactions via BCRP inhibition by alogliptin are not expected.
No in vitro studies were performed with MATE and OATP. Additional clinical studies investigating the
interaction potential of alogliptin have been performed and discussed in the clinical pharmacology
section of this report.
Pregnancy may have an influence on alogliptin and M-I exposure as a result of saturated alogliptin
and M-I absorption, an increase in distribution volume and/or differences in elimination.
Toxicokinetics in juvenile rats were not different compared to kinetics in adult rats. However, using
healthy juvenile rats may not be representative for the human situation as it may be expected that
T2DM is mainly present in obese children.
Co-administration with pioglitazone or metformin did not result in significant or clinically relevant
alterations in pharmacokinetics of alogliptin, pioglitazone or metformin. Combinations with
sulphonylurea, insulin or triple therapies were not investigated in the non-clinical species.
Metformin
The pharmacokinetic properties of methformin hydrochloride are well known. As metformin
hydrochloride is a widely used, well-known active substance, the applicant has not provided
additional studies and further studies are not required. Overview based on literature review is
considered sufficient.
Alogliptin in combination with metformin
When alogliptin and metformin are administered concomitantly, there are no direct interactions
expected on the distribution and metabolism level.
The effect of co-administration of alogliptin and metformin on the absorption kinetics of both
compounds could not be assessed as limited information is present about the involvement of
transporters in absorption, which is inevitable in this case as the rat model is not a good predictive
model since the absorption and elimination kinetics are too different from those in humans.
However, clinically there are no indications of interactions regarding absorption and bioavailability.
2.3.6.3. Toxicology
Alogliptin
Acute and repeat-dose toxicity studies showed a very low toxicity of alogliptin in mice, rats, dogs
and monkeys, with very high safety margins of 50-200 fold. Alogliptin-related toxicity occurred in
rats at doses of ≥ 900 mg/kg/day and the findings were generally limited to the physical
appearance of the animals and were frequently associated with decreases in body weight.
Alogliptin-related histopathologic findings were noted in the liver, kidneys, and urinary bladder. In
dogs, occasional and transient occurrences of reddened ears and facial swelling, without

CHMP assessment report
EMA/CHMP/207158/2013 Page 44/136
histopathologic changes, were observed at doses of 30 mg/kg/day and higher. Although these
effects remain unexplained, and a treatment-related effect cannot be ruled out, the transient
nature of these findings and the lack of adaptive changes in any organs, suggest this may be an
allergic reaction. This is not likely to be relevant for humans. Decreased food consumption and body
weight gain occurred at 200 mg/kg/day only in the early weeks of the 39-week study. However,
these effects on body weight did not adversely affect clinical pathology, organ weights, or
histopathologic results.
Combination treatment with alogliptin and pioglitazone for up to 13 consecutive weeks did not
produce unanticipated toxicities, and did not exacerbate any pioglitazone-related findings.
Repeat-dose toxicity studies with alogliptin and metformin in rats for up to 13-weeks slightly
augmented metformin-related effects on plasma lactic acid levels and increased the incidence of
metformin-related effects in the adrenal gland, liver, heart, and submandibular gland (males),
although it did not affect the severity of the changes. Because these differences were shown only at
the combination of alogliptin with the high dose of 1000 mg/kg metformin, this is probably not of
clinical relevance.
Alogliptin is not genotoxic and not clearly carcinogenic in rodent models. The finding of a low
magnitude of an increased incidence of malignant lymphoma in female mice, commonly found in
mice, and the lack of a clear immunological effect at lower dose levels, is considered most likely not
relevant for humans and the clinical situation. A low potency of alogliptin in inducing C-cell tumours
seen in the rat carcinogenicity study is likely not clinically relevant. A minimal to mild simple
transitional cell hyperplasia in the urinary bladder was noted in male rats at 27-fold higher than the
intended human exposure. Since no threshold has been defined for the possible induction of cell
hyperplasia in the urinary bladder by alogliptin and bladder cancer has been confirmed to be
associated with pioglitazone, possibly via a similar non-genotoxic mechanism, an interaction
between alogliptin and pioglitazone cannot be excluded.
In reproduction and developmental toxicity studies alogliptin showed at the highest tested dose an
increase in abnormal sperm, but fertility was not affected. The major developmental toxicity seen
was most likely secondary to maternal toxicity. In the pre-postnatal toxicity study, effects on body
weight and neuro-behavioral development appeared to be long-lasting. Exposure at the NOAEL
levels was sufficiently above the clinical exposure. No juvenile toxicity was seen in rats, however in
these studies the highest dose was at the level of the NOEL in the other studies. Embryo-foetal
developmental toxicity studies in rats were also done with the combination of alogliptin with
pioglitazone and alogliptin with metformin. The combination with pioglitazone only showed a slight
potentiation of foetal growth inhibition.
Based on the presented data the CHMP can conclude that alogliptin did not show any local tolerance
effects, no phototoxicity, and in monkeys no dermal toxicity.
No dedicated studies to investigate the imunotoxicity or dependence of alogliptin have been
performed. The CHMP considers that no such studies are warranted since no imunological signals
have been revealed in the extended non-clinical program and alogliptin did not show any binding
affinity for human receptors typically associated with abuse potential.

CHMP assessment report
EMA/CHMP/207158/2013 Page 45/136
Metformin
The acute toxicity of metformin in mice, rats, rabbits, and guinea pigs is very low. Repeated
exposure for 13 weeks in rats resulted in decreased body weights in males at ≥ 600 mg/kg/day and
mortality at ≥ 900 mg/kg/day. Increased serum lactate and β-hydroxybutyric acid and decreased
serum bicarbonate and urine pH occurred at ≥ 600 mg/kg/day. There was an increased incidence
of minimal necrosis with minimal to slight inflammation of the parotid salivary gland in males at
1200 mg/kg/day. The NOAEL was 200 mg/kg/day. Toxicokinetic data showed no sex- or
duration-related differences in metformin plasma levels.
No toxic effects were observed in the liver, kidneys, spleen, adrenal glands, or bone marrow after
administration of metformin for 12 months or longer to rats (10 mg/kg/day orally), rabbits (10 to
50 mg/kg/day SC or up to 100 mg/kg/day orally), or dogs (50 mg/kg/day SC). No abnormalities
were noted in dogs dosed at 50 mg/kg/day SC for 2 years.
Metformin showed no genotoxicity or carcinogenicity.
Metformin showed no effects on fertility in rats, and was not teratogenic in rats and rabbits at high
dose. Embryotoxicity was observed in vitro in a mouse embryo model only at the highest
concentration of 100 µg/mL.
Alogliptin in combination with metformin
Repeat-dose toxicity studies with alogliptin combined with metformin in rats for up to 13-weeks
slightly augmented metformin-related effects on plasma lactic acid levels and increased the
incidence of metformin-related effects in the adrenal gland, liver, heart, and submandibular gland
(males), although it did not affect the severity of the changes. Because these differences were
shown only at the combination of alogliptin with the high dose of 1000 mg/kg metformin, this is
probably not of clinical relevance. The combination with metformin revealed teratogenic potential in
small numbers of foetuses (microphthalmia, small eye bulge and cleft palate) at high doses.
2.3.6.4. Ecotoxicity/environmental risk assessment
Alogliptin
The alogliptin PECsw value of 0.125 µg/L warranted a Phase II ERA assessment.
A risk assessment for the soil compartment was not triggered as Koc, sludge <10,000 L/kg.
However, the EMA guideline requests determination of adsorption constants in three soils and two
sludges. The applicant submitted a study with adsorption data for two sludges only. Since a Phase
IIB assessment is to be performed, adsorption data determined in soil (or sediment) should be
investigated.
Since >10% of alogliptin shifted to sediment in the water/sediment simulation study, a Phase IIB
assessment was triggered. The applicant has performed a Phase IIB assessment using the PNECsw.
This is not in accordance with the EMA guidance. A toxicity study with a sediment dwelling organism
should be performed.

CHMP assessment report
EMA/CHMP/207158/2013 Page 46/136
In addition, the applicant only provided summarized log Kow data published in literature of low
quality. The Q&A document (EMA/CHMP/SWP/44609/2010) states that the log Kow should be
determined experimentally and that a calculated value is generally not acceptable. Therefore the
applicant is recommended to perform and submit the results of a Kow study.
As a result of the above considerations, the available data do not allow to conclude definitively on
the potential risk of alogliptin to the environment. The CHMP considers that the disposal instructions
given in the PL and SmPC are appropriate.
In the context of the obligation of the MAH to take due account of technical and scientific progress,
the CHMP recommends the following studies to be performed:
an OECD 106 study determining the adsorption constants in three soils (or sediments)
a toxicity study with a sediment dwelling organism (OECD 218). Although alogliptin has a
relatively high water solubility, the applicant is recommended to perform an OECD 218
(sediment spiked) study. This study results in mg/kg concentrations, which are needed in the
sediment risk assessment and moreover, the OECD 308 study demonstrated that shifting of
alogliptin to sediment occurred both rapidly and in substantial amounts. The results of the
effect study with the sediment dwelling organism should be compared to the PECsediment.
a Kow study for alogliptin
Metformin
Metformin does not meet the bioaccumulation criterion and is neither PBT, nor vPvB. For metformin,
no phase II ERA was performed. The applicant justified no further assessment of metformin by the
absence of increased environmental exposure, justification that was considered acceptable by the
CHMP. It can be concluded that no increased environmental exposure of metformin hydrochloride is
expected based on the use pattern of Vipdomet.
2.3.7. Conclusion on the non-clinical aspects
The applicant has investigated the non-clinical properties of alogliptin and metformin sufficiently
to support the indication applied for. From a non-clinical point of view the application is
approvable.
The CHMP recommends the following studies to be performed in order to fully investigate the
potential risk of alogliptin to the environment:
an OECD 106 study determining the adsorption constants in three soils (or sediments)
a toxicity study with a sediment dwelling organism (OECD 218). Although alogliptin has a
relatively high water solubility, the applicant is recommended to perform an OECD 218
(sediment spiked) study. This study results in mg/kg concentrations, which are needed in the
sediment risk assessment and moreover, the OECD 308 study demonstrated that shifting of
alogliptin to sediment occurred both rapidly and in substantial amounts. The results of the
effect study with the sediment dwelling organism should be compared to the PECsediment.
a Kow study for aloglitin

CHMP assessment report
EMA/CHMP/207158/2013 Page 47/136
2.4. Clinical aspects
2.4.1. Introduction
GCP
The Clinical trials were performed in accordance with GCP as claimed by the applicant
The applicant has provided a statement to the effect that clinical trials conducted outside the
community were carried out in accordance with the ethical standards of Directive 2001/20/EC.
The clinical pharmacology program for alogliptin consisted of 28 studies (Table 1).
Twenty-two of the 28 clinical pharmacology studies were conducted in the United States (US) only,
and 6 were conducted in Japan. In addition, population pharmacokinetics was evaluated in a Phase
III efficacy and safety study that was conducted in 15 countries including those in the European
Union (EU).
Single oral doses from 6.25 to 800 mg and multiple oral doses from 25 to 400 mg were evaluated.
All doses of study drug (active or placebo) were administered orally with the exception of an
intravenous (IV) dose in the absolute bioavailability study. All subjects who participated in the
clinical program were at least 18 years of age.
The clinical development program for alogliptin examined the use of alogliptin in monotherapy and
in combination use with 4 major classes of antidiabetic agents: (1) MET (2) SU, (3) TZD, and (4)
insulin. The efficacy of alogliptin has been evaluated in 15 studies: 1 phase 2 dose-ranging study,
7 main Phase III studies, and 7 supportive Phase III studies (Table 2).
Metformin is a well-established drug that has been used extensively in the EU for many years in the
T2DM patient population. The lowest and highest metformin doses used in clinical trials were 500
and 1000 mg; however, based on European clinical practice, an FDC containing metformin 850 mg
is proposed.
In clinical trials, alogliptin plus metformin has been evaluated as the alogliptin/metformin FDC
tablet (phase I) or concomitantly as individual tablets (phase III).
The clinical pharmacology program for the FDC alogliptin/metformin comprises 2 new
bioequivalence studies (322MET-101 and 322MET-103) and 1 new food-effect study (322MET-102).
Furthermore, the program is supported by 1 drug interaction study with alogliptin and metformin
(005), and 1 pharmacokinetic study that assessed once daily vs BID dosing (101) which were also
included in the alogliptin program (Table 3).
Additionally, the applicant provided a literature based overview of the pharmacokinetics of
metformin.
The clinical development program for alogliptin/metformin examined the use of alogliptin in
combination with metformin, with insulin, and with metformin and TZD. The efficacy of the
combination has been evaluated in 5 main Phase III studies and 2 supportive Phase III studies
(Table 4).
Tabular overview of clinical studies

CHMP assessment report
EMA/CHMP/207158/2013 Page 48/136
Table 1 Overview of Alogliptin Phase 1 and 2 Clinical Pharmacology Studies
Study Number (Country) Description (a)
Single-Dose Studies
014 (US) ADME (mass balance)
103 (US) Absolute bioavailability
027 (US) Bioequivalence of Phase III clinical supply and proposed commercial formulations
001 and 001 Addendum (US) Ascending dose: pharmacokinetics and pharmacodynamics
CPH-001 (Japan) Ascending dose: pharmacokinetics and pharmacodynamics
026 (US) Food effect on pharmacokinetics
CPH-006 (Japan) Food effect on pharmacokinetics
CPH-007 (Japan) Food effect on pharmacokinetics and pharmacodynamics
Multiple-Dose Studies
CPH-002 (Japan) Ascending dose: pharmacokinetics and pharmacodynamics
004 (US) QTc
019 (US) QTc
101 (US) Pharmacokinetics and pharmacodynamics of once daily vs BID dosing
002 (US) Ascending dose: pharmacokinetics and pharmacodynamics in subjects with T2DM
Effects of Intrinsic Factors
022 (US) Effect of age, race, and sex on pharmacokinetics and pharmacodynamics
CPH-003 (Japan) Effect of age on pharmacokinetics and pharmacodynamics
006 (US) Effect of renal impairment on pharmacokinetics
023 (US) Effect of hepatic impairment on pharmacokinetics
Effects of Extrinsic Factors (Drug-Interaction Studies)
Effect of Other Drugs on Alogliptin
016 (US) Fluconazole, ketoconazole, gemfibrozil
020 (US) Cyclosporine
CPH-004 (Japan) Voglibose
Effect of Alogliptin on Other Drugs
015 (US) Caffeine, tolbutamide, dextromethorphan, midazolam, fexofenadine (drug cocktail)
018 (US) Glyburide
021 (US) Warfarin
024 (US) Ethinyl estradiol and norethindrone
Effect of Other Drugs on Alogliptin and Effect of Alogliptin on Other Drugs
005 (US) Cimetidine and metformin (and food effect)
017 (US) Pioglitazone
025 (US) Atorvastatin
029 (US) Digoxin
Population Pharmacokinetics
008 Population PK Report
(multinational)
Population pharmacokinetic analysis in an efficacy and safety study of alogliptin in subjects
with T2DM (Phase III)
All subjects were healthy unless otherwise stated.
Table 2 Alogliptin Main and Supportive Phase III Studies by Indication
Indication Main Studies Supportive Studies
Add-on to MET 008, 305(a), 010 302, 322OPI-001

CHMP assessment report
EMA/CHMP/207158/2013 Page 49/136
Add-on to SU 007, 010
Add-on to TZD 009, 010 322OPI-002
Add-on to MET and TZD 009, 322OPI-004,
010
322OPI-001
Add-on to insulin (with or without MET) 011, 010
Other supportive studies (eg, special populations)
402, a CV outcomes study with high-risk CV subjects and varying degrees of renal impairment (a);
303, elderly subjects; 012, long-term OLE; and 301, postprandial lipids
(a) Study is ongoing; interim results are presented in this document.

CHMP assessment report
EMA/CHMP/207158/2013 Page 50/136
Table 3 Clinical Pharmacology Studies: Alogliptin/Metformin
Table 4 Alogliptin/Metformin Main and Supportive Phase III Studies by Indication
2.4.2. Pharmacokinetics
2.4.2.1. Pharmacokinetics of alogliptin
With regard to the commercial tablets, four tablet strengths of alogliptin were developed: 3.125,
6.25, 12.5, and 25 mg. While the 3.125 mg dose strength was developed for the purpose of dose
reduction in patients with severe renal impairment, the 6.25 mg dose is being proposed for use in
patients with severe renal impairment/ end-stage renal disease (ESRD); the 12.5 mg dose strength
is for patients with moderate renal impairment; the registration of the 3.125 mg tablet strength is
not being sought. During the procedure, the applicant withdrew its application for the 6.25 mg+850
mg, 6.25 mg+1000 mg strengths.
Four formulations of alogliptin were used in the clinical program. The formulation of the Phase III
tablet that was used in the main studies and the proposed commercial tablet differed substantially.
Bioequivalence between the alogliptin Phase III and proposed commercial tablets was established
for both the 12.5 and 25 mg tablets (90% CI within the 80%-125% range). Additionally the lower
commercial tablet strengths had the same dissolution profile as the 12.5 and 25 mg tablet
strengths.
2.4.2.1.1. Absorption
Alogliptin is absorbed rapidly with median time to reach Cmax (Tmax) occurring approximately 1-2
hours after single and multiple dosing. Food does not alter the pharmacokinetics of alogliptin. The
absolute bioavailability of alogliptin is close to 100%. Therefore, alogliptin is considered to be highly
permeable. This is confirmed by the mass balance study in which at least 76% of the (radioactivity)
is recovered in urine.

CHMP assessment report
EMA/CHMP/207158/2013 Page 51/136
2.4.2.1.2. Distribution
Protein binding of alogliptin was approximately 20% and was unaffected by renal impairment.
Protein binding of M-I ranges from 12-32%. The volume of distribution (Vz) of alogliptin following a
12.5 mg IV dose was 417 L. The Vz was greater than total body water (42 L), which indicates that
alogliptin is well distributed into tissues. The apparent volume of distribution (Vz/F) at steady state
was 300 L at a dose of 25 mg alogliptin administered once daily for 14 days in patients with T2DM.
2.4.2.1.3. Elimination
The overall mean recovery of radioactivity in urine + faeces was 88.5 %. Approximately 76% of
orally administered radioactivity was excreted in urine. This confirms that the extent of oral
absorption in humans is high (at least 76%), and that alogliptin is moderately to highly permeable.
Metabolism represents only a small part of the elimination of alogliptin; 95% of the radioactivity
recovered in urine and 88% of the radioactivity recovered in faeces was alogliptin. The clearance
(CL) of alogliptin following the 12.5 mg IV dose was 14 L/hr. CL/F ranges between 15- 20 L/hr.
2.4.2.1.4. Metabolism
Alogliptin is metabolized into 2 identified minor metabolites: M-I, an N-demethylated metabolite via
CYP2D6, and M-II, an N-acetylated metabolite. CYP3A4 may also be involved in the formation of
other unidentified minor metabolites. Exposure to these 2 metabolites in plasma, relative to
unchanged drug, are < 1% and < 6%, respectively. M-I has DPP-4 inhibitory activity similar to that
of alogliptin; M-II has no DPP-4 inhibitory activity.
Alogliptin exists predominantly as the (R)-enantiomer (> 99%) and undergoes little or no
enantiomeric conversion to the (S)-enantiomer in vivo. The (R)-enantiomer is the active moiety,
and is > 150-fold more active against DPP-4 than the (S) enantiomer. Therefore, inter-conversion
has no clinical implications.
2.4.2.1.5. Dose proportionality and time dependencies
Dose proportionality has been established across the dose range of 6.25 to 800 mg. Steady state
is achieved after 7 days. Accumulation was ~1.4 fold.
The intersubject variability of alogliptin ranged for the Cmax and AUC between 17-31%. The
intrasubject variability was (<23% for Cmax and AUC values).
Exposure to alogliptin is similar in subjects with T2DM and healthy subjects.
2.4.2.1.6. Special populations
Renal impairment
Exposure to alogliptin increased with increasing severity of renal impairment. Peak exposure
(Cmax) to alogliptin was approximately 13%, 42%, 27%, and 32% greater in subjects with mild,
moderate, and severe renal impairment, and subjects with ESRD, respectively, than in healthy

CHMP assessment report
EMA/CHMP/207158/2013 Page 52/136
subjects. Total exposure (AUC(0-inf) to alogliptin in subjects with renal impairment increased with
decreases in renal function, and was approximately 71%, 112%, 251%, and 377% greater in
subjects with mild, moderate, and severe renal impairment, and ESRD, respectively, than in
healthy subjects. No significant differences in Tmax for any of the renal impairment groups vs the
healthy matched controls for each group were observed. Metabolic ratios of alogliptin to M-I in
healthy subjects and in subjects with severe renal impairment or ESRD were similar.
Hepatic impairment
No clinical significant differences in AUC and peak Cmax exposure to alogliptin was observed in
subjects with moderate hepatic impairment than in healthy subjects; therefore, no dose
adjustment is necessary for patients with mild to moderate hepatic impairment (Classes A and B).
Subjects with severe hepatic impairment were not evaluated.
Gender and weight
No clinically meaningful changes in exposure related to gender, and weight were observed.
Therefore, no dose adjustment is required.
Age and race
Small increases in exposure related to age and race were observed, the AUC was about 30%
increased after multiple doses.
2.4.2.1.7. Pharmacokinetic interaction studies
In vitro results: Alogliptin did not induce CYP1A2, CYP2B6, CYP2C9, and CYP2C19 in vitro. Little or
no direct inhibition was observed for CYP isoforms (CYP1A2, CYP2C8, CYP2C9, CYP2C19,
CYP3A4/5) in vitro.
Alogliptin was not an in vitro inhibitor of BCRP, OAT1, OAT3 and OCT2 at clinically relevant
concentrations. Therefore, clinically relevant interactions via BCRP, OAT1, OAT3 and OCT2
inhibition by alogliptin are not expected.
Clinical results: Clinical alogliptin drug-drug interaction studies of digoxin (a substrate of
P-glycoprotein [P-gp]) and cyclosporine (an inhibitor of P-gp) confirmed that alogliptin is neither a
substrate of P-gp, nor an inhibitor of P-gp.
It can be concluded that at clinically relevant concentrations (Cmax = 0.3 µM), alogliptin is not a
substrate or inhibitor of P glycoprotein, OAT1, OAT3, and OCT2.
A clinical study was performed to study the interaction potential between alogliptin and cyclosporine
(inhibitor of OATP1B1/OATP1B3, BCRP and P-glycoprotein). No clinically relevant interactions were
observed. In addition, OATP is involved in the transport from the systemic circulation to the liver
based on the in vivo excretion pattern most likely not relevant. However, alogliptin is mainly

CHMP assessment report
EMA/CHMP/207158/2013 Page 53/136
excreted as parent compound via urine and BCRP transporters are involved in the transport to
urine. Based on the provided clinical data it cannot be concluded that alogliptin is not an inhibitor of
BCRP. Since, the bioavailability of alogliptin is high, no clinically relevant changes in alogliptin
exposure are expected if alogliptin was a substrate of BCRP and it was concomitantly administered
with a drug that is an inhibitor of BCRP. In addition, since excretion via faeces is <15%, it will be
unlikely that an inhibitor of BCRP could have an effect on the excretion of alogliptin if alogliptin
would be a substrate of BCRP.
Whether alogliptin is a substrate and/or an inhibitor of OCT1, OCT2, MATE1 and MATE2 was
investigated in a clinical study in healthy volunteers with cimetidine and metformin. Cimetidine is an
inhibitor of OCT1, OCT2, MATE1 and MATE2. Metformin is a substrate of OCT1, OCT2, MATE1 and
MATE 2. No clinically relevant effects were observed on the exposure of alogliptin, cimetidine and
metformin. Therefore, no clinically relevant drug-drug interactions are expected for alogliptin as
either a substrate or as an inhibitor of OCT1, OCT2, MATE1 and MATE2 at current exposure levels
(dose up to 100 mg once daily).
Alogliptin and co-administrated drugs were dosed together in the studies. Based on the data
presented there is no obvious effect of alogliptin on the tmax and subsequently on the gastric
emptying of the drugs coadministrated with alogliptin.
No clinically meaningful changes in exposure to a number of drugs that are metabolized by CYP
isozymes (pioglitazone [2C8]; glyburide, tolbutamide and (S)-warfarin [2C9]; midazolam,
atorvastatin, ethinyl estradiol, and norethindrone [3A4]; caffeine and (R)-warfarin [1A2];
dextromethorphan [2D6]), transported by P-glycoprotein (Pgp) (fexofenadine and digoxin) or
organic cation transporter 2 (OCT2) (MET), or drugs that are excreted unchanged in urine (MET,
cimetidine [an OCT2 inhibitor], and digoxin) were observed when these drugs were administered
with alogliptin.
In addition, no clinically meaningful changes in exposure to alogliptin were observed when it was
administered with MET, cimetidine, or digoxin (drugs that are excreted renally), pioglitazone (a 2C8
substrate), or atorvastatin (a 3A4 substrate); with drugs that inhibit CYP isozymes (ketoconazole
[3A4], fluconazole [2C9], and gemfibrozil [2C8/9]); with Pgp or OCT2 substrates (digoxin [Pgp],
MET [OCT2]) or inhibitors (cyclosporine [Pgp], cimetidine [OCT2]); or with a drug that is excreted
primarily in the feces (voglibose [an α-glucosidase inhibitor]). In general, alogliptin seems to have
a low potential for interactions with co-administered medicinal products.
2.4.2.2. Pharmacokinetics of metformin
The applicant provided an overview of the pharmacokinetics of metformin based on literature data.
A summary is provided below. The results are in line with the SmPC of metformin. This approach is
acceptable as metformin is a well characterized drug that has been used extensively in the EU for
many years.
2.4.2.2.1. Absorption
The Tmax of metformin is reached in approximately 2.5 hours after an oral dose of metformin HCl.
Absolute bioavailability of a 500 or 850 mg metformin HCl tablet is approximately 50% to 60% in
healthy subjects. The non-absorbed fraction recovered in feces after an oral dose was 20% to 30%.

CHMP assessment report
EMA/CHMP/207158/2013 Page 54/136
Metformin absorption is saturable and incomplete after oral administration. It is assumed that the
pharmacokinetics of metformin absorption is non-linear.
At the usual metformin HCl doses and dosing schedules, steady state plasma concentrations are
reached within 24 to 48 hours and are generally <1 µg/mL. Maximum metformin plasma levels
(Cmax) did not exceed 4 µg/mL in controlled clinical trials, even at maximal doses.
Food decreases the extent and slightly delays the absorption of metformin. Cmax was 40% lower,
AUC was 25% lower, and Tmax was prolonged by 35 minutes following oral administration of a
metformin 850 mg tablet with food than without food. The clinical relevance of these findings is
unknown. Nevertheless, to reduce undesirable gastrointestinal symptoms associated with
metformin, it is common clinical practice for metformin HCl to be given with or just after food.
2.4.2.2.2. Distribution
Plasma protein binding is negligible. Metformin partitions into erythrocytes. The blood peak is lower
than the plasma peak and appears at approximately the same time. The red blood cells most likely
represent a secondary compartment of distribution. The mean volume of distribution (Vd) ranged
from 63 to 276 L.
2.4.2.2.3. Elimination
Metformin is excreted unchanged in the urine. No metabolites have been identified in humans.
Renal clearance of metformin is > 400 mL/min, which is approximately 3 to 4 times greater than the
creatinine GFR; this indicates that metformin is eliminated by glomerular filtration and active
tubular secretion. The apparent T1/2 following an oral dose is approximately 6.5 hours. Renal
clearance decreases in proportion to creatinine clearance when renal function is impaired, thus the
T1/2 is prolonged, which leads to increased levels of metformin in plasma.
2.4.2.2.4. Special populations
Metformin is excreted by the kidney; therefore, serum creatinine levels should be determined
before initiating treatment with metformin HCl and regularly thereafter. Metformin is
contraindicated in patients with moderate to severe renal failure or renal dysfunction (e.g. serum
creatinine levels >135 µmol/L in male patients and > 110 µmol/L in female patients) or in patients
with acute conditions that may alter renal function (e.g. dehydration, severe infection, or shock)
due to the risk of lactic acidosis.
Because of the potential for decreased renal function in elderly patients, metformin should be used
in this population as described in the paragraph above. In addition, special caution should be
exercised in situations where renal function may become impaired, such as when initiating
antihypertensive, diuretic, or NSAID therapy.
Metformin is contraindicated in patients with hepatic insufficiency due to the increased risk of lactic
acidosis.

CHMP assessment report
EMA/CHMP/207158/2013 Page 55/136
2.4.2.2.5. Pharmacokinetic interaction studies
The SmPC for metformin HCl contains the following recommendations for administration of
metformin HCl with alcohol, iodinated contrast agents, medicinal products with intrinsic
hyperglycaemic activity, and ACE inhibitors:
The risk of lactic acidosis is increased in acute alcohol intoxication, and consumption of alcohol and
alcohol-containing medications should be avoided.
Intravascular administration of iodinated contrast agents may lead to renal failure, resulting in
metformin accumulation and a risk of lactic acidosis; therefore, metformin therapy should be
discontinued prior to, or at the time of the test and not be reinstituted until 48 hours afterwards,
and only after renal function has been re-evaluated and found to be normal.
Glucocorticoids, β-2-agonists, and diuretics have intrinsic hyperglycemic activity; patients should
be informed and blood glucose should be monitored more frequently, especially at the beginning of
treatment and if necessary, the dose of metformin HCl should be adjusted during therapy with the
other medicinal product and upon its discontinuation.
Angiotensin-converting enzyme (ACE) inhibitors may decrease blood glucose levels; if necessary,
the dose of metformin HCl should be adjusted during therapy with the other drug and upon its
discontinuation.
2.4.2.3. Pharmacokinetics of alogliptin/metformin combination
In this Marketing Authorisation Application (MAA), Takeda seeks registration of
alogliptin/metformin at a dose of alogliptin 6.25 mg or 12.5 mg in combination with metformin 850
mg or 1000 mg for twice daily (BID) dosing in adults with T2DM.
The product is manufactured as immediate-release, oblong, biconvex, film-coated tablets for twice
daily oral administration.
Six dosage strengths of alogliptin/metformin (A6.25+M500, A6.25+M850, A6.25+M1000,
A12.5+M500, A12.5+M850, and A12.5+M1000) were developed. All 6 tablet strengths have a
bilayer structure and contain the same ingredients. The alogliptin and metformin layer are each
based on a dose proportional composition. Therefore the tablets are varying with size and weight as
are the relative amounts of mannitol, microcrystalline cellulose, and povidone.
Four tablet strengths are proposed for commercial use containing 6.25mg+850mg,
6.25mg+1000mg, 12.5mg+850mg and 12.5mg+1000mg of alogliptin and metformin
hydrochloride.
2.4.2.3.1. Bioequivalence studies
Six dosage strengths of alogliptin/metformin (A6.25+M500, A6.25+M850, A6.25+M1000,
A12.5+M500, A12.5+M850, and A12.5+M1000) were developed. In agreement with CHMP
scientific advice, a bracketing approach (evaluation of the highest and lowest dose strengths in
humans in vivo) in conjunction with in vitro comparative dissolution analysis of all 6 dose strengths
was used to evaluate the bioequivalence of the FDC tablets to individual alogliptin and EU-marketed
metformin HCl tablets. This analysis is consistent with recommendations in the EMA Guideline on

CHMP assessment report
EMA/CHMP/207158/2013 Page 56/136
the Investigation of Bioequivalence, January 2010. Two bioequivalence studies (322MET-101 and
322MET-103), were performed.
In study 322MET-103, the pivotal BE study, the developed combination tablets containing the
lowest and highest amount of metformin (500 mg and 1000 respectively) and the tablets containing
the lowest and highest amount of alogliptin (6.25 and 12.5 respectively) were compared with
individual corresponding alogliptin and metformin tablets.
Bioequivalence between the combination A6.25+M500, A6.25+M1000, A12.5+M500,
A12.5+M1000 combination tablets and corresponding individual tablets was shown (see tables 5, 6
and 7). In all cases the 90% CI of the AUC and Cmax was within the 80%-125% range. Therefore, it
can be considered that bioequivalence of the alogliptin/metformin 6.25 mg+1000 mg tablet and
12.5 mg+1000 mg tablet to individual alogliptin and metformin tablets were shown.
No identifiable effects on inter- or intra-subject variability in the pharmacokinetic parameters of
alogliptin or metformin due to administration of individual or FDC tablets, to different tablet
strengths, or to study design were observed.
A6.25+M500 tablet
The statistical analyses of the plasma pharmacokinetic parameters of alogliptin and metformin
following administration of an A6.25+M500 tablet and individual alogliptin 6.25 mg and metformin
HCl 500 mg tablets are presented in the table below.
Table 5. Statistical Comparison of the Plasma Pharmacokinetic Parameters of Alogliptin
and Metformin Following Administration of an A6.25+M500 Tablet and Individual Alogliptin 6.25 mg and Metformin HCl 500 mg Tablets: Study 322MET-103
Analyte
Parameter (units) N
Arithmetic Mean
Point Estimate·100
(90% CI) (a) A6.25+M500 (T)
Alogliptin 6.25 mg +
Metformin HCl 500 mg (R)
Alogliptin
AUC(0-tlqc) (ng∙hr/mL) 33 452.23 452.06 100.06 (97.47, 102.72)
AUC(0-inf) (ng∙hr/mL) 32 496.94 493.56 100.59 (98.22, 103.01)
Cmax (ng/mL) 33 28.86 30.75 94.74 (89.35, 100.46)
Tmax (hr) (b,c) 33 3.00 2.98 N/A
Metformin
AUC(0-tlqc) (ng∙hr/mL) 33 8608.38 8529.88 101.22 (95.93, 106.79)
AUC(0-inf) (ng∙hr/mL) 29 8763.13 8607.40 102.27 (96.66, 108.20)
Cmax (ng/mL) 33 1137.21 1163.94 98.78 (92.57, 105.39)
Tmax (hr) (b,d) 33 2.98 2.98 N/A
N/A=not applicable, T=test treatment, R=reference treatment.
(a) Point estimates (differences between the LS mean values for the test treatment and the reference treatment) and CIs were
calculated using natural log-transformed data and are presented as percentages.
(b) Tmax is presented as the median.
(c) p=0.332 for the mean Tmax values (original scale) for the test vs the reference treatment.
(d) p=0.723 for the mean Tmax values (original scale) for the test vs the reference treatment.
The 90% CIs for the point estimates of the ratios of the central values for the area under the plasma
concentration-time curve from time 0 to time of last quantifiable concentration (AUC(0 tlqc)), area
under the plasma concentration-time curve from time 0 to infinity (AUC(0 inf)), and maximum
observed plasma concentration (Cmax) values of both alogliptin and metformin were within the 80%
to 125% bioequivalence range. Therefore, the A6.25+M500 tablet met the standards for
bioequivalence to the individual alogliptin 6.25 mg and metformin HCl 500 mg tablets.

CHMP assessment report
EMA/CHMP/207158/2013 Page 57/136
No differences in the median Tmax values for either alogliptin or metformin were observed between
the A6.25+M500 tablet and the individual alogliptin 6.25 mg and metformin HCl 500 mg tablets.
A6.25+M1000 tablet
Table 6. Statistical Comparison of the Plasma Pharmacokinetic Parameters of Alogliptin and Metformin Following Administration of an A12.5+M500 Tablet and Individual Alogliptin 12.5 mg and Metformin HCl 500 mg Tablets: Study 322MET-103
Analyte
Parameter (units) N
Arithmetic Mean
Point Estimate·100
(90% CI) (a) A12.5+M500 (T)
Alogliptin 12.5 mg +
Metformin HCl 500 mg (R)
Alogliptin
AUC(0-tlqc) (ng∙hr/mL) 33 917.95 851.17 100.97 (99.15, 102.82)
AUC(0-inf) (ng∙hr/mL) 33 860.75 907.98 100.97 (99.22, 102.75)
Cmax (ng/mL) 33 61.01 60.22 101.98 (95.69, 108.69)
Tmax (hr) (b,c) 33 3.98 2.98 N/A
Metformin
AUC(0-tlqc) (ng∙hr/mL) 33 8698.77 8491.37 102.46 (97.91, 107.23)
AUC(0-inf) (ng∙hr/mL) 32 8885.81 8716.63 101.89 (97.65, 106.32)
Cmax (ng/mL) 33 1178.73 1136.58 103.07 (96.76, 109.79)
Tmax (hr) (b,d) 33 2.98 2.98 N/A
(a) Point estimates (differences between the LS mean values for the test treatment and the reference
treatment) and CIs were calculated using natural log-transformed data and are presented as percentages. (b) Tmax is presented as the median. (c) p=0.022 for the mean Tmax values (original scale) for the test vs the reference treatment. (d) p=0.512 for the mean Tmax values (original scale) for the test vs the reference treatment.
The 90% CIs for the point estimates of the ratios of the central values for the AUC(0-tlqc), AUC(0 inf),
and Cmax values of both alogliptin and metformin were within the 80% to 125% bioequivalence
range. Therefore, the A12.5+M500 tablet met the standards for bioequivalence to the individual
alogliptin 12.5 mg and metformin HCl 500 mg tablets.
No differences in the median Tmax values for either alogliptin or metformin were observed between
the A12.5+M500 tablet and the individual alogliptin 12.5 mg and metformin HCl 500 mg tablets.
A12.5+M1000 tablet
The statistical analyses of the plasma pharmacokinetic parameters of alogliptin and metformin
following administration of an A12.5+M1000 tablet and individual alogliptin 12.5 mg and metformin
HCl 1000 mg tablets are presented in the table below.
Table 7. Statistical Comparison of the Plasma Pharmacokinetic Parameters of Alogliptin and Metformin Following Administration of an A12.5+M1000 Tablet and Individual Alogliptin 12.5 mg and Metformin HCl 1000 mg Tablets: Study 322MET-103
Analyte
Parameter (units) N
Arithmetic Mean
Point Estimate·100
(90% CI) (a) A12.5+M1000 (T)
Alogliptin 12.5 mg +
Metformin HCl 1000 mg (R)
Alogliptin
AUC(0-tlqc) (ng∙hr/mL) 34 835.37 824.02 101.31 (99.51, 103.15)
AUC(0-inf) (ng∙hr/mL) 34 898.49 885.39 101.35 (99.61, 103.11)
Cmax (ng/mL) 34 57.99 59.12 98.62 (92.60, 105.04)
Tmax (hr) (b,c) 34 3.00 3.03 N/A
Metformin
AUC(0-tlqc) (ng∙hr/mL) 34 13503.52 13963.67 97.56 (93.27, 102.05)
AUC(0-inf) (ng∙hr/mL) 30 13974.16 14418.12 98.77 (94.53, 103.21)
Cmax (ng/mL) 34 1754.41 1888.97 94.09 (88.39, 100.16)
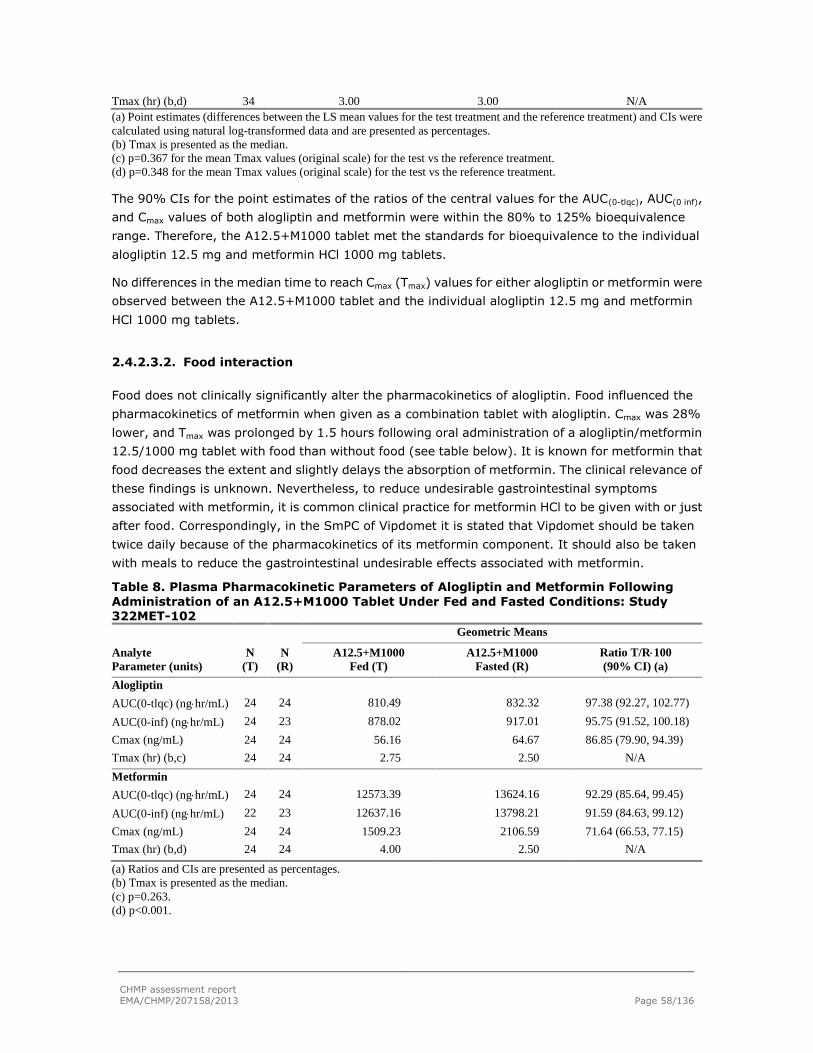
CHMP assessment report
EMA/CHMP/207158/2013 Page 58/136
Tmax (hr) (b,d) 34 3.00 3.00 N/A
(a) Point estimates (differences between the LS mean values for the test treatment and the reference treatment) and CIs were
calculated using natural log-transformed data and are presented as percentages.
(b) Tmax is presented as the median.
(c) p=0.367 for the mean Tmax values (original scale) for the test vs the reference treatment.
(d) p=0.348 for the mean Tmax values (original scale) for the test vs the reference treatment.
The 90% CIs for the point estimates of the ratios of the central values for the AUC(0-tlqc), AUC(0 inf),
and Cmax values of both alogliptin and metformin were within the 80% to 125% bioequivalence
range. Therefore, the A12.5+M1000 tablet met the standards for bioequivalence to the individual
alogliptin 12.5 mg and metformin HCl 1000 mg tablets.
No differences in the median time to reach Cmax (Tmax) values for either alogliptin or metformin were
observed between the A12.5+M1000 tablet and the individual alogliptin 12.5 mg and metformin
HCl 1000 mg tablets.
2.4.2.3.2. Food interaction
Food does not clinically significantly alter the pharmacokinetics of alogliptin. Food influenced the
pharmacokinetics of metformin when given as a combination tablet with alogliptin. Cmax was 28%
lower, and Tmax was prolonged by 1.5 hours following oral administration of a alogliptin/metformin
12.5/1000 mg tablet with food than without food (see table below). It is known for metformin that
food decreases the extent and slightly delays the absorption of metformin. The clinical relevance of
these findings is unknown. Nevertheless, to reduce undesirable gastrointestinal symptoms
associated with metformin, it is common clinical practice for metformin HCl to be given with or just
after food. Correspondingly, in the SmPC of Vipdomet it is stated that Vipdomet should be taken
twice daily because of the pharmacokinetics of its metformin component. It should also be taken
with meals to reduce the gastrointestinal undesirable effects associated with metformin.
Table 8. Plasma Pharmacokinetic Parameters of Alogliptin and Metformin Following
Administration of an A12.5+M1000 Tablet Under Fed and Fasted Conditions: Study 322MET-102
Analyte
Parameter (units)
N
(T)
N
(R)
Geometric Means
A12.5+M1000
Fed (T)
A12.5+M1000
Fasted (R)
Ratio T/R100
(90% CI) (a)
Alogliptin
AUC(0-tlqc) (nghr/mL) 24 24 810.49 832.32 97.38 (92.27, 102.77)
AUC(0-inf) (nghr/mL) 24 23 878.02 917.01 95.75 (91.52, 100.18)
Cmax (ng/mL) 24 24 56.16 64.67 86.85 (79.90, 94.39)
Tmax (hr) (b,c) 24 24 2.75 2.50 N/A
Metformin
AUC(0-tlqc) (nghr/mL) 24 24 12573.39 13624.16 92.29 (85.64, 99.45)
AUC(0-inf) (nghr/mL) 22 23 12637.16 13798.21 91.59 (84.63, 99.12)
Cmax (ng/mL) 24 24 1509.23 2106.59 71.64 (66.53, 77.15)
Tmax (hr) (b,d) 24 24 4.00 2.50 N/A
(a) Ratios and CIs are presented as percentages.
(b) Tmax is presented as the median.
(c) p=0.263.
(d) p<0.001.

CHMP assessment report
EMA/CHMP/207158/2013 Page 59/136
2.4.2.3.3. Posology - Once daily dosing vs twice daily dosing
Twice daily dosing compared with once daily dosing resulted in identical exposure (AUC) but
resulted in lower Cmax of approximately 35% (study 101). Clinical results indicate no difference in
efficacy when alogliptin is administered once daily vs twice daily.
Mean plasma concentrations of alogliptin following administration of alogliptin 12.5 mg BID and 25
mg once daily for 7 days are presented in figure 1. For pharmacokinetic results (see table 9).
Table 9. Summary of Plasma and Urine Pharmacokinetic Parameters of Alogliptin 12.5
mg and Alogliptin 25 mg on Day 7
⎯ =not applicable, %CV=percent coefficient of variation, T=test treatment (treatment B), R=reference treatment (treatment A).
(a) Ratios and CIs were presented as percentages.
(b) Value shown is the ratio of AUC(12-24) PM to AUC(0-12) AM.
(c) Alogliptin 25 mg QD N=75, alogliptin 12.5 mg BID N=74. Sample size for Ctrough is defined in the Statistical
Analysis Plan as observed predose (trough) plasma concentration on Days 5, 6, and 7.
(d) Median (minimum, maximum) values are presented for Tmax. (e) n=24 for alogliptin 25 mg QD Tmax LS Mean and AUC(0-tau).
(f) P=0.905.

CHMP assessment report
EMA/CHMP/207158/2013 Page 60/136
Figure 1. Mean Plasma Concentrations of Alogliptin vs Time On Day 7 Following Administration of Alogliptin 12.5 mg BID and 25 mg Once Daily for 7 Days: Study 322-101
Mean
Pla
sma
Conc
entr
atio
n (n
g/mL
)
SYR-322 25 mg QD(N=25)
SYR-322 12.5 mg BID(N=24)
20
30
40
50
60
70
80
90
100
110
120
130
140
Time (hours)
0 2 4 6 8 10 12 14 16 18 20 22 24
The 90% CI for AUC for the 12.5 mg BID dose to the 25 mg once daily dose was within the 80% to
125% range. Therefore, total exposure from time 0 to 24 hours was similar between the once daily
and BID dosing regimens. The 90% CIs for the ratios of the Cmax and Cmin were not within the 80%
to 125% range; this is expected for a drug with linear pharmacokinetics. According to the
superposition principle, Cmax will be lower with BID administration (every 12 hours) than with QD
administration of the same total daily dose. No difference in the median Tmax values of alogliptin was
observed between the 25 mg once daily dose and the morning 12.5 mg BID dose (2 hours).
The renal excretion for alogliptin was similar when alogliptin was dosed as 25 mg once daily or
12.5 mg BID.
2.4.2.3.4. Interaction profile of alogliptin and metformin
No changes in exposure to alogliptin and no clinically meaningful changes in exposure metformin
(an OCT2 substrate that is primarily excreted unchanged in the urine) were observed when
alogliptin and metformin were coadministered (see table below).
Table 10 Effect of Alogliptin on Exposure to Metformin: Study 005
LS Mean
Parameter (unit) N Alogliptin 100 mg QD +
Metformin 1000 mg BID (T) Metformin 1000 mg BID
(R)
Ratio T/R100
(90% CI) (a)
AUC(0-12) (ng·hr/mL) 16 12022.75 10112.82 118.9 (109.5, 129.1)
Cmax (ng/mL) 16 1875.65 1867.75 100.4 (91.9, 109.7)
Tmax (hr) (b) 16 2.00 1.03 N/A
N/A=not applicable, R=reference treatment, T=test treatment. (a) Ratios and CIs are presented as percentages. (b) Tmax is presented as the median.

CHMP assessment report
EMA/CHMP/207158/2013 Page 61/136
2.4.3. Pharmacodynamics
2.4.3.1. Alogliptin
Pharmacodynamics of alogliptin were investigated in 8 PK/PD studies, including healthy volunteers,
Japanese healthy volunteers, and subjects with T2DM.
Study 001 was an ascending single dose study in healthy subjects, using doses from 25 mg -800
mg.
Study CHP-001 was a single dose study including lower dosages of alogliptin (6.25 mg to 200 mg)
and was performed in healthy Japanese subjects.
Study 002 was a multiple dose study (25, 100 or 400 mg or placebo) in subjects with T2DM.
Subjects received alogliptin or placebo once daily for 14 days.
Study CHP-002 was a multiple dose study in healthy male Japanese subjects, using doses of 25 or
50 mg alogliptin once daily for 7 days. After safety data were confirmed, subjects received alogliptin
100 mg once daily for 7 days.
Study 101 was a randomized, open-label, 2-sequence, 2-period crossover study in healthy adults to
determine if alogliptin/metformin could be given twice daily as recommended for metformin.
Study 022 investigated effects of age, race and sex on single and multiple-dose pharmacodynamics
of alogliptin.
Study 004 and study 019 were QT/QTc studies.
2.4.3.1.1. Mechanism of action
Alogliptin inhibits DPP-4. DPP-4 is the primary enzyme involved in the rapid degradation of the
incretin hormones GLP-1 and GIP. GLP-1 augments glucose-induced insulin secretion, inhibits
glucagon secretion and hepatic glucose production, and increases glucose disposal. Based on the
mechanism of action, DPP-4 inhibition is expected to increase active GLP-1 levels in patients with
T2DM.
Alogliptin and metformin have complementary mechanisms of action.
2.4.3.1.2. Primary and Secondary pharmacology
DPP-4 inhibition
Based on current literature, DPP-4 inhibition of ≥ 80% is necessary to achieve optimal glucose
reduction. Following single-dose administration in healthy subjects, maximum inhibition (Emax)
was > 93% for all dose groups (25, 50, 100, 200, 400, and 800 mg), with median time to Emax
(Tmax) of 2 to 3 hours (study 001), and > 88% for all dose groups (6.25, 12.5, 25, 50, 100, and
200 mg), with median Tmax of 1.00 to 1.25 hours [CPH-001]. Emax and Tmax for the placebo
group were 12.2% and 6 hours, respectively, in study 001, and 16.0% and 12.5 hours,
respectively, in study CPH-001. Mean inhibition at 24 and 72 hours post dose (E24 and E72) ranged

CHMP assessment report
EMA/CHMP/207158/2013 Page 62/136
from 74.3% and 47.5%, respectively, for the 25 mg group, to 97.0% and 83.0%, respectively, for
the 800 mg group in study 001, and from 64.7% and 27.8%, respectively, for the 6.25 mg group,
to 94.2% and 74.4%, respectively, for the 200 mg group in study CPH-001.
Following multiple-dose administration in healthy Japanese subjects [CPH-002], Emax was > 95%
for all dose groups (25, 50, and 100 mg), with Tmax of 1 hour on both Day 1 and after 7 days of
once-daily dosing (Day 7). Emax and Tmax for the placebo group were 3.8% and 15 hours,
respectively, on Day 1, and 4.6% and 15 hours, respectively, on Day 7. E24 ranged from 79.7% for
the 25 mg group to 89.8% for the 100 mg group on Day 1 and from 83.5% for the 25 mg group to
92.0% for the 100 mg group on Day 7.
Following multiple-dose administration in subjects with T2DM (study 002), Emax was >93% for all
dose groups (25, 100, and 400 mg), with Tmax of approximately 1 hour on Day 1 and 1 to 2.5 hours
after 14 days of once-daily dosing (Day 14). Emax and Tmax for the placebo group were 25.3% and
1.5 hours, respectively, on Day 1, and 20.8% and 6.5 hours, respectively, on Day 14. E24 ranged
from 78.3% to 95.7% on Day 1 and from 81.8% to 96.7% on Day 14, and E72 ranged from 66.3%
to 81.6% for the 3 alogliptin groups on Day 14.
The multiple-dose pharmacodynamics of alogliptin when dosed orally as alogliptin 12.5 mg BID and
as alogliptin 25 mg once daily were compared in study 101. This study was relevant for the FDC
alogliptin/metformin, since metformin is recommended to take 2-3 times daily. The DPP-4
inhibition with BID dosing of alogliptin was similar to that with once daily dosing. In this study, the
DPP-4 inhibition at 24 hours post-dose, as measured by E24, was ≥ 80% during BID dosing (mean
E24=84.74%) and during QD dosing (mean E24=80.30%).
NONMEM modeling that combined a 2-compartment, first order absorption pharmacokinetic model
with an Emax pharmacodynamic model confirmed the potency of alogliptin as an inhibitor of DPP-4
activity with a predicted Emax value of 96.2% and a predicted EC50 value of 3.73 ng/mL in healthy
subjects in study 001 and a predicted Emax of 98.9% and a predicted EC50 value of 6.55 ng/mL in
subjects with T2DM in study 002. The EC80 in study 002 was around 30 ng/mL in T2DM patients.
This concentration is in line with the 25 mg alogliptin dose.
The effects of age, race, and sex on the single- and multiple-dose pharmacodynamics of alogliptin
alone was investigated in a randomized, single-blind, placebo-controlled, parallel-group study in
healthy male and female subjects [study 022]. Peak levels of mean DPP-4 inhibition were at least
92% and were reached by 2 hours postdose. DPP-4 inhibition 24 hours after alogliptin
administration was 76±4% vs 79±4% in young vs elderly, 77±4% vs 79±5% in men vs women,
and 76±4% vs 80±4% in Black vs White. No relevant differences were observed between
subgroups.
GLP-1 levels
The inhibition of DPP-4 activity by alogliptin elicited prominent increases in plasma active GLP-1
levels in healthy subjects (this parameter was not evaluated in subjects with T2DM in the phase 1
program), with mean changes from baseline in plasma active GLP-1 levels that were consistently
greater in the alogliptin groups than in the placebo groups. Dose-related elevations in plasma levels
of GLP-1 persisted through 72 hours after dosing, which is consistent with continuing DPP-4

CHMP assessment report
EMA/CHMP/207158/2013 Page 63/136
inhibition. As expected, the effects of alogliptin were most evident after meals when GLP-1 levels
increased.
Postprandial glucose concentrations
Following multiple-dose administration in subjects with T2DM (002), statistically significant
decreases, compared with placebo, from baseline in 4-hour postprandial glucose concentrations
were observed following each meal (breakfast, lunch, and dinner) as well as when averaged across
all 3 meals.
Effects on QT time
The applicant performed one QT-study with alogliptin doses 50 mg and 400 mg. This study did not
reveal effects of alogliptin on cardiac repolarization. Although, in the highest dose (400 mg
alogliptin, which is 16 times the proposed dosage), the 2-sided 90% CI of the difference from
placebo in LS mean change from baseline in QTcI interval was >10 msec at two time points (0.5
hours and 1 hour postdose) on Day 7, the difference from placebo at these time points for alogliptin
400 mg was 5.84 msec (90% CI, 1.44-10.24 msec) at 0.5 hour; and 6.60 msec (90% CI,
2.50-10.70 msec) at 1 hour postdose. All other measurements were within the boundary and no
other signals on cardiac repolarization in clinical or non-clinical studies have been found, therefore
alogliptin is not considered to have effects on cardiac repolarization in the proposed posology (25
mg).
2.4.3.2. Metformin
The pharmacodynamics of metformin was derived from the SmPC and scientific literature available
for metformin, which was included in the submission package.
2.4.3.2.1. Mechanism of action
Metformin is a biguanide with antihyperglycaemic effects, lowering both basal and postprandial
plasma glucose. It does not stimulate insulin secretion and therefore does not produce
hypoglycaemia.
2.4.3.2.2. Primary and Secondary pharmacology
Metformin improves glucose tolerance in patients with T2DM by lowering both basal and
postprandial plasma glucose; reduces hepatic glucose production by inhibiting gluconeogenesis and
glycogenolysis; improves peripheral glucose uptake and utilization in muscle by increasing insulin
sensitivity; delays intestinal absorption of glucose; and stimulates intracellular glycogen synthesis
by acting on glycogen synthase and increases the transport capacity of all types of membrane
glucose transporters (GLUT).

CHMP assessment report
EMA/CHMP/207158/2013 Page 64/136
2.4.4. Discussion on clinical pharmacology
2.4.4.1. Alogliptin
Several studies were performed to characterize the PK and PD of alogliptin.
The Pharmacokinetics of alogliptin is fairly uncomplicated. It is absorbed fast and almost
completely, the maximum plasma concentration is found after 1-2 hours after administration.
Bioequivalence between the alogliptin Phase III and proposed commercial tablets was established
for both the 12.5 and 25 mg tablets (90% CI within the 80%-125% range). Additionally the lower
commercial tablet strengths had the same dissolution profile as the 12.5 and 25 mg tablet
strengths. As all tablet strengths including the lower strengths were used in the pharmacokinetics
studies and dose proportionality was sufficiently shown, it is agreed that the conclusion on
bioequivalence can be extended to the lower 6.25 and 3.125 mg tablet.
Alogliptin is mainly excreted unchanged via the urine (75%), two minor metabolites were identified:
M-I and M-II. The Exposure to these 2 metabolites are <1% and <6%. M-I has DPP-4 inhibitory
activity similar to that of alogliptin; M-II has no DPP-4 inhibitory activity. Therefore, small to
moderate changes in exposure to these metabolites are not considered to be clinically relevant.
CYP2D6 is involved in the formation of these two metabolites and CYP3A4 may also be involved in
the formation of other unidentified minor metabolites.
In the PD-studies, alogliptin showed a dose-dependent reduction in DPP-4 levels in both healthy
and T2DM patients. Multiple-dose of 25 mg alogliptin treatment caused a≥ 80% reduction in DPP-4
levels, which is considered necessary to achieve optimal glucose reduction. However, it is not
known if a lower dose of 12.5 mg could cause a comparable clinically effect. Therefore, both 12.5
mg and 25 mg dose have been used in the clinical trials.
The DPP-4 inhibition with BID dosing of alogliptin was similar to that of once daily dosing. The DPP-4
inhibition at 24 hours post-dose, as measured by E24, was ≥80% during BID dosing (mean
E24=84.74%) and during QD dosing (mean E24=80.30%). This is relevant for the FDC
alogliptin/metformin, since metformin is recommended to take 2-3 times daily.
The inhibition of DPP-4 activity by alogliptin elicited prominent increases in plasma active GLP-1
levels in healthy subjects, and significant decreases in 4-hour post prandial glucose concentrations
in T2DM subjects.
Subjects with severe hepatic impairment were not evaluated; therefore alogliptin is not
recommended for patients with severe hepatic impairment (Class C) as stated in section 4.4 of the
SmPC.
Increased exposure to alogliptin is observed in patients with renal impairment. An approximate
1.7-fold increase in AUC for alogliptin was observed in patients with mild renal impairment.
However, as the distribution of AUC values for alogliptin in these patients was within the same range
as control subjects, no dose adjustment of alogliptin and Vipdomet for patients with mild renal
impairment is necessary. Metformin is contraindicated for use in patients with moderate and severe
renal impairment and end-stage renal disease (creatinine clearance < 60 mL/min) thefore
Vipdomet is contraindicated in such patients..

CHMP assessment report
EMA/CHMP/207158/2013 Page 65/136
The PK-study 022 showed that gender did not influence the AUC or other PK-parameters. Small
increases in exposure related to age and race were observed, the AUC was about 30% increased
after multiple doses of alogliptin. These changes were not considered clinically relevant since age or
race had no effect on alogliptin inhibition of DPP-4 activity.
However the CHMP had concerns regarding the quality of the population PK analysis in order to be
used for description of the effect of weight on alogliptin exposure, and requested during the
procedure several updated data sets to assess the influence of body weight.
The applicant provided an updated POP-PK analysis which included pooled data from studies 002,
006, and 008 for a detailed evaluation of the effects of renal function (measured by creatinine
clearance [CRCL]) and weight in kilograms [WTKG]) on the PK and exposure of alogliptin. The
applicant provided numerical (Bootstrap) and visual (pcVPC) diagnostics thus allowing assessment
of the updated model. The effect of body weight in the view of the CHMP was thus well estimated
and the model now sufficiently robust with high convergence rate and precise parameter estimates.
The conclusion regarding the clinically insignificant effect of body weight on exposure to alogliptin
was therefore accepted and is reflected in the text regarding the influence of body weight in SmpC
section 5.2.
The alogliptin potential for interactions appears to be low; it has been studied in vivo with all
relevant antidiabetic drugs. Most possibly relevant CYP enzymes have been evaluated. The
applicant investigated if alogliptin is an in vitro inhibitor of OAT1, OAT3 and OCT2. The study
included both control cells and cells transfected with the specific transporter of interest. Further, the
used probe substrates (PAH, E3S and metformin) and positive control inhibitors (probenecid,
probenecid and quinidine) are appropriate. No clinically relevant inhibition by alogliptin (based on
its Cmax of 0.3 µM) was seen for any of the investigated transporters. Alogliptin and
co-administrated drugs were dosed together in the studies. Based on the data presented there is no
obvious effect of alogliptin on the tmax and subsequently on the gastric emptying of the drugs
coadministrated with alogliptin.
The ability of alogliptin to inhibit CYP2B6 (as measured by efavirenz 8-hydroxylation rates) was
investigated with a pool of 16 individual human liver microsomal samples at concentrations ranging
from 0.1 to 100 μmol/L. The study setup of the submitted study to investigate if alogliptin is an in
vitro inhibitor of CYP2B6 is acceptable. The marker CYP2B6 reaction efavirenz 8-hydroxylation and
the CYP2B6 positive control inhibitors orphenadrine (750 uM) and phencyclidine (30 uM) is
appropriate. No inhibition of CYP2B6 activity by alogliptin was seen up to 100 µM and subsequently
the risk for alogliptin inhibition of CYP2B6 at clinically relevant concentrations is unlikely.
Information that alogliptin is not an inhibitor of CYP2B6 in vitro is now included in section 5.2 of the
SmPC.
2.4.4.2. Metformin
Alogliptin and metformin have complementary mechanisms of action. The absolute bioavailability of
metformin is approximately 50% to 60%. Metformin partitions into erythrocytes, which most likely
represent a secondary compartment of distribution. Metformin is well-distributed into tissues.
Protein binding of metformin is negligible.

CHMP assessment report
EMA/CHMP/207158/2013 Page 66/136
Metformin is eliminated by glomerular filtration and active tubular secretion. The plasma T1/2 of
alogliptin is 21 hours. The apparent T1/2 of metformin is approximately 6.5 hours.
2.4.4.3. Alogliptin/Metformin combination tablets
In study 322MET-103, the pivotal BE study, the developed combination tablets containing the
lowest and highest amount of metformin (500 mg and 1000, respectively) and the tablets
containing the lowest and highest amount of alogliptin (6.25 and 12.5, respectively) were compared
with individual corresponding alogliptin and metformin tablets.
Bioequivalence between the combination A6.25+M500, A6.25+M1000, A12.5+M500,
A12.5+M1000 combination tablets and corresponding individual tablets was sufficiently shown. In
all cases the 90% CI of the AUC and Cmax was within the 80%-125% range. Therefore, the CHMP
considers that the bioequivalence of the alogliptin/metformin 6.25 mg + 1000 mg tablet and 12.5
mg+1000 mg tablet to individual alogliptin and metformin tablets was demonstrated.
The applicant used a bracketing approach by making only an evaluation of the highest and lowest
dose strengths in humans in vivo, as was previously advised by the CHMP scientific advice.
Therefore, a bio-waiver for alogliptin/metformin 6.25 mg+850 mg tablet and 12.5 mg+850 mg
tablet can be granted.
Both alogliptin and metformin are absorbed rapidly. Food does not affect exposure to alogliptin, but
decreases exposure to metformin; however, it will be recommended that alogliptin/metformin be
taken with food to decrease the risk of gastrointestinal symptoms. (SmPC section 4.2)
Alogliptin and metformin are eliminated primarily by the kidneys as unchanged drug. Results
indicate that alogliptin undergoes some active tubular secretion. Additionally, metformin is
eliminated by glomerular filtration and active tubular secretion. Alogliptin can be administered to
patients with mild renal impairment without dose adjustments. Metformin is contraindicated in
patients with moderate to severe renal dysfunction because of the risk of lactic acidosis. Although
the applicant is of the opinion that there has been growing evidence that metformin is both
efficacious and safe in patients with greater degrees of renal impairment, the CHMP considers that
the new evidence is not strong enough in order to change metformin contraindication in patients
with severe renal dysfunction. Based on the above considerations the CHMP agreed with the
applicant proposal to contraindicate alogliptin/metformin combination in patients with
moderate-to-severe renal impairment or ESRD. (SmPC sections 4.3 and 4.4)
2.4.5. Conclusions on clinical pharmacology
The applicant performed several clinical pharmacology studies and literature studies to show the
pharmacokinetics and pharmacodynamics of alogliptin and metformin administered alone or in
combination. Additionally specific studies with the combination products were performed including
bioequivalence studies and a food-effect study.
The CHMP considers that the clinical pharmacokinetics and pharmacodynamics of
alogliptin/metformin fixed combination were appropriately investigated.

CHMP assessment report
EMA/CHMP/207158/2013 Page 67/136
2.5. Clinical efficacy
In support of this FDC application, seven phase III studies have been submitted (see table 11):
study 008, 009, 011, 305 and study 322OPI-004 were main studies; 322OPI-001 and 302 were
submitted as supportive trials; study 010 is included to show the efficacy and safety of alogliptin as
monotherapy.
The main studies in the clinical development program relevant to the evaluation of efficacy
comprise of four completed and one on-going phase III studies. Of these, there were three main
phase III, 26-week, placebo-controlled studies that included adult subjects diagnosed with T2DM
who failed to achieve adequate glycaemic control on background antidiabetic medication (i.e.
metformin, TZD, or insulin). Additionally, there were 2 main long-term, active-comparator studies
that included adult subjects diagnosed with T2DM with inadequate glycaemic control on metformin
(study 305) or metformin and pioglitazone (or another antidiabetic agent) (study 322OPI-004).
The total clinical development program for alogliptin examined the use of alogliptin in monotherapy
and in combination use with 4 major classes of antidiabetic agents: (1) MET, (2) SU, (3) TZD, and
(4) insulin. The efficacy of alogliptin has been evaluated in 15 studies: 1 phase 2 dose-ranging
study, 7 main phase III studies, and 7 supportive Phase III studies. (see table 12 for other trials
performed with alogliptin and not included among the relevant ones for the FDC)
Table 11 Overview Studies relevant for Alogliptin/Metformin FDC
Study Design, Key Inclusion Criteria, and Primary Endpoint N Treatment
Phase II Study
003
Dose-ranging
12-week, multicenter, randomized, double-blind,
placebo-controlled study in T2DM subjects on diet and exercise
alone, or monotherapy with SU/MET, or a combination of SU
and MET.
Age: 18 to 75 years; HbA1c: 6.8% to 11.0%.
Change from baseline in HbA1c at Week 12.
265 A6.25, A12.5, A25, A50, A100
or Placebo once daily
Randomization ratio:
1:1:1:1:1:1
Main Phase III, 26-Week, Placebo-Controlled Studies
008
Add-on to MET
26-week, multicenter, randomized, double-blind,
placebo-controlled, parallel-group study, in T2DM subjects on
MET monotherapy (≥1500 mg or MTD).
Age: 18 to 80 years; HbA1c: 7.0% to 10.0%.
Change from baseline in HbA1c at Week 26.
527 A12.5 once daily or
A25 once daily or
Placebo once daily
Randomization ratio: 2:2:1
009
Add-on to TZD,
with or without
MET or SU
26-week, multicenter, randomized, double-blind,
placebo-controlled, parallel-group study, in T2DM subjects on
TZD (pioglitazone or rosiglitazone), with or without MET or
SU.
Age: 18 to 80 years; HbA1c: 7.0% to 10.0%.
Change from baseline in HbA1c at Week 26.
493 (b) A12.5 once daily or
A25 once daily or
Placebo once daily
Randomization ratio: 2:2:1
011
Add-on to
insulin, with or
without MET
26-week, multicenter, randomized, double-blind,
placebo-controlled, parallel-group study, in T2DM subjects on
insulin with or without MET.
Age: 18 to 80 years; HbA1c: ≥8.0%.
Change from baseline in HbA1c at Week 26.
390 A12.5 once daily or
A25 once daily or
Placebo once daily
Randomization ratio: 1:1:1
Main Phase III, Long-Term, Active-Comparator Studies
305 (a)
Add-on to MET
2-year, multicenter, randomized, double-blind, active
comparator (alogliptin vs SU) study in T2DM subjects on MET
≥1500 mg (or MTD) alone.
Age: 18 to 80 years; HbA1c: 7.0% to 9.0%.
Change from baseline in HbA1c at Weeks 52 and 104.
2638 A12.5 once daily or
A25 once daily or
Glipizide 5–20 mg (titrated)
Randomization ratio: 1:1:1
322OPI-004
Add-on to
PIO/MET
52-week, multicenter, randomized, double-blind,
active-comparator (A25 vs titrating pioglitazone from 30 to 45
mg) study in T2DM subjects on combination pioglitazone
803 A25+P30 once daily or
P45 once daily (titrated from
P30)
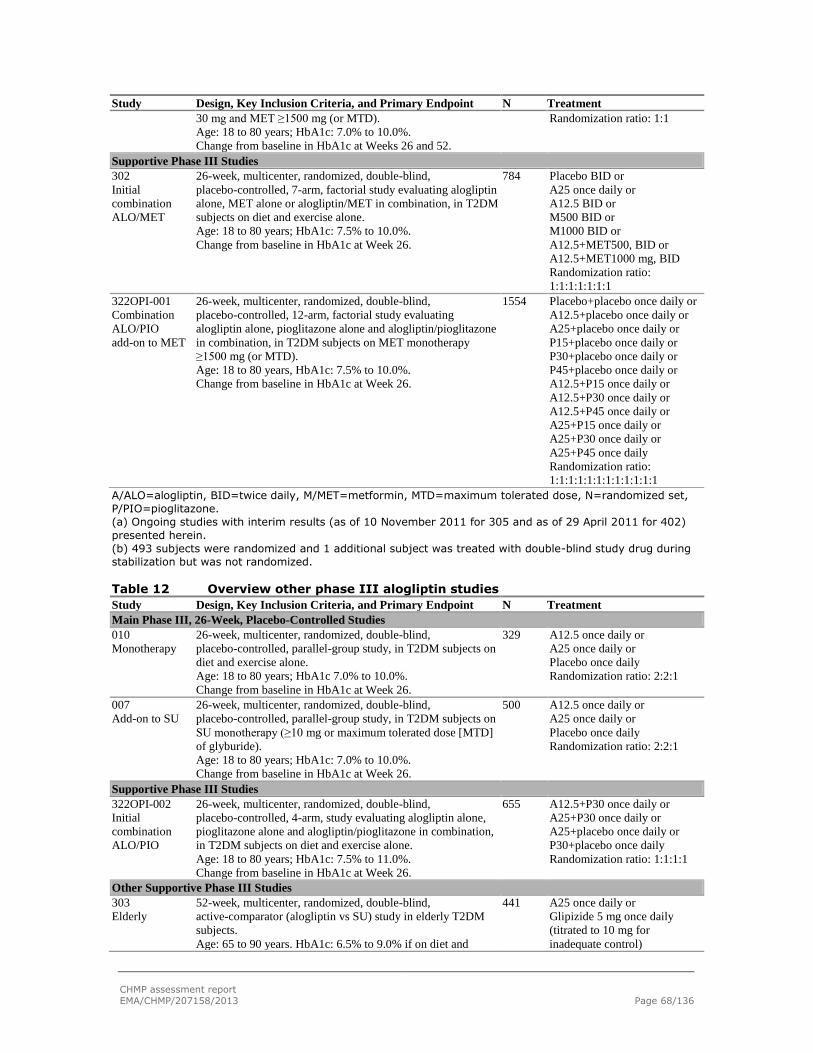
CHMP assessment report
EMA/CHMP/207158/2013 Page 68/136
Study Design, Key Inclusion Criteria, and Primary Endpoint N Treatment
30 mg and MET ≥1500 mg (or MTD).
Age: 18 to 80 years; HbA1c: 7.0% to 10.0%.
Change from baseline in HbA1c at Weeks 26 and 52.
Randomization ratio: 1:1
Supportive Phase III Studies
302
Initial
combination
ALO/MET
26-week, multicenter, randomized, double-blind,
placebo-controlled, 7-arm, factorial study evaluating alogliptin
alone, MET alone or alogliptin/MET in combination, in T2DM
subjects on diet and exercise alone.
Age: 18 to 80 years; HbA1c: 7.5% to 10.0%.
Change from baseline in HbA1c at Week 26.
784 Placebo BID or
A25 once daily or
A12.5 BID or
M500 BID or
M1000 BID or
A12.5+MET500, BID or
A12.5+MET1000 mg, BID
Randomization ratio:
1:1:1:1:1:1:1
322OPI-001
Combination
ALO/PIO
add-on to MET
26-week, multicenter, randomized, double-blind,
placebo-controlled, 12-arm, factorial study evaluating
alogliptin alone, pioglitazone alone and alogliptin/pioglitazone
in combination, in T2DM subjects on MET monotherapy
≥1500 mg (or MTD).
Age: 18 to 80 years, HbA1c: 7.5% to 10.0%.
Change from baseline in HbA1c at Week 26.
1554 Placebo+placebo once daily or
A12.5+placebo once daily or
A25+placebo once daily or
P15+placebo once daily or
P30+placebo once daily or
P45+placebo once daily or
A12.5+P15 once daily or
A12.5+P30 once daily or
A12.5+P45 once daily or
A25+P15 once daily or
A25+P30 once daily or
A25+P45 once daily
Randomization ratio:
1:1:1:1:1:1:1:1:1:1:1:1
A/ALO=alogliptin, BID=twice daily, M/MET=metformin, MTD=maximum tolerated dose, N=randomized set,
P/PIO=pioglitazone.
(a) Ongoing studies with interim results (as of 10 November 2011 for 305 and as of 29 April 2011 for 402)
presented herein.
(b) 493 subjects were randomized and 1 additional subject was treated with double-blind study drug during
stabilization but was not randomized.
Table 12 Overview other phase III alogliptin studies
Study Design, Key Inclusion Criteria, and Primary Endpoint N Treatment
Main Phase III, 26-Week, Placebo-Controlled Studies
010
Monotherapy
26-week, multicenter, randomized, double-blind,
placebo-controlled, parallel-group study, in T2DM subjects on
diet and exercise alone.
Age: 18 to 80 years; HbA1c 7.0% to 10.0%.
Change from baseline in HbA1c at Week 26.
329 A12.5 once daily or
A25 once daily or
Placebo once daily
Randomization ratio: 2:2:1
007
Add-on to SU
26-week, multicenter, randomized, double-blind,
placebo-controlled, parallel-group study, in T2DM subjects on
SU monotherapy (≥10 mg or maximum tolerated dose [MTD]
of glyburide).
Age: 18 to 80 years; HbA1c: 7.0% to 10.0%.
Change from baseline in HbA1c at Week 26.
500 A12.5 once daily or
A25 once daily or
Placebo once daily
Randomization ratio: 2:2:1
Supportive Phase III Studies
322OPI-002
Initial
combination
ALO/PIO
26-week, multicenter, randomized, double-blind,
placebo-controlled, 4-arm, study evaluating alogliptin alone,
pioglitazone alone and alogliptin/pioglitazone in combination,
in T2DM subjects on diet and exercise alone.
Age: 18 to 80 years; HbA1c: 7.5% to 11.0%.
Change from baseline in HbA1c at Week 26.
655 A12.5+P30 once daily or
A25+P30 once daily or
A25+placebo once daily or
P30+placebo once daily
Randomization ratio: 1:1:1:1
Other Supportive Phase III Studies
303
Elderly
52-week, multicenter, randomized, double-blind,
active-comparator (alogliptin vs SU) study in elderly T2DM
subjects.
Age: 65 to 90 years. HbA1c: 6.5% to 9.0% if on diet and
441 A25 once daily or
Glipizide 5 mg once daily
(titrated to 10 mg for
inadequate control)

CHMP assessment report
EMA/CHMP/207158/2013 Page 69/136
Study Design, Key Inclusion Criteria, and Primary Endpoint N Treatment
exercise Alone; 6.5% to 8.0% if on oral monotherapy.
Change from baseline in HbA1c at Week 52.
Randomization ratio: 1:1
402 (a)
CV outcomes
~4.75-year, multicenter, randomized, double-blind,
placebo-controlled, CV outcomes study in subjects with T2DM
and recent ACS (within 15–90 days).
Age: ≥18 years of age; HbA1c: 6.5% to 11.0% if antidiabetic
regimen includes oral monotherapy or oral combination
therapy; 7.0% to 11.0% if antidiabetic regimen includes insulin.
MACE composite (CV death, nonfatal MI, nonfatal stroke).
2134
(interim)
~5400
(planned)
In addition to Standard of Care
antidiabetic medications:
A25 once daily (6.25 and
12.5 mg dose available for
severe and moderate renal
impairment) or Placebo once
daily
Randomization ratio: 1:1
012
Open-label
extension
4-year, multicenter, open-label extension study.
Subjects rolled over from Studies 010, 007, 008, 009, 011,
322OPI-001, and 322OPI-002.
Safety.
3323 A12.5 once daily or
A25 once daily
Randomization ratio: 1:1
301
Postprandial
lipids
16-week, multicenter, randomized, double-blind, active- and
placebo-controlled study in T2DM subjects on diet and exercise
or treatment with MET, SU, nateglinide, or repaglinide.
Age: 18 to 70 years; HbA1c: 6.5% to 9.0%.
Change from baseline in postprandial incremental area under
the plasma concentration-time curve changes for triglycerides
at Week 16.
71 A25 once daily
A25+P30 once daily
Placebo once daily
Randomization ratio: 1:1:1
2.5.1. Dose response studies
No separate dose response studies were performed with the FDC. Dose selection for the FDC was
based on alogliptin dose-range studies and approved dosing recommendations for metformin.
2.5.1.1. Alogliptin
Results from the phase I studies suggested a dose range between 6.25 and 100 mg should be
tested to determine optimal dosage in confirmatory clinical studies. Hence, that dose range was
used in the phase 2 dose-ranging study (study 003). Study 003 assessed the efficacy, safety, and
tolerability of alogliptin 6.25, 12.5, 25, 50, and 100 mg over 12 weeks compared with placebo in
265 subjects with T2DM, 26 to 75 years of age, inclusive, who were either receiving no treatment
(i.e. either newly diagnosed or experiencing inadequate glycaemic control with diet and exercise
alone) or were being treated with an SU, MET, or a combination of SU and MET, but were
experiencing inadequate glycaemic control.
Statistically significant and clinically relevant reductions in HbA1c were observed at alogliptin doses
of ≥12.5 mg and in fasting plasma glucose (FPG) at doses of ≥25 mg, with no additional HbA1c
benefit seen at doses >25 mg (see table 13). HbA1c levels were not significantly reduced with
alogliptin 6.25 mg, which is likely due to lack of optimal DPP-4 inhibition.

CHMP assessment report
EMA/CHMP/207158/2013 Page 70/136
Table 13 Change From baseline in HbA1c (%) and FPG (mmol/L) Levels on Day 85 (ITT, LOCF) (003)
Placebo (N=41)
A6.25 (N=42)
A12.5 (N=42)
A25 (N=45)
A50 (N=43)
A100 (N=44)
baseline HbA1c
Mean (SD) 8.24 (1.034)
7.99 (1.006)
7.87 (0.905)
8.02 (0.978)
8.11 (1.037)
8.00 (0.988)
LS Mean Change from baseline at Day 85 (SE) (a)
-0.01 (0.123)
-0.19 (0.121)
-0.54* (0.122)
-0.56* (0.117)
-0.44* (0.124)
-0.51* (0.119)
baseline FPG
Mean (SD) 10.5 (2.80)
10.6 (2.73)
9.6 (2.27)
10.6 (3.47)
10.1 (2.89)
10.5 (3.14)
LS Mean Change from baseline at Day 85 (SE) (a)
-1.3 (0.39)
-0.9 (0.50)
-0.8 (0.50)
-2.0* (0.49)
-1.4* (0.51)
-1.6* (0.49)
ITT=intent to treat. *p<0.05 vs placebo. (a) LS mean from an analysis of covariance (ANCOVA) with effects for baseline value, treatment, BMI, T2DM duration (years), and prior antidiabetic treatment (yes/no) (Model 1).
These HbA1c and FPG results were the basis for selecting alogliptin 12.5 and 25 mg for evaluation
in the Phase III clinical programs. Both doses were chosen for further evaluation because, at that
point in time, only limited comparative safety data were available.
Total exposure to alogliptin in subjects with moderate and severe renal impairment/ESRD increased
approximately 2- and 4-fold, respectively, compared with healthy matched control subjects. Dose
reductions proportional to the increases in exposure seen in study 006 were used in study 402, in
which a dose of alogliptin 25 mg was assigned to T2DM subjects with normal renal function and
those with mild renal impairment, alogliptin 12.5 mg to T2DM subjects with moderate renal
impairment, and alogliptin 6.25 mg to T2DM subjects with severe renal impairment/ESRD.
2.5.1.2. Metformin
For the FDC alogliptin/metformin, no separate dose response studies were performed with either
the fixed dose combination or metformin alone.
The strengths of the metformin component are based on the approved dose of metformin in Europe
(up to 3 mg daily taken as 3 divided doses). Although the recommended maximum daily dose is
3000 mg, most patients do not tolerate such high doses due to side effects, particularly
gastrointestinal effects. In the UKPDS, for example, more than three-quarters of patients received
>1700 mg metformin.
This is acceptable, since the proposed dose of the metformin component for the FDC
alogliptin/metformin is in line with the SmPC of metformin and with clinical practice.
2.5.2. Main studies
2.5.2.1. Methods, study designs and statistical methods
The main studies relevant for the FDC comprised 4 completed and 1 on-going phase III studies. Of
these, there were three main phase III, 26 week, placebo-controlled studies that included adult

CHMP assessment report
EMA/CHMP/207158/2013 Page 71/136
subjects diagnosed with T2DM who failed to achieve adequate glycaemic control on background
antidiabetic medication (i.e. metformin, TZD, or insulin).
In the three 26-week placebo-controlled main studies, the primary analysis was performed for the
full analysis set (FAS) using an analysis of covariance (ANCOVA) model with last observation carried
forward (LOCF) values. The primary model included in all studies, study treatment and geographic
region as class variables and baseline HbA1c as covariate. Additional study-specific covariates or
factors were included in the primary analysis model. For the primary analysis, the alogliptin 25 dose
was compared with placebo at the 2 sided 0.05 significance level using a contrast derived from the
primary model. Only if this test was statistically significant, the alogliptin 12.5 dose was to be
evaluated in a similar fashion.
Furthermore, two active-comparator studies were included. Study 305 was, at the time of
evaluation of this application, an on-going, 2-year, active-comparator study. For this study, a
baseline HbA1c of between 7.0% and 9.0% was required for inclusion. All subjects are to be
receiving MET at a dose of ≥ 1500 mg (or MTD). Subjects will be treated for a period of 2 years to
assess maintenance of efficacy. An interim study report with data from a pre-planned, 1-year
interim analysis was provided (study 305). At the time of the CHMP opinion for this procedure, the
applicant has already made available a summary of the results and confirmed that the results are in
line with the interim data formally assessed in this report. However, a full assessment can only
occur once the final study report is submitted.
The primary analysis in the two main active-comparator studies was a non-inferiority assessment of
change from baseline in HbA1c. In study 305, the primary efficacy endpoint evaluated glycaemic
control through HbA1c changes from baseline to Week 52 or Week 104. The primary efficacy
endpoint for the interim analysis was change from baseline in HbA1c at Week 52 (or at time of
discontinuation of double-blind study medication or hyperglycaemic rescue) using the per protocol
set (PPS) and ANCOVA models with change from baseline (LOCF) in HbA1c as the response variable,
treatment, geographic region, and study schedule as fixed class effects and baseline MET dose and
baseline HbA1c as continuous covariates. The A25 group was compared with the glipizide group at
the 1 sided 0.0125 level using a non-inferiority margin of 0.3%. If A25 was non-inferior to glipizide,
then the A12.5 group was compared with the glipizide group in a step-down fashion using the same
significance level and non-inferiority margin. If both alogliptin groups were non-inferior to glipizide,
then additional tests for statistical superiority of the alogliptin groups to the glipizide group were
conducted in a step-down fashion in the same order at the 1 sided 0.0125 level.
Study 322OPI-004 was a 52 week active controlled study designed to evaluate the efficacy of
alogliptin 25 mg as triple therapy (add-on to pioglitazone 30 mg and MET), in which efficacy was
compared with up-titration of pioglitazone, in subjects on pioglitazone 30 mg and MET. Adult
subjects with T2DM were included who failed (HbA1c between 7.0% and 10.0%) to achieve
adequate glycaemic control on background antidiabetic medication consisting of pioglitazone 30 mg
with metformin (≥ 1500 mg (or MTD). The primary efficacy variable was change from baseline in
HbA1c at Weeks 26 and 52 in the PPS using the LOCF method for subjects who were rescued or who
prematurely discontinued from the study. The primary model included study treatment, study
schedule, and geographic region as class variables, and baseline MET dose and baseline HbA1c as
covariates. The primary analysis was a non-inferiority assessment (non-inferiority margin of 0.3%)
at Week 26 followed by an assessment at Week 52. Both analyses (at Weeks 26 and 52) were

CHMP assessment report
EMA/CHMP/207158/2013 Page 72/136
performed at the 1-sided 0.025 significance level. The Week 26 analysis was a pre-planned interim
analysis; the Week 52 analysis was considered the primary endpoint.
Study 010 was an alogliptin monotherapy trial. It was a 26-week, multicenter, randomized,
double-blind placebo controlled study in T2DM patients were included who failed treatment with diet
and exercise (HbA1c 7-10%).
2.5.2.2. Study Participants
Main Phase III, Placebo-Controlled Studies
A total of 1410 subjects were randomized into studies 008, 009, and 011 and received at least
1 dose of study drug. No meaningful differences across treatment groups were observed for any
demographic or baseline characteristic with respect, specifically, to sex, age, race, and body mass
index (BMI)(see Table 14). Mean age across studies was 55 years (min-max, 22-80 years). In these
studies, 240 (17%) randomized subjects were elderly (65 years), with 33 subjects (2%) at least
75 years of age. The majority (73%) of all randomized subjects were White. Mean BMI for all
randomized subjects ranged from 32 to 33. The duration of T2DM differed among studies and, as
expected, subjects in study 011 (insulin add-on) had a longer mean duration of T2DM (12.56 years)
compared with the other studies (study 008, 6.11 years; study 009, 7.58 years).
Study 010 included a total of 329 subjects were randomised. Overall, 53.2% of subjects were men.
Mean age for all randomized subjects was 53.4 years. The majority of subjects were < 65 years of
age (83.3%) and White (66.9%). Mean BMI for all randomized subjects was 32.02 and mean
duration of T2DM was 3.22 years. Mean HbA1c values at baseline were similar among the placebo,
A12.5, and A25 groups (8.03%, 7.91%, and 7.91%, respectively). Overall, no meaningful
differences were observed among the treatment groups for any subject demographic or baseline
characteristic.
Table 14 Subject Demographics and baseline Characteristics (studies 010, 008, 009, 011)
Study 010
Monotherapy Study 008
Add-on to MET
Study 009 Add-on to TZD, with or
without MET or SU
Study 011 Add-on to insulin, with
or without MET
Category Placebo N=65
A12.5 N=133
A25 N=131
Placebo N=104
A12.5 N=213
A25 N=210
Placebo N=97
A12.5 N=197
A25 N=199
Placebo N=130
A12.5 N=131
A25 N=129
Sex, n (%)
Men 33 (50.8)
65 (48.9)
77 (58.8)
50 (48.1)
101 (47.4)
114 (54.3)
53 (54.6)
109 (55.3)
125 (62.8)
62 (47.7)
55 (42.0)
44 (34.1)
Women 32 (49.2)
68 (51.1)
54 (41.2)
54 (51.9)
112 (52.6)
96 (45.7)
44 (45.4)
88 (44.7)
74 (37.2)
68 (52.3)
76 (58.0)
85 (65.9)
Age (years)
Mean (SD)
53.8 (10.99)
52.6 (12.01)
54.2 (10.16)
56.0 (10.58)
55.2 (10.58)
53.6 (10.45)
55.2 (10.82)
55.5 (9.37)
55.4 (10.16)
55.0 (10.57)
55.4 (9.79)
55.9 (10.18)
Min, Max 35, 80 24, 77 31, 80 27, 78 26, 80 22, 77 24, 80 36, 78 25, 80 27, 80 24, 78 23, 79
BMI
Mean (SD)
32.17 (5.748)
31.82 (5.166)
32.16 (5.915)
32.39 (5.763)
31.59 (5.208)
31.80 (5.302)
33.23 (6.192)
32.34 (5.698)
33.06 (5.379)
32.42 (5.621)
32.66 (5.546)
32.28 (5.594)
HbA1c
Mean 8.03 7.91 7.91 8.01 7.89 7.93 7.97 8.08 8.01 9.28 9.29 9.27

CHMP assessment report
EMA/CHMP/207158/2013 Page 73/136
(SD) (0.910) (0.810) (0.788) (0.872) (0.740) (0.799) (0.818) (0.910) (0.837) (1.127) (1.056) (1.127)
Duration of T2DM (years)
Mean (SD)
4.32 (5.286)
3.09 (3.825)
2.82 (3.016)
6.28 (5.405)
6.21 (5.091)
5.94 (4.306)
7.76 (6.667)
7.68 (5.585)
7.38 (5.350)
12.18 (7.067)
12.10 (7.161)
13.42 (6.308)
Median 2.67 1.92 1.67 4.67 5.25 5.00 6.50 6.33 6.17 10.96 11.17 13.08
Main Phase III, Long-Term, Active-Comparator Studies
A total of 3441 subjects were randomized into the 2 studies. Of the 2638 subjects randomized into
study 305, a total of 1900 subjects were on-going at the time of the interim data cut; and 526
subjects completed study 322OPI-004. A total of 1015 subjects discontinued from the studies,
including 413 subjects who were rescued. In study 305, more subjects receiving MET+glipizide
required hyperglycaemic rescue compared with those receiving MET+A12.5 or MET+A25. More
subjects in the MET+A25+P30 group completed study 322OPI-004, primarily due to more subjects
requiring hyperglycaemic rescue on MET+P45. The primary causes of discontinuation excluding
hyperglycaemic rescue were AEs, major protocol deviations and voluntary withdrawals. No
meaningful differences across treatment groups were observed for any demographic or baseline
characteristic with respect to sex, age, race, and BMI (see table 15). Mean age across the studies
ranged from 54 to 56 years. In these 2 studies, 615 subjects (18%) were elderly ( 65 years), with
57 subjects (2%) at least 75 years. The majority of all randomized subjects were White (59.9 to
64.2%). Mean BMI for all randomized subjects ranged from 31 to 32. Mean duration of T2DM was
5.51 years in study 305 and 7.16 years in study 322OPI-004.
Table 15 Subject Demographics and baseline Characteristics (studies 305 and 322OPI-004)
Study 305
Add-on to MET (Ongoing) Study 322OPI-004 Add-on to PIO/MET
Characteristic MET+A12.5
N=880 MET+A25
N=885 MET+Glipizide
N=873 Total
N=2638 MET+A25+P30
N=404 MET+P45
N=399 Total
N=803
Sex, n (%)
Men 419 (47.6) 452 (51.1) 441 (50.5) 1312 (49.7)
210 (52.0) 204 (51.1) 414 (51.6)
Women 461 (52.4) 433 (48.9) 432 (49.5) 1326 (50.3)
194 (48.0) 195 (48.9) 389 (48.4)
Age
Mean (SD), yr 55.2 (9.60) 55.5 (9.81) 55.4 (9.59) 55.4 (9.66)
54.3 (9.86) 55.9 (9.94) 55.1 (9.93)
<65 years, n (%) 734 (83.4) 710 (80.2) 723 (82.8) 2167 (82.1)
339 (83.9) 320 (80.2) 659 (82.1)
≥65 years, n (%) 146 (16.6) 175 (19.8) 150 (17.2) 471 (17.9) 65 (16.1) 79 (19.8) 144 (17.9)
≥75 years, n (%) 13 (1.5) 17 (1.9) 15 (1.7) 45 (1.7) 5 (1.2) 7 (1.8) 12 (1.5)
BMI n=879 n=885 n=872 n=2636
Mean (SD) 31.27 (5.417)
31.27 (5.341)
31.11 (5.320) 31.22 (5.358)
31.52 (5.243) 31.58 (5.177)
31.55 (5.210)
HbA1c n=876 n=883 n=871 n=2630 n=303 (a) n=306 (a) -
Mean (SD) 7.59 (0.599) 7.61 (0.606)
7.60 (0.617) 7.60 (0.607)
8.25 (0.820) 8.13 (0.832) -
T2DM duration, yr
Mean (SD) 5.65 (5.323) 5.42 (4.729)
5.48 (4.887) 5.51 (4.985)
7.47 (5.248) 6.85 (4.611) 7.16 (4.946)
MET dose (mg)
Mean (SD) 1824.7 1835.3 1823.5 1827.9 1867.9 (476.71) 1847.6 1857.8

CHMP assessment report
EMA/CHMP/207158/2013 Page 74/136
(405.69) (373.76) (390.83) (390.17) (494.12) (485.24)
Median (range) - - - - 1700
(500-3400)
1700
(500-3000)
1700
(500-3400)
-=Not applicable. (a) PPS data are presented per the primary analysis.
Note: This table includes all randomized subjects.
2.5.2.3. Treatments
In studies 008 (add-on to metformin), 009 (add-on to TZD, with or without metformin) and 010
(monotheraphy) doses of 12.5 or 25 mg alogliptin were administered once daily vs placebo in a
randomization ratio of 2:2:1. An HbA1c concentration between 7.0% and 10.0%, inclusive, was
used as an inclusion criterion. In study 011 (add-on to insulin, with or without metformin), doses of
alogliptin 12.5 or 25 mg or placebo were administered once daily in a randomization ratio of 1:1:1,
and a higher baseline minimum HbA1c concentration of 8.0% was used as an inclusion criterion.
Subjects were treated with antidiabetic agents at a stable dose, consistent with clinical practice and
international treatment guidelines. In the add-on studies, subjects underwent a 4-week Run
in/Stabilization Phase during which they were stabilized on a dose of ≥ 1500 mg metformin (or
MTD), 30 or 45 mg pioglitazone (or MTD), or insulin (≥ 15 and ≤ 100 units), according to protocol
requirements.
In study 305 (add-on to MET) the subjects were randomized to receive either alogliptin 12.5 or 25
mg or glipizide (5-20 mg) in a 1:1:1 ratio.
In Study 322OPI-004, a 52-week, active-comparator study in subjects receiving metformin (≥ 1500
mg or MTD), a combination of alogliptin 25 mg and pioglitazone 30 mg once daily was compared
with pioglitazone 45 mg once daily (randomization ratio 1:1).
Across these studies, the actual mean doses of background metformin or TZD medication were
maximized (or optimized for insulin), in accordance with treatment paradigms. Subjects were
instructed on proper nutrition and exercise and how to recognize signs and symptoms of
hypoglycaemia in accordance with each study center’s standard of care guidelines for subjects with
T2DM.
2.5.2.4. Outcomes/endpoints
The primary efficacy endpoint for Studies 008, 009, 010 and 011 was the change from baseline in
HbA1c at Week 26. The primary efficacy endpoint for Studies 305 and 322OPI-004 was change from
baseline in HbA1c at Week 52 with statistical testing for non-inferiority and superiority against the
active comparator.
Secondary endpoints include changes in other measures of glycaemic control, including clinical
response rates, FPG, the incidence of marked hyperglycaemia, and the incidence of hyperglycaemic
rescue.

CHMP assessment report
EMA/CHMP/207158/2013 Page 75/136
2.5.2.5. Results
2.5.2.5.1. Outcomes and estimation
Primary Efficacy Results (HbA1c)
Main Phase III, Placebo-Controlled Studies
Across the program, alogliptin efficacy results have shown reductions in HbA1c, as summarized in
the figure below for the 4 main phase III placebo-controlled studies.
Figure 2. Change from baseline in HbA1c (%) (LOCF, FAS) at Week 26 (studies 010,
007, 008, 009, and 011)
0
0
-0.1
-0.2
-0.1
-0.6
-0.4
-0.6
-0.7 -0.6
-0.6
-0.5
-0.6
-0.8
-0.7
-1
-0.8
-0.6
-0.4
-0.2
0
0.2
Study 010
(Monotherapy)
Study 007
(Sulfonylurea)
Study 008
(Metformin)
Study 009
(TZD)
Study 011
(Insulin)
LS
Mea
n (
SE
) C
FB
in
Hb
A1
c (
%)
at
We
ek 2
6
Placebo A12.5 A25
***
*** ******
***
*** ***
***
BL Mean=
8.0 8.17.98.17.9 7.9 8.2 8.1 8.0 7.9 8.0 8.0 9.39.3 9.3
BL Mean= BL Mean= BL Mean= BL Mean=
***
***
BL=baseline. CFB=change from baseline. ***p<0.001 vs placebo.
All treated subjects in study 008 received MET at baseline (mean dose of 1846.7 mg). Compared
with placebo, subjects in both the alogliptin 12.5 and 25 mg groups achieved statistically
significant, placebo-corrected LS mean reductions in HbA1c at Week 26. As in study 007, this effect
was observed as early as Week 4 and continued throughout the 26-week treatment period. There
was no differentiation in terms of HbA1c reduction between both alogliptin doses (see figure 3).

CHMP assessment report
EMA/CHMP/207158/2013 Page 76/136
Figure 3. Study 008 (add-on to MET): Change from baseline in LS Mean of HbA1c (%) by Visit—Full Analysis Set
In study 009, subjects received alogliptin or placebo as add-on therapy to TZD with or without MET
or SU. Statistically significant LS mean differences from placebo were seen for both the alogliptin
12.5 mg and 25 mg groups (see figure 4). Reductions (compared with placebo) were seen
regardless of pioglitazone dose or whether the subject was receiving pioglitazone with or without SU
or MET. Of the 493 subjects randomized in the study, 112 (23%) received alogliptin (89 subjects)
or placebo (23 subjects) as add-on therapy to pioglitazone alone. Although the number of subjects
receiving add-on therapy to TZD alone is somewhat limited in this study, the overall response is
clinically relevant. In the supportive initial combination study 322OPI-002, the combination of
alogliptin 25 mg+pioglitazone 30 mg showed a decrease in HbA1c of 1.71%. In study 009, 277
subjects (56%) received alogliptin (221 subjects) or placebo (56 subjects) as add-on therapy to
TZD plus MET.

CHMP assessment report
EMA/CHMP/207158/2013 Page 77/136
Figure 4. Study 009 (add-on to TZD): Change from baseline in LS Mean of HbA1c (%) by Visit—Full Analysis Set
In study 011, 390 subjects received alogliptin or placebo as add-on therapy to insulin with MET
(228 subjects, 58%) or without MET (162 subjects, 42%). Over a 4-week Run-in Period, subjects
were optimized (or stabilized) on insulin, but mean baseline Hb1Ac was higher in this study
(9.27%-9.29% across treatment groups) compared with the other 4 studies. Mean baseline MET
dose for subjects who received insulin with MET (58%) in this study was 1732.7 mg, a maximized
dose. Mean insulin dose, which may have been adjusted for events of hypoglycaemia, was
consistent throughout the study (approximately 56.5 and 56.7 IU at baseline and at Week 26,
respectively). The observed reduction in HbA1c seen in the study overall was clinically and
statistically significant (0.71% alogliptin 25 mg vs 0.13% placebo) (see figure 5). Because there
was a higher baseline HbA1c in this study, a preplanned analysis with subcategories of baseline
HbA1c (8.5%, 8.5%, and 9.0%, according to the broader inclusion criterion) confirmed that,
irrespective of baseline HbA1c, subjects in the groups receiving alogliptin had clinically and
statistically significant decreases from baseline in HbA1c levels at Week 26 (-0.62%, -0.72%,
and -0.82% for alogliptin 25 mg, respectively) compared with subjects receiving placebo
(0.06%, -0.22%, and -0.30%, respectively; p<0.002). In the subgroups of subjects taking insulin
with or without MET, change from baseline HbA1c was clinically relevant (-0.77% and -0.66%,
respectively, alogliptin 25 mg).

CHMP assessment report
EMA/CHMP/207158/2013 Page 78/136
Figure 5. Study 011 (add-on to insulin): Change from baseline in LS Mean of HbA1c (%) by Visit—Full Analysis Set
In study 010, at Week 26, the LS mean changes from baseline in HbA1c were -0.02%, -0.56%,
and -0.59% for the placebo, A12.5, and A25 groups, respectively. LS mean differences from
placebo were -0.54% (p<0.001) and -0.57% (p0.001) for the A12.5 and A25 groups, respectively.
Results for the primary efficacy endpoint are presented in the table below. Subjects in both
alogliptin dose groups (A12.5 and A25) achieved statistically significant mean decreases in HbA1c
levels compared with the placebo group at every time point.
Table 16 Change From baseline in HbA1c (%) (LOCF, FAS) (study 010)
Placebo N=64
A12.5 N=133
A25 N=131
N 63 131 128
baseline HbA1c (%)
Mean (SD) 8.03 (0.910) 7.91 (0.810) 7.91 (0.788)
Median (range) 7.90 (6.7-10.0) 7.70 (6.6-10.2) 7.75 (6.4-10.3)
Week 26 CFB
LS mean (SE) -0.02 (0.094) -0.56 (0.065) -0.59 (0.066)
LS mean difference (95% CI) -0.54 (-0.76, -0.31) -0.57 (-0.80, -0.35)
p-value: treatment vs placebo <0.001 <0.001
Reductions in HbA1c were seen regardless of sex, age, race, or baseline BMI. Subjects in the
alogliptin 25 mg group achieved greater LS mean reductions in HbA1c than subjects in the alogliptin
12.5 mg group in 4 of the 5 studies. The difference in effect with alogliptin 25 mg group compared
with the alogliptin 12.5 mg group is more apparent in subjects with higher baseline HbA1c levels.

CHMP assessment report
EMA/CHMP/207158/2013 Page 79/136
Main Phase III, Long-Term, Active-Comparator Studies
In both long-term, active-controlled studies (305 and 322OPI-004), greater LS mean reductions
from baseline in HbA1c were observed in the alogliptin groups than in the comparator groups at
Weeks 26 and 52, and alogliptin efficacy was shown to be sustained for up to 52 weeks. In study
305, statistical non-inferiority of MET+alogliptin 25 mg and MET+alogliptin 12.5 mg was
demonstrated vs MET+glipizide (see figure 6). Mean final glipizide dose of 5.2 mg in the
MET+glipizide group was lower than expected. The low mean glipizide dose may be a reflection of
the relatively low baseline HbA1c (mean, 7.60%) and FPG (mean, 8.19 mmol/L). This resulted in a
low incidence of hyperglycaemic rescue in all treatment groups (9.1% MET+alogliptin 25 mg vs
12.0% MET+glipizide) requiring conservative dose titration. Due to the low baseline HbA1c and the
low glipizide dose in the comparator group, a formal claim of non-inferiority would not be
acceptable. However, despite the low mean glipizide dose, the incidence of hypoglycaemic events
was greater in the MET+glipizide group (23.8%) compared with the MET+alogliptin 12.5 mg and
MET+alogliptin 25 mg groups (2.5% and 1.4%, respectively).
Figure 6. LS Mean Changes From baseline in HbA1c (%) (LOCF, PPS)
-0.75
-0.65
-0.55
-0.45
-0.35
-0.25
-0.15
-0.05
0 4 8 12 16 20 24 28 32 36 40 44 48 52
Weeks
LS
Mea
n C
ha
ng
e f
rom
Ba
se
lin
e in
Hb
A1
c (
%)
MET+A12.5 MET+A25 MET+Glipizide
*
†
††
*p<0.010 vs MET+glipizide. †LS mean difference (1-sided 98.75% CI) = -0.09 (-infinity, 0.004), indicating the average change from baseline in the MET+A25 group was non-inferior to that in the MET+glipizide group. ††LS mean difference (1-sided 98.75% CI) = -0.10 (-infinity, -0.002), indicating the average change from baseline in the MET+A12.5 group was non-inferior to that in the MET+glipizide group.
In study 322OPI-004, non-inferiority and superiority of alogliptin 25 mg was demonstrated vs
titration of pioglitazone from 30 to 45 mg in subjects on a background treatment of MET and
pioglitazone 30 mg (see figure 7).

CHMP assessment report
EMA/CHMP/207158/2013 Page 80/136
Figure 7. LS Mean (SE) Changes From baseline in HbA1c (%) (LOCF, PPS)Secondary Efficacy Results
Secondary Efficacy Results
Secondary endpoints include clinical response, FPG, body weight and lipid parameters.
Clinical Response
Clinical response was evaluated by assessing the percentage of subjects who achieved HbA1c levels
of 7.0% at Week 26, following treatment in the respective study. In all four phase III
placebo-controlled studies, a higher percentage of subjects in both alogliptin groups achieved these
clinical response endpoints at Week 26 than in the placebo group (see table 17). Except in isolated
incidences, differences from the placebo group were statistically significant across studies. With the
exception of study 011, which had a higher baseline HbA1c, similar percentages of subjects in the
alogliptin 12.5 and 25 mg groups achieved HbA1c levels of 7.0% at Week 26.
Table 17 Percentage of Subjects Who Achieved a Clinical Response of HbA1c 7.0%
(LOCF, FAS) (studies 010, 008, 009 and 011)
Study Placebo A12.5 A25
Study 010 (monotherapy) 23.4% 47.4%** 44.3%**
Study 008 (add-on to MET) 18.3% 51.6%*** 44.4%***
Study 009 (add-on to a TZD) 34.0% 44.2%* 49.2%**
Study 011 (add-on to insulin) 0.8% 8.4%* 7.8%
*p<0.05, **p<0.01, ***p<0.001 compared with placebo.

CHMP assessment report
EMA/CHMP/207158/2013 Page 81/136
In study 010 the percentage of subjects who achieved an HbA1c level of ≤7.0% by Week 26 was
also statistically significantly higher in the A12.5 and A25 groups (47.4% [p=0.001] and 44.3%
[p=0.008], respectively) than in the placebo group (23.4%).
Overall, higher percentages of subjects in the alogliptin groups achieved the 7.0% clinical
response endpoint at Week 52 than in the comparator groups in both Studies 305 and 322OPI-004.
In study 305, significantly higher percentages of subjects in the MET+alogliptin 25 mg group
(55.3%) achieved the HbA1c clinical response endpoint at Week 52 compared with the
MET+glipizide group (47.4%; p<0.001). In study 322OPI-004, significantly higher percentages
of subjects in the MET+A25+P30 group (33.2%) achieved the HbA1c clinical response endpoint at
Week 52 compared with the MET+P45 group (21.3%; p<0.001).
Change from baseline in fasting plasma glucose (FPG)
Across the four main placebo-controlled studies, LS mean decreases in FPG observed in
alogliptin-treated subjects were statistically significant compared with the placebo group for the
alogliptin 25 mg group in all studies, and for the alogliptin 12.5 mg group for all studies except
study 011 (add-on to insulin) (see table 18). Additionally, in 3 of the 4 studies, subjects in the
alogliptin 25 mg group achieved greater LS mean reductions in FPG than subjects in the alogliptin
12.5 mg group.
Table 18. Change From baseline in FPG (mmol/L) (LOCF, FAS) (010, 008, 009 and 011)
Placebo A12.5 A25
Study 010 (monotherapy) N=64 N=133 N=131
baseline FPG (mmol/L) 9.62 9.63 9.55
LS Mean Change at Week 26 0.63 -0.57*** -0.91***
Study 008 (add-on to MET) N=104 N=213 N=207
baseline FPG (mmol/L) 9.97 9.34 9.54
LS Mean Change at Week 26 0.00 -1.04*** -0.96***
Study 009 (add-on to TZD) N=97 N=197 N=199
baseline FPG (mmol/L) 9.53 9.63 9.41
LS Mean Change at Week 26 -0.32 -1.09** -1.10**
Study 011 (add-on to Insulin) N=129 N=131 N=129
baseline FPG (mmol/L) 10.88 10.54 10.34
LS Mean Change at Week 26 0.32 0.13 -0.65*
*p<0.05, **p<0.01, ***p<0.001 compared with placebo. Note: Results from ANCOVA models with effects for treatment, geographic region, and baseline FPG. Additional factors and covariates are included as specified in the individual study tables.
In both long-term, active-comparator studies (305 and 322OPI-004), greater LS mean reductions
from baseline in FPG were observed in the alogliptin groups than in the comparator groups at Weeks
26 and 52.
In study 305, the LS mean changes from baseline in FPG at Week 52 were -0.40, -0.28, and 0.05
mmol/L for the MET+alogliptin 25 mg, MET+alogliptin 12.5 mg, and MET+glipizide groups,
respectively (p<0.001). In general, greater reductions were observed in the MET+alogliptin 25 mg
group than in the MET+alogliptin 12.5 mg group. Additionally, LS mean decreases from baseline in
FPG were apparent from the first assessment (Week 2) and continued throughout the majority of
time points during the study.
In study 322OPI-004, the LS mean changes from baseline at Week 52 were -0.81
and -0.21 mmol/L in the MET+A25+P30 and MET+P45 groups, respectively (p<0.001).

CHMP assessment report
EMA/CHMP/207158/2013 Page 82/136
Additionally, LS mean decreases from baseline in FPG were statistically significant for the
MET+A25+P30 group at all time-points through Week 52 compared with the MET+P45 group
(p<0.01).
Body weight and serum lipids
Across Studies 008, 009, and 011, there were no meaningful differences between placebo and
subjects receiving alogliptin in LS mean changes from baseline in body weight at Week 26. LS mean
changes from baseline ranged from decreases of -0.4 to -0.7 kg in study 008 to increases of 1.0 to
1.5 kg in study 009.
Also in study 010, there were no meaningful differences in LS mean changes in body weight
between the placebo group (0.18 kg) and A12.5 and A25 groups (-0.09 and 0.22 kg, respectively).
In study 305, statistically significant (p<0.001) LS mean decreases in body weight were observed
at Week 52 in the MET+alogliptin 12.5 mg and MET+alogliptin 25 mg groups (-0.64 and -0.91 kg,
respectively) compared with an increase in weight in the MET+glipizide group (0.89 kg). However,
in study 322OPI-004, mean changes in body weight were consistent with the concomitant
medication (i.e. pioglitazone) administered. At Week 52, LS mean increases in body weight were
observed in both treatment groups (1.10 kg and 1.60 kg in the MET+A25+P30 and MET+P45
groups, respectively). These increases were not considered clinically meaningful and there was no
statistically significant difference between treatment groups.
Overall, changes from baseline in lipid parameters were similar in the alogliptin and placebo groups
suggesting that treatment with alogliptin has a neutral effect on lipid parameters, regardless of
administration as a monotherapy or as an add-on to established concomitant antidiabetic
medications.
2.5.2.5.2. Summary of main studies
The following tables summarise the efficacy results from the main studies supporting the present
application. These summaries should be read in conjunction with the discussion on clinical efficacy
as well as the benefit risk assessment (see later sections).
Table 19 Summary of Efficacy - Study 010
Title: A Multicenter, Randomized, Double-Blind, Placebo-Controlled Study to Determine the Efficacy and
Safety of SYR110322 (SYR-322) Compared with Placebo in Subjects with Type 2 Diabetes
Study identifier SYR-322-PLC-010 (also referred to as Study 010)
Design
Phase III, randomized, double-blind, placebo-controlled, parallel-group
Duration of Main phase: 26 weeks
Duration of Run-in phase: 4 weeks (single-blind placebo)
Duration of Extension phase: 4 years via Study SYR-322-OLE-012 (eligible subjects
only)
Hypothesis Superiority analysis of alogliptin treatment compared with placebo as measured by
glycosylated hemoglobin (HbA1c) change from baseline (Day 1) to Week 26
Treatment
groups
Placebo 26-week treatment with placebo once daily (QD), 65
subjects randomized
Alogliptin 12.5 mg (A12.5) 26-week treatment with A12.5 QD, 133 subjects
randomized

CHMP assessment report
EMA/CHMP/207158/2013 Page 83/136
Alogliptin 25 mg (A25) 26-week treatment with A25 QD, 131 subjects randomized
Endpoints and
definitions
Primary endpoint Confirmatory HbA1c change from baseline to Week 26
Key secondary
endpoint Exploratory
Fasting plasma glucose (FPG) change from
baseline to Week 26
Other endpoint Exploratory Body weight change from baseline to Week 26
Database lock 26 July 2007
Results and Analysis
Analysis description
Primary Endpoint Analysis: An analysis of covariance (ANCOVA) model using
last observation carried forward (LOCF) values was performed, with study treatment
and geographic region as class variables and duration of T2DM and baseline HbA1c
as continuous covariates. The A25 dose was compared with placebo at the 2-sided
0.05 significance level using a contrast derived from the primary model. If this test
result was statistically significant, the A12.5 dose was evaluated in a similar fashion.
Analysis population
and time point
description
Full analysis set (FAS), which was defined as all randomized subjects who received at
least 1 dose of double-blind study drug, had a baseline value, and had at least one post
baseline value.
Descriptive statistics
and estimate
variability
Treatment group Placebo A12.5 A25
Number of subjects 63 131 128
LS mean change -0.02 -0.56 -0.59
SE 0.094 0.065 0.066
Effect estimate per
comparison
Primary endpoint:
HbA1c (%)
Comparison group A12.5 vs Placebo A25 vs Placebo
LS mean
difference -0.54 -0.57
95% CI -0.76, -0.31 -0.80, -0.35
p-value <0.001 <0.001
Notes None.
Analysis description Key Secondary Endpoint Analysis: Same as primary model except with baseline
FPG value in place of HbA1c as covariate.
Analysis population
and time point
description
FAS
Descriptive statistics
and estimate
variability
Treatment group Placebo A12.5 A25
Number of subjects 64 132 129
LS mean change 0.628 -0.571 -0.913
SE 0.2910 0.2010 0.2038
Effect estimate per
comparison
Secondary
endpoint:
FPG (mmol/L)
Comparison group A12.5 vs Placebo A25 vs Placebo
LS mean
difference -1.199 -1.541
95% CI -1.896, -0.503 -2.243, -0.839
p-value <0.001 <0.001
Notes None.
Analysis description Other Endpoint Analysis: Same as primary model except with baseline body weight
value in place of HbA1c as covariate.
Analysis population
and time point
description
FAS

CHMP assessment report
EMA/CHMP/207158/2013 Page 84/136
Descriptive statistics
and estimate
variability
Treatment group Placebo A12.5 A25
Number of subjects 63 126 125
LS mean change 0.18 -0.09 -0.22
SE 0.368 0.258 0.259
Effect estimate per
comparison
Other endpoint:
body weight (kg)
Comparison group A12.5 vs Placebo A25 vs Placebo
LS mean
difference -0.28 -0.40
95% CI -1.16, 0.61 -1.29, 0.49
p-value 0.539 0.379
Notes None.
Table 20.Summary of Efficacy - Study 008
Title: A Multicenter, Randomized, Double-Blind, Placebo-Controlled Study to Determine the Efficacy and
Safety of SYR110322 (SYR-322) When Used in Combination with Metformin in Subjects with Type 2 Diabetes
Study identifier SYR-322-MET-008 (also referred to as Study 008)
Design
Phase III, randomized, double-blind, placebo-controlled, parallel-group
Duration of Main phase: 26 weeks
Duration of Run-in phase: 4 weeks (single-blind placebo and open-label metformin
1500 mg or MTD)
Duration of Extension phase: 4 years via Study SYR-322-OLE-012 (eligible subjects
only)
Hypothesis Superiority analysis of alogliptin combination treatment with metformin compared with
metformin alone as measured by HbA1c change from baseline to Week 26
Treatment
groups
Placebo 26-week treatment with placebo QD as add-on to metformin
1500 mg or MTD, 104 subjects randomized
Alogliptin 12.5 mg (A12.5) 26-week treatment with A12.5 QD as add-on to metformin
1500 mg or MTD, 213 subjects randomized
Alogliptin 25 mg (A25) 26-week treatment with A25 QD as add-on to metformin
1500 mg or MTD, 210 subjects randomized
Endpoints and
definitions
Primary endpoint Confirmatory HbA1c change from baseline to Week 26
Key secondary
endpoint Exploratory FPG change from baseline to Week 26
Other endpoint Exploratory Body weight change from baseline to Week 26
Database lock 05 July 2007
Results and Analysis
Analysis description
Primary Endpoint Analysis: An ANCOVA model using LOCF values was
performed, with study treatment and geographic region as class variables and
baseline metformin dose and baseline HbA1c as continuous covariates. The A25
dose was compared with placebo at the 2-sided 0.05 significance level using a
contrast derived from the primary model. If this test result was statistically
significant, the A12.5 dose was evaluated in a similar fashion.
Analysis population
and time point
description
FAS, which was defined as all randomized subjects who received at least 1 dose of
double-blind study drug, had a baseline value, and had at least one post baseline
value.
Descriptive statistics Treatment group Placebo A12.5 A25

CHMP assessment report
EMA/CHMP/207158/2013 Page 85/136
and estimate
variability
Number of
subjects 103 210 203
LS mean change -0.10 -0.61 -0.59
SE 0.076 0.053 0.054
Effect estimate per
comparison
Primary endpoint:
HbA1c (%)
Comparison group A12.5 vs Placebo A25 vs Placebo
LS mean
difference -0.50 -0.48
95% CI -0.68, -0.32 -0.67, -0.30
p-value <0.001 <0.001
Notes None.
Analysis description Key Secondary Endpoint Analysis: Same as primary model except with baseline
FPG value in place of HbA1c as covariate.
Analysis population
and time point
description
FAS
Descriptive statistics
and estimate
variability
Treatment group Placebo A12.5 A25
Number of
subjects 104 211 204
LS mean change 0.001 -1.039 -0.963
SE 0.1971 0.1382 0.1403
Effect estimate per
comparison
Secondary
endpoint:
FPG (mmol/L)
Comparison group A12.5 vs Placebo A25 vs Placebo
LS mean
difference -1.040 -0.964
95% CI -1.514, -0.567 -1.439, -0.488
p-value <0.001 <0.001
Notes None.
Analysis description Other Endpoint Analysis: Same as primary model except with baseline body
weight value in place of HbA1c as covariate.
Analysis population
and time point
description
FAS
Descriptive statistics
and estimate
variability
Treatment group Placebo A12.5 A25
Number of
subjects 103 206 198
LS mean change -0.39 -0.39 -0.67
SE 0.274 0.194 0.198
Effect estimate per
comparison
Other endpoint:
body weight (kg)
Comparison group A12.5 vs Placebo A25 vs Placebo
LS mean
difference 0.00 -0.28
95% CI -0.66, 0.66 -0.94, 0.38
p-value 0.996 0.407
Notes None.
Table 21.Summary of Efficacy - tudy 009
Title: A Multicenter, Randomized, Double-Blind, Placebo-Controlled Study to Determine the Efficacy and
Safety of SYR110322 (SYR-322) When Used in Combination with Pioglitazone in Subjects with Type 2
Diabetes

CHMP assessment report
EMA/CHMP/207158/2013 Page 86/136
Study identifier SYR-322-TZD-009 (also referred to as Study 009)
Design
Phase III, randomized, double-blind, placebo-controlled, parallel-group
Duration of Main phase: 26 weeks
Duration of Run-in phase:
4 weeks (single-blind placebo and open-label pioglitazone
30 mg or MTD [converted from comparable rosiglitazone
dose, as applicable])
Duration of Extension phase: 4 years via Study SYR-322-OLE-012 (eligible subjects
only)
Hypothesis
Superiority analysis of alogliptin combination treatment with pioglitazone (with or without
metformin or a sulfonylurea) compared with pioglitazone alone (with or without metformin
or a sulfonylurea) as measured by HbA1c change from baseline to Week 26
Treatment
groups
Placebo
26-week treatment with placebo QD as add-on to
pioglitazone 30 mg or MTD (with or without metformin or
a sulfonylurea), 97 subjects randomized
Alogliptin 12.5 mg (A12.5)
26-week treatment with A12.5 QD as add-on to
pioglitazone 30 mg or MTD (with or without metformin or
a sulfonylurea), 197 subjects randomized
Alogliptin 25 mg (A25)
26-week treatment with A25 QD as add-on to pioglitazone
30 mg or MTD (with or without metformin or a
sulfonylurea), 199 subjects randomized
Endpoints and
definitions
Primary endpoint Confirmatory HbA1c change from baseline to Week 26
Key secondary
endpoint Exploratory FPG change from baseline to Week 26
Other endpoint Exploratory Body weight change from baseline to Week 26
Database lock 17 August 2007
Results and Analysis
Analysis description
Primary Endpoint Analysis: An ANCOVA model using LOCF values was
performed, with study treatment, geographic region, and baseline treatment regimen
as class variables and baseline pioglitazone dose and baseline HbA1c as continuous
covariates. The A25 dose was compared with placebo at the 2-sided 0.05
significance level using a contrast derived from the primary model. If this test result
was statistically significant, the A12.5 dose was evaluated in a similar fashion.
Analysis population
and time point
description
FAS, which was defined as all randomized subjects who received at least 1 dose of
double-blind study drug, had a baseline value, and had at least one post baseline
value.
Descriptive statistics
and estimate
variability
Treatment group Placebo A12.5 A25
Number of
subjects 95 196 195
LS mean change -0.19 -0.66 -0.80
SE 0.081 0.056 0.056
Effect estimate per
comparison
Primary endpoint:
HbA1c (%)
Comparison group A12.5 vs Placebo A25 vs Placebo
LS mean
difference -0.47 -0.61
95% CI -0.67, -0.28 -0.80, -0.41
p-value <0.001 <0.001
Notes None.
Analysis description Key Secondary Endpoint Analysis: Same as primary model except with baseline
FPG value in place of HbA1c as covariate.

CHMP assessment report
EMA/CHMP/207158/2013 Page 87/136
Analysis population
and time point
description
FAS
Descriptive statistics
and estimate
variability
Treatment group Placebo A12.5 A25
Number of
subjects 97 196 197
LS mean change -0.318 -1.092 -1.103
SE 0.2117 0.1490 0.1484
Effect estimate per
comparison
Secondary
endpoint:
FPG (mmol/L)
Comparison group A12.5 vs Placebo A25 vs Placebo
LS mean
difference -0.775 -0.785
95% CI -1.285, -0.265 -1.293, -0.277
p-value 0.003 0.003
Notes None.
Analysis description Other Endpoint Analysis: Same as primary model except with baseline body
weight value in place of HbA1c as covariate.
Analysis population
and time point
description
FAS
Descriptive statistics
and estimate
variability
Treatment group Placebo A12.5 A25
Number of
subjects 94 193 189
LS mean change 1.04 1.46 1.09
SE 0.329 0.230 0.232
Effect estimate per
comparison
Other endpoint:
body weight (kg)
Comparison group A12.5 vs Placebo A25 vs Placebo
LS mean
difference 0.42 0.05
95% CI -0.37, 1.22 -0.74, 0.84
p-value 0.294 0.900
Notes None.
Table 22. Summary of Efficacy - Sudy 011
Title: A Multicenter, Randomized, Double-Blind, Placebo-Controlled Study to Determine the Efficacy and
Safety of SYR110322 (SYR-322) When Used in Combination with Insulin in Subjects with Type 2 Diabetes
Study identifier SYR-322-INS-011 (also referred to as Study 011)
Design
Phase III, randomized, double-blind, placebo-controlled, parallel-group
Duration of Main phase: 26 weeks
Duration of Run-in phase: 4 weeks (single-blind placebo with subject’s usual insulin
with or without metformin)
Duration of Extension phase: 4 years via Study SYR-322-OLE-012 (eligible subjects
only)
Hypothesis
Superiority analysis of alogliptin combination treatment with insulin (with or without
metformin) compared with insulin alone (with or without metformin) as measured by
HbA1c change from baseline to Week 26
Treatment
groups Placebo
26-week treatment with placebo QD as add-on to insulin
(with or without metformin), 130 subjects randomized

CHMP assessment report
EMA/CHMP/207158/2013 Page 88/136
Alogliptin 12.5 mg (A12.5) 26-week treatment with placebo QD as add-on to insulin
(with or without metformin), 131 subjects randomized
Alogliptin 25 mg (A25) 26-week treatment with placebo QD as add-on to insulin
(with or without metformin), 129 subjects randomized
Endpoints and
definitions
Primary endpoint Confirmatory HbA1c change from baseline to Week 26
Key secondary
endpoint Exploratory FPG change from baseline to Week 26
Other endpoint Exploratory Body weight change from baseline to Week 26
Database lock 21 June 2007
Results and Analysis
Analysis description
Primary Endpoint Analysis: An ANCOVA model using LOCF values was
performed, with study treatment, geographic region, and baseline treatment regimen
as class variables and baseline daily insulin dose and baseline HbA1c as continuous
covariates. The A25 dose was compared with placebo at the 2-sided 0.05
significance level using a contrast derived from the primary model. If this test result
was statistically significant, the A12.5 dose was evaluated in a similar fashion.
Analysis population
and time point
description
FAS, which was defined as all randomized subjects who received at least 1 dose of
double-blind study drug, had a baseline value, and had at least one post baseline
value.
Descriptive statistics
and estimate
variability
Treatment group Placebo A12.5 A25
Number of
subjects 126 130 126
LS mean change -0.13 -0.63 -0.71
SE 0.077 0.076 0.078
Effect estimate per
comparison
Primary endpoint:
HbA1c (%)
Comparison group A12.5 vs Placebo A25 vs Placebo
LS mean
difference -0.51 -0.59
95% CI -0.72, -0.30 -0.80, -0.37
p-value <0.001 <0.001
Notes None.
Analysis description Key Secondary Endpoint Analysis: Same as primary model except with baseline
FPG value in place of HbA1c as covariate.
Analysis population
and time point
description
FAS
Descriptive statistics
and estimate
variability
Treatment group Placebo A12.5 A25
Number of
subjects 127 131 128
LS mean change 0.324 0.130 -0.651
SE 0.3156 0.3103 0.3156
Effect estimate per
comparison
Secondary
endpoint:
FPG (mmol/L)
Comparison group A12.5 vs Placebo A25 vs Placebo
LS mean
difference -0.194 -0.975
95% CI -1.064, 0.677 -1.854, -0.096
p-value 0.662 0.030
Notes None.

CHMP assessment report
EMA/CHMP/207158/2013 Page 89/136
Analysis description Other Endpoint Analysis: Same as primary model except with baseline body
weight value in place of HbA1c as covariate.
Analysis population
and time point
description
FAS
Descriptive statistics
and estimate
variability
Treatment group Placebo A12.5 A25
Number of
subjects 121 127 124
LS mean change 0.63 0.68 0.60
SE 0.244 0.237 0.241
Effect estimate per
comparison
Other endpoint:
body weight (kg)
Comparison group A12.5 vs Placebo A25 vs Placebo
LS mean
difference 0.05 -0.02
95% CI -0.62, 0.72 -0.70, 0.65
p-value 0.874 0.948
Notes None.
Table 23. Summary of Efficacy - Study 305 (on-going study)
Title: A Multicenter, Randomized, Double-Blind, Active-Controlled Study to Evaluate the Durability of the
Efficacy and Safety of Alogliptin Compared to Glipizide When Used in Combination with Metformin in
Subjects with T2DM
Study identifier SYR-322_305 (also referred to as Study 305)
Design
Phase III, randomized, double-blind, active-controlled, parallel-group
Duration of Main phase: 2 years
Duration of Run-in phase: 4 weeks (single-blind placebo and open-label metformin
1500 mg or MTD)
Duration of Extension phase: Not applicable
Hypothesis
Noninferiority analysis of alogliptin combination treatment with metformin compared with
glipizide combination treatment with metformin as measured by HbA1c change from
baseline to Week 52 (at interim cut) and Week 104 (at study conclusion)
Treatment
groups
Alogliptin 12.5 mg (A12.5) 2-year treatment with A12.5 QD as add-on to metformin
1500 mg or MTD, 880 subjects randomized
Alogliptin 25 mg (A25) 2-year treatment with A25 QD as add-on to metformin
1500 mg or MTD, 885 subjects randomized
Glipizide 5-20 mg* 2-year treatment with glipizide 5-20 mg* QD as add-on to
metformin 1500 mg or MTD, 873 subjects randomized
*titrated between Weeks 3 and 20, at 5-mg increments in 4-week intervals, for subjects with
persistent hyperglycaemia
Endpoints and
definitions
Primary endpoint Noninferiority HbA1c change from baseline to Weeks 52 and
104
Key secondary
endpoint Exploratory FPG change from baseline to Week 52
Other endpoint Exploratory Body weight change from baseline to Week 52
Database lock 10 November 2011 (52-week interim data cut date)
Results and Analysis

CHMP assessment report
EMA/CHMP/207158/2013 Page 90/136
Analysis description
Primary Endpoint Analysis: An ANCOVA model using LOCF values was
performed, with study treatment, geographic region, and study schedule (see notes
below) as class variables and baseline metformin dose and baseline HbA1c as
continuous covariates. The A25 dose was compared with placebo at the 1-sided
0.0125 significance level using a noninferiority margin of 0.3%. If this test result was
statistically significant, the A12.5 dose was evaluated in a similar fashion.
Analysis population
and time point
description
Per protocol set, which was defined as all FAS subjects (ie, those randomized who
received at least 1 dose of double-blind study drug, had a baseline value, and had at
least one post baseline value) who had no major protocol violations.
Descriptive statistics
and estimate
variability
Treatment group A12.5 A25 Glipizide
Number of
subjects 542 537 509
LS mean change -0.62 -0.61 -0.52
SE 0.029 0.030 0.030
Effect estimate per
comparison
Primary endpoint:
HbA1c (%)
Comparison group A12.5 vs Glipizide A25 vs Glipizide
LS mean
difference -0.10 -0.09
98.75% CI -infinity, -0.002 -infinity, 0.004
p-value N/A N/A
Notes
Subjects entered the Screening Period via 1 of 2 study schedules:
- Schedule A for subjects with HbA1c of 7.0% to 9.0% while on metformin
≥1500 mg or MTD. These subjects directly entered the run-in phase.
- Schedule B for subjects with HbA1c of 7.5% to 10.0% while on metformin
<1500 mg with no MTD documentation. These subjects had to achieve HbA1c of
7.0% to 9.0% while on metformin ≥1500 mg or MTD before entering the run-in
phase.
Analysis description
Key Secondary Endpoint Analysis: Same as primary model except with baseline
FPG value in place of HbA1c as covariate and at the 0.05 2-sided significance level
for statistical difference rather than for non-inferiority.
Analysis population
and time point
description
FAS
Descriptive statistics
and estimate
variability
Treatment group A12.5 A25 Glipizide
Number of
subjects 867 867 858
LS mean change -0.277 -0.399 0.049
SE 0.0678 0.0678 0.0681
Effect estimate per
comparison
Secondary
endpoint:
FPG (mmol/L)
Comparison group A12.5 vs Glipizide A25 vs Glipizide
LS mean
difference -0.326 -0.448
95% CI -0.5147, -0.1378 -0.6368, -0.2597
p-value <0.001 <0.001
Notes None.
Analysis description
Other Endpoint Analysis: Same as primary model except with baseline body
weight value in place of HbA1c as covariate and at the 0.05 2-sided significance
level for statistical difference rather than for non-inferiority.
Analysis population
and time point
description
FAS
Descriptive statistics
and estimate
variability
Treatment group A12.5 A25 Glipizide
Number of
subjects 867 868 862
LS mean change -0.64 -0.91 0.89

CHMP assessment report
EMA/CHMP/207158/2013 Page 91/136
SE 0.117 0.117 0.117
Effect estimate per
comparison
Secondary
endpoint:
body weight (kg)
Comparison group A12.5 vs Glipizide A25 vs Glipizide
LS mean
difference -1.52 -1.80
95% CI -1.846, -1.198 -2.122, -1.473
p-value <0.001 <0.001
Notes None.
Table 24. Summary of Efficacy - Study 322OPI-004
Title: A Multicenter, Randomized, Double-Blind Study to Determine the Efficacy and Safety of the Addition of
SYR-322 25 mg versus Dose Titration from 30 mg to 45 mg of ACTOS® Pioglitazone HCl in Subjects with
Type 2 Diabetes Mellitus Who Have Inadequate Control on a Combination of Metformin and 30 mg of
Pioglitazone HCl Therapy
Study identifier 01-06-TL-322OPI-004 (also referred to as Study 322OPI-004)
Design
Phase III, randomized, double-blind, parallel-group
Duration of Main phase: 52 weeks
Duration of Run-in phase: 4 weeks (open-label pioglitazone 30 mg with metformin
1500 mg or MTD)
Duration of Extension phase: Not applicable
Hypothesis
Noninferiority analysis of alogliptin combination treatment with pioglitazone (plus
background metformin) compared with pioglitazone titration (plus background metformin)
as measured by HbA1c change from baseline to Weeks 26 and 52
Treatment
groups
Alogliptin 25 mg (A25)
52-week treatment with A25 QD as add-on to pioglitazone
30 mg (P30) and metformin 1500 mg or MTD, 404 subjects
randomized
Pioglitazone 45 mg (P45) 52-week treatment with P45 QD as add-on to metformin
1500 mg or MTD, 399 subjects randomized
Endpoints and
definitions
Primary endpoint Noninferiority HbA1c change from baseline to Weeks 26 and
52
Key secondary
endpoint Exploratory FPG change from baseline to Weeks 26 and 52
Other endpoint Exploratory Body weight change from baseline to Weeks 26
and 52
Database lock 09 July 2009
Results and Analysis
Analysis description
Primary Endpoint Analysis: An ANCOVA model using LOCF values was
performed, with study treatment, geographic region, and study schedule (see notes
below) as class variables and baseline metformin dose and baseline HbA1c as
continuous covariates. At Week 26, the A25+P30 dose was compared with P45 at the
1-sided 0.025 significance level using a non-inferiority margin of 0.3%. If this test
result was statistically significant, Week 52 was evaluated in a similar fashion.
Analysis population
and time point
description
Per protocol set, which was defined as all FAS subjects (ie, those randomized who
received at least 1 dose of double-blind study drug, had a baseline value, and had at
least one post baseline value) who had no major protocol violations.
Descriptive statistics
and estimate
variability
Week 52
Treatment group A25+P30 P45
Number of
subjects 303 306
LS mean change -0.70 -0.29

CHMP assessment report
EMA/CHMP/207158/2013 Page 92/136
SE 0.048 0.048
Effect estimate per
comparison Week 52
Primary endpoint:
HbA1c (%)
Comparison group A25+P30 vs P45
LS mean
difference -0.42
97.5% CI -infinity, -0.28
p-value N/A
Notes
Subjects entered the Screening Period via 1 of 2 study schedules:
- Schedule A for subjects with HbA1c of 7.0% to 10.0% while on a stable (2 months)
regimen of pioglitazone 30 mg with metformin ≥1500 mg or MTD. These subjects
directly entered the run-in phase.
- Schedule B for subjects with HbA1c ≥7.5% while on metformin with other oral
antidiabetic agent. These subjects entered a 12-week switching period, discontinued
their antidiabetic treatment, were switched to pioglitazone 30 mg with metformin
≥1500 mg or MTD, and had to achieve HbA1c of 7.0% to 10.0% before entering the
run-in phase.
Analysis description
Key Secondary Endpoint Analysis: Same as primary model except with baseline
FPG value in place of HbA1c as covariate and at the 0.05 2-sided significance level
for statistical difference rather than for non-inferiority.
Analysis population
and time point
description
FAS
Descriptive statistics
and estimate
variability
Week 52
Treatment group A25+P30 P45
Number of
subjects 399 396
LS mean change -0.813 -0.207
SE 0.1048 0.1051
Effect estimate per
comparison Week 52
Secondary
endpoint:
FPG (mmol/L)
Comparison group A25+P30 vs P45
LS mean
difference -0.606
95% CI -0.897, -0.315
p-value <0.001
Notes None.
Analysis description
Other Endpoint Analysis: Same as primary model except with baseline body
weight value in place of HbA1c as covariate and at the 0.05 2-sided significance
level for statistical difference rather than for non-inferiority.
Analysis population
and time point
description
FAS
Descriptive statistics
and estimate
variability
Week 52
Treatment group A25+P30 P45
Number of
subjects 395 394
LS mean change 1.10 1.60
SE 0.194 0.194
Effect estimate per
comparison Week 52
Other endpoint:
body weight (kg)
Comparison group A25+P30 vs P45
LS mean
difference -0.50
95% CI -1.03, 0.04
p-value 0.071
Notes None.

CHMP assessment report
EMA/CHMP/207158/2013 Page 93/136
2.5.3. Analysis performed across trials (pooled analyses and meta-analysis)
2.5.3.1. Longer term studies
The persistence of efficacy of combination treatment including alogliptin has been demonstrated for
up to 52 weeks in Studies 305 and 322OPI-004, showing the durability of the glucose-lowering
effect as assessed by HbA1c reduction (see above).
In study 305, at each of the post-baseline study visits, decreases in HbA1c were generally similar
among the treatment groups, and MET+alogliptin 25 mg was found to be non-inferior to
MET+glipizide.
In study 322OPI-004, significantly greater decreases in HbA1c were observed in the MET+A25+P30
treatment group vs the MET+P45 treatment group (p<0.001 at all time-points). At Week 52, the LS
mean difference between treatment groups indicated non-inferiority of MET+A25+P30 to
MET+P45. Furthermore, results at Week 52 also indicated statistical superiority of the
MET+A25+P30 group to the MET+P45 group.
2.5.3.2. Dose Response
In pharmacodynamic studies, the alogliptin 25 mg dose achieved optimal DPP-4 inhibition and
increases in active GLP-1 compared with the 12.5 mg dose. For doses greater than 25 mg, no
additional benefit in DPP-4 inhibition or GLP-1 levels was observed, indicating that the 25 mg dose
is the optimal dose to achieve therapeutic effect. In the phase 2 dose-ranging study (003), LS mean
differences from placebo at Day 85 were statistically significant for alogliptin doses ≥ 12.5 mg for
HbA1c and ≥ 25 mg for FPG, with no additional HbA1c reduction seen at doses greater than 25 mg.
Across the 5 main phase III, 26-week placebo-controlled studies, alogliptin 25 mg generally
provided more substantial HbA1c reductions compared with alogliptin 12.5 mg.
The differences in efficacy were consistently more apparent in the 3 studies with the relatively
higher baseline HbA1c (i.e. Studies 007, 009, and 011).
In the 2 main studies evaluating alogliptin add-on to MET (008 and 305), differentiation in terms of
HbA1c reduction between both alogliptin doses was less apparent, likely related to the lower mean
baseline HbA1c (7.9% and 7.6%, respectively). In contrast, a good dose response for alogliptin
add-on to MET was evident in 2 relevant treatment arms in supportive study 322OPI-001, in which
alogliptin 25 mg showed greater reductions in HbA1c compared with alogliptin 12.5 mg (-0.90%
vs -0.64%), in a setting with a higher mean baseline HbA1c (8.5%).
Across the clinical program, alogliptin 25 mg generally showed a greater response in secondary
endpoints (analysis of HbA1c by baseline HbA1c values, clinical response, change from baseline in
FPG, and hyperglycaemia) compared with alogliptin 12.5 mg.
To evaluate the consistency of HbA1c reduction across multiple subpopulations, efficacy was
assessed for subgroups of subjects defined by various baseline demographic factors. In
consideration of limited sample sizes of some of these subgroups in individual studies, pooled
analyses were conducted to supplement those completed in the individual studies for sex, age,
race, BMI, baseline HbA1c, and renal function categories.

CHMP assessment report
EMA/CHMP/207158/2013 Page 94/136
For the pooled analyses, data were integrated from 4 of the main studies (010, 007, 008, and 009).
Study 011 was excluded from the pooled analysis because of differences in the study design
(different randomization ratio) and in the study population (mean baseline HbA1c, mean disease
duration). A total of 1845 subjects are included in these post hoc pooled analyses.
Results indicate that the placebo-adjusted treatment difference in HbA1c is independent of sex and
BMI. No clinically meaningful differences were observed between race categories. A tendency for
greater efficacy in elderly subjects is observed. In addition greater efficacy observed in the
alogliptin 25 mg group.
2.5.4. Clinical studies in special populations
No specific subpopulation investigations have been conducted with alogliptin/metformin; however,
this FDC product is expected to have a similar efficacy profile as the individual components, in view
of the evidence provided in the bioequivalence study with the FDC and the pharmacokinetic and
pharmacodynamic studies with the individual components.
2.5.4.1. Elderly
A total of 239 subjects ≥65 years were treated in the placebo-controlled 3 Studies 008, 009, and
011. Of these, 32 subjects were ≥75 years. A total of 184 subjects ≥65 years, 23 subjects
≥75 years were treated with alogliptin specifically (see table 23).
Table 25 Change From baseline in Mean HbA1c (%) at Week 26 by Demographic
Subgroup Age (LOCF, FAS) (008, 009, 011)
Study 008
Add-on to MET
Study 009
Add-on to TZD, With or
Without MET or SU
Study 011
Add-on to Insulin, With or
Without MET
Subgroup
Placebo
N=104
A12.5
N=213
A25
N=207
Placebo
N=97
A12.5
N=197
A25
N=199
Placebo
N=129
A12.5
N=131
A25
N=129
Age
65 years -0.10
(n=82)
-0.62
(n=170)
-0.60
(n=172)
-0.22
(n=81)
-0.66
(n=164)
-0.80
(n=156)
-0.08
(n=106)
-0.62
(n=111)
-0.73
(n=103)
65 years -0.22
(n=21)
-0.51
(n=40)
-0.52
(n=31)
0.11
(n=14)
-0.71
(n=32)
-0.78
(n=39)
-0.36
(n=20)
-0.71
(n=19)
-0.68
(n=23)
75 years -1.03
(n=3)
-0.24
(n=7)
-0.35
(n=2)
0.03
(n=4)
-0.90
(n=3)
-1.34
(n=5)
-0.60
(n=2)
-0.60
(n=3)
-0.33
(n=3)
In the pooled analysis for alogliptin clinically relevant placebo-adjusted HbA1c mean changes from
baseline were observed for both alogliptin doses ( 0.44% and -0.59% for 12.5 mg; -0.51% and
0.67% for 25 mg) in both age categories (<65 and ≥ 65 years, respectively), with no clinically
meaningful differences observed. There was a relatively small number of patients aged ≥ 75 years.
Nevertheless, in these patients, placebo-adjusted HbA1c changes were -0.418 % for alogliptin 12.5
mg (n=26) and -0.484% for alogliptin 25 mg (n=20). Overall, these results are supportive of the
findings of the primary analyses from each of the individual main phase III studies.
In the long-term Studies 305 and 322OPI-004, clinically relevant HbA1c reductions were
observed at Week 52 for elderly subjects (≥65 years) who received alogliptin 25 mg, in keeping
with the results of the pooled analysis (-0.58% in Study 305 [n=173] and -0.97% in
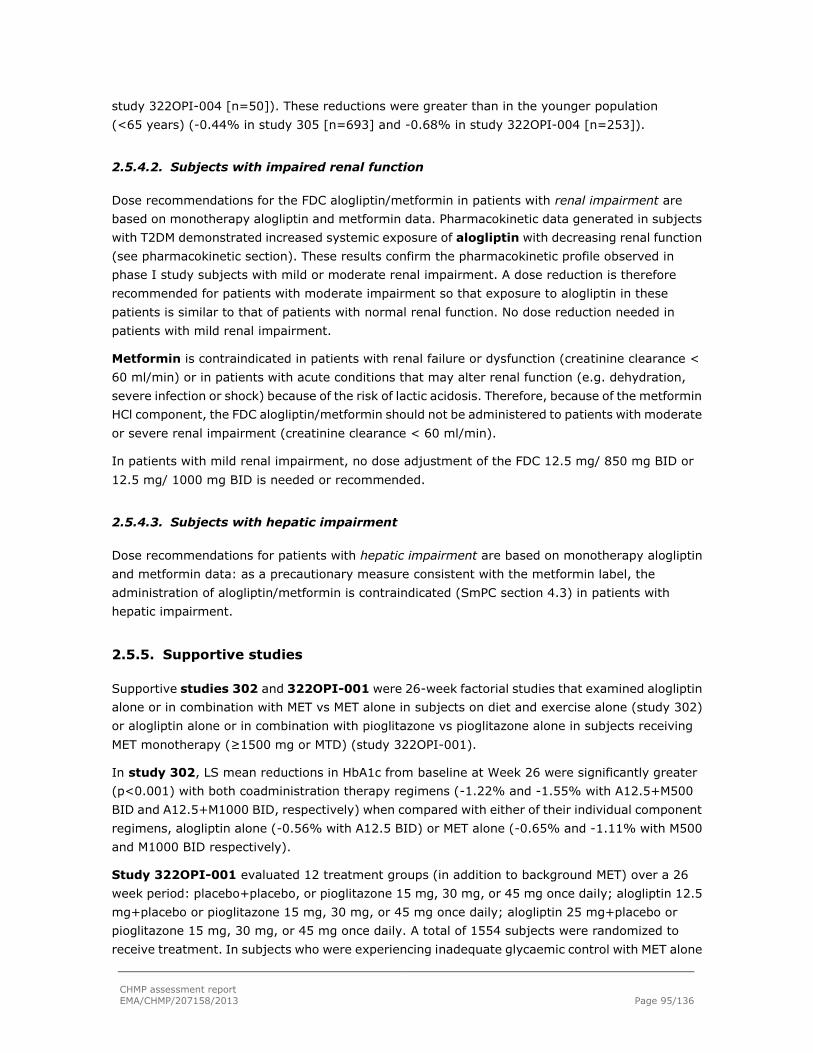
CHMP assessment report
EMA/CHMP/207158/2013 Page 95/136
study 322OPI-004 [n=50]). These reductions were greater than in the younger population
(<65 years) (-0.44% in study 305 [n=693] and -0.68% in study 322OPI-004 [n=253]).
2.5.4.2. Subjects with impaired renal function
Dose recommendations for the FDC alogliptin/metformin in patients with renal impairment are
based on monotherapy alogliptin and metformin data. Pharmacokinetic data generated in subjects
with T2DM demonstrated increased systemic exposure of alogliptin with decreasing renal function
(see pharmacokinetic section). These results confirm the pharmacokinetic profile observed in
phase I study subjects with mild or moderate renal impairment. A dose reduction is therefore
recommended for patients with moderate impairment so that exposure to alogliptin in these
patients is similar to that of patients with normal renal function. No dose reduction needed in
patients with mild renal impairment.
Metformin is contraindicated in patients with renal failure or dysfunction (creatinine clearance <
60 ml/min) or in patients with acute conditions that may alter renal function (e.g. dehydration,
severe infection or shock) because of the risk of lactic acidosis. Therefore, because of the metformin
HCl component, the FDC alogliptin/metformin should not be administered to patients with moderate
or severe renal impairment (creatinine clearance < 60 ml/min).
In patients with mild renal impairment, no dose adjustment of the FDC 12.5 mg/ 850 mg BID or
12.5 mg/ 1000 mg BID is needed or recommended.
2.5.4.3. Subjects with hepatic impairment
Dose recommendations for patients with hepatic impairment are based on monotherapy alogliptin
and metformin data: as a precautionary measure consistent with the metformin label, the
administration of alogliptin/metformin is contraindicated (SmPC section 4.3) in patients with
hepatic impairment.
2.5.5. Supportive studies
Supportive studies 302 and 322OPI-001 were 26-week factorial studies that examined alogliptin
alone or in combination with MET vs MET alone in subjects on diet and exercise alone (study 302)
or alogliptin alone or in combination with pioglitazone vs pioglitazone alone in subjects receiving
MET monotherapy (≥1500 mg or MTD) (study 322OPI-001).
In study 302, LS mean reductions in HbA1c from baseline at Week 26 were significantly greater
(p<0.001) with both coadministration therapy regimens (-1.22% and -1.55% with A12.5+M500
BID and A12.5+M1000 BID, respectively) when compared with either of their individual component
regimens, alogliptin alone (-0.56% with A12.5 BID) or MET alone (-0.65% and -1.11% with M500
and M1000 BID respectively).
Study 322OPI-001 evaluated 12 treatment groups (in addition to background MET) over a 26
week period: placebo+placebo, or pioglitazone 15 mg, 30 mg, or 45 mg once daily; alogliptin 12.5
mg+placebo or pioglitazone 15 mg, 30 mg, or 45 mg once daily; alogliptin 25 mg+placebo or
pioglitazone 15 mg, 30 mg, or 45 mg once daily. A total of 1554 subjects were randomized to
receive treatment. In subjects who were experiencing inadequate glycaemic control with MET alone

CHMP assessment report
EMA/CHMP/207158/2013 Page 96/136
(mean baseline HbA1c values of approximately 8.5%), there were statistically significant
(p≤0.001) decreases from baseline in the LS mean HbA1c levels at Week 26 in subjects treated in
the alogliptin 12.5 mg+pioglitazone and alogliptin 25 mg+pioglitazone groups compared with
pioglitazone alone (LS mean changes from baseline in HbA1c were 0.89%, 1.43%, and -1.42% in
the pioglitazone alone, alogliptin 12.5 mg+pioglitazone, and alogliptin 25 mg+pioglitazone groups,
respectively).
A dose response for alogliptin add-on to MET was evident, in which alogliptin 25 mg showed a
greater reduction in HbA1c compared with alogliptin 12.5 mg (-0.90% vs -0.64%), in a setting with
a higher mean baseline HbA1c.
Another supportive study is Study 402, which at the time of the evaluation of this application was
on-going, a long-term CV outcomes study in subjects with T2DM and recent (within 15 to 90 days)
acute coronary syndrome (ACS). Subjects were included with varying degrees of renal impairment.
The primary endpoint in this study is the major adverse CV event (MACE) composite of CV death,
nonfatal myocardial infarction (MI), and nonfatal stroke. At the time of the CHMP opinion for this
procedure, the clinical phase of this study has been already completed as the calculated number of
events had been reached; a final study report is expected to be made available during the first
quarter of 2014.
Study 012 was a long-term (4 years), open-label extension study of alogliptin (12.5 or 25 mg)
once daily in subjects enrolled in 7 of the controlled phase III studies.
2.5.6. Discussion on clinical efficacy
2.5.6.1. Design and conduct of clinical studies
An extensive number of randomized trials have been performed, including trials with placebo and
active comparators, and in combination with several other antidiabetic agents. For this FDC five
main studies, two supportive studies and the monotherapy trial 010 were considered relevant by
the CHMP.
Analysis of change from baseline in HbA1c (primary endpoint) was based on full analyses set (FAS)
for placebo-controlled studies or per protocol set (PPS) in active-comparator studies using the last
observation carried forward (LOCF) as imputation method for missing data. This approach was
considered acceptable by the CHMP.
More subjects in the placebo group than in the treatment group discontinued the studies,
particularly due to need of hyperglycaemic rescue treatment. This was according to the protocol,
and not considered a protocol deviation (i.e. these patients would still be included in the PPS). This
could lead to an overestimation of the treatment effect. As expected, subjects in the placebo group
who completed the studies had a larger reduction in HbA1c compared to placebo subjects in the
FAS. Therefore, the differences between alogliptin and placebo were less pronounced when the
analyses were performed on the FAS population. However, it is noted that the differences were still
statistically significant.

CHMP assessment report
EMA/CHMP/207158/2013 Page 97/136
2.5.6.2. Efficacy data and additional analyses
Dose selection
In dose finding studies, no additional efficacy was observed at doses greater than 12.5 mg.
However, the inclusion of alogliptin 12.5 mg and 25 mg in the phase III trials is seen as a reasonable
approach. In most of the pivotal studies, the effect difference between alogliptin 12.5 mg and 25 mg
was not large, but the efficacy for alogliptin 25 mg was somewhat more pronounced. Therefore, the
choice for alogliptin daily dose of 25 mg was considered acceptable.
The pharmacokinetic and pharmacodynamics study 101 showed that 12.5 mg alogliptin taken twice
daily pharmacodynamic results did not differ from the ones obtained with 25 mg alogliptin taken
once daily. Furthermore, clinical study 302 showed comparable efficacy results for alogliptin 12.5
mg twice daily, compared to alogliptin 25 mg taken once daily. Therefore, the proposed twice daily
administration regimen for the FDC alogliptin/metformin is found acceptable.
No separate dose response studies were performed with metformin alone. This is acceptable, since
the proposed dose of the metformin component is in line with the SmPC of metformin and with
clinical practice.
Since metformin is contraindicated in patients with renal impairment (creatinine clearance < 60
ml/min), the FDC alogliptin/metformin is contraindicated in patients with creatinine clearance
below 60 ml/min. Therefore, the proposed dosages for the FDC alogliptin/metformin 12.5 mg/ 850
mg BID and 12.5 mg/ 1000 mg BID are acceptable. In the initial application a lower dose of
alogliptin (6.25mg BID) was included, as the applicant was of the opinion that there had been
growing evidence that metformin is both efficacious and safe in patients with greater degree of
renal impairment. The CHMP considered that the new evidence was not strong enough in order to
impact in any way metformin contraindication in patients with severe renal dysfunction.
Consequently the applicant decided to withdraw its application for the combinations that contained
the lower alogliptin dose of 6.25mg BID.
Primary end-point (HbA1c)
In each of the studies, no meaningful differences across treatment groups were observed for any
demographic or baseline characteristic. Change from baseline in HbA1c was the primary endpoint.
For the combination with metformin, relevant for the FDC alogliptin/metformin, two pivotal
studies are submitted (studies 008 and 305). The first study is a 26-week, placebo-controlled study,
while the second is a 2-year active controlled study, with interim 52 week data presented, in which
glipizide was used as the active comparator. In combination with metformin, the treatment effect of
alogliptin 25 mg was -0.48% (95% CI -0.67 to -0.30) in comparison to placebo after 26 weeks. In
the non-inferiority trial 305, both alogliptin 25 mg and glipizide were associated with a clinically
relevant reduction in HbA1c (-0.61% and -0.52%, respectively) after 52 weeks. However, the
glipizide dose in the comparator group was relatively low (mean dose 5.2 mg). This is probably due
to the dose titration algorithm. Following any dose-titration, a subject who experienced
hypoglycaemia was allowed to reduce the dose to as low as 5 mg glipizide (or matching placebo)
and continue the study on that dose. Following down titration, subjects were not allowed to increase
the dose again. With such a low dose of glipizide, the CHMP concluded that non-inferiority of

CHMP assessment report
EMA/CHMP/207158/2013 Page 98/136
alogliptin when compared to SU as add-on therapy to metformin has not been established. In
addition, baseline HbA1c was relatively low in these patients (7.6%). This decreases the power to
detect any differences between treatments.
For the combination with TZD (with or without metformin), pivotal study 009 was submitted.
The results of the patients on metformin therapy were also relevant for the FDC
alogliptin/metformin. In this study, alogliptin is compared to placebo in patients treated with TZD
(with or without metformin). In addition, supportive study 322OPI-004 is submitted. This is a 52
week active controlled study designed to evaluate the efficacy of alogliptin as triple therapy (add-on
to pioglitazone 30 mg and MET), in which efficacy was compared with uptitration of pioglitazone, in
subjects on pioglitazone 30 mg and MET. The combination with TZD and SU was not applied for.
Nevertheless, a small number of patients treated with alogliptin in combination with TZD and SU
was investigated in pivotal study 009. For the combination with TZD (with or without metformin),
alogliptin 25 mg was associated with a reduction in Hba1c of -0.61% (95% CI -0.80 to -0.41) after
26 weeks in comparison to placebo. Treatment effects were clinically relevant for alogliptin 25 mg
in combination with TZD only (-0.49%) and in combination with TZD and metformin (-0.72%). In
addition, in study 322OPI-004, the effects of adding alogliptin 25 mg were not inferior compared to
the ones obtained by increasing the dose of pioglitazone from 30 to 45 mg.
For the combination with insulin, study 011 was submitted. The objective of this study was to
evaluate the efficacy of alogliptin administered in combination with insulin as compared with insulin
alone. For the combination with insulin, treatment effect of alogliptin 25 mg was modest, but
clinically relevant (-0.59%; 95% CI -0.80 to -0.37) after 26 weeks. There were no meaningful
differences in the treatment groups in daily insulin dose before and after treatment with alogliptin.
For the FDC alogliptin/metformin, results of the patients on metformin treatment (58.5%; n=227)
were relevant. There were no important differences in the treatment effects of alogliptin 25 mg
between patients with and without metformin. In this study, however, baseline HbA1c values were
relatively high (9.3%). This may have resulted in an overestimation of the treatment effects of
alogliptin on HbA1c. Nevertheless, in the individuals with HbA1c below 8.5%, the effect of alogliptin
25 mg on HbA1c was also clinically relevant (-0.68%). Combinations of alogliptin and insulin with
other oral antidiabetic drugs were not investigated.
A monotherapy study (010) comparing alogliptin with placebo is submitted. Compared to placebo,
alogliptin 25 mg was associated with a reduction in HbA1c of -0.57% (-0.80 to -0.35).
Secondary endpoints
The results of the analysis of the effects of alogliptin on fasting plasma glucose and the need for
rescue therapy were in line with the effects on HbA1c. There were no important effects on weight
and serum lipids. The presented data indicated a tendency towards effects on estimates of
endocrine pancreatic function. However, these effects were not statistically significant in the
majority of the studies. In addition, the serum measures (such as fasting proinsulin, fasting insulin,
proinsulin/insulin ratio, C peptide and HOMA) are only surrogate estimates of pancreatic function.
Therefore no conclusions can be drawn in regard to the effects of alogliptin on the pancreatic
endocrine function. Compared with placebo, alogliptin 25 mg was associated with statistically
significant reductions from baseline inHbA1c and postprandial total triglycerides levels.

CHMP assessment report
EMA/CHMP/207158/2013 Page 99/136
Renal impairment
Renal dose adjustment recommendations of alogliptin 12.5 mg in patients with moderate to severe
renal impairment are based on PK data. In the pivotal trials efficacy was not importantly influenced
by mild or moderate renal impairment.
Metformin is contraindicated in patients with renal failure or dysfunction (creatinine clearance < 60
ml/min) or in patients with acute conditions that may alter renal function (e.g. dehydration, severe
infection or shock) because of the risk of lactic acidosis. For patients with mild renal impairment
(creatinine ≥ 60 ml/min), no dose adjustment is needed.
The CHMP agreed with the applicant’s proposal to contraindicate alogliptin/metformin combination
in patients with moderate-to-severe renal impairment or end-stage renal disease (ESRD) (SmPC
sections 4.3 and 4.4).
Elderly
Diabetes is a disease that is especially prevalent in elderly individuals. In the pivotal trials, the
treatment effect of alogliptin was not lower in patients >65 years compared to patients <65 years.
However, only 2% of the patients treated with alogliptin were >75 years of age (n=124). Therefore,
a study in elderly individuals was performed (study 303). Alogliptin 25 mg and glipizide were
statistically non-inferior. However, baseline mean HbA1c values were relatively low (approximately
7.5%). This decreases the power to detect any differences between treatments. The overall results
from supportive Study 303 showed minimal glycemic improvements in both the alogliptin and
glipizide treatment arms after 52 weeks of treatment in an elderly T2DM population. The fact that
these results were observed in both treatment groups indicates that the observed efficacy response
was largely related to the specific study design, for example, the low baseline HbA1c and the
inclusion of subjects on monotherapy (with a short period of background therapy washout).
Importantly, results of the large pooled analysis of 2234 subjects from the 5 main phase III, 26
week, placebo-controlled studies, demonstrate relevant efficacy in the elderly. In patients aged ≥
75 years alogliptin was associated with a treatment effect of -0.49% (95% CI-1.03, 0.06).
Furthermore, efficacy results from the 2 main Phase III, active-controlled studies (total of 237
elderly subjects) demonstrated that HbA1c reductions at Week 52 were greater in subjects ≥ 65
years compared with subjects <65 years. In these two studies data interpretation in subjects ≥ 75
years who received alogliptin 25 mg is limited by the small numbers of subjects. The HbA1c
reductions at Week 52 for these subjects were -0.29% in Study 305 (n=17) and -1.45% in study
322OPI 004 (n=4).
These results, taken together, suggest that alogliptin is a useful treatment option for elderly
patients.
Effect of race
The majority of the patients were white. In the pooled data, the clinical relevance of the treatment
effect of alogliptin in whites is of borderline significance (-0.44% and -0.50%) but still clinically
relevant. In addition, subgroup analyses in the individual main studies demonstrate that the effect
is of borderline relevance for some of the requested indications. Specifically, for alogliptin add-on to
SU (study 007), the treatment effect of alogliptin 25 mg is -0.38%. For alogliptin add-on to
CHMP assessment report
EMA/CHMP/207158/2013 Page 100/136
metformin (study 008), the treatment effect of alogliptin 25 mg is -0.36%. However, in these
studies the differences between the races were small. In addition, the differences between the races
were even less pronounced in the other studies.
Initial combination studies
In an initial combination study, both coadministration therapy regimens of alogliptin plus metformin
(A12.5+ M500 BID and A12.5+ M1000 BID) resulted in larger reductions in HbA1c compared to
their individual component regimens of alogliptin alone or metformin alone. Alogliptin 12.5 BID
provided similar glycaemic control compared with alogliptin 25 once daily. In patients inadequately
controlled with metformin, each individual combination of Alogliptin+Pioglitazone achieved larger
reductions in HbA1c at Week 26 compared with the corresponding alogliptin and pioglitazone doses
given alone. These differences were clinically relevant. The initial combination of alogliptin and
pioglitazone was associated with a reduction in HbA1c that was larger than that with alogliptin and
pioglitazone monotherapy. These data provide further support for the use of alogliptin in
combination with metformin and/or pioglitazone, but initial combination therapy is not an indication
requested by the applicant.
2.5.7. Conclusions on the clinical efficacy
In combination with metformin, the treatment effect of alogliptin 25 mg was -0.48% (95% CI -0.67
to -0.30) in comparison to placebo after 26 weeks. Overall, efficacy of alogliptin was found to be
modest with an effect size with regard to lowering of HbA1C of about 0.5% - 0.6% as add-on
therapy, but still being statistically significant and clinically relevant.
Since the bioequivalence of alogliptin/metformin 6.25 mg + 1000 mg tablet and 12.5 mg+1000 mg
tablet to individual alogliptin and metformin tablets was demonstrated it can be considered that the
efficacy of aloglitin/metformin fixed dose combination has been established.
Due to the low dose of glipizide and the low baseline HbA1c (study 305), non-inferiority of alogliptin
compared to glipizide as add-on therapy to metformin has not been established.
Efficacy of the combination was further investigated specifically in subgroups, and found to be
satisfactory, in caucasian patients, in elderly patients and patients with mild renal insufficiency.
2.6. Clinical safety
2.6.1. Submitted data
2.6.1.1. Alogliptin/metformin
The safety of the FDC alogliptin plus metformin was studied in the five main studies (008, 009, 011,
305 and 322OPI-004) and the 2 supporting studies (302 and 322OPI-001) for the FDC
alogliptin/metformin. Because of the differences in background therapies, treatment groups, and
lengths of exposure, the safety data were not pooled but are summarized individually by study.

CHMP assessment report
EMA/CHMP/207158/2013 Page 101/136
Alogliptin data were pooled to allow for an opportunity to detect rare events and potential safety
signals(see below).
2.6.1.2. Alogliptin
Data from all 55 clinical studies that comprise this MAA submission were used in the overall
evaluation of safety. However, the focus of the safety assessment involves the Controlled Phase II
and III Study Group and the main phase III studies.
Safety data from the 12 completed phase 2 and 3 studies (003, 007, 008, 009, 010, 011, 301, 302,
303, 322OPI-004, 322OPI-001, and 322OPI-002) and one phase III study (305), on-going at the
time of evaluation of this application, were pooled into the Controlled Phase II and III Study Group.
As the patient populations enrolled into these studies best represent the intended use of alogliptin,
results from this Controlled Phase II and III Study Group are the primary focus of the evaluation of
clinical safety. These data were pooled to allow for an opportunity to detect rare events and
potential safety signals. Studies are also assessed individually for specific indications, as
appropriate. In addition, data from four of the main phase III placebo-controlled studies (007, 008,
009, 010) were pooled to evaluate the safety data from a pool of main studies relevant to the
proposed indications.
Study 012 is an uncontrolled safety extension study and the CV outcome (study 402) study is
evaluating a specific subpopulation of patients with T2DM and recent ACS. Therefore, these two
studies are excluded from the pooled data and are discussed separately, as appropriate.
2.6.1.3. Metformin
The safety profile of metformin has been well established based on pre and post approval clinical
studies. Metformin safety information presented in this section was sourced from the harmonized
metformin SmPCs, as well as scientific literature, as appropriate. Scientific literature was obtained
through a search conducted in the following data-bases: Ovid Medline, Embase, and Biosis.
2.6.2. Patient exposure
2.6.2.1. Alogliptin/metformin
A total of 7150 subjects were randomized in the seven alogliptin/metformin studies. Across these
studies, 4201 received alogliptin in combination with metformin either as a background medication
or as one of the initial combination treatment assignments (Table 26).

CHMP assessment report
EMA/CHMP/207158/2013 Page 102/136
Table 26. Number of Subjects on Combination Therapy (alogliptin plus metformin) – All Phase III Studies
In Studies 008 (add-on to metformin) and 009 (add-on to TZD, with or without metformin or SU),
the majority (≥52.0%) of subjects in each of the alogliptin groups were exposed to treatment for at
least 26 weeks. Mean duration of exposure in the alogliptin 12.5 mg group was 23.78 and 22.93
weeks, respectively, and 23.35 and 23.46 weeks, respectively, in the alogliptin 25 mg group.
Median treatment duration in study 011 (add-on to insulin, with or without metformin) was longer
in the alogliptin groups (25.86 weeks each) than in the placebo group (20.43 weeks), primarily
because twice as many subjects in the placebo required hyperglycaemic rescue compared with the
alogliptin groups. Mean duration of exposure was longer in the alogliptin 12.5 mg and 25 mg groups
(21.86 weeks and 21.33 weeks, respectively) compared with the placebo group (19.01 weeks). In
the alogliptin groups, ≥ 44.2% of subjects were exposed for at least 26 weeks compared with
26.4% in the placebo group.
In study 305 (add-on to metformin), median treatment duration and mean exposure were similar in
all groups. Over 500 subjects in each group (≥ 59.3%) were exposed for at least 1 year.
In study 322OPI-004 (add-on to pioglitazone/metformin), 52-week study, mean duration of
exposure was 43.14 weeks in the MET+A25+P30 group and 39.73 weeks in the MET+P45 group.
The longer duration in the MET+A25+P30 was mainly due to fewer subjects requiring
hyperglycaemic rescue therapy.
In the supportive studies, mean length of exposure was similar across treatment groups (20.56 to
23.78 weeks) in study 302 (initial combination alogliptin/metformin) and, in study 322OPI-001
(combination alogliptin and pioglitazone add-on to metformin), mean exposure was 24.28 weeks in

CHMP assessment report
EMA/CHMP/207158/2013 Page 103/136
the alogliptin 12.5 mg + pioglitazone group and 24.08 weeks in the alogliptin 25 mg+ pioglitazone
group.
2.6.2.2. Alogliptin
The number of subjects exposed to study drug, the duration of exposure, categorized duration of
exposure, and cumulative exposure (subject-years) for subjects who participated in the phase II
and III studies (the Controlled Phase II and III Study Group and Studies 012 and 402) are
summarized below (Table 27). In study 402, all subjects are counted within the alogliptin 25 mg
group, although different doses were assigned according to renal function, such that all subjects
had equivalent exposure. Furthermore, higher numbers of subjects in the overall program were
exposed to alogliptin 25 mg compared with 12.5 mg. Additionally, asymmetrical randomization
schedules in the Phase III studies resulted in a proportionately smaller number of subjects in the
placebo group compared with active comparator and the alogliptin groups. For these reasons,
exposure-corrected rates for adverse events are included in key tables.
Table 27. Exposure by Dose and Duration – All Alogliptin Phase III Studies
Exposure Placebo
Active
Comparator A12.5 mg A25 mg All Alogliptin (a)
Controlled Phase II and III Study Group
N=793 N=2257 N=2476 N=3749 N=6354
Cumulative exposure
(subjects-years) (b)
307.76 1528.22 1453.25 2249.74 3725.98
Number (%) of subjects
exposed for (c)
<6 months 338 (42.6) 471 (20.9) 468 (18.9) 761 (20.3) 1358 (21.4)
≥6 months - <12 months 455 (57.4) 791 (35.0) 1355 (54.7) 1889 (50.4) 3244 (51.1)
≥12 months - <18 months 0 995 (44.1) 653 (26.4) 1099 (29.3) 1752 (27.6)
≥ 18 months 0 0 0 0 0
Study 402
N=1079 N/A N/A N=1070 N/A
Number (%) of subjects
exposed for (c)
<6 months 625 (57.9) -- -- 611 (57.1) --
≥6 months - <12 months 358 (33.2) -- -- 360 (33.6) --
≥12 months - <18 months 93 (8.6) -- -- 95 (8.9) --
≥ 18 months 3 (0.3) -- -- 4 (0.4) --
Study 012
N/A N/A N=1394 N=1926 N/A
Number (%) of subjects
exposed for (c)(d)
<6 months -- -- 47 (3.4) 109 (5.7) --
≥6 months - <12 months -- -- 92 (6.6) 117 (6.1) --
≥12 months - <18 months -- -- 112 (8.0) 168 (8.7) --
≥18 months -- -- 1143 (82.0) 1532 (79.5) --
(a) Combines the 12.5 and 25 mg groups (already shown in the table) with the 6.25, 50, and 100 mg groups (which are not shown in the table). (b) Cumulative exposure in subject-years is defined as the sum of days for all subjects within a grouping divided by 365.25.

CHMP assessment report
EMA/CHMP/207158/2013 Page 104/136
(c) Duration of exposure in days is calculated as date of last dose - date of first dose+1. Last dose date is estimated from data available for subjects continuing study drug dosing in Study 305. Estimated dates are no later than the interim data cutoff date. (d) Cumulative exposure from the double-blind feeder studies (and therefore also counted in the Controlled Phase 2 and 3 Study Group) and the open-label extension.
All subjects in the Controlled Phase II and III Study Group had a diagnosis of T2DM with inadequate
glycaemic control. At the discretion of the investigator, subjects with a major illness or debility were
excluded. Specific prohibited prior and concurrent conditions included New York Heart Association
[NYHA] Class III or IV heart failure (Classes I-IV in study 322OPI-004); angioedema associated
with angiotensin-converting enzyme inhibitors or angiotensin-II receptor blockers (except 301);
treated diabetic gastro-paresis, laser-treated proliferative diabetic retinopathy (except 301),
haemoglobinopathy (due to potential effect on HbA1c determination); history within 6 months
(3 months for Studies 302 and 305) prior to Screening of coronary angioplasty, coronary stent
placement, coronary bypass surgery, or MI; and history within 5 years prior to Screening of cancers
other than squamous cell or basal cell carcinoma of the skin.
Demographic and other baseline characteristics were comparable among the treatment groups.
The majority (79%) of subjects were less than 65 years, with a mean age ranging from 54.9 to 56.3
years, although there was an adequate representation of elderly subjects in the program. A total of
1990 subjects were at least 65 years, 224 were ≥ 75 years, and 2 subjects were ≥ 85 years. Most
(69%) subjects were White. Slightly more than half (54%) of the subjects had a BMI greater than
30. At baseline, mean HbA1c ranged from 8.00% to 8.39% across treatment groups.
Across the main safety pool, approximately 20% of subjects were from Europe, 33% were from the
US or Canada, 23% were from Latin/South America, and 23% were from other regions, mainly
Asia/Pacific countries.
2.6.3. Adverse events
2.6.3.1. Alogliptin/Metformin
The percentages of subjects who experienced a treatment-emergent adverse event (TEAE) in
study 008 were comparable in the alogliptin 12.5 mg (62.9%) and 25 mg (57.0%) groups, and
higher in the placebo group (66.3%). Most (72%) TEAEs were mild in intensity, and no TEAE was
reported by ≥5% subjects overall.
In study 009, an ad-hoc analysis to support alogliptin add-on therapy to pioglitazone showed no
clinically important differences in overall TEAE rates between the add-on to pioglitazone only and
add-on to pioglitazone plus metformin groups. The percentages of subjects who experienced at
least 1 TEAE were similar among treatment groups (placebo 64.9%; alogliptin 12.5 mg 69.7%;
alogliptin 25 mg 72.4%). The most commonly reported TEAEs (experienced by ≥5% of subjects in
the alogliptin 25 mg group) were nasopharyngitis, oedema peripheral, influenza, headache, and
upper respiratory tract infection. The majority (62%) of TEAEs were mild in intensity.
For subjects receiving alogliptin as add-on to insulin (with or without metformin) in study 011, the
percentages of subjects experiencing at least 1 TEAE were comparable across treatment groups
(placebo-control 73.6%; alogliptin 12.5 mg 67.9%; alogliptin 25 mg 66.7%). The most commonly

CHMP assessment report
EMA/CHMP/207158/2013 Page 105/136
reported TEAEs (experienced by ≥5% of subjects in the alogliptin 25 mg group) were urinary tract
infection, diarrhoea, nasopharyngitis, and oedema peripheral. The majority (66%) of TEAEs were
mild in intensity.
In study 305, again the proportions of subjects reporting at least 1 TEAE were comparable across
treatment groups (metformin+alogliptin 12.5 mg, 72.2%; metformin+alogliptin 25 mg, 70.1%;
metformin+glipizide, 71.7%). The most commonly reported TEAEs (experienced by ≥5% of
subjects in the metformin+alogliptin 25 mg group) were upper respiratory tract infection,
nasopharyngitis, headache, and diarrhea. The majority of TEAEs were of mild to moderate
intensity; only 5.4% of subjects reported a TEAE of severe intensity.
In study 322OPI-004, the percentages of subjects who experienced at least 1 TEAE were
comparable between groups (MET+A25+P30 71.5%; MET+P45 68.9%). The most commonly
reported TEAEs in the MET+A25+P30 group were upper respiratory tract infection, nasopharyngitis,
hypertension, and urinary tract infection. The majority (96%) of TEAEs were of mild to moderate
intensity.
Results from study 302, showed that the TEAE profile was generally similar between the alogliptin
once-daily and BID dosing regimens. The overall incidences of on-study TEAEs in the metformin
groups were not dose dependent (metformin 500 mg BID [68.8%] and metformin 1000 mg BID
[62.2%]), and were comparable to the alogliptin+metformin combination groups (alogliptin
12.5 mg+metformin 500 mg BID [63.2%] and alogliptin 12.5 mg+metformin 1000 mg BID
[64.0%]). Most (71%) TEAEs were mild in intensity.
Generally, the pattern of AEs observed in the alogliptin/metformin phase III studies was consistent
with the known safety profile of metformin, previous clinical trials with alogliptin, and conditions
that are expected in this T2DM patient population. The most commonly (≥ 5% of subjects) reported
with combination treatment were nasopharyngitis, upper respiratory tract infection, urinary tract
infection, diarrhoea, headache, oedema peripheral, influenza, hypertension, and arthralgia. Most
TEAEs were considered mild or moderate in intensity and not related to study drug. TEAEs tended
to occur more often within the system organ class (SOC) of infections and infestations and the
incidence was generally similar among treatment groups.
At the CHMP request the applicant has presented a safety data pool of the seven
alogliptin/metformin studies deemed relevant for the safety analyses. The most frequently reported
TEAEs in the metformin only grouping were diarrhea (5.7%) and upper respiratory tract infection
(4.7%). In the alogliptin only groupings, the most frequently reported TEAEs were edema
peripheral, upper respiratory tract infection, dizziness, and hypertension in the A12.5 grouping (all
reported by 4.8% of subjects) and hyperglycaemia (8.8%) and headache (4.7%) in the A25
grouping. In the combination groupings, the most frequently reported TEAEs were nasopharyngitis
(6.2%) and upper respiratory tract infection (5.6%) in the A12.5+MET grouping and upper
respiratory tract infection (6.1%), and nasopharyngitis (5.3%) in the A25+MET grouping (Alo/Met
Day 120 Table 59.3).
The TEAEs with an incidence of ≥3% in any treatment group that occurred more frequently in the
A12.5+MET grouping compared to A12.5 alone were diarrhea, upper respiratory tract infection,
nasopharyngitis, influenza, dyslipidemia, hyperglycaemia, back pain, arthralgia, and headache.
Dyslipidemia was the only common (≥3%) TEAE that occurred in the A12.5+MET grouping at twice
the rate of the A12.5 grouping, but this was not considered to be a clinically relevant difference.

CHMP assessment report
EMA/CHMP/207158/2013 Page 106/136
For alogliptin, TEAEs reported in ≥ 1% of subjects treated with alogliptin (with metformin with or
without pioglitazone or insulin) and occurring with a frequency twice the rate of placebo or active
comparator (with at least 2 subjects if zero in the comparator group) were identified for
consideration as possible adverse drug reactions (ADRs). For metformin, identified ADRs were
those presented in the SmPC. The ADRs identified for each of the single agents and in combination
(dual and triple therapies) are listed below:
headache, diarrhea, pruritus, and myalgia for alogliptin;
lactic acidosis, vitamin B12 deficiency, metallic taste, abdominal pain, diarrhea, loss of
appetite, nausea, vomiting, hepatitis, liver function test abnormalities, erythema, pruritus,
and urticaria for metformin;
pruritus, rash, and musculoskeletal pain for alogliptin/metformin;
nasopharyngitis, abdominal pain, nausea, pruritus, and back pain for alogliptin/metformin
with insulin; and
nasopharyngitis, insomnia, abdominal pain, dyspepsia, gastroesophageal reflux disease,
nausea, muscle spasms, musculoskeletal pain, hypersensitivity, headache, and rash for
alogliptin/metformin with pioglitazone.
2.6.3.2. Alogliptin
An overview of treatment-emergent adverse events (TEAEs), TEAEs that led to discontinuation of
study drug, serious adverse events (SAEs), and deaths for subjects in the Controlled Phase II and
III Study Group is summarized by treatment group in the table below.
Table 28 Overview of TEAEs and SAEs - Controlled Phase II and III Study Group
Number (%) of Subjects
[Events per 100 Subject-Years]
Event Type Placebo N=793
Active Comparator
N=2257 A12.5
N=2476 A25
N=3749
All Alogliptin
(a) N=6354
Any TEAE 514 (64.8) [438.0]
1548 (68.6) [330.1]
1672 (67.5) [333.2]
2497 (66.6) [342.1]
4234 (66.6) [340.5]
Leading to discontinuation of study drug
18 (2.3) [5.8]
132 (5.8) [8.7]
88 (3.6) [6.5]
155 (4.1) [7.1]
248 (3.9) [7.0]
SAEs 25 (3.2)
[9.4]
117 (5.2)
[9.9]
100 (4.0)
[8.5]
175 (4.7)
[9.9]
277 (4.4)
[9.3]
Deaths 0 4 (0.2) [0.3]
5 (0.2) [0.3]
4 (0.1) [0.2]
9 (0.1) [0.2]
(a) Combines the 12.5 and 25 mg groups (already shown in the table) with the 6.25, 50, and 100 mg groups (which are not shown in the table).
The incidence of TEAEs was comparable across treatment groups (68.6% active comparator vs
66.6% alogliptin), although slightly lower in subjects receiving placebo (64.8%). However, in terms
of events per 100 subject-years, the numbers were higher in the placebo group (438.0) than in the
other groups (330.1 active comparator vs 340.5 alogliptin). The incidence of SAEs was slightly
higher in the active comparator group (5.2%) than in the alogliptin 25 mg group (4.7%), the

CHMP assessment report
EMA/CHMP/207158/2013 Page 107/136
alogliptin 12.5 mg group (4.0%) or the placebo group (3.2%). For TEAEs leading to discontinuation
of study drug, more subjects were withdrawn in the active comparator group (5.8%) than in the
alogliptin group (3.9%) or the placebo group (2.3%). The incidence of deaths within the study
period was low, with no deaths reported in the placebo group, 4 deaths in the active comparator
group (0.2%), and 9 deaths (0.1%) in the alogliptin group.
TEAEs reported by ≥3% of subjects in the Controlled Phase II and III Study Group are summarized
in the table below.
Table 29 Common TEAEs (3% of Subjects in any Presented Group) – Controlled
Phase II and III Study Group
Number (%) of Subjects
SOC Preferred Term
Placebo N=793
Active Comparator
N=2257 A12.5
N=2476 A25
N=3749
All Alogliptin
(a) N=6354
Any TEAE (b) 514 (64.8) 1548 (68.6) 1672 (67.5) 2497 (66.6) 4234 (66.6)
Headache 30 (3.8) 113 (5.0) 110 (4.4) 203 (5.4) 321 (5.1)
Upper respiratory tract infection
36 (4.5) 95 (4.2) 121 (4.9) 196 (5.2) 320 (5.0)
Nasopharyngitis 35 (4.4) 99 (4.4) 141 (5.7) 192 (5.1) 334 (5.3)
Urinary tract infection 35 (4.4) 93 (4.1) 102 (4.1) 157 (4.2) 268 (4.2)
Hypertension 26 (3.3) 102 (4.5) 88 (3.6) 147 (3.9) 236 (3.7)
Diarrhea 32 (4.0) 121 (5.4) 91 (3.7) 143 (3.8) 237 (3.7)
Back pain 19 (2.4) 86 (3.8) 86 (3.5) 125 (3.3) 214 (3.4)
Influenza 17 (2.1) 86 (3.8) 67 (2.7) 105 (2.8) 173 (2.7)
Arthralgia 20 (2.5) 72 (3.2) 69 (2.8) 102 (2.7) 171 (2.7)
Dyslipidemia 12 (1.5) 87 (3.9) 35 (1.4) 94 (2.5) 129 (2.0)
Dizziness 19 (2.4) 68 (3.0) 63 (2.5) 84 (2.2) 151 (2.4)
Hyperglycaemia 32 (4.0) 43 (1.9) 10 (0.4) 53 (1.4) 63 (1.0)
Hypoglycaemia 0 80 (3.5) 13 (0.5) 11 (0.3) 24 (0.4)
(a) Combines the 12.5 and 25 mg groups (already shown in the table) with the 6.25, 50, and 100 mg groups (which are not shown in the table). (b) Ordered by descending frequency in the alogliptin 25 mg group.
Percentages of subjects who experienced at least 1 TEAE were comparable among treatment
groups. The most common TEAEs reported in ≥ 5% of subjects treated with alogliptin 25 mg and
more frequently than in subjects who received placebo or active comparators were headache,
nasopharyngitis, and upper respiratory tract infection.
The majority of the TEAEs experienced were considered by the investigator as either mild or
moderate in intensity. No specific TEAE of severe intensity occurred in > 1.0% of subjects in any
group.
TEAEs reported in ≥ 1% of subjects treated with alogliptin 25 mg and occurring with a frequency
twice the rate of placebo or active comparator (with at least 2 subjects if zero in the comparator
group) were identified for consideration as possible adverse drug reactions. Compared with
placebo, events meeting the criteria were upper respiratory tract infection, nasopharyngitis,
influenza, headache, abdominal pain, diarrhoea, nausea, pruritus, rash, back pain, musculoskeletal
pain, and myalgia. Compared with active comparator, events meeting the criteria were
nasopharyngitis, insomnia, abdominal pain, dyspepsia, gastroesophageal reflux disease, nausea,
muscle spasms, musculoskeletal pain, hypersensitivity, headache, and rash.

CHMP assessment report
EMA/CHMP/207158/2013 Page 108/136
2.6.3.3. Metformin
Acute, reversible AEs occur in 5% to 20% of patients taking MET, although it is estimated that less
than 5% of patients cannot tolerate the drug. The most common adverse reactions are
gastrointestinal symptoms such as nausea, vomiting, diarrhea, abdominal pain, and loss of
appetite, which are very common (>10%). Taste disturbance is also listed as a common AE (3%).
The table below shows common AEs reported for metformin.
Table 30 Common AEs (% Patients) (Belcher et al, 2005)
Monotherapy Combination Therapy
Study 1 Study 2 +SU +MET
Pio N=597
MET N=597
Pio N=624
Glic N=626
Pio N=319
MET N=320
Pio N=317
Glic N=313
Diarrhea 3.2 11.1 2.9 3.4 2.5 12.5 1.3 3.8 Nausea 2.3 4.2 4.3 5.1 2.5 3.1 2.2 2.2 Nasopharyngitis 4.2 3.2 6.6 5.3 2.2 2.2 2.2 3.5 Back pain 2.3 2.8 6.4 5.0 1.6 3.8 3.2 2.9 Hypertension 2.5 2.8 3.4 3.8 0.9 3.8 1.9 4.5 Headache 4.4 2.3 8.7 8.9 3.8 3.4 4.1 3.8 Arthralgia 1.5 2.0 7.1 6.2 4.1 2.8 1.6 3.8 Dizziness 2.3 1.8 4.0 6.5 1.3 2.8 2.8 1.3 Edema 6.7 1.8 8.1 4.2 6.9 1.6 6.3 2.2 Hypoglycaemia 1.5 1.3 3.5 10.1 10.7 14.1 1.3 11.2
Glic=gliclazide Note: AEs are listed in order of decreasing frequency for MET monotherapy in Study 1.
2.6.4. Serious adverse events and deaths
2.6.4.1. Alogliptin/metformin
Among the seven pivotal studies in the alogliptin/metformin clinical program, 13 (0.2%) deaths
were reported, of which, 6 occurred in subjects who received alogliptin/metformin. The majority of
deaths (7/13) were CV in nature, and two were considered by the investigator to have a possible
relationship to study drug: sudden death reported study 009 (alogliptin 12.5 mg+pioglitazone 30
mg) and acute pulmonary edema reported in study 305 (alogliptin 25 mg+metformin).
The incidence of serious adverse events (SAEs) from the main studies was low (2.5% [study 009,
alogliptin 12.5 mg] to 6.8% [Study 305, metformin+glipizide]) among the treatment groups, with
no meaningful differences observed with respect to the specific types of events reported in the
treatment groups. With the exception of Study 305 with a larger population, individual SAEs were
not reported by more than 2 subjects in any treatment group. SAEs were reported most frequently
in the cardiac disorder SOC and the infections and infestations SOC. In addition, no apparent dose
response relationship was seen.
The percentage of subjects who experienced a TEAE that led to discontinuation from the main
studies ranged from 0.8% [study 011, alogliptin 12.5 mg] to 8.4% [Study 305,
metformin+glipizide], and were similar among the treatment groups within the studies. There was
no distinct pattern of discontinuations with respect to type of TEAE. Overall, with the exception of
study 305, most TEAEs leading to study drug discontinuation only occurred in 1 subject within each
study.

CHMP assessment report
EMA/CHMP/207158/2013 Page 109/136
2.6.4.2. Alogliptin
Fifteen deaths were reported in the Controlled Phase II and III Study Group (11/6354 in the
alogliptin group [0.17%]; 4/2257 in the active comparator group [0.18%]; and none in the placebo
group). Most deaths were CV in nature. Only 2 of the 15 deaths (both in the alogliptin group) were
considered by the investigator to have a possible relationship to the study drug.
In the CV outcomes study 402, deaths were reported for 26 subjects who received placebo
(26/1079; 2.4%), 17 subjects who received alogliptin (17/1070; 1.6%), and 1 subject whose
treatment assignment is unknown at this time (occurred after the clinical database cut for the
interim analysis). None of these deaths was considered to be related to the administration of study
drug.
A total of 44 deaths occurred in the open-label safety extension study 012 (44/3320; 1.3%). Ten of
the deaths were considered to have a possible relationship to study drug by the investigator.
An additional 5 deaths occurred in the Japanese studies (5/1649; 0.3%), all considered unrelated to
study drug.
Overall, a low and similar percentage of subjects across treatment groups experienced at least
1 SAE (placebo 3.2%; active comparator 5.2%; alogliptin 12.5 mg 4.0%, alogliptin 25 mg 4.7%;
see table below). SAEs were reported most frequently in the cardiac disorder SOC, followed by the
infections and infestations SOC. The incidence of SAEs associated with cardiac disorders was
comparable between the alogliptin 25 mg and active comparator groups (1.0% and 1.2%,
respectively) and greater compared with placebo (0.4%).
A slightly higher percentage of subjects discontinued due to a TEAE in the alogliptin 25 mg group
(4.1%) than the alogliptin 12.5 mg (3.6%) group. There was no distinct pattern of discontinuations
with respect to any type of TEAE. Notably, the percentage of subjects in the alogliptin groups
(3.9%) that discontinued due to a TEAE was lower than for subjects who received active comparator
(5.8%).
2.6.5. Adverse Events of Special Interest
Special-interest TEAEs were predefined based on observations made during the clinical program,
conditions in the T2DM patient population, and known or suspected effects of the drug class.
CV Safety
Alogliptin/metformin
For the five main phase III studies in alogliptin/metformin program, potential CV events were
retrospectively adjudicated. Events adjudicated as MACE (CV death, nonfatal MI, and nonfatal
stroke) are presented in the table below.

CHMP assessment report
EMA/CHMP/207158/2013 Page 110/136
Table 31 Summary of Adjudicated MACE (studies 008, 305, 009, 322OPI-004, and 011)
Study
Number (%) of Subjects
Placebo
n/N (%)
Active
Comparators
n/N (%)
Alogliptin
12.5 mg
n/N (%)
Alogliptin
25 mg
n/N (%)
All
Alogliptin (a)
n/N (%)
008 0/104 N/A 1/213 (0.5) 1/210 (0.5) 2/423 (0.5)
305 N/A 6/873 (0.7) 4/880 (0.5) 5/885 (0.6) 9/1765 (0.5)
009 0/97 N/A 2/197 (1.0) 2/199 (1.0) 4/396 (1.0)
322OPI-004 N/A 3/399 (0.8) N/A 2/404 (0.5) 2/404 (0.5)
011 1/130 (0.8) N/A 1/131 (0.8) 0/129 1/260 (0.4)
(a) Combines the 12.5 and 25 mg groups (already shown in the table) with the 6.25, 50, and 100
mg groups (which are not shown in the table)
The MACE data show no increase in MACE with alogliptin or with alogliptin in combination with
metformin.
Alogliptin
In the Controlled Phase II and III Study Group, the percentages of subjects who experienced a
TEAE from the SOC of cardiac disorders were comparable between the alogliptin 25 mg and active
comparator groups (4.5% and 4.9%, respectively) and greater compared with placebo (2.5%). The
most frequently reported cardiac disorder TEAEs in the alogliptin 25 mg group were angina pectoris
and palpitations. The incidence of SAEs associated with cardiac disorders was comparable between
the alogliptin 25 mg and active comparator groups (1.0% and 1.2%, respectively) and greater
compared with placebo (0.4%). The most frequently reported cardiac disorder SAE in subjects
receiving alogliptin 25 mg was angina pectoris. The incidence of events of hypertension was slightly
higher in the active comparator group (4.5%) than for subjects receiving alogliptin 12.5 mg (3.6%)
and 25 mg (3.9%), but slightly lower in the placebo group (3.3%).
In the adjudicated MACE analysis for the Controlled Phase II and III Study Group, the incidence of
CV death and nonfatal MI was similar and low in the alogliptin (0.1% and 0.2%, respectively) and
active comparator groups (0.1% and 0.3%, respectively), while no subject receiving placebo
reported CV death or nonfatal MI. The incidence of nonfatal stroke was lower for alogliptin-treated
(< 0.1%) subjects than for active comparator-treated (0.2%) and placebo (0.3%) subjects.
Using a Cox Proportional Hazards (CPH) model for adjudicated MACE for the Controlled Phase II and
III Study Group, the hazard ratio of alogliptin against all comparators (placebo and active) was
0.806.
During the procedure, the CHMP did seek clarification on the cases of cardiac failure and myocardial
infarction designated as non-serious. The applicant stated that there were 20 subjects in total in the
alogliptin clinical studies who experienced adverse events (AEs) of cardiac failure/cardiac failure
congestive (14 subjects) or myocardial infarction (6 subjects) in which the event had been
classified by the investigator as non-serious. The applicant did provide details of the definition of
SAEs , which was consistently applied by the investigators in all studies and also provided detailed
case narratives for these 20 subjects; a clinical review of the available data was performed and a
rationale for the non-serious designation has been determined based on that data. The review of

CHMP assessment report
EMA/CHMP/207158/2013 Page 111/136
the 6 subjects with non-serious AEs of myocardial infarction indicated that these were reported by
investigators as such on the basis of ECG findings, suggestive of myocardial ischaemia, rather than
following hospital admission of patients with typical chest pain (and confirmatory cardiac enzyme
rise). The majority of these AEs were supported with sufficient clinical information indicating that
the non-serious classification was appropriate. Similarly, reassuring descriptions were provided by
the applicant for the cases of heart failure, and therefore the CHMP considered this concern as being
resolved.
The CV risk of alogliptin is also being assessed in the CV outcomes Study 402. In that study,
potential CV events are being collected and independently and prospectively adjudicated (by a
blinded cardiovascular endpoint committee [CEC]). The incidence of CV death (1.0%) and nonfatal
stroke (0.5%) in the interim analysis were the same for alogliptin and placebo in this study, with the
incidence of nonfatal MI higher in the placebo group (2.8%) than in the alogliptin group (2.0%).
MACE results from the interim analysis of Study 402 were consistent (hazard ratio alogliptin vs
placebo, 0.814) with the MACE analysis done for the Controlled Phase II and III Group. When
urgent revascularization due to unstable angina is added to adjudicated events, the hazard ratio is
lower at 0.750. The proportion of subjects requiring urgent revascularization was lower in the
alogliptin group (0.4%) than in the placebo group (0.8%).
Metformin
Lactic acidosis is a severe reaction to biguanide therapy and is fatal in 50% of cases, although it is
described as a very rare (<1/10,000) adverse reaction in the harmonized SmPC, with an incidence
of 0.3 cases per 1,000 patient-years. Most cases of lactic acidosis with MET occur exclusively in
patients with contraindication(s) to its use. The risk for developing lactic acidosis is increased in
patients with renal impairment, hepatic impairment, and advancing age. MET therapy is
contraindicated in patients with renal dysfunction characterized by serum creatinine levels ≥ 132.6
μmol/L in men and ≥ 123.8 μmol/L in women; congestive heart failure requiring pharmacologic
treatment; and acute or chronic metabolic acidosis, including diabetic ketoacidosis.
Hypersensitivity reactions
Hypersensitivity reactions are of special interest as they have been associated with the use of other
DPP-4 inhibitors. Administration of some DPP-4 inhibitors has been associated with dose- and
duration-dependent necrotic peripheral skin lesions in monkeys. Such lesions have not been
observed in alogliptin nonclinical studies or in humans.
Preferred terms were identified by severe cutaneous adverse reactions Standardized Medical Query
(SMQ) (narrow-scope terms only), angioedema SMQ (narrow-scope terms only), and anaphylactic
reaction SMQ (narrow-scope terms only).
Overall, the frequency of hypersensitivity reactions was low (≤ 0.8%) and balanced across the
treatment groups. There were no serious hypersensitivity reactions in subjects receiving alogliptin
12.5 mg or 25 mg. 13 patients (0.2%) developed an anaphylactic reaction during alogliptin,
whereas no patient developed an anaphylactic reaction during treatment with placebo. Although
not part of the hypersensitivity reaction event search by SMQ, it is noted that a subject in the Phase

CHMP assessment report
EMA/CHMP/207158/2013 Page 112/136
III program (on alogliptin 25 mg) had an SAE of serum sickness that resulted in discontinuation of
study drug.
While safety results for alogliptin indicate a low incidence of hypersensitivity reactions, a warning is
included in section 4.4 of the SmPC and such reactions are included as an undesirable effect in
section 4.8 of the SmPC. This approach is consistent with the labeling of the other DPP-4 inhibitors.
In addition, hypersensitivity reactions are listed as a potential risk in the RMP.
No subjects in the main alogliptin/metformin studies experienced an SAE within the SMQs described
above. One subject in the alogliptin 25 mg group of study 011 reported an angioedema TEAE
(urticaria) that led to discontinuation. Based on the results from the alogliptin/metformin studies,
there is no evidence to suggest that the combination of alogliptin and metformin is associated with
an increased risk of hypersensitivity reactions, compared to alogliptin therapy alone. As additional
pharmacovigilance activity the cardiovascular outcome study 402 is further investigating
hypersensitivity reactions. The final study report is expected to be in the first quarter of 2014.
Acute Pancreatitis
Alogliptin/metformin
Three subjects from the main phase III studies supporting the combination of alogliptin/metformin
reported an AE of pancreatitis. Two subjects had a preferred term from the pancreatitis acute SMQ
reported as an SAE. None of these subjects were treated with the combination alogliptin plus
metformin.
Based on the results of the alogliptin/metformin main studies, there is no evidence to suggest that
the combination of alogliptin and metformin is associated with an increase in incidence or severity
of acute pancreatitis. However, alogliptin itself is associated with an increased risk (see below).
Alogliptin
No toxicological effects in the pancreas or pancreatic cells were observed in non-clinical studies of
alogliptin. No evidence of pancreatitis was noted in the chronic toxicity studies in rats and dogs or
in a 2-year carcinogenicity studies in mice and rats.
In the Controlled Phase 2 and 3 Study Group, the percentage of subjects reporting at least 1 acute
pancreatitis TEAE was low in all groups, reported in 5 subjects (0.1%) treated with alogliptin 25 mg
and 2 subjects (< 0.1%) with alogliptin 12.5 mg compared with 1 subject (< 0.1%) treated with an
active comparator. Among the 7 alogliptin-treated subjects reporting at least 1 acute pancreatitis
TEAE, 3 subjects had SAEs and 2 subjects had TEAEs (pancreatitis acute and pancreatitis) that led
to study drug discontinuation.
In addition to the 8 subjects in the Controlled Phase 2 and 3 Study Group with pancreatitis TEAEs,
as of 23 August 2011, pancreatitis TEAEs were reported for 6 subjects in study 402 (3 and
3 subjects, respectively, in the alogliptin 25 mg and placebo groups), 13 subjects in study 012 (9
and 4 subjects, respectively, in the alogliptin 25 and 12.5 mg groups), and 2 subjects in the
regional studies (1 subject on placebo in study 308 [China] and 1 subject on alogliptin 25 mg in
OCT-001 [Japan]).

CHMP assessment report
EMA/CHMP/207158/2013 Page 113/136
After adjusting for exposure, rates of pancreatitis adverse events were 0, 0.1, 0.1, and 0.3 events
per 100 subject-years, respectively, for the placebo, active comparator, and alogliptin 12.5 and
25 mg groups in the Controlled Phase 2 and 3 Study Group. These rates are comparable to
epidemiological studies that have shown that diabetic subjects have an increased incidence of 0.05
to 0.4 events per 100 patient-years vs 0.02 to 0.15 events per 100 patient-years in non-diabetic
subjects.
The frequency of pancreatitis events is low but there is an increased risk with alogliptin treatment.
The risk of pancreatitis is indicated in the SmPC section 4.4 (Warnings and Precautions), and acute
pancreatitis is listed as an adverse reaction in Post-marketing Reports in SmPC, Section 4.8.
Moreover, pancreatitis is included as an identified risk in the Risk Management Plan. As additional
pharmacovigilance activity the cardiovascular outcome study 402 is further investigating
pancreatitis. The final study report is expected to be in the first quarter of 2014.
Malignancies
Alogliptin/metformin
A total of 37 subjects from the 5 main Phase III studies supporting the combination of
alogliptin/metformin reported an AE from the malignancy SMQ. The number of malignancy events
reported in the alogliptin/metformin main studies was slightly higher in subjects receiving A12.5
and placebo compared to active comparator and A25: 3 subjects (3/330 [0.9%]) receiving
placebo;. 7 subjects (7/1268 [0.6%]) receiving active comparator; 15 subjects (15/1415 [1.1%])
receiving A12; and 12 subjects (12/1816 [0.7%]) receiving A25.
Alogliptin
Malignancies are considered special-interest TEAEs for long-term use of DPP-4 or GLP-1 therapies.
Alogliptin was not genotoxic in non-clinical in vitro and in vivo genotoxic studies, and no evidence of
carcinogenicity occurred in the non-clinical studies with alogliptin. In preclinical studies a minimal to
mild simple transitional cell hyperplasia in the urinary bladder was noted in male rats at 27-fold
higher than the intended human exposure. Pioglitazone has been associated with bladder cancer,
and therefore an interaction with pioglitazone cannot be excluded. However, no cases of bladder
cancer were reported in the clinical trials.
The percentage of subjects reporting at least 1 malignancy TEAE was low in all groups (0.9%
placebo, 0.4% active comparator, 0.8% alogliptin 12.5 mg, 0.5% alogliptin 25 mg) with no
imbalance in individual cancers.
Based on these results showing low overall incidence, no special warning/precaution is included for
“malignancies” in the SmPC.
Pancreatic Cancer
Uncertainties remained during the procedure regarding effects of alogliptin on the pancreas, as long
term safety data are limited. Besides, during the procedure data had been published that gave rise

CHMP assessment report
EMA/CHMP/207158/2013 Page 114/136
to additional concerns on inflammatory and proliferative pancreatic effects of the therapy with
another DPP-4 inhibitor, sitagliptin, (Butler et al. Diabetes, March 2013). Therefore the applicant
was asked during the procedure to provide further analyses with regard to pancreatic risk.
In the controlled clinical studies, including the long-term studies OPI-004 (52 weeks) and
305 (104 weeks), there were no TEAEs of pancreatic cancer in alogliptin treatment groups. A PV
database search found that 5 subjects had pancreatic cancer events that occurred outside of the
study treatment period: 4 subjects had events that occurred during run-in before randomization
(prior to study drug exposure) and 1 subject who received placebo and pioglitazone had an event
spontaneously reported 1 year after study completion.
As of November 2012, in Study 402, there were no TEAEs of pancreatic cancer.
A total of five subjects with events were reported with alogliptin in uncontrolled studies, and the
incidence rates of pancreatic cancer for the alogliptin uncontrolled studies was considered to be
consistent with the incidence expected in the T2DM population.
Most post-marketing cases reported a time to onset less than 2 months from the start of alogliptin
treatment or had pre-existing pancreatic cancer before receiving alogliptin.
Based on these additional data the CHMP considered that there was no clear evidence for an
association of pancreatic cancer and alogliptin treatment. Nevertheless, CHMP considered that a
targeted follow-up is needed. This has now been reflected in the RMP as ‘Pancreatic cancer’ has
been included as an important potential risk (in line with the recommendation given by CHMP at the
July 2013 meeting for this class of products in the conclusions of the Art. 5(3) referral for GLP 1
based therapies).
Hypoglycaemia
Investigators were asked to record episodes of hypoglycaemia on a dedicated case report form
(CRF). Three criteria were identified:
Symptomatic hypoglycaemic episode and blood glucose < 3.33 mmol/L (Mild to Moderate).
Symptomatic or asymptomatic hypoglycaemic episode and blood glucose <2.78 mmol/L
(Mild to Moderate).
Any hypoglycaemic episode that required assistance, associated with a documented blood
glucose < 3.33 mmol/L (Severe).
Alogliptin/metformin
From the main individual placebo-controlled study covering use as add-on to metformin (008),
there was no consistent indication of an increase in hypoglycaemia risk or severity by the addition
of alogliptin 25 mg. The level of HbA1c on entry, being at the lower end of the diabetic range, did not
appear to unduly influence hypoglycaemia rates or severity.
In study 009 (add-on to TZD), accurate interpretation of hypoglycaemic episode rates is
complicated by the permitted variations in background therapy with respect to MET and SU. Given
the rate seen in the placebo arm (5.2%), however, there is little to suggest a clinically relevant rate
increase in the alogliptin 25 mg group (7.0%). The incidence of hypoglycaemia was markedly
CHMP assessment report
EMA/CHMP/207158/2013 Page 115/136
higher in subjects on triple therapy with concomitant SU (5.6% for placebo+SU+TZD and 27.3% for
alogliptin 25 mg+SU+TZD) compared with subjects on triple therapy with concomitant MET (3.6%
for placebo+MET+TZD and 1.8% for alogliptin 25 mg+MET+TZD). No severe hypoglycaemic
events occurred, and no events of hypoglycaemia were reported as SAEs or led to permanent
discontinuation of the study drug.
In study 011 (add-on to insulin, with or without metformin), the incidence of hypoglycaemic
episodes was higher in the alogliptin 25 mg (27.1%) and 12.5 mg (26.7%) groups vs placebo
(24.0%), but the incidence of severe cases was similar.
In study 305 (alogliptin vs SU in a general adult T2DM population, on metformin monotherapy),
hypoglycaemia rates with metformin+alogliptin 25 mg vs metformin+glipizide were > 10-fold lower
(1.4% vs 23.8%, respectively). Similarly, the incidence of severe hypoglycaemic episodes was
greater in the metformin+glipizide group (0.5%) compared with the metformin+alogliptin 12.5 mg
and metformin+alogliptin 25 mg groups (0.1% and 0, respectively).
In the case of alogliptin 25 mg used to form triple therapy with metformin and pioglitazone in study
322OPI-004, there was an increased rate of hypoglycaemic episodes (4.5%) vs dual therapy with
metformin and a higher dose of pioglitazone (1.5%). A similar trend was also seen in study
322OPI-001, which compared pioglitazone and alogliptin alone and in combination as add-on
therapy to metformin, but with lower rates. The increased risk of hypoglycaemia when alogliptin is
used in combination with pioglitazone is indicated in section 4.4 of the SmPC.
Alogliptin
The incidence of hypoglycaemic episodes in the Controlled Phase II and III Study Group (excluding
study 301 as detailed information regarding hypoglycaemic episodes was not collected in this
study) was 12.9% in the active comparator group, 3.6% in the alogliptin 25 mg group, and 6.2% in
the placebo group. Within each treatment group, the highest numbers of hypoglycaemic episodes
were classified as symptomatic hypoglycaemic episodes with a blood glucose < 3.33 mmol/L.
Although the incidence of severe hypoglycaemic episodes was low overall, the percentages in the
placebo and active comparator groups (both 0.4%) were higher than for subjects treated with
alogliptin (0.1%). From this pooled analysis, across the alogliptin clinical development program,
alogliptin treatment does not lead to an increased risk of hypoglycaemia when compared with
placebo or active comparator.
In elderly subjects ≥65 years in study 303, hypoglycaemia rates were approximately 5-fold lower
for alogliptin 25 mg vs glipizide (5.4% vs 26.0%). There were no severe episodes of hypoglycaemia
in the alogliptin 25 mg group, and the rate of hypoglycaemia was in line with the hypoglycaemia
rates in the placebo and alogliptin groups reported in the Controlled Phase II and III Study Group,
predominantly in subjects < 65 years. As elderly patients with T2DM are considered more
susceptible to episodes of hypoglycaemia than younger patients, a pooled analysis of the data from
12 studies was performed comparing these age groups. The overall incidence of any episode of
hypoglycaemia was similar between subjects ≥ 65 years and < 65 years (3.8% and 3.6%,
respectively) treated with alogliptin 25 mg.

CHMP assessment report
EMA/CHMP/207158/2013 Page 116/136
2.6.6. Comparative safety by dose
In most of the alogliptin phase III studies, both alogliptin 12.5 mg and 25 mg were evaluated;
however, in some studies, particularly the longer duration studies, only 25 mg dose was evaluated.
Therefore, for the alogliptin 25 mg group, there were more subjects exposed overall and for longer
periods of time compared with the alogliptin 12.5 mg group.
Incidence of TEAEs was similar between the alogliptin 12.5 and 25 mg dose groups. In the
Controlled Phase II and III Study Group, the incidence of TEAEs was 67.5% in the alogliptin
12.5 mg group (333.2 events per 100 subject-years) and 66.6% in the alogliptin 25 mg group
(342.1 events per 100 subject-years). For SAEs, the incidence was 4.0% in the alogliptin 12.5 mg
group (8.5 events per 100 subject-years) vs 4.7% in the alogliptin 25 mg group (9.9 events per 100
subject-years). For TEAEs leading to discontinuation of the study drug, the incidence was 3.6% in
the alogliptin 12.5 mg group (6.5 events per 100 subject-years) vs 4.1% in the alogliptin 25 mg
group (7.1 events per 100 subject-years).
Common TEAEs (experienced by 3% of subjects in either dose group) were experienced by similar
proportions of subjects in the 12.5 and 25 mg dose groups and included nasopharyngitis (5.7% vs
5.1%, alogliptin 12.5 mg vs 25 mg), upper respiratory tract infection (4.9% vs 5.2%), headache
(4.4% vs 5.4%), urinary tract infection (4.1% vs 4.2%), hypertension (3.6% vs 3.9%), diarrhoea
(3.7% vs 3.8%), and back pain (3.5% vs 3.3%). No meaningful differences were observed between
the dose groups in the analysis of common TEAEs by time to onset or by duration of exposure to
treatment. In addition, no single type of event emerged in only one of the 2 dose categories and not
in the other.
Similarly, the incidences of TEAEs of special interest, including hypersensitivity, acute pancreatitis,
malignancies, and CV events were comparable between exposure-corrected dose groups. Overall,
the safety and tolerability profile of alogliptin was similar between the 12.5 and 25 mg groups.
2.6.7. Laboratory findings
For both the fixed dose combination alogliptin/metformin and for alogliptin alone, laboratory
evaluations of haematology, clinical chemistry and urinalysis, mean changes from baseline to
endpoint measurement time were generally small and consistent across the treatment groups. The
incidence of markedly abnormal values for renal function parameters during treatment was low
overall and similar across treatment groups.
During treatment, the incidence of alanine aminotransferase (ALT) > 3× upper limit of normal
(ULN) was higher in the active comparator group (2.2%) than in alogliptin or placebo groups (1.3%
and 0.9%, respectively). The incidence of ALT >5×ULN in subjects receiving active comparator,
alogliptin or placebo was 0.5%, 0.3%, and 0.1%, respectively. ALT >10×ULN only occurred in
subjects receiving active comparator or alogliptin (0.2% and 0.1% respectively).
The incidence of total bilirubin > 34.2 µmol/L was low and similar across groups (active comparator
0.5%, alogliptin 0.4%). The incidence of ALT > 3×ULN concurrent with total bilirubin > 34.2 µmol/L
was 0.1% in the active comparator group and < 0.1% in subjects receiving alogliptin.
For the alogliptin-treated subjects with an ALT > 10×ULN, all had an alternative (non-study drug)
aetiology. Minor, transient and isolated elevations in hepatic parameters were observed in other

CHMP assessment report
EMA/CHMP/207158/2013 Page 117/136
subjects but most were not considered clinically meaningful in terms of observed absolute values
within expected physiological fluctuation of these enzymes in the context of underlying liver
comorbidity.
Overall, the data indicate alogliptin alone or taken in combination with metformin is associated with
a low risk of hepatic toxicity.
2.6.8. Vital signs and electrocardiogram evaluations
No clinically meaningful trends were observed in vital sign measures (pulse, blood pressure,
respiratory rate, and temperature) in the FDC alogliptin/metformin studies or the alogliptin studies.
In addition, alogliptin was found to be weight neutral.
Non-clinical electrophysiological studies did not raise any safety concerns. Study 019 investigated
the effects of alogliptin on cardiac repolarization (QT/QTc) and concluded that alogliptin had no
clinically meaningful effect on cardiac repolarization. Electrocardiogram (ECG) parameters showed
no clinically meaningful trends.
2.6.9. Safety in special populations
No specific subpopulation investigations have been conducted with the FDC alogliptin/metformin;
however, the FDC is expected to have a similar efficacy profile as the individual components. To
determine whether certain factors predispose subgroups of individuals to experience specific TEAEs
with alogliptin, analyses were performed using the Controlled Phase II and III Study Group for a
number of intrinsic (sex, age, race, BMI, and renal function) factors. No important differences were
noted.
2.6.9.1. Elderly
TEAEs in the Controlled Phase II and III Study Group were reviewed by age group (< 65, 65-74,
75-84, and ≥85 years). Dizziness, headache, urinary tract infection, diarrhoea, and dyslipidaemia
were consistently reported by a greater percentage of subjects 75-84 years compared with subjects
< 65 years and subjects 65-74 years in the alogliptin 25 mg group. This trend was also evident in
the active comparator group for dizziness. This finding is consistent with the known propensity for
these conditions observed in the general population of elderly patients and is not attributable per se
to alogliptin treatment.
In addition, creatinine renal clearance decreased was reported by a greater percentage of subjects
75-84 years of age compared with subjects < 65 years and subjects 65-74 years in the alogliptin
25 mg group. This trend was also evident in the active comparator group. This subgroup difference
is not unexpected and is unlikely to be attributable to alogliptin treatment.
In the Controlled Phase II and III Study Group, no safety signals were observed in subgroup
populations stratified by age, but exposure in subjects older than 85 years of age is very limited.
Study 303 was a randomized, double-blind, active-controlled study designed to further explore the
efficacy and safety of alogliptin compared with glipizide over a longer period of time (up to 52
weeks) in an older T2DM subject population (age, 65 to 90 years). Overall, compared with glipizide,

CHMP assessment report
EMA/CHMP/207158/2013 Page 118/136
alogliptin was well tolerated, showed less hypoglycaemia, and no body weight increases. The safety
and tolerability results evaluated in this study were consistent with the safety profile established for
alogliptin in previous studies within its clinical development program. The most frequently reported
TEAEs included urinary tract infection, dizziness, and headache, all of which are similar to glipizide
and consistent with what has been reported in previous studies. Most other TEAEs occurred in less
than 1% of subjects, were considered by the investigator not drug related, and were mild or
moderate in intensity.
2.6.9.2. Subjects with impaired renal function
In the phase I study 006 (renal pharmacokinetic study), compared with healthy subjects, systemic
exposure to alogliptin was 71%, 112%, 251% and 377% higher in subjects with mild, moderate, or
severe renal impairment, and with ESRD, respectively, following administration of a single alogliptin
50 mg dose. While no change in dose is anticipated for patients with mild renal impairment, dose
reductions proportional to the increases in exposure in subjects with moderate or severe renal
impairment or end-stage renal disease (ESRD) are recommended (SmPC section 4.2). The majority
of TEAEs reported in this study were judged to be mild in intensity and unrelated to study drug. The
percentage of TEAEs was similar between each renal impairment group and their respective healthy
matched controls. As expected, several subjects with renal impairment exhibited serum chemistry
and urinalysis abnormalities consistent with their underlying condition; however, no clinically
meaningful changes in any of these values were observed.
The majority of subjects in the Controlled Phase II and III Study Group had mild or moderate renal
impairment based on estimated glomerular filtration rate (eGFR) using the MDRD calculation. The
relatively small number of subjects with severe baseline renal impairment limits the ability to make
meaningful comparisons in this subgroup (no subjects receiving placebo or active comparator, 1
subject in the alogliptin 12.5 mg group, and 3 subjects in the alogliptin 25 mg group when defined
by MDRD formula).
In the Controlled Phase II and III Study group, urinary tract infection was the only common TEAE
reported by ≥ 1% of subjects in the alogliptin 25 mg group for which the incidence in subjects with
moderate renal impairment at baseline was higher than that in subjects with normal renal function
or mild renal impairment at baseline. A similar trend was evident for subjects who received active
comparator, indicating that this difference is not necessarily attributable to treatment with
alogliptin. Similarly, pruritus was the only TEAE of interest reported by ≥1% of subjects overall in
the alogliptin 25 mg group for which the incidence in subjects with either mild or moderate renal
impairment at baseline was at least twice that in subjects with normal renal function at baseline.
Of the TEAEs reported by ≥ 1% of subjects with severe renal impairment in study 402, compared to
placebo, alogliptin was associated with a similar percentage TEA’s (87.9 % vs. 87.9%). As expected
with multiple comparisons, some numerical imbalances remain with the updated data set, including
events in which incidence was lower for alogliptin compared with placebo and those with an
incidence higher for alogliptin compared with placebo. Among the most common TEAEs (≥ 5%
incidence), a 2-fold difference between treatment groups was observed for anemia, urinary tract
infection, and angina pectoris (higher for alogliptin) and diarrhea, edema peripheral, and blood
creatine phosphokinase increased (higher for placebo). In line with the SmPC of metformin, the FDC

CHMP assessment report
EMA/CHMP/207158/2013 Page 119/136
is contraindicated in patients with moderate or severe renal failure (creatinine clearance < 60
ml/min) (SmPC sections 4.3 and 4.4).Subjects with impaired hepatic function
Results from phase I study 023 demonstrated that mild or moderate hepatic impairment did not
affect exposure to alogliptin; therefore, subgroup analyses were not performed for hepatic function.
The effect of severe hepatic impairment on the pharmacokinetics of alogliptin was not studied. As a
result, use of alogliptin in patients with severe hepatic impairment is not recommended.
Moreover, according with the harmonized SmPC of metformin, metformin is contraindicated in
patients with hepatic impairment.
2.6.10. Safety related to drug-drug interactions and other interactions
No differences in exposure to alogliptin or to metformin were observed when alogliptin and
metformin were coadministered, and no clinically meaningful changes in exposure to a number of
drugs that are metabolized by CYP isozymes (pioglitazone [2C8]; glyburide, tolbutamide and
(S)-warfarin [2C9]; midazolam, atorvastatin, ethinyl estradiol, and norethindrone [3A4]; caffeine
and (R)-warfarin [1A2]; dextromethorphan [2D6], transported by Pgp (fexofenadine and digoxin)
or OCT2 (metformin), or drugs that are excreted unchanged in urine (metformin, cimetidine, a
OCT2 inhibitor, and digoxin) were observed when these drugs were administered with alogliptin.
Alogliptin was devoid of any clinically meaningful drug or food interactions, which suggests a
favourable safety profile in patients with T2DM who are likely to be receiving multiple concomitant
medications.
The SmPC for MET includes specific recommendations for administration of MET with drugs that
tend to cause hyperglycaemia, cationic drugs that are eliminated by renal tubular secretion, and
intravascular iodinated contrast agents. All of these are considered relevant for the FDC
aogliptin/metformin and are appropriately reflected in the SmPC.
2.6.11. Post marketing experience
The FDC alogliptin/metformin was not marketed in any country.
Alogliptin was approved for use in the treatment of T2DM in Japan in April 2010 and commercially
launched (6.25, 12.5, and 25 mg) in June 2010.
As of 15 October 2011, cumulative exposure for alogliptin is estimated to be 117,359 patient-years.
A total of 271 post-marketing cases were included in the 3 PSURs, 37 of which were serious. The
most common events reported post-marketing were in the skin and subcutaneous disorders SOC
(18 serious and 124 non-serious cases) and included 1 case of Stevens-Johnson syndrome.
Hepatotoxicity was reported post-marketing in 5 cases. An independent committee concluded that
the relationship between alogliptin and hepatotoxicity in three of the five cases was deemed “
probable” (50-74% probability) and in the remaining two was deemed “possible” (25-49%
probability).
There were 6 serious post-marketing cases of acute pancreatitis (as of 27 October 2011). All except
1 serious post-marketing case had a possible alternative aetiology that likely precipitated the event.

CHMP assessment report
EMA/CHMP/207158/2013 Page 120/136
One fatal case of necrotizing pancreatitis was reported, which occurred in a patient with multiple
gallbladder stones as evidenced by dilation of the extrahepatic common bile duct on autopsy.
No new information affecting the safety profile of alogliptin has been identified post-marketing and
no changes have been made to the Company Core Safety Information (CCSI). To date, no
regulatory action has been taken by the Japanese regulatory authority with respect to safety
labelling, which is based on the clinical trial program.
PSURs have been produced every 6 months since approval in Japan. Categories of medically
significant adverse reactions reviewed within each PSUR include those relating to skin and
subcutaneous tissue disorders, hypoglycaemia, pancreatitis, and hepatotoxicity.
2.6.12. Discussion on clinical safety
2.6.12.1. Alogliptin/metformin
The safety profile of the FDC alogliptin/metformin is derived from five main phase III clinical studies
(008, 009, 011, 305, 322OPI-004) and from two supportive studies. A total of 4201 subjects
received alogliptin in combination with metformin either as a background medication or as one of
the initial combination therapies. Treatment duration ranged from 16 to 52 weeks in the phase III
studies.
Generally, the pattern of AEs observed in the alogliptin/metformin phase III studies was consistent
with the known safety profile of metformin, previous clinical trials with alogliptin (see below), and
conditions that are expected in this T2DM patient population. The most commonly (≥ 5% of
subjects) reported with combination treatment were nasopharyngitis, upper respiratory tract
infection, urinary tract infection, diarrhoea, headache, oedema peripheral, influenza, hypertension,
and arthralgia. Most TEAEs were considered mild or moderate in intensity and not related to study
drug. TEAEs tended to occur more often within the system organ class (SOC) of infections and
infestations and the incidence was generally similar among treatment groups.
The number of treatment emergent deaths in the alogliptin/metformin program was low
(13/7150 [0.2%]). Six of the deaths were in subjects taking alogliptin in combination with MET
(6/4201 [0.1%]).
Special interest AEs for alogliptin/metformin are based on the AEs of special interest for the single
components and include hypersensitivity reactions (severe cutaneous adverse reactions,
angioedema, and anaphylaxis reactions), acute pancreatitis, malignancy, CV events, and lactic
acidosis. There is no evidence to suggest that the combination of alogliptin and MET is associated
with an increase in incidence or severity of these AEs of special interest. There have been no reports
of lactic acidosis in the alogliptin or alogliptin/metformin clinical programs.
The cardiovascular safety was retrospectively adjudicated as MACE (CV death, nonfatal MI, and
non-fatal stroke) in the five main phase III trials. The number of subjects with MACE was low,
ranging from one (1/260; 0.4%) patient in study 011 to 9 (9/1765; 0.5%), with the highest
percentage in study 009 (4/396; 1.0%) for the alogliptin groups. In the placebo groups there was
only one subject reported with MACE event in study 011 (1/130; 0.8%) and none in studies 008 and
009. However, in the active comparator studies there was a higher adjudicated MACE event rate

CHMP assessment report
EMA/CHMP/207158/2013 Page 121/136
with 6/873 (0.7%) in study 305 and 3/399 (0.8%) in study 322OPI-004. Currently, there is a
cardiac vascular study on-going (study 402).
2.6.12.2. Alogliptin
Overall, for alogliptin, a comprehensive clinical program was submitted comprising 55 clinical
studies involving approximately 1000 healthy adult subjects and more than 11,000 adult subjects
with T2DM. The patient population can be considered representative of the European population of
diabetes patients..
The most common TEAEs reported in ≥ 5% of subjects treated with alogliptin 25 mg and more
frequently than in subjects who received placebo or active comparators were headache,
nasopharyngitis, and upper respiratory tract infection. In comparison to other DPP-4 inhibitors, no
potential new adverse events emerged. However, in order to increase the precision of adverse
event rates and to achieve a higher validity, the applicant was requested to generate a safety data
pool containing all seven pivotal phase III studies (5 placebo-controlled and 2 active-comparator
studies) and to present a table of adverse events which is to be reflected in the tabulated list of
adverse reactions (SmPC section 4.8). The applicant presented the requested data. It is agreed that
the pattern of TEAEs observed in the polled “pivotal phase III controlled studies was similar to the
one observed in the polled “controlled phase II and IIIstudy group”. The tabulated list of ADRs in
SmPC section 4.8 was updated accordingly to reflect data from pooled phase III studies instead of
individual studies in accordance with the SmPC guideline.
Reported serious adverse events had higher frequency with alogliptin compared to placebo, but
lower compared to active comparators. There was no discernible pattern in the type of adverse
events. The applicant was requested to discussion in depth the relevance of the following the 7 fatal
cases, considered to be related to alogliptin treatment; 1 acute pancreatitis, 1 sudden death and 1
acute pulmonary oedema in the Controlled Phase 2/3 Group and 4 fatal cases with CV outcome in
the study 012.
After review of the cases, it was considered that these individual cases (seven classified as possibly
related and one as not related) do not reflect an association with alogliptin. Such events are
expected in a population with T2DM and occurred at rates consistent with other studies. No
apparent patterns, trends, were observed and it is considered that they do not indicate a new safety
concern. Moreover, further results from the CV outcome study 402, for which a final study report is
expected to be available during the first quarter of 2014, should allow a further in-depth
characterisation of the CV profile of alogliptin-cotaining products.
Pre-defined special-interest AEs for alogliptin were CV (MACE), hypersensitivity reactions (severe
cutaneous adverse reactions, angioedema, and anaphylaxis reactions), acute pancreatitis, and
malignancies.
Cardiovascular safety
In the Controlled Phase II and III Study Group, when compared to placebo, alogliptin was
associated with a higher cardiovascular event rate (Hazard ratio 1.33). However, in the controlled
Phase II and III Study Group, cardiovascular event rate was lower compared to active comparators

CHMP assessment report
EMA/CHMP/207158/2013 Page 122/136
(Hazard ratio 0.66). In addition, interim analyses of the cardiovascular outcome study
demonstrated that alogliptin was associated with a lower cardiovascular risk (Hazard ratio 0.81).
Owing to the differences in the number of events for MI (10 vs. 6), cardiac failure (7 vs. 1) and
cardiac failure congestive (14 vs. 7) in the table presenting TAES vs. the table presenting serious
TEAEs in the SOC cardiac disorders, the CHMP did seek clarification on the cases of cardiac failure
and myocardial infarction designated as non-serious. The applicant stated that there were
20 subjects in total in the alogliptin clinical studies who experienced adverse events (AEs) of cardiac
failure/cardiac failure congestive (14 subjects) or myocardial infarction (6 subjects) in which the
event had been classified by the investigator as non serious. The applicant did provide satisfactory
details of the definition of SAEs, a clinical review of the available data that was performed and a
rationale for the non serious designation. Similarly, reassuring descriptions were provided by the
applicant for the cases of heart failure, and therefore the CHMP considered this concern as being
resolved.
Based on results showing no increase in MACE with alogliptin, no special warning/precaution
regarding CV events is needed for the alogliptin component. According to metformin SmPC cardiac
failure is a contraindication therefore alogliptin/metformin FDC is contraindicated in patients with
congestive heart failure (NYHAI-IV).
Hypersensitivity reactions
Safety results for alogliptin indicate a low incidence of hypersensitivity reactions. Nevertheless, 13
patients (0.2%) developed an anaphylactic reaction during alogliptin, whereas no patient
developed an anaphylactic reaction during treatment with placebo. During postmarketing
surveillance in Japan, skin disorders, including Stevens Johnson, were reported. Consistent with
labelling for other DPP-4 inhibitors the occurrence of such reactions has been indicated in section
4.4 of the SmPC.
Pancreatitis
The frequency of pancreatitis events is low, but alogliptin was associated with a higher risk for
pancreatitis in comparison to comparators. Several cases of pancreatitis were reported
postmarketing of which one was fatal. Given the increased risk of pancreatitis reported with other
DPP-4 inhibitors, the risk of pancreatitis is indicated in the SmPC section 4.4 (Warnings and
Precautions), and acute pancreatitis is listed as an adverse reaction in Post-marketing Reports in
SmPC, Section 4.8. The risk of pancreatitis is indicated in the SmPC section 4.4 (Warnings and
Precautions), and acute pancreatitis is listed as an adverse reaction in Post-marketing Reports in
SmPC, Section 4.8. Moreover, new pancreatitis data have been integrated during the procedure
and hence pancreatitis is now included as an identified risk in the Risk Management Plan.
Malignancies
There is no safety signal for malignancies with alogliptin. Therefore, no special warning/precaution
is necessary for malignancies.

CHMP assessment report
EMA/CHMP/207158/2013 Page 123/136
Pancreatic Cancer
Uncertainties remained during the procedure regarding effects of alogliptin on the pancreas, as long
term safety data are limited. Besides, during the procedure data had been published that gave rise
to additional concerns on inflammatory and proliferative pancreatic effects of the therapy with
another DPP-4 inhibitor, sitagliptin, (Butler et al. Diabetes, March 2013). Therefore the applicant
was asked during the assessment procedure to provide further analyses with regard to pancreatic
risk.
In the controlled clinical studies, including the long-term studies OPI-004 (52 weeks) and
305 (104 weeks), there were no TEAEs of pancreatic cancer in alogliptin treatment groups. A PV
database search found that 5 subjects had pancreatic cancer events that occurred outside of the
study treatment period. As of November 2012, in Study 402, there were no TEAEs of pancreatic
cancer. In uncontrolled studies, the incidence rates of pancreatic cancer associated with the use of
alogliptin were low and considered to be consistent with the incidence expected in the T2DM
population.
Based on these additional data the CHMP considered that there was no clear evidence for an
association of pancreatic cancer and alogliptin treatment. Nevertheless, CHMP considered that a
targeted follow-up is needed. This has now been reflected in the RMP as ‘Pancreatic cancer’ has
been included as an important potential risk (in line with the recommendation given by CHMP at the
July 2013 meeting for this class of products in the conclusions of the Art. 5(3) referral for GLP 1
based therapies).
Hypoglycaemia
There was no increase in hypoglycaemia rate vs placebo when alogliptin 25 mg was administered
alone, added on to SU, or added on to metformin. In the case of alogliptin 25 mg used to form triple
therapy with metformin and pioglitazone in study 322OPI-004, there was an increased rate of
hypoglycaemic episodes. In study 009 (add-on to TZD), there was a small increase in the rate of
hypoglycaemic episodes in the alogliptin 25 mg group. In study 011 (add-on to insulin, with or
without metformin), the incidence of hypoglycaemic episodes was higher with alogliptin 25 mg vs
placebo. This increased rate of hypoglycaemia in combination with metformin/TZD and insulin is
reflected in the SmPC.
Vital signs and ECG
There were no relevant changes in vital signs and ECG. There were no relevant changes in
laboratory findings.
Subgroups
In patients with mild to moderate renal insufficiency, no safety signals were observed with
alogliptin. The number of patients with severe renal insufficiency in the pivotal studies was
negligible. In the cardiovascular outcome study 402, a number of patients with severe renal
insufficiency was included. Of the TEAEs reported by ≥ 1% of subjects with severe renal
impairment, compared to placebo, alogliptin was associated with a similar percentage TEA’s (87.9

CHMP assessment report
EMA/CHMP/207158/2013 Page 124/136
% vs. 87.9%). The applicant does not apply for an indication of the FDC alogliptin/metformin in
patients with moderate and severe renal impairment, since metformin is contraindicated in patients
with renal dysfunction (creatinine clearance < 60 ml/min). In T2DM patients with mild renal
impairment (creatinine clearance between 60-90 ml/min) no dose adjustment is proposed or
needed. This is appropriately reflected in the SmPC sections 4.3 and 4.4.
No safety signals for alogliptin were observed in subgroup populations stratified by age. Some
adverse events were more common with alogliptin in elderly individuals. However, the number of
patients was limited, and the differences between alogliptin and placebo were small. Overall, no
safety signals were observed with alogliptin in subgroup populations stratified by race. In addition,
no safety signals were observed with alogliptin in subgroup populations stratified by BMI.
Patients with hepatic disease were excluded in the phase II and III studies. In a pharmacokinetic
study in patients with moderate hepatic impairment, there were no adverse events and no clinically
meaningful changes in laboratory tests were reported. However, the use of alogliptin in patients
with severe hepatic impairment cannot be recommended. In addition, five cases of hepatotoxicity,
including one case of hepatic failure were reported post-marketing. An independent committee
concluded that the relationship between alogliptin and hepatotoxicity in three of the five cases was
deemed “probable” (50-74% probability) and in the remaining two was deemed “possible”
(25-49% probability). Although no causal relationship between alogliptin and hepatic dysfunction
has been established, these 5 cases provide important knowledge about the risks of alogliptin in
clinical practice. Therefore, the occurrence of hepatic dysfunction has been reflected in the SmPC in
section 4.4 (warnings and precautions) and 4.8 (undesirable effects). In addition, since hepatic
impairment has been associated with lactic acidosis, the use of metformin/alogliptin FDC in patients
with hepatic impairment is contraindicated. Furthermore, hepatotoxicity is included in the RMP as
important potential risk.
Drug interactions
No dose adjustment is required due to drug interactions.
2.6.12.3. Metformin
The safety profile of metformin has been well established based on pre and post-approval clinical
studies and post-marketing experience.
One of the most common side effects of metformin is gastrointestinal intolerance, which can hinder
maximizing the dose as well as lessen patient compliance. The most important adverse effect
associated with metformin therapy is lactic acidosis, which mandates cessation of treatment.
Metformin therapy is contraindicated in patients with renal dysfunction, congestive heart failure
requiring pharmacologic treatment and acute or chronic metabolic acidosis, including diabetic
ketoacidosis. Additionally, since hepatic impairment has been associated with lactic acidosis, the
use of MET in patients with hepatic insufficiency is contraindicated. The above mentioned metformin
contraindications are reflected in Vipdomet’s SmPC section 4.3.
All safety issues are appropriately reflected in the SmPC and in the RMP.

CHMP assessment report
EMA/CHMP/207158/2013 Page 125/136
2.6.13. Conclusions on the clinical safety
In comparison to other DPP-4 inhibitors, no potential new adverse events emerged for the alogliptin
component.
Generally, the pattern of AEs observed in the alogliptin/metformin phase III studies was consistent
with the known safety profile of metformin, previous clinical trials with alogliptin, and conditions
that are expected in this T2DM patient population. The most commonly (≥ 5% of subjects) reported
with combination treatment were nasopharyngitis, upper respiratory tract infection, urinary tract
infection, diarrhoea, headache, oedema peripheral, influenza, hypertension, and arthralgia.
The applicant does not apply for an indication of the FDC alogliptin/metformin in patients with
moderate and severe renal impairment, since metformin is contraindicated in patients with renal
dysfunction (creatinine clearance < 60 ml/min). In T2DM patients with mild renal impairment
(creatinine clearance between 60-90 ml/min) no dose adjustment is proposed or needed. This is
appropriately reflected in the SmPC sections 4.3 and 4.4.
There is no safety signal for malignancies with alogliptin.The cases of hepatotoxicity, observed
post-marketing in Japan, are relevant. Therefore, the occurrence of hepatic dysfunction has been
reflected in the SmPC in section 4.4 (warnings and precautions) and 4.8 (undesirable effects). In
addition, since hepatic impairment has been associated with lactic acidosis, the use of
metformin/alogliptin FDC in patients with hepatic impairment is contraindicated. Furthermore,
hepatotoxicity is included in the RMP as important potential risk.
Hypersensitivity reactions, pancreatitis and hypoglycaemia (in combination with TZD and insulin)
are reflected in the SmPC.
2.7. Pharmacovigilance
Detailed description of the pharmacovigilance system
The CHMP considered that the Pharmacovigilance system as described by the applicant fulfils the
legislative requirements.
2.8. Risk Management Plan
The CHMP received the following PRAC Advice on the submitted Risk Management Plan:
PRAC Advice
Based on the PRAC review of the Risk Management Plan version 4.0, the PRAC considers by
consensus that the risk management system for alogliptin/metformin (Vipdomet) for the above
mentioned indication is acceptable.
Proposed indication:
Treatment of adult patients aged 18 years and older with type 2 diabetes mellitus:

CHMP assessment report
EMA/CHMP/207158/2013 Page 126/136
as an adjunct to diet and exercise to improve glycaemic control in adult patients,
inadequately controlled on their maximal tolerated dose of metformin alone, or those already
being treated with the combination of alogliptin and metformin.
in combination with pioglitazone (i.e. triple combination therapy) as an adjunct to diet and
exercise in adult patients inadequately controlled on their maximal tolerated dose of
metformin and pioglitazone.
in combination with insulin (i.e. triple combination therapy) as an adjunct to diet and exercise
to improve glycaemic control in patients when insulin at a stable dose and metformin alone
do not provide adequate glycaemic control.
This advice is based on the following content of the Risk Management Plan:
Safety concerns
The applicant identified the following safety concerns in the RMP:
Summary of the Safety Concerns
Summary of safety concerns
Important identified risks - Hypersensitivity reactions.
- Pancreatitis.
- Lactic acidosis.
Important potential risks - Hepatotoxicity
- Peripheral necrotic skin lesions
- Gastrointestinal disorders
- Infections
Missing information - Patients with concurrent CVD.
- Patients with severe renal impairment or
End-Stage Renal disease (ESRD) requiring
dialysis
- Patients with severe hepatic impairment.
- Pregnant and/or breastfeeding women
- Children and adolescents
- Malignancies
The PRAC agreed.
Pharmacovigilance plans
Ongoing and planned studies in the PhV development plan
Activity/Study
title
Objectives Safety concerns
addressed
Status
Planned,
started,
Date for
submission of
final reports
CV outcome study 402
- A multicenter,
randomized,
doubleblind,
placebo-controlled
To evaluate CV
outcomes following
treatment with
alogliptin in addition
to standard of care in
Investigate
hypersensitivity
reactions,
pancreatitis, skin
lesions,
Ongoing January 2014

CHMP assessment report
EMA/CHMP/207158/2013 Page 127/136
Activity/Study
title
Objectives Safety concerns
addressed
Status
Planned,
started,
Date for
submission of
final reports
study subjects with
type 2 diabetes and
ACS
hepatotoxicity, GI
disorders and
infections, effects in
patients with
concurrent CV
disease and effects in
patients with renal
impairment.
The PRAC, having considered the data submitted, was of the opinion that the proposed
post-authorisation PhV development plan is sufficient to identify and characterise the risks of the
product.
Risk minimisation measures
Summary table of Risk Minimisation Measures
Safety concern Routine risk minimisation
measures
Additional risk
minimisation measures
Hypersensitivity Reactions SmPC Sections 4.3, 4.4 and 4.8
provide data and
recommendations
None
Pancreatitis SmPC Sections 4.4 and 4.8 provide
data and recommendations
None
Lactic acidosis SmPC Sections 4.3, 4.4, 4.5 and
4.8 describe metformin related
risks and provide data and
recommendations.
None
Hepatotoxicity SmPC Section 4.4 and 4.8 provide
data and recommendations
None
Peripheral necrotic skin lesions None required None
Gastrointestinal disorders SmPC Section 4.8 provides data. None
Infections SmPC Section 4.8 provides data. None
Patients with concurrent
cardiovascular disease
SmPC Section 4.3 provides a
contraindication concerning use in
patients with cardiac failure
None
Patients with severe renal
impairment or End-Stage
Renal disease (ESRD) requiring
dialysis
SmPC Section 4.2 and Section 4.4
Provide a contraindication and
warnings around use in patients
with renal impairment
None
Patients with severe hepatic
impairment
SmPC Sections 4.3 and 4.4 provide
warnings concerning use in
patients with severe hepatic
impairment.
None

CHMP assessment report
EMA/CHMP/207158/2013 Page 128/136
Safety concern Routine risk minimisation
measures
Additional risk
minimisation measures
Pregnant and/or breastfeeding
women
SmPC Section 4.6 provides
information on the absence of
data.
None
Children and adolescents SmPC Section 4.2 provides
information on the absence of
pediatric data.
None
Malignancies None required None
The PRAC, having considered the data submitted, was of the opinion that the proposed risk
minimisation measures are sufficient to minimise the risks of the product in the proposed
indication(s).
In addition the PRAC considered that the applicant should address the following points
Pancreatic cancer should be included in the RMP as missing information
Pancreatic cancer should be added as an adverse event of special interest in the CV outcome
study 402.
The CHMP endorsed this advice with changes.
These changes concerned the following elements of the Risk Management Plan:
Pancreatic cancer should be included in the RMP as an important potential risk
The CHMP justified these changes as follows:
The Article 5 (3) referral procedure assessing the available data concerning the potential
relationship between pancreatic cancer and GLP-1 agonists and DPP-4 inhibitors treatment, was
concluded during July 2013 CHMP meeting. In line with the recommendation given by CHMP in the
conclusion of the above mentioned Art. 5(3) referral procedure, “pancreatic cancer” should be seen
as an important potential risk associated with alogliptin treatment and reflected as such in all
alogliptin containing products’ RMPs.
All issues identified by the PRAC and the CHMP were properly addressed by the applicant and an
updated RMP version 5 was submitted.
The CHMP endorsed the updated RMP without changes.
2.9. User consultation
The results of the user consultation with target patient groups on the package leaflet submitted by
the applicant show that the package leaflet meets the criteria for readability as set out in the
Guideline on the readability of the label and package leaflet of medicinal products for human use.

CHMP assessment report
EMA/CHMP/207158/2013 Page 129/136
3. Benefit-Risk Balance
Benefits
Beneficial effects
Vipdomet is a Fixed Dose Combination of a new DDP-4 inhibitor, alogliptin, and the biguanide
metformin.
Pharmacokinetics
In study 322MET-103, the pivotal BE study, the developed fixed dose combination tablets
containing the lowest and highest amount of metformin (500 mg and 1000 mg, respectively) and
the tablets containing the lowest and highest amount of alogliptin (6.25 and 12.5, respectively)
were compared with individual corresponding alogliptin and metformin tablets.
In all cases the 90% CI of the AUC and Cmax was within the 80%-125% range. Therefore, it can be
considered that bioequivalence of the FDC alogliptin/metformin 6.25mg + 1000mg and
12.5mg+1000mg tablets has been demonstrated.
The applicant used a bracketing approach by making only an evaluation of the highest and lowest
dose strengths in humans in vivo, as was previously advised by the CHMP during scientific advice.
Therefore, a biowaiver for the applicated alogliptin/metformin 6.25mg+850mg and
12.5mg+850mg tablet can be granted.
No changes in exposure to alogliptin and no clinically meaningful changes in exposure to metformin
(an OCT2 substrate that is primarily excreted unchanged in the urine) were observed when
alogliptin and metformin were co-administered.
Twice daily dosing compared with once daily dosing of alogiptin resulted in identical exposure (AUC)
but resulted in a lower Cmax of approximately 35%. However, DPP-4 inhibition with BID dosing of
alogliptin was similar to that with once daily dosing (both > 80% at 24 hours post-dose) and in a
clinical study (302, see below) efficacy was similar between the two dose regimens.
Clinical
Five clinical trials were considerd pivotal for the fixed dose combination of alogliptin and metformin:
(008, 009, 011, 305, and 322OPI-004) and two supportive trials (302 and 322OPI-001). Study 010
was included to show the efficacy and safety of alogliptin as monotherapy.
Pivotal study 008 (alogliptin add-on to metformin) demonstrated that the combination treatment
of alogliptin 25 mg with metformin was clinical relevant with HbA1c changes from baseline of
-0.48% (95% CI -0.67 to -0.30) in comparison to placebo with metformin after 26 weeks.
In pivotal study 009, in which alogliptin was added to pioglitazone with or without metformin,
alogliptin 25 mg was associated with a reduction in HbA1c of -0.61% (95% CI -0.80 to -0.41) after
26 weeks in comparison to placebo. Treatment effects were clinically relevant for alogliptin 25 mg
in combination with TZD only (-0.49%) and in combination with TZD and metformin (-0.72%),
which is relevant for this FDC. In study 322OPI-004, the effects of adding alogliptin 25 mg, in

CHMP assessment report
EMA/CHMP/207158/2013 Page 130/136
patients already on metformin treatment, were non-inferior compared with increasing the dose of
pioglitazone from 30 to 45 mg.
Study 011 was submitted to show the effect of alogliptin as add-on to insulin in patients with or
without metformin. Treatment effect of alogliptin 25 mg was modest, but clinically relevant
(-0.59%; 95% CI -0.80 to -0.37) after 26 weeks. In the subgroup of patients on metformin
treatment (58.5%; n=227), which is relevant for the FDC alogliptin/metformin, mean Change (SD)
from baseline in HbA1c at Week 26 was -0.77 (0.933). baseline HbA1c values were relatively high
(9.3%). This may have resulted in an overestimation of the treatment effects of alogliptin on
HbA1c. Nevertheless, in the individuals with HbA1c below 8.5%, the effect of alogliptin 25mg on
HbA1c was also clinically relevant (-0.68%).
In an initial combination study (302), both co-administration therapy regimens of alogliptin plus
metformin (A12.5+ M500 BID and A12.5+ M1000 BID) resulted in larger reductions in HbA1c
compared to their individual component regimens of alogliptin alone or metformin alone. Alogliptin
12.5 BID provided similar glycaemic control compared with alogliptin 25 once daily.
In patients inadequately controlled with metformin (322OPI-001), each individual combination of
alogliptin+pioglitazone achieved larger reductions in HbA1c at Week 26 compared with the
corresponding alogliptin and pioglitazone doses given alone. These differences were clinically
relevant. These data provide further support for the use of alogliptin in combination with metformin.
In addition to the specific combination trials of alogliptin with metformin, efficacy and safety of
alogliptin were studied in an extensive number of double blind randomized trials, including trials
with placebo and active comparators, and in combination with several other antidiabetic agents.
HbA1c was used as the primary endpoint. In the placebo controlled studies, the treatment effect of
alogliptin is modest (0.5-0.6%). These results have been discussed further in the marketing
application of alogliptin that is still pending and will not be repeated here.
Uncertainty in the knowledge about the beneficial effects
Cardiovascular beneficial effects
In the five main FDC trials, there was a numerically higher incidence of CV outcomes. However, the
numbers were very low. Alogliptin, when compared to placebo, was associated with a higher
cardiovascular event rate (Hazard ratio 1.33). However, in the Controlled Phase II and III Study
Group, cardiovascular event rate was lower compared to active comparators (Hazard ratio 0.8). In
addition, interim analyses of the cardiovascular outcome study demonstrated that alogliptin was
associated with a lower cardiovascular risk (Hazard ratio 0.81).
Elderly
Initially, there was uncertainty regarding alogliptin in elderly individuals and is also considered
relevant for the application of this FDC. In the pivotal alogliptin trials, the treatment effect of
alogliptin was not lower in patients > 65 years compared to patients < 65 years, but only 2% of the
patients treated with alogliptin were > 75 years of age (n=124). Therefore, a study in elderly
individuals was performed (study 303). Although alogliptin 25 mg and glipizide were statistically
non-inferior, the absolute changes in HbA1c after 1 year were clinically not relevant. The fact that
these results were observed in both treatment groups indicates that the observed efficacy response

CHMP assessment report
EMA/CHMP/207158/2013 Page 131/136
might be related to the specific study design, for example, the low baseline HbA1c and the inclusion
of subjects on monotherapy (with a short period of background therapy washout). Importantly,
results of the large pooled analysis of the 5 main Phase III, 26-week, placebo-controlled studies,
demonstrate relevant efficacy in the elderly, also in patients aged ≥75 years.
Non-inferiority compared to glipizide
For the combination with metformin, in the non-inferiority trial (322OPI-004), both alogliptin 25
mg and glipizide were associated with a clinically relevant reduction in HbA1c (-0.61% and -0.52%,
respectively) after 52 weeks. However, the glipizide dose in the comparator group was relatively
low (mean dose 5.2 mg). This is probably due to the dose titration algorithm. Following any
dose-titration, a subject who experienced hypoglycaemia was allowed to reduce the dose to as low
as 5 mg glipizide (or matching placebo) and continue the study on that dose. Following down
titration, subjects were not allowed to increase the dose again. With such a low dose of glipizide, the
CHMP concluded that non-inferiority of alogliptin when compared to SU as add-on therapy to
metformin has not been established. In addition, baseline HbA1c was relatively low in these
patients (7.6%). This decreases the power to detect any differences between treatments.
Long term effects
Although the extension study (study 012) was not intended for efficacy evaluation, after 4 years,
the increase in HbA1c with alogliptin 25 mg was clinically relevant (+0.61%). In addition, in study
303 in elderly individuals, efficacy after 1 year was small, but stable. In the two main non-inferiority
trials (study 322OPI-004 and 305) after 1 year, treatment effects of alogliptin were relatively
stable compared to glipizide (study 305) and compared to increasing the dose of pioglitazone
(study 322OPI-004).
Effects on beta cell function
There tended to be effects on estimates of endocrine pancreatic function. However, these effects
were not statistically significant in the majority of the studies. In addition, these serum measures
(such as fasting proinsulin, fasting insulin, proinsulin/insulin ratio, C peptide and HOMA) are only
surrogate estimates of pancreatic function.
Risks
Unfavourable effects
The safety profile of the FDC alogliptin/metformin is derived from five main phase III clinical studies
(008, 009, 011, 305, 322OPI-004) and from two supportive studies. A total of 4201 received
alogliptin in combination with metformin either as a background medication or as one of the initial
combination therapy. Treatment duration ranged from 16 to 52 weeks in the phase III studies.
Generally, the pattern of AEs observed in the alogliptin/metformin phase III studies was consistent
with the known safety profile of metformin, previous clinical trials with alogliptin (see below), and
conditions that are expected in this T2DM patient population. The most commonly (≥ 5% of
subjects) reported with combination treatment were nasopharyngitis, upper respiratory tract
infection, urinary tract infection, diarrhoea, headache, oedema peripheral, influenza, hypertension,
and arthralgia. Most TEAEs were considered mild or moderate in intensity and not related to study

CHMP assessment report
EMA/CHMP/207158/2013 Page 132/136
drug. TEAEs tended to occur more often within the system organ class (SOC) of infections and
infestations and the incidence was generally similar among treatment groups.
Regarding the mono components, the safety of metformin is sufficiently known. Regarding
alogliptin, the following safety topics were identified:
Hypersensitivity reactions
Safety results for alogliptin indicate a low incidence of hypersensitivity reactions. Nevertheless, 13
patients (0.2%) developed an anaphylactic reaction during alogliptin, whereas no patient
developed an anaphylactic reaction during treatment with placebo. During post marketing
surveillance in Japan, skin disorders, including Stevens Johnson, were reported. Consistent with
labeling for other DPP-4 inhibitors such reactions are now mentioned in the SmPC.
Pancreatitis
The frequency of pancreatitis events is low, but alogliptin was associated with a higher risk for
pancreatitis in comparison to comparators. Several cases of pancreatitis were reported post
marketing of which one was fatal. Given the increased risk of pancreatitis reported with other DPP-4
inhibitors, the risk of pancreatitis is included as Warning and Precautions in the SmPC, Section 4.4,
and acute pancreatitis is listed as an adverse reaction in Postmarketing Reports in the SmPC,
Section 4.8. Moreover, pancreatitis is now included as an identified risk in the Risk Management
Plan.
Malignancies
There is no safety signal for malignancies with alogliptin. Therefore, no special warning/precaution
is necessary for malignancies.
Pancreatic cancer
Based on all available data the CHMP considered that there was no clear evidence for an association
of pancreatic cancer and alogliptin treatment. Nevertheless, ‘Pancreatic cancer’ has been included
in the Risk Management Plan as an important potential risk (in line with the recommendation given
by CHMP at the July 2013 meeting for this class of products in the conclusions of the Art. 5(3)
referral for GLP 1 based therapies).
Hypoglycaemia
There was no increase in hypoglycaemia rate vs placebo when alogliptin 25 mg was administered
alone, or added on to metformin. In the case of alogliptin 25 mg used to form triple therapy with
metformin and pioglitazone in Study 322OPI-004, there was an increased rate of hypoglycaemic
episodes. In study 009 (add-on to TZD), there was a small increase in the rate of hypoglycaemic
episodes in the alogliptin 25 mg group. In study 011 (add-on to insulin, with or without metformin),
the incidence of hypoglycaemic episodes was higher with alogliptin 25 mg vs placebo.
Subgroups
No specific safety signals for alogliptin were observed in subgroup populations stratified by age.
Some adverse events were more common with alogliptin in elderly individuals. However, the
number of patients was limited, and the differences between alogliptin and placebo were small.

CHMP assessment report
EMA/CHMP/207158/2013 Page 133/136
Overall, no specific safety signals were observed with alogliptin in subgroup populations stratified
by race. In addition, no specific safety signals were observed with alogliptin in subgroup populations
stratified by BMI.
Uncertainty in the knowledge about the unfavourable effects
Patients with renal insufficiency
In patients with mild to moderate renal insufficiency, no safety signals were observed with
alogliptin. The number of patients with severe renal insufficiency in the pivotal studies was very low.
In the cardiovascular outcome study, 87 patients with severe renal insufficiency were studied for 6
months (43 treated with alogliptin and 44 treated with placebo). Of the TEAEs reported by ≥ 1% of
subjects with severe renal impairment, compared to placebo, alogliptin was associated with a
similar percentage TEA’s (87.9 % vs. 87.9%).
Metformin is contraindicated in patients with renal failure or dysfunction (creatinine clearance < 60
ml/min), therefore the FDC alogliptin/metformin can not be prescribed in these patients. No dose
reductions are recommended for patients with mild renal impairment (creatinine clearance ≥ 60
ml/min).
Patients with hepatic disease
Patients with hepatic disease were excluded in the phase II and III studies. In a pharmacokinetic
study in patients with moderate hepatic impairment, there were no adverse events and no clinically
meaningful changes in laboratory tests were reported. However, this was only a small group of
patients and alogliptin was administered only as a single dose. In addition, five cases of
hepatotoxicity, including one case of hepatic failure were reported postmarketing. An independent
committee concluded that the relationship between alogliptin and hepatotoxicity in three of the five
cases was deemed “probable” (50-74% probability) and in the remaining two was deemed
“possible” (25-49% probability). Within the context of the reassuring hepatic safety database for
the controlled clinical trials, and the lack of a “signature” presentation among alogliptin associated
liver events according to the committee treatment does not reach a “threshold of concern regarding
black box warnings, restrictions on usage, or monitoring requirements”. Although no causal
relationship between alogliptin and hepatic dysfunction has been established,these 5 cases provide
important knowledge about the risks of alogliptin in clinical practice. Therefore, hepatic dysfunction
has been included in the SmPC in section 4.4 (warnings and precautions) and 4.8 (undesirable
effects). Furthermore, hepatotoxicity is included in the RMP as important potential risk.
Metformin is contraindicated in patients with hepatic failure, therefore the FDC alogliptin/metformin
is contraindicated prescribed in hepatic impaired patients.
Benefit-risk balance
Importance of favourable and unfavourable effects
The applicant performed several clinical pharmacology studies and literature studies to show the
pharmacokinetics and pharmacodynamics of alogliptin and metformin administered alone or in

CHMP assessment report
EMA/CHMP/207158/2013 Page 134/136
combination. Additionally specific studies with the combination products were performed including
bioequivalence studies and a food-effect study. Overall, an additive, clinically relevant effect of the
combination of alogliptin and metformin compared to the monocomponents with respect to its
HbA1C lowering effect has been demonstrated.
The combination was not associated with weight gain, and there were no detrimental effects on
blood pressure and serum lipids. For the FDC alogliptin/metformin, no indication for T2DM patients
with moderate or severe renal insufficiency is requested by the applicant and the FDC is not
recommended for this subgroup. For T2DM patients with mild renal impairment no dose reduction
of the alogliptin component was proposed (in line with Vipidia).
The main goal of treatment of diabetes is the prevention of cardiovascular events. HbA1c is only a
surrogate endpoint. A beneficial effect of alogliptin on cardiovascular events has not been shown.
Nevertheless, interim analyses of the cardiovascular outcome study demonstrated that alogliptin
was associated with a lower cardiovascular risk (Hazard ratio 0.81). A final study report is expected
to be available during the 1st quarter of 2014
Generally, the pattern of AEs observed in the alogliptin/metformin phase III studies was consistent
with the known safety profile of metformin and previous clinical trials with alogliptin. Alogliptin was
associated with several relatively minor adverse events, such as headache, nasopharyngitis, and
upper respiratory tract infection. In comparison to other DPP-4 inhibitors, no potential new adverse
events emerged.
DPP-4 inhibitors in general have been associated with a potential risk of developing acute
pancreatitis. Similar to other DPP-4 inhibitors, alogliptin is associated with pancreatitis. In addition,
there have been spontaneously reported adverse reactions of acute pancreatitis with alogliptin in
the postmarketing setting in Japan. However, these events were rare, and consistent with labeling
for other DPP-4 the risk of pancreatitis is included as Warning and Precautions in the SmPC,
Section 4.4, and acute pancreatitis is listed as an adverse reaction in Postmarketing Reports in
SmPC, Section 4.8.
The risk of hypoglycaemia for alogliptin in combination with metformin and SU is only slightly
increased.
There is insufficient knowledge about efficacy and safety of alogliptin in patients with severe hepatic
disease. However, as metformin is contraindicated in patients with hepatic impairment, the FDC
alogliptin/metformin cannot be prescribed in these patients.
Discussion on the benefit-risk balance
The CHMP considered that the benefit-risk balance of alogliptin/metformin fixed dose combination
is positive.

CHMP assessment report
EMA/CHMP/207158/2013 Page 135/136
4. Recommendations
Outcome
Based on the CHMP review of data on quality, safety and efficacy, the CHMP considers by consensus
that the risk-benefit balance of Vipdomet in the treatment of of adult patients aged 18 years and
older with type 2 diabetes mellitus:
as an adjunct to diet and exercise to improve glycaemic control in adult patients,
inadequately controlled on their maximal tolerated dose of metformin alone, or those already
being treated with the combination of alogliptin and metformin.
in combination with pioglitazone (i.e. triple combination therapy) as an adjunct to diet and
exercise in adult patients inadequately controlled on their maximal tolerated dose of
metformin and pioglitazone.
in combination with insulin (i.e. triple combination therapy) as an adjunct to diet and exercise
to improve glycaemic control in patients when insulin at a stable dose and metformin alone
do not provide adequate glycaemic control.
is favourable and therefore recommends the granting of the marketing authorisation subject to the
following conditions:
Conditions or restrictions regarding supply and use
Medicinal product subject to medical prescription.
Conditions and requirements of the Marketing Authorisation
Periodic Safety Update Reports
The marketing authorisation holder shall submit the first periodic safety update report for this
product within 6 months following authorisation. Subsequently, the marketing authorisation holder
shall submit periodic safety update reports for this product in accordance with the requirements set
out in the list of Union reference dates (EURD list) provided for under Article 107c(7) of Directive
2001/83/EC and published on the European medicines web-portal.
Conditions or restrictions with regard to the safe and effective use of the medicinal product
Risk Management Plan (RMP)
The MAH shall perform the required pharmacovigilance activities and interventions detailed in the
agreed RMP presented in Module 1.8.2 of the Marketing Authorisation and any agreed subsequent
updates of the RMP.
In addition, an updated RMP should be submitted:
At the request of the European Medicines Agency;

CHMP assessment report
EMA/CHMP/207158/2013 Page 136/136
Whenever the risk management system is modified, especially as the result of new
information being received that may lead to a significant change to the benefit/risk profile or
as the result of an important (pharmacovigilance or risk minimisation) milestone being
reached.
When the submission of a PSUR and the update of a RMP coincide, they should be submitted at the
same time.
Conditions or restrictions with regard to the safe and effective use of the medicinal product to be implemented by the Member States.
Not applicable.
New Active Substance Status
Based on the CHMP review of data on the quality properties of the active substance, the CHMP
considers that alogliptin is qualified as a new active substance.