Vineyards and Wineries in Wisconsin - University of …€¦ · · 2014-05-16Vineyards and...
55
EXTENSION CENTER FOR COMMUNITY VITALITY IN PARTNERSHIP WITH: Vineyards and Wineries in Wisconsin A STATUS AND ECONOMIC CONTRIBUTION REPORT Authored by: Brigid Tuck, Extension Center for Community Vitality, and William Gartner, Department of Applied Economics
Transcript of Vineyards and Wineries in Wisconsin - University of …€¦ · · 2014-05-16Vineyards and...

EXTENSION CENTER FOR COMMUNITY VITALITY
IN PARTNERSHIP WITH:
Vineyards and Wineries in Wisconsin
A STATUS AND ECONOMIC CONTRIBUTION REPORT Authored by: Brigid Tuck, Extension Center for Community Vitality, and William Gartner, Department of Applied Economics


VINEYARDS AND WINERIES: WISCONSIN i
Partners/Sponsors: Northern Grapes Project Special Thanks To: Wisconsin Grape Growers Association Tim Martinson, Senior Extension Associate, Cornell University Chrislyn Patricka, Extension Support Specialist, Cornell University Patricia McManus, Professor, University of Wisconsin-Madison Tim Rehbein, Professor, University of Wisconsin Extension
Vineyards and Wineries in Wisconsin
A STATUS AND ECONOMIC CONTRIBUTION REPORT
May 2014 Authored by: Brigid Tuck and William Gartner
© 2014 Regents of the University of Minnesota. All rights reserved. University of Minnesota Extension is an equal opportunity educator and employer. In accordance with the Americans with Disabilities Act, this material is available in alternative formats upon request. Direct requests to the Extension Store at 800‐876‐8636. Printed on recycled and recyclable paper with at least 10 percent postconsumer waste material.
VINEYARDS AND WINERIES: WISCONSIN ii
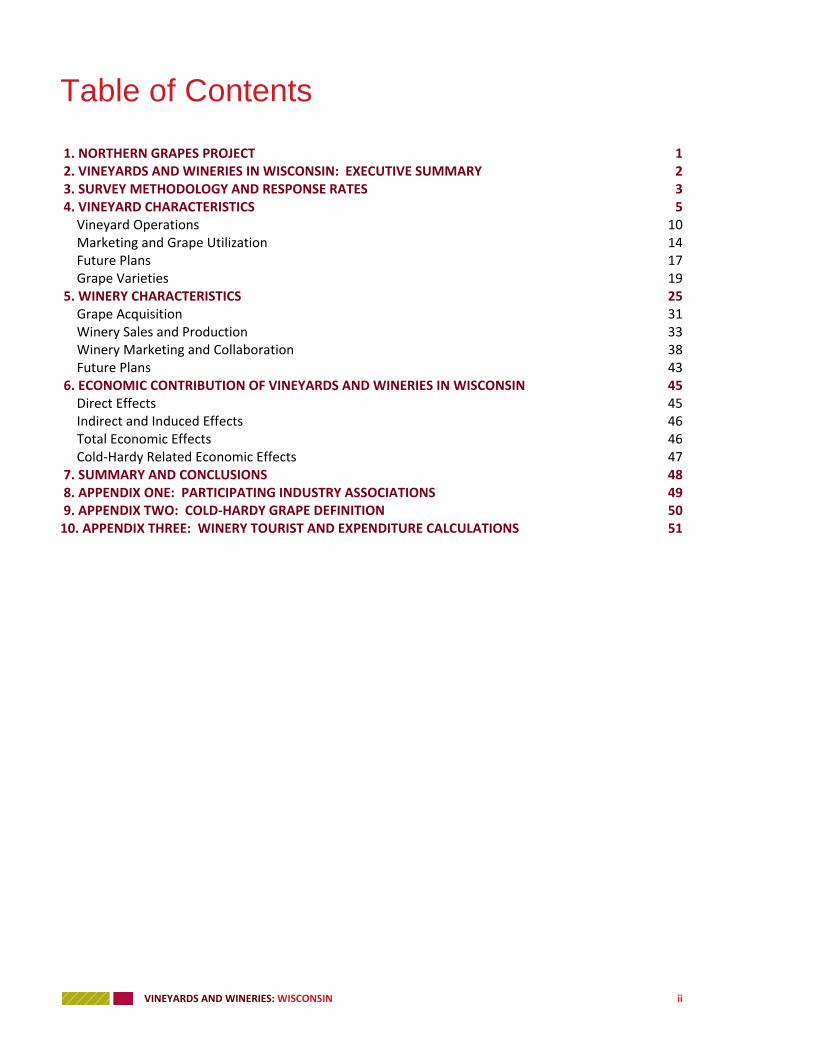
Table of Contents 1. NORTHERN GRAPES PROJECT 1 2. VINEYARDS AND WINERIES IN WISCONSIN: EXECUTIVE SUMMARY 2 3. SURVEY METHODOLOGY AND RESPONSE RATES 3 4. VINEYARD CHARACTERISTICS 5 Vineyard Operations 10 Marketing and Grape Utilization 14 Future Plans 17 Grape Varieties 19 5. WINERY CHARACTERISTICS 25 Grape Acquisition 31 Winery Sales and Production 33 Winery Marketing and Collaboration 38 Future Plans 43 6. ECONOMIC CONTRIBUTION OF VINEYARDS AND WINERIES IN WISCONSIN 45 Direct Effects 45 Indirect and Induced Effects 46 Total Economic Effects 46 Cold‐Hardy Related Economic Effects 47 7. SUMMARY AND CONCLUSIONS 48 8. APPENDIX ONE: PARTICIPATING INDUSTRY ASSOCIATIONS 49 9. APPENDIX TWO: COLD‐HARDY GRAPE DEFINITION 50 10. APPENDIX THREE: WINERY TOURIST AND EXPENDITURE CALCULATIONS 51
VINEYARDS AND WINERIES: WISCONSIN 1
NORTHERN GRAPES PROJECT
The emergence of cold hardy wine grape cultivars in the 1990s created a new and rapidly expanding industry of small vineyard and winery enterprises in states across New England, northern New York, and the Upper Midwest. While the North American ancestry of these cultivars confers exceptional climatic adaptation and disease resistance, other challenges to production, processing, and marketing have slowed their successful commercialization in regional and national markets. Because their growth habit and fruit composition differ from traditional grape hybrids, new viticulture and enological practices are needed. Marketing tools are also required to educate consumers unfamiliar with the grapes and the wine styles they produce. Consequently, the long-term viability of these new businesses requires coordinated research and extension to optimize viticulture, enological (winemaking), business management, and marketing practices. To meet the needs articulated by industry stakeholders, the United States Department of Agriculture funded the Northern Grapes Project.
The Northern Grapes Projects brings together researchers, Extension specialists, and industry professionals from 13 states to address viticulture, enological, business management, and marketing issues related to growing cold hardy grapes and the wine produced from them. After five years, the project teams intend to have accomplished the following goals: 1) production and sales of wines made from cold climate cultivars will have doubled, 2) improved quality resulting from better growing and winemaking practices will have improved customer retention and driven repeat sales, 3) enhanced breeding and cultivar evaluation will have resulted in an accelerated pace of cultivar release, 4) cold climate cultivars will establish unique regional marketing identities in their area, 5) wineries will have understood and applied business and tasting room management practices that drive sales and profitability, and 6) wineries and vineyards will have successfully transitioned from “startup” to “sustainably profitable.”
To measure progress on these goals, one of the first tasks of the project team was to conduct a baseline survey. This survey, sent to grape growers and wineries in the participating states, gathered data on the current status of the grape and wine industries in general and on cold-hardy grape and wine production, specifically. Questions were asked pertaining to sales and production (wineries and vineyards), growing practices (vineyards), and operating practices (wineries). The definition of a cold-hardy grape can be found in appendix two.
This document reports the results of the baseline survey for vineyards and wineries in Wisconsin. It also quantifies the economic contribution of the industries.
VINEYARDS AND WINERIES: WISCONSIN 2
VINEYARDS AND WINERIES IN WISCONSIN: EXECUTIVE SUMMARY
In spring 2012, grape growers and winery owners in 13 states were surveyed under the Northern Grapes Project. Questions asked pertained to sales and production (wineries and vineyards), growing practices (vineyards), and operating practices (wineries). The goal was to establish industry baselines and quantify the economic contribution of the industries. This report presents the results for Wisconsin.
Cold-hardy grapes dominate the wine and grape growing industries in Wisconsin. Eighty-three percent of grapes grown are of the cold-hardy cultivars and 58 percent of grapes used in wine production are cold-hardy.
The release of cold-hardy grape cultivars helped fuel growth in the vineyard industry in Wisconsin. Growth was most rapid in the period from 2002 to 2007. Indications from the baseline survey show growth in the grape growing industry in Wisconsin is tapering off slightly as the industry begins to mature.
Vineyard owners are concerned about disease and pests/insects. Wisconsin grape growers listed disease and pests/insects as the top two biggest challenges to the growth and development of their vineyard.
Growth in the number and size of wineries continues to be strong. Over half of the surveyed wineries were established after 2007. Sixty percent of wineries intend to significantly expand in the next five years, underscoring the continued need to support the industry.
Wisconsin wineries cite sales and government policies and regulations as the primary challenges to the future growth and development of their winery. Nearly three-fourths of Wisconsin wineries are located in rural areas. Over 80 percent of their sales are from their tasting rooms. Therefore, Wisconsin wineries need to continue to attract and draw customers to their site. Wisconsin wineries are unique from their counterparts in other states in that they indicate a close working relationship with their local convention and visitor’s bureaus.
In 2011, the winery and grape growing industries in Wisconsin created $119.8 million in economic impact. This included the support of 2,030 jobs paying $29.0 million in labor income. Vineyards contributed $5.9 million in economic activity, wineries $67.7 million, and winery tourists $46.2 million.
Cold-hardy grapes contributed $71.1 million in economic activity to Wisconsin’s economy. This included 1,400 jobs and $17.2 million in labor income.

VINEYARDS AND WINERIES: WISCONSIN 3
SURVEY METHODOLOGY AND RESPONSE RATES
In early 2012, project researchers at the University of Minnesota sent a survey to grape growers and wineries in the participating states. Grower and winery lists were provided to the University of Minnesota by industry associations in each state (see appendix one for a list of participating associations). An email was sent to all members of these lists, resulting in 2,746 invitations to participate in the survey. Of these, 501 responded, for an overall response rate of 18 percent. In addition, links to the survey were available allowing individual growers and wineries not directly associated with an industry group, and thus not receiving a direct email invitation, to participate in the survey. These links were also announced during the Northern Grapes Project webinars. The survey links generated 110 responses. Therefore, in total, there were 611 total responses to the survey.
Table 1-1 lists the participating states, the number of wineries and growers invited based on the industry association lists, the number of respondents using the open links, and the response rate.
Minnesota has the highest membership totals.1 South Dakota had the highest response rate.
The Wisconsin Grape Growers Association provided e-mail addresses for their respective membership. In total, 476 invitations to participate in the survey were sent to potential Wisconsin growers and wineries. Of those, 97 individuals responded, for a response rate of 20 percent.
Table 1-1: Northern Grapes Project Baseline Study Participating States, Response Rates
State Total Number of Contacts from Industry Associations
Number of Responses
Response Rates
Connecticut 32 5 16%
Illinois 272 52 19%
Iowa 222 66 30%
Massachusetts 28 10 36%
Michigan 164 36 22%
Minnesota 1,012 167 17%
North Dakota 54 14 26%
Nebraska 172 46 27%
New Hampshire 51 14 27%
New York 202 32 16%
South Dakota 14 11 79%
Vermont 47 18 38%
Wisconsin 476 97 20%
1 Responses were categorized by state the grower or winery owner indicated as the state in which their operation is
located.
VINEYARDS AND WINERIES: WISCONSIN 4
Not all of the survey responses were applicable to the baseline survey. Association memberships are generally open to all interested parties and therefore membership lists include individuals who may be considering growing or producing wine, or individuals who previously grew grapes or produced wines. The lists may also contain people associated with the industry in other capacities than growing and wine-making. Knowing this, the survey was designed to capture basic information on these individuals, even if they did not complete the full survey.
The first survey question asked “Are you associated with….1) a vineyard (past, present, or future), 2) a winery, 3) both, or 4) other. Those responding “other” were directed to the end of the survey.
Those responding “vineyard (past, present, or future)” were asked a follow-up question. Survey takers who indicated they grew grapes in the past or planned to grow grapes in the future were directed to the end of the survey.
The focus of the Northern Grapes Project is on commercial scale grape growers and wineries. Thus, grape growers were asked “Do you grow grapes for commercial sale or use? If you grow grapes exclusively for use in your own winery, answer yes”. Those responding “no” were directed to answer a series of questions about the size of their vineyard and then directed to the end of the survey.
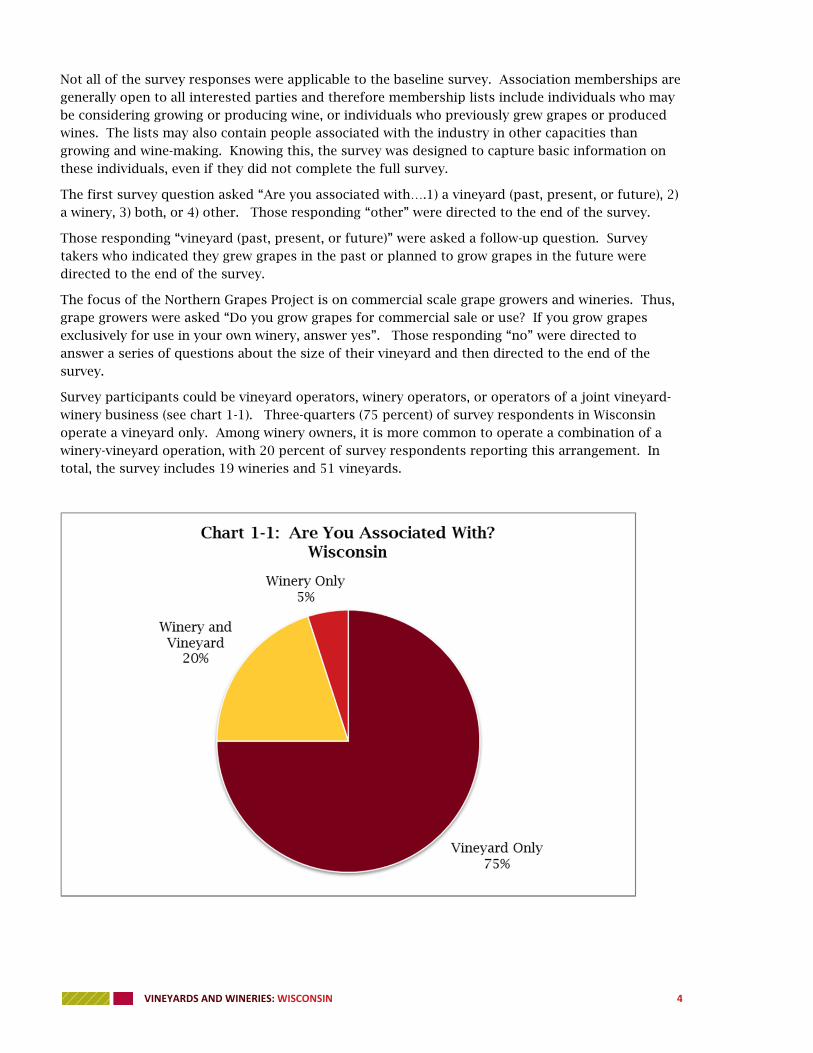
Survey participants could be vineyard operators, winery operators, or operators of a joint vineyard-winery business (see chart 1-1). Three-quarters (75 percent) of survey respondents in Wisconsin operate a vineyard only. Among winery owners, it is more common to operate a combination of a winery-vineyard operation, with 20 percent of survey respondents reporting this arrangement. In total, the survey includes 19 wineries and 51 vineyards.

VINEYARDS AND WINERIES: WISCONSIN 5
VINEYARD CHARACTERISTICS
The Northern Grapes Project survey was completed by 51 vineyards in Wisconsin. The National Agricultural Statistics Service reports 253 vineyards in the state. Therefore, the response rate for this study is estimated to be 20 percent.
The Northern Grapes Project baseline survey results reinforce the observed trend of rapid growth in the grape growing industry in Wisconsin (see chart 1-2). Growth appears to have been most rapid from the period from 2002 to 2007. Typically, a vineyard does not reach full production capacity until three to four years after planting. Vines planted after 2007 are just now or have yet to reach maturity and yield to their full potential.

VINEYARDS AND WINERIES: WISCONSIN 6
In addition to new vineyards being established, current vineyards have expanded their planted acreage moderately. Two-thirds (65 percent) of responding vineyards indicated they had planted additional acreage since the original founding of their vineyard (see chart 1-3).

VINEYARDS AND WINERIES: WISCONSIN 7
The majority of responding vineyards (79 percent) are greater than 2.0 acres in size (see chart 1-4). One-third of the vineyards report having more than 5 acres planted in grapes. Our survey results, extrapolated out to the entire population of vineyards, indicate there are 708 acres planted in grape vines in Wisconsin. Survey results show that 83 percent, or 590 acres, of the planted vines are of the cold-hardy varieties defined in this study. The varieties classified as “cold-hardy” for purposes of this report are listed in appendix two.

VINEYARDS AND WINERIES: WISCONSIN 8
Vineyard production reflects the age of vineyards and the size of vineyards in the survey population (see chart 1-5). Nearly one-quarter (22 percent) of the vineyards surveyed indicated they did not produce any fruit in 2011. As depicted in chart 1-2, 36 percent of vineyards were planted after 2007, which means they likely have not reached maturity yet. Therefore, it is not surprising they have not produced harvestable fruit.
Survey results, extrapolated to represent all growers in the state, reveal Wisconsin grape growers produced approximately 1,400 tons of fruit in 2011. Average yield on producing acreage was 2.2 tons per acre.

VINEYARDS AND WINERIES: WISCONSIN 9
The average participating vineyard has 1,400 planted vines. One-third of vineyards have fewer than 500 vines in the ground (see chart 1-6). Interestingly, one-third of vineyards report having more than 5 acres planted in grapes, but only 16 percent have more than 3,000 vines in the ground. Given a wide vine spacing of 9 feet by 8 feet, an acre could accommodate 605 vines. Therefore, a 5 acre planting would be expected to have at least 3,000 vines.

VINEYARDS AND WINERIES: WISCONSIN 10
Vineyard Operations
The majority (72 percent) of vineyards operate as stand-alone agriculture enterprises (see chart 1-7). Approximately one-fourth of vineyards participating in the survey operate as a secondary agricultural operation. Those vineyard owners that operate the vineyard as a secondary operation report their primary operation as traditional agriculture (both crops and livestock) and other fruit and berry operations.

VINEYARDS AND WINERIES: WISCONSIN 11
The average responding vineyard spent $5,500 on operations (of which $2,600 were labor payments) in 2011. Operating expenses include fertilizers, fungicides, cover crops, water, fuel, overhead costs, marketing, and taxes. Responding vineyards also spent an average of $6,600 on capital investments, including trellis systems, tractors, crushers, pick-ups, ATV’s, and other equipment.
In total, vineyards in the state of Wisconsin spent $3.1 million. Of this, $1.4 million was spent on operating expenses (including $650,000 on labor) and $1.7 million on capital expenditures in 2011.
Wisconsin wineries spent 54 percent of their total expenditures on capital investment (see chart 1-8). Capital investment expenditures are often higher during periods of growth.
Labor21%
Operations (no labor)25%
Capital Investment
54%
Chart 1-8: Vineyard Expenditures by Category: Wisconsin n=45

VINEYARDS AND WINERIES: WISCONSIN 12
Of the 34 vineyards that responded to the question regarding labor expenditures, 49 percent reported no expenditures for labor (see chart 1-9). This is primarily because the owner/operator did all the labor or the vineyard used volunteer or family labor to complete the vineyard tasks.

VINEYARDS AND WINERIES: WISCONSIN 13
As shown in Chart 1-10, the majority of labor for the responding vineyards was provided by the owner/operator (60 percent). Nearly 30 percent of labor was supplied by paid employees and 11 percent by volunteer laborers.

VINEYARDS AND WINERIES: WISCONSIN 14
Marketing and Grape Utilization
Grape growers in the survey use a mix of methods for marketing their grapes (see chart 1-11). Growers were asked which market arrangements they used to sell their grapes. They could select more than one choice. Fourteen growers indicated they sold grapes “via other channels”. Also commonly used were sales via contract with a winery. Those indicating “sold via other channels” stated in the open-ended explanation that they did not sell due to lack of production, that they used verbal agreements, or that they sold small amounts to home winemakers or at farmer’s markets.
VINEYARDS AND WINERIES: WISCONSIN 15
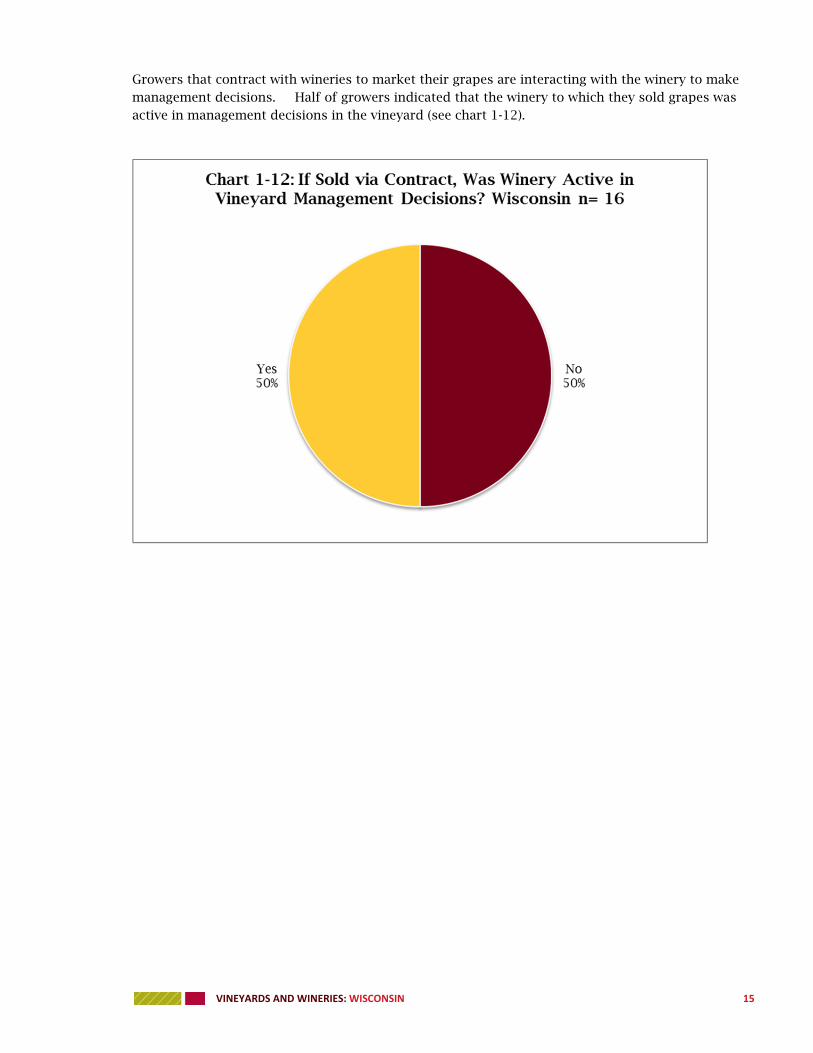
Growers that contract with wineries to market their grapes are interacting with the winery to make management decisions. Half of growers indicated that the winery to which they sold grapes was active in management decisions in the vineyard (see chart 1-12).

VINEYARDS AND WINERIES: WISCONSIN 16
The most common arrangement for vineyards is to sell their grapes in a whole berry format (see chart 1-13). Twenty-nine percent sold their grapes whole to an in-state winery. Another 16 percent sold their grapes whole to their own winery. This reinforces the knowledge that grape growing and wineries are often local operations, working and contributing to the communities in which they are located. None of the responding grape growers reported selling out of the state.
Twenty-nine percent of the vineyards indicated their grapes went to “other” uses. When asked to specify, responses were primarily either 1) no production due to the vines having not yet reached maturity or 2) used for personal purposes.

VINEYARDS AND WINERIES: WISCONSIN 17
Future Plans
Current grape growers are planning to grow. Fifty-seven percent of responding vineyards plan to grow in the next 2 years. Forty-one percent plan on maintaining their current size. One vineyard is considering decreasing slightly (see chart 1-14).

VINEYARDS AND WINERIES: WISCONSIN 18
Grape growers responding to the survey indicate that the biggest challenges to their vineyard operations are pests and insects (see chart 1-15). When asked to answer the question “the following is a challenge to the growth and development of my vineyard”, using a scale where 1 equals “strongly disagree” and 5 equals “strongly agree”, grape growers gave pests/insects an average score of 3.7 and disease an average score of 3.6. Availability of unskilled labor and sales do not appear to be prime concerns of growers in Wisconsin. However, cost of labor rated at 3.4 and the cost of labor is related to labor availability.
When asked what other challenges they face, grape growers indicated difficult climate conditions, time, and limited resources as concerns.

VINEYARDS AND WINERIES: WISCONSIN 19
Grape Varieties
Survey participants reported 71,699 planted vines in their vineyards. Of these, the majority (58,300) are vines of cold-hardy varieties. The majority of these cold hardy vines (34,400) are red cultivars. The remaining vines (24,000) are white cultivars. Chart 1-16 depicts total reported planted vines of cold-hardy red varietals. Marquette grapes comprise 42 percent of the total planted cold-hardy red varieties. Frontenac and Marechal Foch comprise 26 percent and 9 percent respectfully. This chart illustrates the sheer popularity of the Marquette grape. This varietal is relatively new (released in 2006), so the fact that it is now 40 percent of all planted red varietals is remarkable.
Table 1-2 reports the number of reported planted red cultivar vines by age. These figures represent only what the 45 vineyards (representing 20 percent of the industry in Wisconsin) who answered the survey reported. Responding vineyards reported 1,800 red cultivar vines are older than 10 years of age, 15,200 are between 4 years and 10 years of age, and 17,300 are younger than 4 years old. These figures again represent the rapid growth of the industry. Vines younger than 4 years of age have yet to reach maturity and produce a full crop. The reported results indicate that red cold-hardy cultivar grape production could double in the next four years as those vines mature.
Further, the table reflects the rapid growth of the Marquette grape variety. Ten years ago, there were no Marquette vines in the ground. Within the last four years, the responding vineyards alone report planting nearly 10,000 vines. The other prominent cold-hardy red varieties, Frontenac and Marechal Foch, have been planted in fewer numbers in recent years.

VINEYARDS AND WINERIES: WISCONSIN 20
Table 1-2: Planted Vines of Cold-Hardy Red Varieties by Responding Vineyards, by Age, Wisconsin
Variety Vines, Younger
than 4 Vines, Between 4
and 10 Years Vines, Older than
10 Total
Baltica 0 6 0
6
Beta 40 35 35
110
Frontenac 3,282 5,083 606
8,971
GR-7 50 15 0
65
King of the North 622 455 2
1,079
Leon Millet 26 136 233
395
Marechal Foch 649 1,695 716
3,060
Marquette 9,944 4,338 0
14,282
Petite Pearl 519 0 2
521
Sabrevois 1,459 1,187 4
2,650
St. Croix 326 2,051 129
2,506
Valiant 16 10 2
28
Other Red 400 202 91
693
Total
17,333
15,213
1,820
34,366
The totals in this table are for responding vineyards only and do not represent the total industry in Wisconsin.

VINEYARDS AND WINERIES: WISCONSIN 21
Table 1-3 lists the estimated number of planted acres of cold-hardy red cultivars in Wisconsin. These numbers have been extrapolated to represent all vineyards in Wisconsin. In Wisconsin, there are an estimated 280 acres of grapes planted in cold-hardy red varieties. The Marquette grape is planted on 117 of those acres.
Table 1-3: Estimated Planted Acres of Cold-Hardy Red Varieties for All Vineyards in Wisconsin
Variety Total
Baltica 0.0
Beta 0.9
Frontenac 73.6
GR-7 0.5
King of the North 8.8
Leon Millet 3.2
Marechal Foch 25.1
Marquette 117.1
Petite Pearl 4.3
Sabrevois 21.7
St. Croix 20.5
Valiant 0.2
Other Red 5.7
Total 281.8
The totals in this table have been extrapolated to represent all vineyards in Wisconsin.

VINEYARDS AND WINERIES: WISCONSIN 22
Chart 1-17 illustrates the total planted vines of cold-hardy white varietals. Frontenac gris (27 percent) and Brianna (19 percent) are the most commonly planted vines by the reporting vineyards. Within the white cold-hardy cultivars, there is no clear favorite cultivar.
Table 1-4 reports the total reported planted vines of cold-hardy white cultivars. These figures represent only what the vineyards who answered the survey reported. Responding vineyards report 530 vines older than 10 years in the ground, 14,700 vines of age between 4 and 10 years, and 8,800 vines younger than 4 years. Unlike the red cultivars, plantings of cold-hardy white grapes have declined in recent years.

VINEYARDS AND WINERIES: WISCONSIN 23
Table 1-4: Planted Vines of Cold-Hardy White Varieties by Responding Vineyards, by Age, Wisconsin
Variety Vines, Younger
than 4 Vines, Between 4
and 10 Years Vines, Older
than 10 Total
Brianna 2,512 1,954 2
4,468
Edelweiss 256 842 231
1,329
Espirit 11 233 0
244
Frontenac Blanc 216 0 0
216
Frontenac Gris 2,791 3,592 8
6,391
Kay Gray 0 22 2
24
La Crescent 1,067 2,468 88
3,623
La Crosse 183 1,501 0
1,684
Louise Swenson 915 50 24
989
Petite Amie 15 0 0
15
Prairie Star 449 1,140 78
1,667
St. Pepin 287 2,844 2
3,133
Other White 56 22 96
174
Total 8,758
14,668
531
23,957
The totals in this table are for responding vineyards only and do not represent the total industry in Wisconsin.

VINEYARDS AND WINERIES: WISCONSIN 24
Table 1-5 lists the estimated number of planted acres of cold-hardy white cultivars in Wisconsin. These numbers have been extrapolated to represent all vineyards in Wisconsin. In Wisconsin, there are an estimated 196 acres of grapes planted in cold-hardy white varieties. The Frontenac gris grape is planted on 52 acres and the Brianna on 37.
Table 1-5: Estimated Planted Cold-Hardy Acres of White Varieties for All Vineyards in Wisconsin
Variety Total
Brianna 36.6
Edelweiss 10.9
Espirit 2.0
Frontenac Blanc 1.8
Frontenac Gris 52.4
Kay Gray 0.2
La Crescent 29.7
La Crosse 13.8
Louise Swenson 8.1
Petite Amie 0.1
Prairie Star 13.7
St. Pepin 25.7
Other White 1.4
Total 196.4
The totals in this table have been extrapolated to represent all vineyards in Wisconsin.
VINEYARDS AND WINERIES: WISCONSIN 25
WINERY CHARACTERISTICS
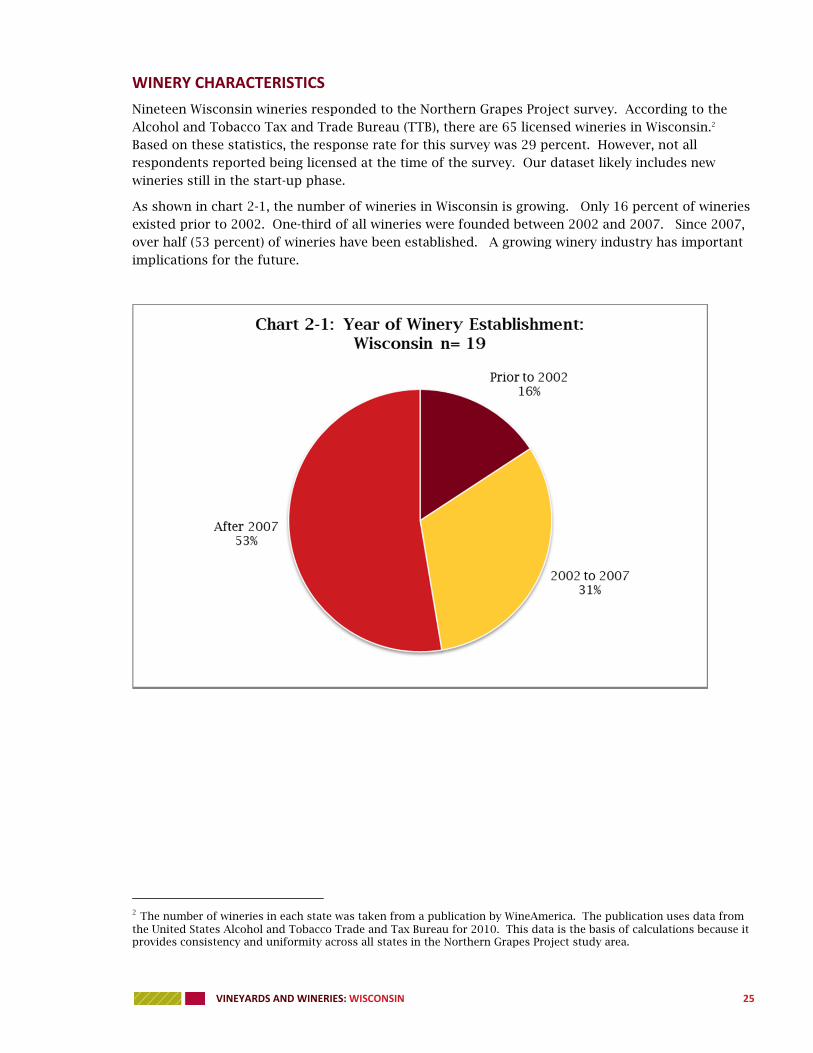
Nineteen Wisconsin wineries responded to the Northern Grapes Project survey. According to the Alcohol and Tobacco Tax and Trade Bureau (TTB), there are 65 licensed wineries in Wisconsin.2 Based on these statistics, the response rate for this survey was 29 percent. However, not all respondents reported being licensed at the time of the survey. Our dataset likely includes new wineries still in the start-up phase.
As shown in chart 2-1, the number of wineries in Wisconsin is growing. Only 16 percent of wineries existed prior to 2002. One-third of all wineries were founded between 2002 and 2007. Since 2007, over half (53 percent) of wineries have been established. A growing winery industry has important implications for the future.
2 The number of wineries in each state was taken from a publication by WineAmerica. The publication uses data from the United States Alcohol and Tobacco Trade and Tax Bureau for 2010. This data is the basis of calculations because it provides consistency and uniformity across all states in the Northern Grapes Project study area.

VINEYARDS AND WINERIES: WISCONSIN 26
The majority of Wisconsin’s wineries (72 percent) are located in rural areas, outside of cities and urban center (see chart 2-2). There are a few wineries located in small, medium, and large cities. Small town is defined as a city with a population of less than 2,500 residents. A medium city has a population between 2,500 and 20,000. A large city is defined as a city with more than 20,000 residents, but not part of a metropolitan area.

VINEYARDS AND WINERIES: WISCONSIN 27
Red and white wines are the most commonly produced wines by Wisconsin wineries (see chart 2-3). Wineries are also commonly producing blends, rose, and fruit wines. Only a few wineries are producing ice and sparkling wines. Study results show wineries in Wisconsin produced 630,000 gallons of wine in 2011 or an average of 9,600 gallons per winery.

VINEYARDS AND WINERIES: WISCONSIN 28
Forty-two percent of Wisconsin wineries currently participate in a wine trail (see chart 2-4). Wine trails have grown in popularity in recent years. These results indicate there is opportunity for further development of this marketing activity in Wisconsin.

VINEYARDS AND WINERIES: WISCONSIN 29
Eighty-four percent of Wisconsin wineries operate a tasting room in conjunction with their winery (see chart 2-5). Half (53 percent) of wineries charge for tastings. Fifty percent of the wineries offer food with their wine service. On average, each winery served over 16,000 tasting room customers. Wineries estimate that 47 percent of their tasting room visitors are repeat customers.

VINEYARDS AND WINERIES: WISCONSIN 30
Wineries also reported on events held at their winery in 2011. In total, the responding wineries (18) hosted 34,000 guests at winery events, roughly half who were from outside the local area. Specifically, wineries were asked to report how many people attended the following types of events: grape stomps, wine-making classes, tour groups, live music, weddings, ladies-only events, charitable events, and other events. The breakdown of which events these guests attended is shown in chart 2-6. Live music events and tour groups drew the most people to the responding wineries in 2011, accounting for 73 percent of winery visitors.

VINEYARDS AND WINERIES: WISCONSIN 31
Grape Acquisition
Wineries in Wisconsin purchased $2.3 million of grapes in 2011, from their own vineyards and from other vineyards. On average, each winery spent $35,000 to buy grapes. An estimated fifty-eight percent of the grapes used by wineries were cold-hardy varieties.3
Wineries participating in the survey report the most common methods for acquiring grapes and fruits are by purchasing grapes from their own vineyard and purchasing whole grapes from another source. Use of non-grape fruits is rather limited among the surveyed wineries, although seven wineries report purchasing non-grape fruit (see chart 2-7).
3 Percent of grapes designated as cold-hardy derived from survey question to wineries. Question read “what percent of your grapes utilized in your wine production are from cold-hardy hybrids.”
VINEYARDS AND WINERIES: WISCONSIN 32
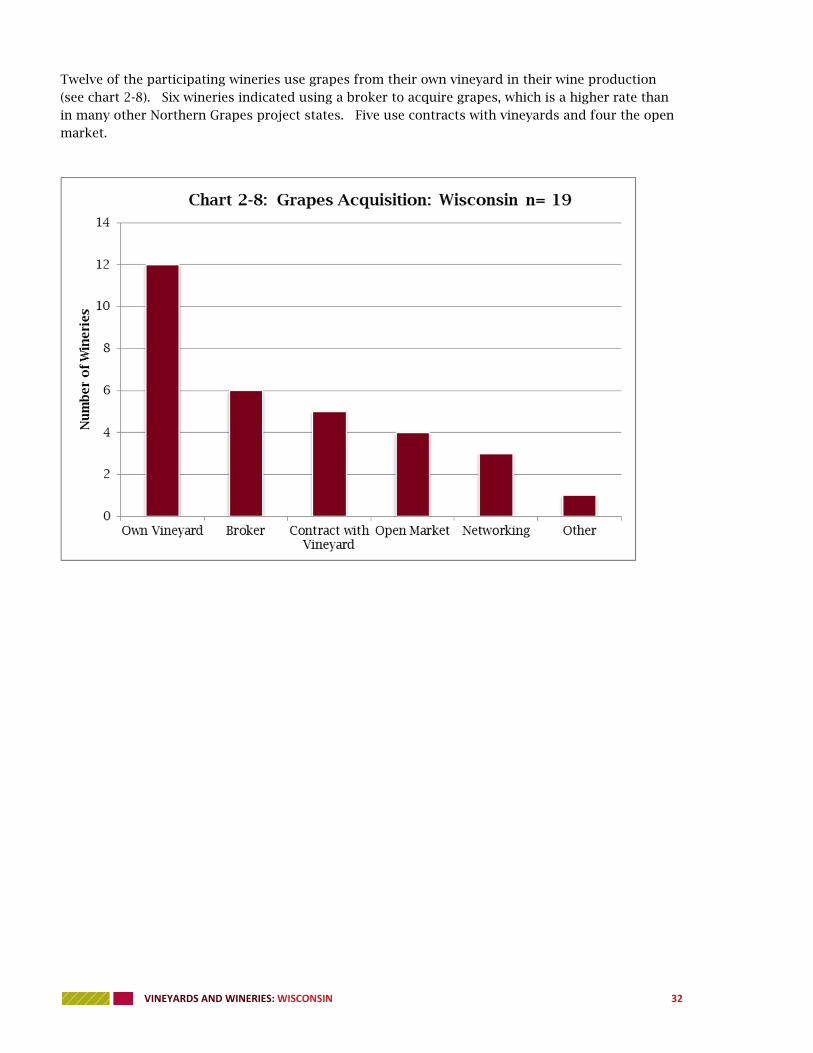
Twelve of the participating wineries use grapes from their own vineyard in their wine production (see chart 2-8). Six wineries indicated using a broker to acquire grapes, which is a higher rate than in many other Northern Grapes project states. Five use contracts with vineyards and four the open market.

VINEYARDS AND WINERIES: WISCONSIN 33
Winery Sales and Production
In total, wineries in Wisconsin had sales of $34.9 million in 2011, an average of $540,000 per winery. Of total sales, $20.3 million were generated from wines crafted from cold-hardy grapes. Wine sales, including bottles sold and tasting room fees, are the primary source of revenue for wineries, accounting for 90 percent of all sales (see chart 2-9). Wineries produced, on average, 9,600 gallons of wine.

VINEYARDS AND WINERIES: WISCONSIN 34
Wineries in Wisconsin sold an estimated 2.5 million bottles of wine in 2011 or an average of 38,500 bottles per winery.4 Eighty-four percent of wineries operate a tasting room and nearly three-quarters of an average winery’s sales are through the tasting room or to winery visitors (see chart 2-10). Approximately seventeen percent of sales are via distributors and liquor stores. Sales to Farmer’s Markets, restaurants, and direct-to-households account for only a minor portion of sales.
4 Based on a standard bottle size of 750 mL.
VINEYARDS AND WINERIES: WISCONSIN 35
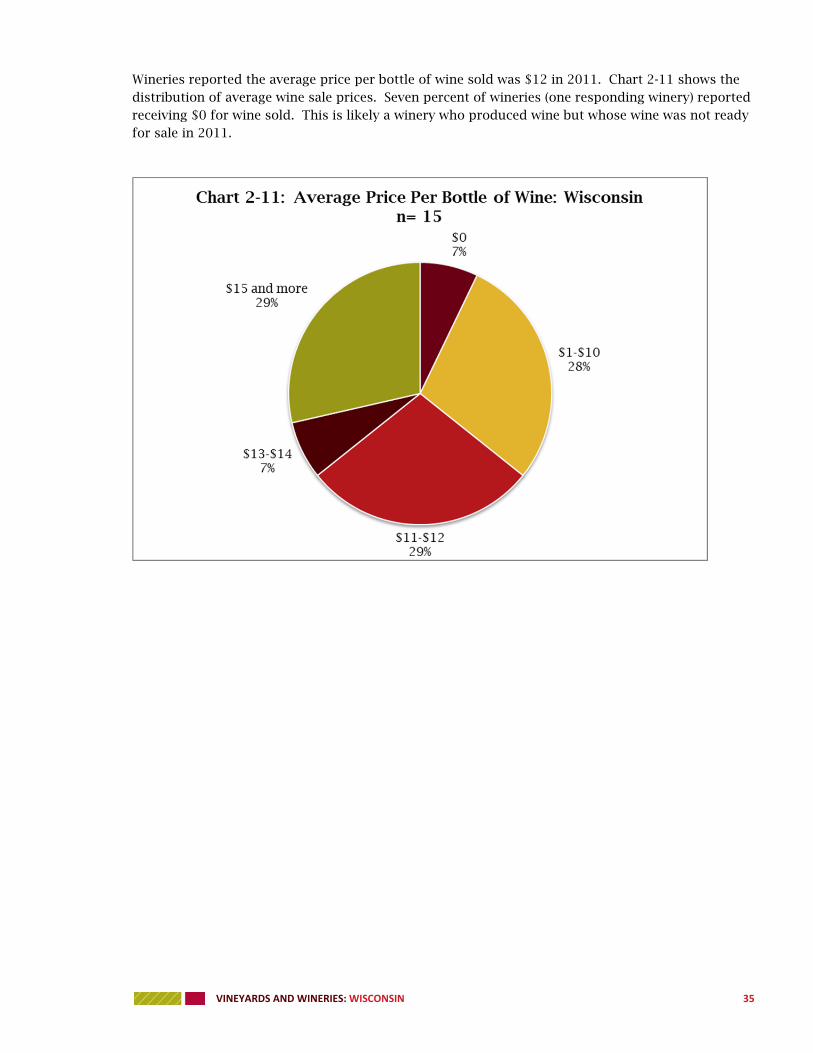
Wineries reported the average price per bottle of wine sold was $12 in 2011. Chart 2-11 shows the distribution of average wine sale prices. Seven percent of wineries (one responding winery) reported receiving $0 for wine sold. This is likely a winery who produced wine but whose wine was not ready for sale in 2011.

VINEYARDS AND WINERIES: WISCONSIN 36
As mentioned, the average responding winery produced 9,600 gallons of wine. The majority of the wine (94 percent) produced was sold (see chart 2-12). Wineries put five percent of the gallons of wine produced into inventory. A small percent (1 percent) of wine produced was utilized in other ways (e.g. gifts, donations, shrinkage, etc.).
Sold94%
Inventory5%
Other (Gifts, Shrinkage, etc)
1%
Chart 2-12: Distribution of Wine Produced: Wisconsin n= 18

VINEYARDS AND WINERIES: WISCONSIN 37
Wineries in Wisconsin employ an estimated total of 390 individuals. On average, each winery employs 6 individuals; 2.5 full-time year-round people, 1.5 part-time, year round people, and 1.5 full-time, seasonal people (see chart 2-13).
In 2011, wineries paid $3.9 million in labor income with an average of $61,000 per winery. Volunteer labor is an important component of winery operations. In 2011, wineries used 1,000 hours of volunteer labor per winery.
Labor income per winery employee is relatively low, averaging $10,000 per person. The reliance on part-time and seasonal help likely lowers the average per person.
0
0.5
1
1.5
2
2.5
3
Full-time, Year Round Part-time, Year Round Full-time, Seasonal
Nu
mb
er o
f Em
plo
yee
s
Chart 2-13: Average Employment Per Winery 2011: Wisconsin n=18

VINEYARDS AND WINERIES: WISCONSIN 38
Winery Marketing and Collaboration
Wineries were asked to rate a list of marketing strategies on a scale where 1 indicated the strategy was “unimportant” for their marketing and 5 indicated it was “very important”. As shown in Chart 2-14, winery owners believe that branding their own wines is the most important marketing strategy they can employ, assigning it an average score of 4.2. Special events and state winery/vineyard associations or councils were also assigned relatively high scores. Winery owners assigned the lowest average scores to vineyard tours and wine clubs. Just over half (53 percent) of wineries offer vineyard tours.

VINEYARDS AND WINERIES: WISCONSIN 39
Wineries were also asked about their current collaboration efforts. They were asked, on a scale where 1 equals “none” and 5 equals “a great deal”, “to what extent do you currently collaborate with the following entities?” Only collaboration with tourism organizations and other wineries earned scores over 3.0. This would indicate there are opportunities to increase collaboration.
VINEYARDS AND WINERIES: WISCONSIN 40
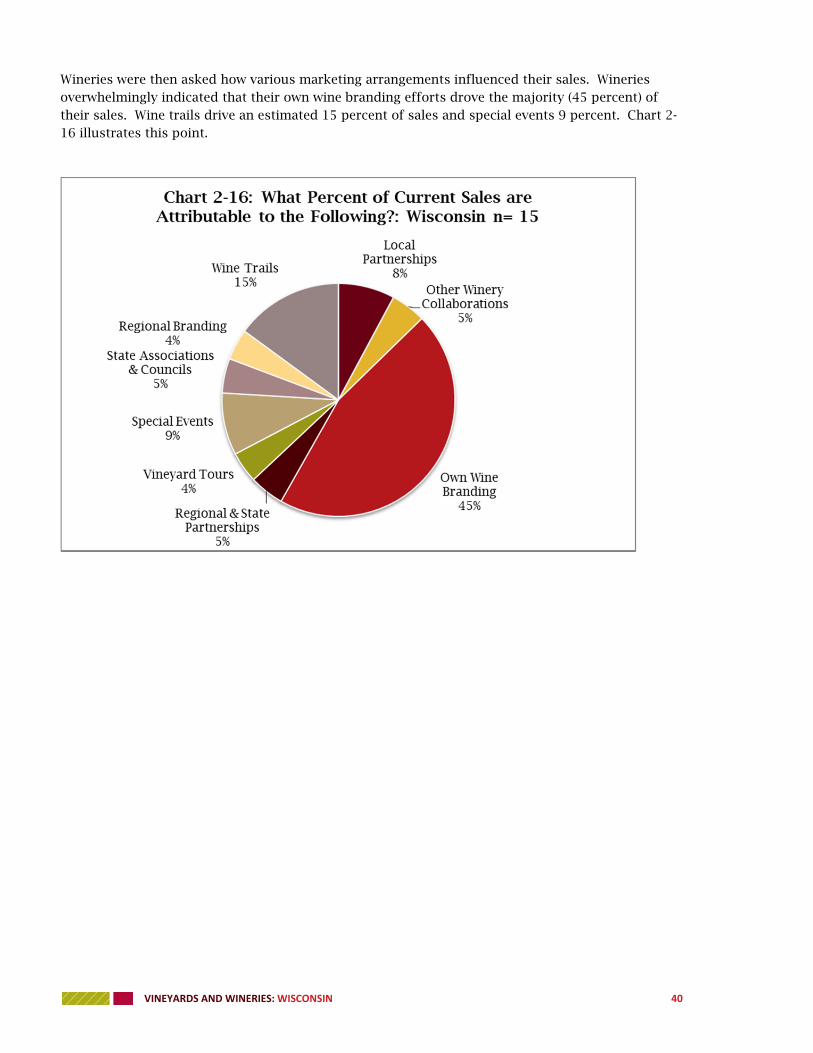
Wineries were then asked how various marketing arrangements influenced their sales. Wineries overwhelmingly indicated that their own wine branding efforts drove the majority (45 percent) of their sales. Wine trails drive an estimated 15 percent of sales and special events 9 percent. Chart 2-16 illustrates this point.

VINEYARDS AND WINERIES: WISCONSIN 41
As mentioned earlier, the most commonly produced wines are red and white wines. On average, each winery is bottling 7 labels of red and 6 labels of white, as shown in chart 2-17. Wineries also report an average of 5 “other” labels. The survey instrument did not ask wineries to indicate what other types of labels are being produced. Wisconsin wineries are producing more non-alcoholic items than in other project states.

VINEYARDS AND WINERIES: WISCONSIN 42
Competitions and awards are the most commonly used type of third party evaluations, as reported by the responding wineries. Wineries are also using testing labs and quality alliances for third party evaluations (see chart 2-18).

VINEYARDS AND WINERIES: WISCONSIN 43
Future Plans
Winery owners were asked directly about future plans for their establishment. The results, shown in chart 2-19, indicate the potential for continued growth in the industry, as 73 percent of the responding wineries plan to expand in the next five years.
One winery owner (representing 7 percent of the responses) is considering transferring the winery to a family member and 2 winery owners (representing 13 percent of the responses) are considering selling the winery. The industry, as the older wineries mature, may be in need of assistance in succession planning and transferring a business. Continued growth also indicates a continued need for successful business planning.
VINEYARDS AND WINERIES: WISCONSIN 44
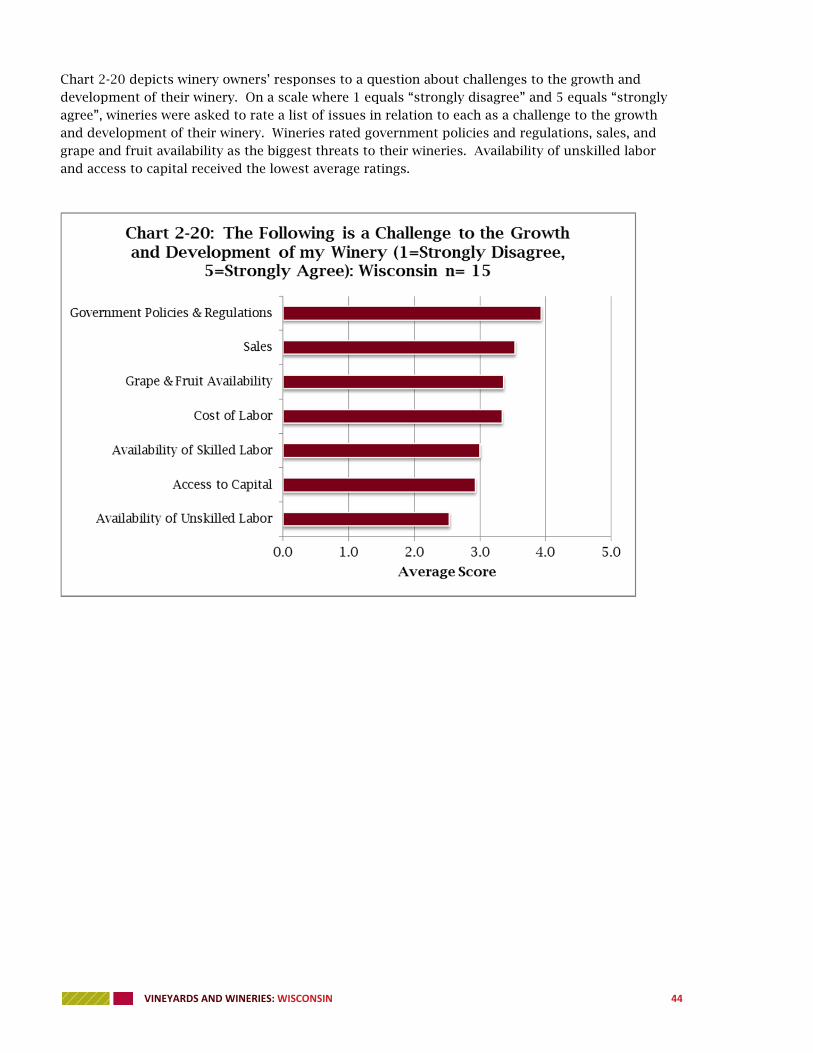
Chart 2-20 depicts winery owners’ responses to a question about challenges to the growth and development of their winery. On a scale where 1 equals “strongly disagree” and 5 equals “strongly agree”, wineries were asked to rate a list of issues in relation to each as a challenge to the growth and development of their winery. Wineries rated government policies and regulations, sales, and grape and fruit availability as the biggest threats to their wineries. Availability of unskilled labor and access to capital received the lowest average ratings.

VINEYARDS AND WINERIES: WISCONSIN 45
ECONOMIC CONTRIBUTION OF VINEYARDS AND WINERIES IN WISCONSIN
The economic contribution of an industry is comprised of direct and secondary effects. Direct effects are economic activities generated by the industry itself. For example, spending by grape growers to purchase trellising supplies is a direct effect. Spending by wineries to purchase bottles is also a direct effect. Secondary effects are economic activities triggered by the initial spending. When a grape grower purchases trellising supplies, the manufacturer of the supplies must produce more, creating additional economic activity. When a winery buys bottles, the glass manufacturer must produce more, thus increasing output.
Direct Effects
In measuring the economic contribution of the grape growing and winery industries in Wisconsin, the first step is to measure the direct effect of the industries. In other words, producers were asked to report how much they spent in 2011. Researchers used data gathered in the Northern Grapes Project baseline study for this purpose. The data collected in the study were used to derive averages per winery and per vineyard. These averages were extrapolated to the total population of wineries (65 in Wisconsin) and vineyards (253 in Wisconsin) to determine the total direct effect for the state.
Wineries and vineyards contribute to Wisconsin’s economy through three primary methods. One, vineyards make purchases for inputs and for labor. Two, wineries make purchases for inputs and for labor. Three, wineries attract visitors, typically through tasting rooms. These tourists make purchases during their visit which stimulate economic activity in the state. The direct contributions of each of these components are shown in table 3-1. These are the direct effects of the grape growing and winery industries in Wisconsin.
Wisconsin vineyards, in 2011, spent $3.1 million within the state to operate. This included $650,000 of payments to their 230 employees. The average wage paid to vineyard employees is $2,830. While this may seem low, vineyard owners report only 29 percent of the hours invested in the vineyard were by paid labor. Fifty percent of vineyards report they did not used paid labor in 2011, relying on their own labor or volunteer labor. Vineyard work also tends to be seasonal, concentrated in the fall at harvest time.
Wisconsin wineries, in 2011, spent $32.6 million within the state for their operations. Of this, $3.9 million went to their 390 employees. Total winery sales, as mentioned in the winery summary, were $34.9 million in 2011. Of this, $2.3 million in purchases were for grapes. Since grape sales are included in the vineyard impact, they are excluded here to avoid double counting.
VINEYARDS AND WINERIES: WISCONSIN 46
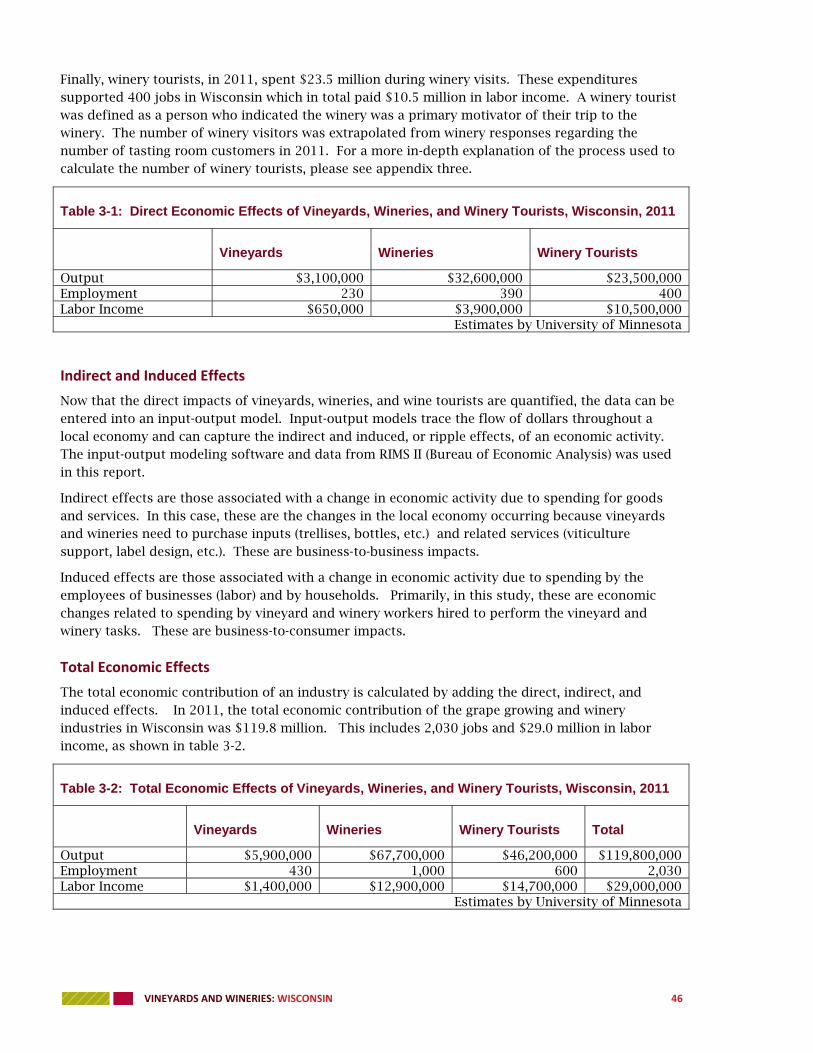
Finally, winery tourists, in 2011, spent $23.5 million during winery visits. These expenditures supported 400 jobs in Wisconsin which in total paid $10.5 million in labor income. A winery tourist was defined as a person who indicated the winery was a primary motivator of their trip to the winery. The number of winery visitors was extrapolated from winery responses regarding the number of tasting room customers in 2011. For a more in-depth explanation of the process used to calculate the number of winery tourists, please see appendix three.
Table 3-1: Direct Economic Effects of Vineyards, Wineries, and Winery Tourists, Wisconsin, 2011
Vineyards Wineries Winery Tourists
Output $3,100,000 $32,600,000 $23,500,000 Employment 230 390 400 Labor Income $650,000 $3,900,000 $10,500,000
Estimates by University of Minnesota
Indirect and Induced Effects
Now that the direct impacts of vineyards, wineries, and wine tourists are quantified, the data can be entered into an input-output model. Input-output models trace the flow of dollars throughout a local economy and can capture the indirect and induced, or ripple effects, of an economic activity. The input-output modeling software and data from RIMS II (Bureau of Economic Analysis) was used in this report.
Indirect effects are those associated with a change in economic activity due to spending for goods and services. In this case, these are the changes in the local economy occurring because vineyards and wineries need to purchase inputs (trellises, bottles, etc.) and related services (viticulture support, label design, etc.). These are business-to-business impacts.
Induced effects are those associated with a change in economic activity due to spending by the employees of businesses (labor) and by households. Primarily, in this study, these are economic changes related to spending by vineyard and winery workers hired to perform the vineyard and winery tasks. These are business-to-consumer impacts.
Total Economic Effects
The total economic contribution of an industry is calculated by adding the direct, indirect, and induced effects. In 2011, the total economic contribution of the grape growing and winery industries in Wisconsin was $119.8 million. This includes 2,030 jobs and $29.0 million in labor income, as shown in table 3-2.
Table 3-2: Total Economic Effects of Vineyards, Wineries, and Winery Tourists, Wisconsin, 2011
Vineyards Wineries Winery Tourists Total
Output $5,900,000 $67,700,000 $46,200,000 $119,800,000 Employment 430 1,000 600 2,030 Labor Income $1,400,000 $12,900,000 $14,700,000 $29,000,000
Estimates by University of Minnesota

VINEYARDS AND WINERIES: WISCONSIN 47
Cold‐Hardy Related Economic Effects
Surveyed grape growers report 83 percent of the grapes grown in Wisconsin are of cold-hardy varieties (see appendix 1 for a definition of cold-hardy). Surveyed winery owners report 58 percent of the grapes used in the production of their wine are from the cold-hardy varieties.5 In 2011, cold-hardy grapes contributed $71.1 million to the output of the state of Wisconsin including $17.2 million in labor income. Cold-hardy grapes contributed 1,400 jobs, as shown in table 3-3.
Table 3-3: Total Economic Effects of Vineyards, Wineries, and Winery Tourists Derived from Cold-Hardy Grapes, Wisconsin, 2011
Vineyards Wineries Winery Tourists Total
Output $4,900,000 $39,400,000 $26,800,000 $71,100,000 Employment 400 600 400 1,400 Labor Income $1,200,000 $7,500,000 $8,500,000 $17,200,000
Estimates by University of Minnesota
5 Percent of grapes grown from cold-hardy varieties calculated based on the number of vines of cold-hardy versus traditional grape varieties. Percent of cold-hardy grapes used in wine production based on responses of winery owners to a question about the percent of cold-hardy grapes utilized.

VINEYARDS AND WINERIES: WISCONSIN 48
SUMMARY AND CONCLUSIONS
In spring 2012, grape growers and winery owners in 13 states were surveyed under the Northern Grapes Project. Questions asked pertained to sales and production (wineries and vineyards), growing practices (vineyards), and operating practices (wineries). The goal was to establish industry baselines and quantify the economic contribution of the industries. This report presents the results for Wisconsin.
Cold-hardy grapes dominate the wine and grape growing industries in Wisconsin, particularly the grape growing industry. Eighty-three percent of grape vines grown in the state are cold-hardy varieties. Meanwhile, cold-hardy grapes comprise 58 percent of grapes used in wine production. The difference may be attributable to wineries importing grapes or juice from grapes for wine production. This may also be due to the surge in new cold-hardy plantings in recent years which are not yet producing grapes for wine production.
The release of cold-hardy grape cultivars helped fuel growth in the vineyard industry in Wisconsin. Growth was most rapid in the period from 2002 to 2007. Indications from the baseline survey show growth in the grape growing industry in Wisconsin is tapering off slightly as the industry begins to mature. In addition, 65 percent of vineyards indicate they have expanded planted acreage since their original establishment. Capital investment expenditures are slightly more than half of vineyard expenditures, which is indicative of a period of growth. The Marquette grape, released in 2005, now accounts for over 40 percent of planted red cold-hardy grape acreage.
Vineyard owners are concerned about disease and pests/insects. Wisconsin grape growers listed disease and pests/insects as the top two biggest challenges to the future growth and development of their vineyard.
Growth in the number and size of wineries continues to be strong. Over half of the surveyed wineries were established after 2007. Seventy-three percent of wineries plan to expand. Sixty percent of wineries intend to significantly expand in the next five years, underscoring the continued need to support the industry.
Wisconsin wineries cite sales and government policies and regulations as the primary challenges to the future growth and development of their winery. Nearly three-fourths of Wisconsin wineries are located in rural areas. Over 80 percent of their sales are from their tasting rooms. Therefore, Wisconsin wineries need to continue to attract and draw customers to their site. Wisconsin wineries are unique from their counterparts in other states in that they indicate a close working relationship with their local convention and visitor’s bureaus.
In 2011, the winery and grape growing industries in Wisconsin created $119.8 million in economic impact. This included the support of 2,030 jobs paying $29.0 million in labor income. Vineyards contributed $5.9 million in economic activity, wineries $67.7 million, and winery tourists $46.2 million.
Cold-hardy grapes contributed $71.1 million in economic activity to Wisconsin’s economy. This included 1,400 jobs and $17.2 million in labor income.

VINEYARDS AND WINERIES: WISCONSIN 49
APPENDIX ONE: PARTICIPATING INDUSTRY ASSOCIATIONS
The following industry associations/councils provided membership lists for the baseline and economic impact survey of the Northern Grapes Project.
Connecticut Vineyard and Winery Association Illinois Grape Growers and Vinters Association Iowa Wine Growers Association Lake Champlain Wines Massachusetts Farm Wineries and Growers Association Michigan Grape and Wine Industry Council Minnesota Grape Growers Association Nebraska Winery and Grape Growers Association New Hampshire Winery Association New York Wine and Grape Foundation Northern Illinois Wine Growers Scenic Rivers Grape and Wine Association South Dakota Specialty Producers Association South Dakota Winegrowers Association Upper Hudson Valley Wine and Grape Association Vermont Grape and Wine Council Western Iowa Grape Growers Association Wisconsin Grape Growers Association

VINEYARDS AND WINERIES: WISCONSIN 50
APPENDIX TWO: DEFINITION OF COLD‐HARDY GRAPES
Defining a cold-hardy grape is not as straight-forward as one might imagine. What is considered cold-hardy in one region may not be considered cold-hardy in another. For purposes of this study, researchers classified the following cultivars as cold-hardy. This was done in consultation with the Northern Grapes project advisory team which is comprised of growers in each of the states.
Table A-1: Cold-Hardy Red Varieties
Baltica
Beta
Frontenac
GR-7
King of the North
Leon Millot
Marechal Foch
Marquette
Other red Swenson
Petite Pearl
Sabrevois
St. Croix
Valiant
Table A-2: Cold-Hardy White Varieties
Brianna
Edelweiss
Esprit
Frontenac blanc
Frontenac gris
Kay Gray
La Crescent
La Crosse
Louise Swenson
Other white Swenson
Petite Amie
Prairie Star
St. Pepin

VINEYARDS AND WINERIES: WISCONSIN 51
APPENDIX THREE: WINERY TOURIST AND EXPENDITURE CALCULATIONS
Three critical pieces of information are necessary to calculate the economic impact of winery tourists. First, researchers need an estimate of the number of winery visitors in a certain time period. Second, researchers need to know the motivations of these winery visitors and the number of visitors from outside the region (local area). Third, researchers need an average spending profile for each tourist.
For purposes of this study, the total number of winery visitors in each state was extrapolated from the winery survey. Winery owners were asked to estimate the number of customers their tasting rooms entertained in 2011. Event attendees (e.g. weddings, new release parties, etc.) are assumed to be a subset of the total number of tasting room customers. The average number of customers was then applied to all wineries.
Economic impact theory stipulates that impact is driven by dollars from outside the region. Local residents may visit a winery and spend money, but theoretically, they would have spent those dollars in the local economy on another leisure activity if the winery were not located in their community. The number of tasting room customers, therefore, has to be adjusted to represent only those from outside the community who have traveled to the area specifically to visit a winery. These visitors are hereafter referred to as winery tourists. Research on tasting room customers in Michigan (conducted by Michigan State University researchers Don Holecek and Dan McCole as part of the Northern Grapes Project) indicates that approximately two-thirds (67 percent) of tasting room visitors are tourists.
Since economic impact theory further instructs that economic impact is only attributable to a business or an event if the business or event is the primary purpose for the tourism activity, the final number of winery tourists was calculated by estimating the number of tourists to the area due to the presence of the winery. If a tourist visits a winery while in town celebrating a wedding, the wedding is the primary purpose of the visit and should be credited with economic impact and not the winery. Tasting room research, conducted by Michigan State University researchers, determined the winery itself was a driving factor in 49 percent of visits to the winery.
With the number of winery tourists quantified, researchers need to apply an average spending profile to determine total spending by winery tourists. In Wisconsin, the spending profiles from a 2009 Davidson-Peterson report (adjusted for inflation) were used to determine daily spending per person. Total per person spending was estimated at a conservative $84 per day.
The winery tourist economic impact calculations are arguably the most complex of this report. Future research into the economic impact of wineries and vineyards in Wisconsin would be greatly enhanced by 1) doing tasting room customer surveys in Wisconsin and 2) developing a spending profile specifically for Wisconsin winery visitors.