Vineyards and Grapes of the North - University of Minnesota€¦ · · 2013-03-26Vineyards and...
29
EXTENSION CENTER FOR COMMUNITY VITALITY Vineyards and Grapes of the North A STATUS REPORT Authored by: Brigid Tuck, Extension Center for Community Vitality, and William Gartner, Department of Applied Economics IN PARTNERSHIP WITH: NORTHERN GRAPES PROJECT USDA, SPECIALTY CROPS RESEARCH INITIATIVE PROGRAM NATIONAL INSTITUTE OF FOOD AND AGRICULTURE
-
Upload
trinhkhanh -
Category
Documents
-
view
214 -
download
1
Transcript of Vineyards and Grapes of the North - University of Minnesota€¦ · · 2013-03-26Vineyards and...

EXTENSION CENTER FOR COMMUNITY VITALITY
Vineyards and Grapes of the North
A STATUS REPORT Authored by: Brigid Tuck, Extension Center for Community Vitality, and William Gartner, Department of Applied Economics
IN PARTNERSHIP WITH: NORTHERN GRAPES PROJECTUSDA, SPECIALTY CROPS RESEARCH INITIATIVE PROGRAM NATIONAL INSTITUTE OF FOOD AND AGRICULTURE


VINEYARDS: BASELINE SURVEY RESULTS i
Partners/Sponsors: Northern Grapes Project, which is funded by USDA’s Specialty Crops Research Initiative Program of the National Institute of Food and Agriculture, project number 2011-51181-30850 Special Thanks To: Linda Jones, Executive Director, Michigan Grape and Wine Industry Council Jim Luby, Professor, University of Minnesota Extension Tim Martinson, Senior Extension Associate, Cornell University Chrislyn Particka, Extension Support Specialist, Cornell University Participating Industry Associations Northern Grapes Project Advisory Committee Photo Credit: David L. Hansen, University of Minnesota
Vineyards and Grapes of the North
A STATUS REPORT
March 2013 Authored by: Brigid Tuck and William Gartner
© 2013 Regents of the University of Minnesota. All rights reserved. University of Minnesota Extension is an equal opportunity educator and employer. In accordance with the Americans with Disabilities Act, this material is available in alternative formats upon request. Direct requests to the Extension Store at 800‐876‐8636. Printed on recycled and recyclable paper with at least 10 percent postconsumer waste material.

VINEYARDS: BASELINE SURVEY RESULTS ii
Table of Contents 1. NORTHERN GRAPES PROJECT 1 2. VINEYARDS AND GRAPES OF THE NORTH: SUMMARY 2 3. GRAPE GROWING: BASELINE STUDY RESULTS 3 Survey Methodology and Response Rates 3 Vineyard Characteristics 5 Vineyard Operations 10 Marketing and Grape Utilization 13 Future Plans 15 Cold‐Hardy Grape Varieties 17 Other Grape Varieties 22 4. CONCLUSIONS AND IMPLICATIONS 23 5. APPENDIX ONE: PARTICIPATING INDUSTRY ASSOCIATIONS 24 6. APPENDIX TWO: COLD‐HARDY GRAPE DEFINITION 25

VINEYARDS: BASELINE SURVEY RESULTS 1
NORTHERN GRAPES PROJECT
Successful viticulture research programs focused on the development of cold-hardy grapes promoted the emergence of a new industry in states where grape growing and local wine making had previously been limited. Grape growers and wineries in these states, spanning from Nebraska in the west to New York in east, have rapidly adapted the new grape cultivars. As the number of vineyards has exploded, so has the number of wineries producing wines from these locally-grown grapes. The new industry faces challenges to production, marketing, and sales. These challenges are being addressed by the Northern Grapes Project. The Northern Grapes Project is funded by USDA’s Specialty Crops Research Initiative Program of the National Institute of Food and Agriculture, project number 2011-51181-30850.
The Northern Grapes Project brings together researchers, Extension specialists, and industry professionals from 13 states to address viticulture, enological, business management, and marketing issues related to growing cold hardy grapes and producing wines made from these grapes. According to the grant application, after five years, the project teams intend to have accomplished the following goals: 1) production and sales of wines made from cold climate cultivars will have doubled, 2) improved quality resulting from better growing and winemaking practices will have improved customer retention and driven repeat sales, 3) enhanced breeding and cultivar evaluation will have resulted in an accelerated pace of cultivar release, 4) cold climate cultivars will establish unique regional marketing identities in their area, 5) wineries will have understood and applied business and tasting room management practices that drive sales and profitability, and 6) wineries and vineyards will have successfully transitioned from “startup” to “sustainably profitable.”
To measure progress on these goals, one of the first tasks of the project team was to conduct a baseline survey. This survey, sent to grape growers and wineries in the participating states, gathered data on the current status of the grape and wine industry in general and on cold-hardy grape and wine production, specifically. Questions were asked pertaining to sales and production (wineries and vineyards), growing practices (vineyards), and operating practices (wineries). This report deals with vineyards. A report on wineries can be found at: http://www.extension.umn.edu/projects/community/EconomicImpact.

VINEYARDS: BASELINE SURVEY RESULTS 2
VINEYARDS AND GRAPES OF THE NORTH: A SUMMARY
The Northern Grapes Project brings together researchers, Extension specialists, and industry professionals from 13 states to address viticulture, enological, business management, and marketing issues related to growing cold hardy grapes and producing wines from these grapes.
In spring 2012, grape growers and winery owners in 13 states were surveyed. Questions asked pertained to sales and production (wineries and vineyards), growing practices (vineyards), and operating practices (wineries). The goal was to establish an industry baseline. In total, 345 vineyards provided full answers to the surveys.
The grape growing industry in the Northern Grapes states has experienced rapid growth. Only one in five vineyards existed prior to 2002. One in three started since 2007. Vineyards need four years to reach full maturity. Vines planted after 2007 may not have reached full production capacity. There is also some evidence that new vineyard establishment is beginning to taper off although existing vineyards are intending to increase total acreage devoted to growing wine grapes.
According to our analysis, there are 20,900 acres planted in grape vines in the participating states. Survey results show that 28 percent, or 5,900, are of the cold-hardy varietals identified in this study.
Survey results, extrapolated to all growers, reveal grape growers in the participating states produced 72,000 tons of fruit in 2011.
In total, vineyards in participating states spent $45.1 million in 2011. Of this, $26.0 million was on operating expenses and $19.4 million on capital expenditures.
Forty-percent of vineyards did not use paid labor in 2011. As vineyards mature, this may not be sustainable.
The most common marketing arrangement for vineyards was to sell via contract with a winery. Most vineyards sold their fruit as whole berries.
Approximately half of the vineyards plan to maintain their current size for the next 2 years, half plan to expand, and a small minority (2 percent) plan to decrease or eliminate their vineyard.
Vineyards indicate that disease and pest/insects are the greatest challenges to the growth and development of their vineyards.
The number of vines planted by responding vineyards has doubled in the last four years. The Marquette grape is wildly popular (39% of all red cultivars) and has shown substantial growth in the number of recent plantings.

VINEYARDS: BASELINE SURVEY RESULTS 3
GRAPE GROWING: BASELINE SURVEY RESULTS
An early task of the Northern Grapes Project was to establish a baseline for the grape growing and winery industry in the participating states. This baseline will be used to measure changes in the industry over the period of the project. This report will detail the results of the baseline survey for grape growers in the participating Northern Grape Project states.
Survey Methodology and Response Rates
In early 2012, project researchers at the University of Minnesota sent a survey to grape growers and wineries in the participating states. Grower and winery lists were provided to the University of Minnesota by industry associations in each state (see appendix 1 for a list of participating associations). An email was sent to all members of these lists, resulting in 2,746 invitations to participate in the survey. Of these, 501 responded, for an overall response rate of 18 percent. In addition, links to the survey were available allowing individual growers and wineries not directly associated with an industry group, and thus not receiving a direct email invitation, to participate in the survey. These links were also announced during the Northern Grapes Project webinars. The survey links generated 110 responses. Therefore, in total, there were 611 total responses to the survey.
Table 1-1 lists the participating states, the number of wineries and growers invited based on the industry association lists, the number of respondents using the open links, and the response rate.
Minnesota has the highest membership totals.1 South Dakota had the highest response rate.
Table 1-1: Northern Grapes Project Baseline Study Participating States, Response Rates
State Total Number of Contacts from Industry Associations
Number of Responses
Response Rates
Connecticut 32 5 16%
Illinois 272 52 19%
Iowa 222 66 30%
Massachusetts 28 10 36%
Michigan 164 36 22%
Minnesota 1,012 167 17%
North Dakota 54 14 26%
Nebraska 172 46 27%
New Hampshire 51 14 27%
New York 202 32 16%
South Dakota 14 11 79%
1 The Minnesota Grape Growers Association has a national reputation for its industry knowledge; therefore, many
members of the association grow in neighboring states. Responses were categorized by state the grower or winery owner indicated as the state in which their operation is located.

VINEYARDS: BASELINE SURVEY RESULTS 4
Vermont 47 18 38%
Wisconsin 476 97 20%
Not all of the survey responses were applicable to the baseline survey. Association memberships are generally open to all interested parties and therefore membership lists include individuals who may be considering grape growing or producing wine, or individuals who previously grew grapes or produced wines. The lists may also contain people associated with the industry in other capacities than growing and wine-making. Knowing this, the survey was designed to capture basic information on these individuals, even if they did not complete the full survey.
The first survey question asked “Are you associated with….1) a vineyard (past, present, or future), 2) a winery, 3) both, or 4) other. Those responding “other” were directed to the end of the survey. Thirty-eight respondents selected the “other” response.
Those responding “vineyard (past, present, or future)” were asked a follow-up question. Survey takers who indicated they grew grapes in the past or planned to grow grapes in the future were directed to the end of the survey. Twenty-three respondents are not currently growing.
The focus of the Northern Grapes Project is on commercial scale grape growers and wineries. Thus, grape growers were asked “Do you grow grapes for commercial sale or use? If you grow grapes exclusively for use in your own winery, answer yes”. Those responding “no” were directed to answer a series of questions about the size of their vineyard and then directed to the end of the survey. Seventy-three respondents indicated they were not commercial growers.
Finally, thirty-five responses were dropped because they did not answer enough of the questions to provide useful information. Table 1-2 shows how the responses were divided by these categories.
Table 1-2: Calculation of Total Useable Responses
Total Responses 611
Non-Growers or Non-Winery Owners 38
Not Currently Growing Grapes 23
Non-Commercial Growers 73
Incomplete Responses 35
Useable Responses 442
Survey participants could be vineyard operators, winery operators, or operators of a joint vineyard-winery business (see chart 1-1). Over half (56 percent) of survey respondents operate a vineyard only. Among winery owners, it is more common to operate a combination of a winery-vineyard operation, with over one-third (35 percent) of survey respondents reporting this arrangement. Only 9 percent of wineries are operated independently of a vineyard. In total, the survey includes 193 wineries and 403 vineyards.

VINEYARDS: BASELINE SURVEY RESULTS 5
Vineyard Characteristics
Of the 442 total useable survey responses, 403 indicated they owned and operated a vineyard. Unfortunately, not all vineyard owners answered the full-slate of survey questions. There were 345 vineyards that answered the majority of the questions.
Table 1-3 lists vineyard respondents by state. Minnesota had the highest number of participating vineyards with 104 responses. Connecticut and Maine each only had 3 vineyards complete the survey.
Table 1-3: In What State Is Your Vineyard Located?
Connecticut 3
Illinois 25
Iowa 48
Maine 3
Massachusetts 6
Michigan 17
Minnesota 104
Nebraska 31
New Hampshire 7
New York 19
Vineyard Only56%
Winery Only9%
Vineyard and Winery
35%
Chart 1-1: Are You Associated With?n = 442

VINEYARDS: BASELINE SURVEY RESULTS 6
North Dakota 6
South Dakota 6
Vermont 12
Wisconsin 55
Other (please specify) 3
Total 345
The Northern Grapes Project baseline survey results reinforce the observed trend of rapid growth in the grape growing industry in the participating states (see chart 1-2). The five-year period from 2002 to 2007 appears to be the peak growth period, with 44 percent of responding vineyards having been started in this time period. One in three responding vineyards has started since 2007. Only one in five vineyards existed prior to 2002. These trends have important implications for the industry. Typically, a vineyard does not reach full production capacity until year 4. Vines planted after 2007 are only now reaching maturity and yielding to their full potential. While too early to discern, the survey may indicate that vineyard industry growth is beginning to taper even while increased grape production continues.
In addition to new vineyards being established, current vineyards continue to expand their planted acreage. Fifty-three percent of responding vineyards indicated they had planted additional acreage since the original founding of their vineyard, chart 1-3.
After 200736%
2002-200744%
Prior to 200220%
Chart 1-2: Year of Vineyard Establishmentn=342

VINEYARDS: BASELINE SURVEY RESULTS 7
The majority of responding vineyards (53 percent) are less than 2.0 acres in size, as shown in chart 1-4. Just under one-quarter (22 percent) of the vineyards reported having more than 5 acres planted in grapes. The largest responding vineyard had over 100 acres planted. Most of the larger vineyards (more than 5 acres) were in the range of 10 to 20 acres.
Our survey results, extrapolated out to the entire population of vineyards, indicate there are 20,900 acres planted in grape vines in the participating states. Survey results show that 28 percent, or 5,900 acres, of the planted vines are of the cold-hardy varieties defined in this study. The varieties classified as “cold-hardy” for purposes of this report are listed in appendix two.
No47%Yes
53%
Chart 1-3: Have You Added Planted Acreage Since Your Vineyard Was Established?
n=338

VINEYARDS: BASELINE SURVEY RESULTS 8
Vineyard production reflects the age of vineyards and the size of vineyards in the survey population, see chart 1-5. Nearly one-third (30 percent) of the vineyards surveyed indicated they did not produce any fruit in 2011. As depicted in chart 1-3, 36 percent of vineyards were planted after 2007, which means they likely have not reached maturity yet. Therefore, it is not surprising they have not produced harvestable fruit. Survey respondents also indicated a lack of fruit production due to weather conditions (drought, early frost, etc.), insects, or other pests.
Survey results, extrapolated to represent all growers in the states, reveal grape growers produced 72,000 tons of fruit in 2011. Average yield was 3.5 tons per acre.
1.0 Acres or Less28%
1.1 to 2.0 Acres25%
2.1 to 5.0 Acres25%
5.1 Acres or More22%
Chart 1-4: Vineyard Planted Acreagen=334

VINEYARDS: BASELINE SURVEY RESULTS 9
The average participating vineyard has just over 2,000 planted vines. Nearly one-third (31 percent) of vineyards have 1,001 to 3,000 vines in the ground, as shown in chart 1-6.
No Production30%
Less than 2,000 Lbs20%
2,000 to 10,000 Lbs25%
More than 10,000 Lbs25%
Chart 1-5: Vineyard Productionn=356
Fewer than 50023%
500 to 1,00027%
1,001 to 3,00031%
More than 3,00019%
Chart 1-6: Total Vines in Vineyardn=336

VINEYARDS: BASELINE SURVEY RESULTS 10
Vineyard Operations
The majority (74 percent) of vineyards operate as stand-alone agricultural enterprises (see chart 1-7). Over one-quarter of vineyards participating in the survey operate as a secondary agricultural operation.
Among grape growers for whom the vineyard is a secondary operation, the majority are engaged in traditional farming, including row cropping and animal husbandry, as shown in chart 1-8. Fruit farmers, whose primary crop is not grapes, also run vineyards as side operations.
No26%
Yes74%
Chart 1-7: Vineyard the Primary Agricultural Enterprise?
n=342

VINEYARDS: BASELINE SURVEY RESULTS 11
Only seven of the responding vineyards, or less than 2 percent, operate as a commercial nursery. They use only a small percentage of their total vineyard for nursery activities.
The average responding vineyard spent $10,500 on operations (including labor payments) in 2011. Operating expenses include fertilizers, fungicides, cover crops, water, fuel, overhead costs, marketing, and taxes. Responding vineyards also spent an average of $7,900 on capital investments, including trellis systems, tractors, crushers, pick-ups, ATV’s, and other equipment. Finally, vineyards reported that they spent an average of $5,000 per vineyard on labor expenditures.
In total, vineyards in the participating states spent $26.0 million on operating expenses (includes labor) and $19.4 million on capital expenditures. Vineyards spent $12.4 million on labor expenditures, see chart 1-9. Total expenditures were $45.4 million in 2011.
Traditional farming
59%
Fruit farming (not grapes)
27%
Other farming14%
Chart 1-8: What is Your Primary Agricultural Enterprise?
n=74

VINEYARDS: BASELINE SURVEY RESULTS 12
Of the 252 vineyards that responded to the question regarding labor expenditures, 90 (39 percent) reported no expenditures for labor, chart 1-10. This is primarily because the owner/operator did all the labor or the vineyard used volunteer or family labor to complete the vineyard tasks. As vineyards mature, this may not be sustainable, which will have implications for the industry.
Labor27%
Operations (no labor)30%
Capital Investment
43%
Chart 1-9: Expenditures by Category
None39%
$1-$1,00020%
$1,001-$5,00024%
$5,001-$15,00010%
$15,001-$250,000
7%
Chart 1-10: Vineyard Labor Expendituresn=252

VINEYARDS: BASELINE SURVEY RESULTS 13
As shown in Chart 1-11, the majority of labor for the responding vineyards was provided by the owner/operator (62 percent). Just over a quarter (27 percent) of labor was supplied by paid employees and 11 percent by volunteer laborers. In total, the responding vineyards required 258,000 hours of labor or approximately 1,200 hours per vineyard.
Marketing and Grape Utilization
Grape growers in the survey favor contracts as the best method for marketing their grapes (chart 1-12). Growers were asked which market arrangements they used to sell their grapes. They could select more than one choice. The most commonly used method, selected by 94 growers, was to sell via a contract with a winery. Also commonly used were sales through their own winery and sales via networking. Only one grower indicated using a broker to sell their grapes.
There were 50 growers that indicated they used “other” methods to market their grapes. Not unexpectedly, given the percent of new vineyards that have not yet reached maturity, 31 of those “other” responses indicated they made no sales in 2011. Another common answer, mentioned by 9 respondents, was that they sold the grapes to a winery without any formal contract. Farmer’s markets and sales to individuals were also mentioned by multiple respondents as methods for selling grapes.
Owner/Operator62%
Volunteer Labor11%
Paid Labor27%
Chart 1-11: Hours of Labor by Category

VINEYARDS: BASELINE SURVEY RESULTS 14
Growers that contract with wineries to market their grapes are interacting with the winery to make management decisions. Nearly three-fourths of growers indicated that the winery they sold to was active in management decisions in the vineyard, as shown in chart 1-13.
The most common arrangement for responding vineyards is to sell their grapes in a whole berry format (see chart 1-14). Nearly one-third sold their berries whole to an in-state winery. Another
0
10
20
30
40
50
60
70
80
90
100
Sold viacontract with a
winery
Sold throughown winery
Other Sold vianetworking
Sold via abroker
Nu
mb
er o
f V
iney
ard
sChart 1-12: Marketing Arrangements
n=241
No29%
Yes71%
Chart 1-13: If Sold Via Contract, Was Winery Active in Management Decisions?
n=129

VINEYARDS: BASELINE SURVEY RESULTS 15
quarter sold their grapes whole to their own winery. This reinforces the knowledge that grape growing and wineries are often local operations, working and contributing to the communities in which they are located. Only two percent of responding grape growers reported selling out of the state. Crop damage and loss (due to animal, insects, and weather) affected five percent of the growers surveyed.
Future Plans
Current grape growers appear to be optimistic about the future of their operations. Half of the responding growers plan to increase their acreage in the next two years. Another half plan to maintain their current size over the next two years. Only a few (6) intend to decrease their operations, chart 1-15.
Left on vine8%
Other2%
Processed to juice and sold to own
winery10%
Sold whole to an in-state winery
32%Sold whole to an out-state winery
2%
Sold whole to own winery
25%
Crop damanged or lost5%
No crop7%
Personal/private use9%
Chart 1-14: Grape Utilizationn= 290

VINEYARDS: BASELINE SURVEY RESULTS 16
Grape growers responding to the survey indicate that the biggest challenges to vineyard operations are disease and pests/insects, as depicted in chart 1-16. When asked to answer the question “the following is a challenge to the growth and development of my vineyard”, using a scale where 1 equals strongly disagree and 5 equals agree, grape growers gave disease an average score of 3.8 and pests/insects an average score of 3.7. Availability of labor and capital do not seem to be significant issues for the responding growers.
Slightly decreasing my
vineyard1%
Slightly increasing my
vineyard29%
Staying about the same48%
Eliminating or substantially decrease my
vineyard1%
Substantially increasing my
vineyard21%
Chart 1-15: Over the Next Two Years, I am Planning on....
n=309

VINEYARDS: BASELINE SURVEY RESULTS 17
Cold‐Hardy Grape Varieties
The responding vineyards reported 374,192 cold-hardy vines as planted in their vineyards. The majority of these cold hardy varieties (216,700) are red cultivars. The remaining vines (157,500) are white cultivars. Chart 1-17 depicts total reported planted vines of red varietals. Marquette grapes comprise 39 percent of the total planted red varieties. Frontenac and Marechal Foch comprise 26 percent and 11 percent respectfully. This chart illustrates the sheer popularity of the Marquette grape. This varietal is relatively new (released in 2006), so the fact that it is now almost 40 percent of all planted red varietals is remarkable.
Table 1-4 reports the number of reported planted red cultivar vines by age. These figures represent only what the vineyards who answered the survey reported. Responding vineyards reported 21,800 red cultivar vines are older than 10 years of age, 96,700 are between 4 years and 10 years of age, and 98,200 are younger than 4 years old. These figures again represent the rapid growth of the industry. Vines younger than 4 years of age have yet to reach maturity and produce a full crop. The reported results indicate that red cultivar grape production may nearly double in the next four years as those vines mature.
Further, the table reflects the rapid growth of the Marquette grape variety. Ten years ago, there were virtually no Marquette vines in the ground. Within the last four years, nearly 60,000 vines have been planted. The other prominent red varieties, Frontenac and Marechal Foch, have been planted in fewer numbers in recent years.
0 0.5 1 1.5 2 2.5 3 3.5 4
Availability of unskilled labor
Sales
Access to capital
Availability of skilled labor
Government policy/regulation
Cost of Labor
Pests/Insects
Disease
Average Score
Chart 1-16: The Following is a Challenge to the Growth and Development of my Vineyard n=300
(1=Strongly Disagree, 5 = Strongly Agree)

VINEYARDS: BASELINE SURVEY RESULTS 18
Frontenac26%
Marechal Foch11%
Marquette39%
St. Croix7%
GR-72%
King of the North2%
Sabrevois4%
Petite Pearl2%
Leon Millot2%
Other5%
Chart 1-17: Total Planted Vines, Red Varieties

VINEYARDS: BASELINE SURVEY RESULTS 19
Table 1-4: Planted Vines of Red Varieties by Responding Vineyards, by Age
Variety Vines Younger
than 4 Vines Between 4 and
10 Years Vines Older
than 10 Total
Baltica 42 6 0 48
Beta 111 2,245 50 2,406
Frontenac 16,553 32,562 6,918 56,033
GR-7 458 2,834 1,221 4,513
King of the North 2,746 1,275 52 4,073
Leon Millot 1,156 1,613 953 3,722
Marechal Foch 3,320 10,489 11,058 24,867
Marquette 59,041 26,496 3 85,540
Petite Pearl 2,850 394 0 3,244
Sabrevois 4,427 3,230 251 7,908
St. Croix 4,848 9,524 835 15,207
Valiant 989 1,602 388 2,979
Other red Swenson 1,639 4,429 106 6,174
Total 98,180 96,699 21,835 216,714
Survey results indicate there are 5,914 acres planted in cold-hardy grapes in the participating states. Based on the percentages of planted vines reported in the survey, 58 percent of the acres are planted in red varietals. Table 1-5 highlights estimated acreage of the red varieties based on the survey results. Acres are estimated as the survey did not record acres planted by variety.
Table 1-5: Estimated Planted Acres of Red Varieties in All Participating States
Variety Total
Baltica 0.76
Beta 38.1
Frontenac 886.9
GR-7 71.4
King of the North 64.5
Leon Millot 58.9
Marechal Foch 393.6

VINEYARDS: BASELINE SURVEY RESULTS 20
Marquette 1,353.9
Petite Pearl 51.3
Sabrevois 125.2
St. Croix 240.7
Valiant 47.1
Other red Swenson 97.9
Total 3,430
Chart 1-18 illustrates the total planted vines of white varietals. La Crescent (23 percent) and Frontenac gris (19 percent) are most commonly planted by the reporting vineyards. Within the white cold-hardy cultivars, there is no clear favorite cultivar.
Table 1-5 lists the total reported planted vines of white cultivars. Responding vineyards report 11,000 vines older than 10 years in the ground, 73,200 vines of age between 4 and 10 years, and 73,200 vines younger than 4 years. As with the red varieties, it appears production of white cultivar grapes will nearly double in the next 4 years as the youngest grape vines reach maturity. Frontenac blanc, Petite Amie, and Frontenac gris varietals have shown the most rapid growth in the last ten years.
St. Pepin8%
Brianna13%
Edelweiss12%
Frontenac blanc3%
Frontenac gris19%
La Crescent23%
La Crosse10%
Louise Swenson2%
Petite Amie2%
Prairie Star6%
Other2%
Chart 1-18: Total Planted Vines, White Varieties

VINEYARDS: BASELINE SURVEY RESULTS 21
Table 1-6: Planted Vines of White Varieties by Responding Vineyards, by Age
Variety
Vines Younger
than 4 Vines Between 4 and 10 Years
Vines Older than 10
Total
Brianna 13,191 6,921 902 21,014
Edelweiss 4,369 9,722 4,851 18,942
Esprit 316 848 - 1,164
Frontenac blanc 5,119 1 1 5,121
Frontenac gris 15,472 13,197 240 28,909
Kay Gray 374 98 267 739
La Crescent 17,381 18,026 738 36,145
La Crosse 2,574 10,802 2,407 15,783
Louise Swenson 2,549 511 47 3,107
Petite Amie 2,365 226 2 2,593
Prairie Star 4,822 4,457 414 9,693
St. Pepin 4,131 7,654 909 12,694
Other white Swenson 487 751 336 1,574
Total 73,150 73,214 11,114 157,478
Survey results indicate there are 5,914 acres planted in cold-hardy grapes in the participating states. Based on the percentages of planted vines reported in the survey, 42 percent of the acres are planted in white varietals. Table 1-7 highlights estimated acreage of the white varieties based on the survey results. Acres are estimated as the survey did not record acres planted by variety.
Table 1-7: Estimated Planted Acres of White Varieties in All Participating States
Variety Total
Brianna 331.5
Edelweiss 298.8
Esprit 18.4
Frontenac blanc 80.8
Frontenac gris 456.0
Kay Gray 11.7
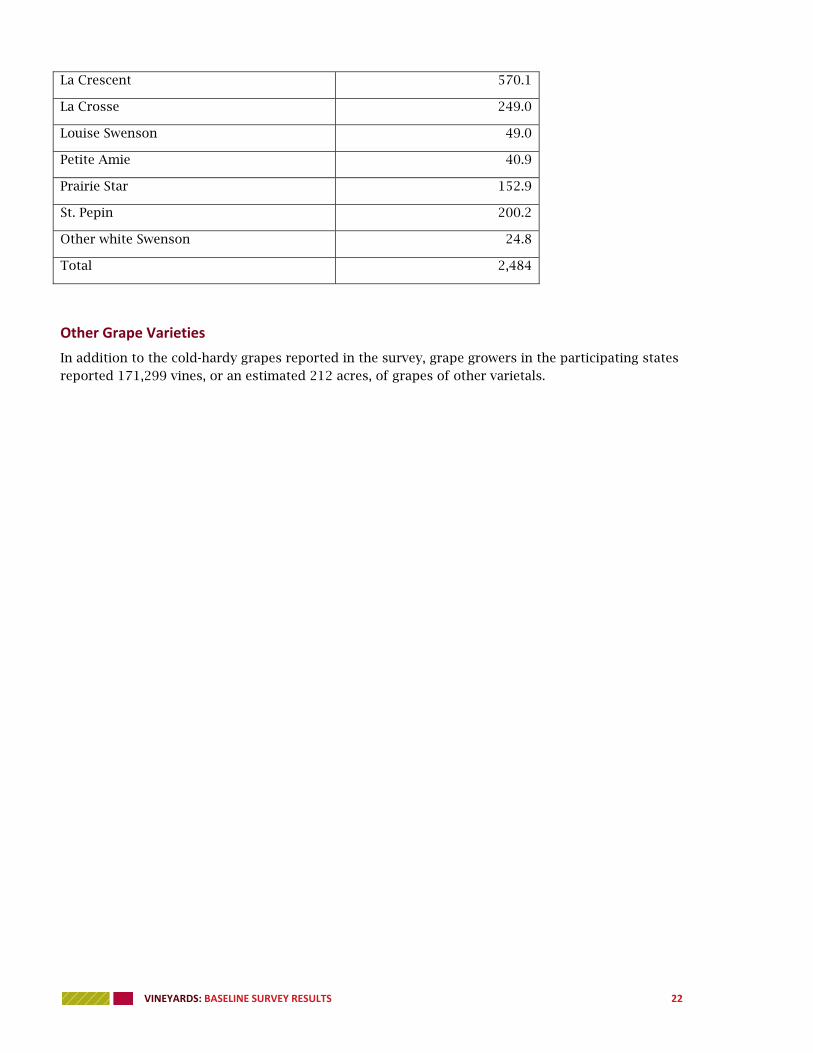
VINEYARDS: BASELINE SURVEY RESULTS 22
La Crescent 570.1
La Crosse 249.0
Louise Swenson 49.0
Petite Amie 40.9
Prairie Star 152.9
St. Pepin 200.2
Other white Swenson 24.8
Total 2,484
Other Grape Varieties
In addition to the cold-hardy grapes reported in the survey, grape growers in the participating states reported 171,299 vines, or an estimated 212 acres, of grapes of other varietals.

VINEYARDS: BASELINE SURVEY RESULTS 23
CONCLUSIONS AND IMPLICATIONS
The Northern Grapes Project brings together researchers, Extension specialists, and industry professionals from 13 states to address viticulture, enological, business management, and marketing issues related to growing cold hardy grapes and producing wines made from these grapes. A survey of vineyards and wineries in the participating states conducted by University of Minnesota has established a baseline for the industry in 2011. This report details the results of the vineyard and grapes baseline study.
There are 2,470 vineyards in the participating states with an estimated 20,900 acres planted in wine grapes. Of those acres, 5,900 are dedicated to cold-hardy wine grapes. Vineyards spent $45.1 million in 2011 for operations, capital improvements, and labor.
Our results lead us to several conclusions and potential implications for the vineyard and grape growing industry in the participating states, particularly in regards to the cold-hardy industry.
There are indications the rapid growth of vineyards may be diminishing. There are signs in the survey results the rapid growth of the industry may be slowing slightly. Growth in the number of vineyards from 2007 to present is lower than growth in the previous period. Further, nearly half of vineyards plan to remain at their current size over the next two years. This does not mean growth will not continue but it may be at a slower rate. Growth also varies by state.
Wineries tend to integrate with vineyards. The most common arrangement is for a winery to own its own vineyard. Vineyards are more likely to be stand-alone operations.
Wineries and vineyards are increasingly sophisticated in their interactions. Use of contracts to purchase grapes is the most common marketing arrangement. Wineries that purchase grapes via contract are involved in management decisions in the vineyard.
Rapid growth in grapes on the market will continue. Vines planted in the last four years account for nearly half of all planted vines. As these vines mature, production will increase dramatically.
The Marquette grape has been widely adopted. Debuting in 2006, the Marquette grape now accounts for almost 40 percent of all red cultivar vines planted in participating states.
Vineyard management issues are of concern to grape growers. Grape growers rate vineyard management issues, such as disease and pests/insects, as the biggest challenges to the growth and development of their vineyards.
VINEYARDS: BASELINE SURVEY RESULTS 24
APPENDIX ONE: PARTICIPATING INDUSTRY ASSOCIATIONS
The following industry associations/councils provided membership lists for the baseline and economic impact survey.
Connecticut Vineyard and Winery Association Illinois Grape Growers and Vintners Association Iowa Wine Growers Association Lake Champlain Wines Massachusetts Farm Wineries and Growers Association Michigan Grape and Wine Industry Council Minnesota Grape Growers Association Nebraska Winery and Grape Growers Association New Hampshire Winery Association New York Wine and Grape Foundation Northern Illinois Wine Growers Scenic Rivers Grape and Wine Association South Dakota Specialty Producers Association South Dakota Winegrowers Association Upper Hudson Valley Wine and Grape Association Vermont Grape and Wine Council Western Iowa Grape Growers Association Wisconsin Grape Growers Association

VINEYARDS: BASELINE SURVEY RESULTS 25
APPENDIX TWO: DEFINITION OF COLD‐HARDY GRAPES
For purposes of this study, researchers classified the following cultivars as cold-hardy. This was done in consultation with the Northern Grapes project advisory team which is comprised of growers in each of the states.
Table A-1: Cold-Hardy Red Varieties
Baltica
Beta
Frontenac
GR-7
King of the North
Leon Millot
Marechal Foch
Marquette
Petite Pearl
Sabrevois
St. Croix
Valiant
Other red Swenson
Table A-2: Cold-Hardy White Varieties
Brianna
Edelweiss
Esprit
Frontenac blanc
Frontenac gris
Kay Gray
La Crescent
La Crosse
Louise Swenson
Petite Amie
Prairie Star
St. Pepin
Other white Swenson