Vineyard 'leakiness'...Vineyard 'leakiness' Page 1 Vineyard ‘leakiness’ A workshop to scope the...
68
Vineyard 'leakiness' Page 1
Transcript of Vineyard 'leakiness'...Vineyard 'leakiness' Page 1 Vineyard ‘leakiness’ A workshop to scope the...

Vineyard ' leakiness '
Page 1

Vineyard ' leakiness '
Page 1
Vineyard ‘leakiness’
A workshop to scope the potential threat to the sustainability of Australian viticulture through excessive drainage below the root zone
Anecdotal evidence1 suggests that there is some doubt in Australia’s major wine export markets as to the sustainability of Australian winegrape production systems. In a general sense, Australian agriculture has been shown to be poorly tuned to the wider Australian environment. Of particular concern is the salinisation of much of Australia’s agricultural land as a result of tree clearing and the consequent mismatch between the amount of water required by crops during the growing season and that supplied annually in rainfall, and in some areas, the excessive use of irrigation water. As a result, there is a significant potential for drainage below the rootzone in many Australian agricultural systems; put another way, Australian agriculture is ‘leaky’. Current research focussed on precision viticulture2 suggests that yield variation in Australian vineyards is typically of the order of 8-10 fold, and not less than 4-fold and that fruit quality and vineyard soils may also vary significantly within individual blocks. This raises the question as to whether water use in Australian vineyards is inherently variable due to variation in the capacity of the vines in different parts of blocks to make use of the available water resource and/or the capacity of vineyard soils to receive and/or store it. The question that therefore arises, even when regional ‘best-practice’ is being followed, is: Is ‘leakiness’ a problem that threatens the sustainability of the wine industry? This workshop was convened with the purpose of considering this question, and assisting the Grape and Wine Research and Development Corporation (GWRDC) in the identification and prioritisation of appropriate avenues of research aimed at correcting the problems posed by vineyard leakiness. These proceedings contain the papers presented during the first day of the workshop, a summary paper in which some common themes that emerged from the other papers are highlighted, and a report on the workshop discussion sessions held on the second day. The workshop was held at the Waite Campus, Adelaide on January 24-25, 2002. Rob Bramley DeAnn Glenn Senior Research Scientist Programs Manager CSIRO Land and Water Grape and Wine Research and Development Corporation PMB No. 2 PO Box 2592 Glen Osmond Kent Town Business Centre SA 5064 SA 5072 [email protected] [email protected]
1 The keynote address by Phil Reedman (Tesco Supermarkets, UK) to the 11th Australian Wine Industry Technical Conference is a good example 2 See for example, www.crcv.com.au/research/programs/one/project1.1.1.asp and links from this site

Vineyard ' leakiness '
Page 2
List of participants
Rob Bramley CSIRO Land and Water, Adelaide, SA Cecil Camilleri Yalumba Wines, Angaston, SA Brianna Casey Queensland Farmers Federation, Brisbane, Qld Evan Christen CSIRO Land and Water, Griffith, NSW DeAnn Glenn GWRDC, Adelaide, SA Doug Godwin Consultant, Dubbo, NSW Ian Goodwin NRE, Tatura, VIC Peter Hayes Southcorp Wines, Adelaide, SA Paul Hutchinson CSIRO Land and Water, Griffith, NSW John Kennedy Orlando Wyndham, Langhorne Creek, SA Rai Kookana CSIRO Land and Water, Adelaide, SA Neil Lantzke Agriculture WA, Perth, WA Dean Lanyon CSIRO Land and Water, Adelaide, SA Brain Loveys CSIRO Plant Industry, Adelaide, SA Wayne Meyer CSIRO Land and Water, Adelaide, SA Ben Robinson Scholefield Robinson Horticultural Services, Adelaide, SA Gerrit Schrale PIRSA, Adelaide, SA Bill Slattery NRE, Rutherglen, VIC Rob Stevens SARDI, Loxton, SA Richard Stirzaker CSIRO Land and Water, Canberra, ACT Rob Walker CSIRO Plant Industry, Merbein, VIC

Vineyard ' leakiness '
Page 3
Table of Contents Leakiness of Australian agriculture: Salinity implications for the grape and wine industry Richard Stirzaker
4
Vineyard leakiness – Monitoring methods and current evidence Evan W. Christen and Paul Hutchinson
9
Examining ‘leakiness’ of Australian vineyards using the VineLogic simulation model D.C.Godwin and R.R.Walker
25
Evidence in support of the view that vineyards are leaky – Indirect evidence and food for thought from precision viticulture research Rob Bramley and Dean Lanyon
31
Leaky Soils – Irrigation and vineyard management Ben Robinson
39
Barriers to the adoption of new agricultural management systems: Lessons to be learned from outside the grape and wine industry Brianna Casey
43
Vineyard leakiness – ‘Industry’ reaction to and comment on workshop presentations Peter Hayes
51
Discussion session - Scoping the potential threat to the sustainability of Australian viticulture through ‘leakiness’ Dean Lanyon, Rob Bramley and DeAnn Glenn
55
Important Disclaimer
To the extent permitted by law, CSIRO Land and Water (including its employees and consultants) excludes all liability to any person for any consequences, including but not limited to all losses, damages, costs, expenses and any other compensation, arising directly or indirectly from using this publication (in part or in whole) and any information or material contained in it.

Vineyard ' leakiness '
Page 4
Leakiness of Australian agriculture: Salinity implications for the grape and wine industry
Richard Stirzaker CSIRO Land and Water, PO Box 1666,Canberra ACT 2601
Introduction The Salinity Audit (MDBC 1999) and the Australian Dryland Salinity Assessment (NLWRA 2001) have brought together the nation’s best hydrological understanding to make predictions on the future salinisation of rivers and land. The outlook over the next 50 years is so stark that every agricultural industry will have to evaluate its own contribution, or exposure, to the problem. This paper gives a quick overview of salinity implications for the grape and wine industry. First the basics of the “leakiness problem” are reviewed. Second, the impact of salinity on the grape and wine industry will be discussed. Finally some comments will be made on the contribution of the grape and wine industry to the salinity problem. The latter point is particularly important for the profile of an industry heavily reliant on access to overseas markets. 1 Leakiness of Australian agriculture
“Leakiness” is a somewhat clumsy term that is replacing the more familiar term “drainage” or movement of water below the root zone. Its rising popularity is partly because it is more descriptive, and partly because deep drainage conjures up for some the digging of deep drains. The term leakiness also conveys the picture that other materials are exported from one system and negatively impact another, particularly nutrients, sediment and pesticides. For the purpose of this paper the issues related to leakiness will be confined to deep drainage and its impact on salinity. The leakiness problem is best illustrated by comparing the water balance of a paddock with that of a catchment within which it is situated. The water balance at plot scale can be represented by the equation:
(P + I) = Et + RO + D + ∆S (eq 1) where P = precipitation I = irrigation Et = evapotranspiration RO = run off D = drainage below the root zone ∆S = change in water storage in the soil. Over the longer term the change in soil water content can be considered zero, that is, once the soil is full of water it cannot hold any more. As the name implies, water balance means that the remaining terms must all balance; the water coming into a paddock via rain and irrigation, must be balanced by water leaving the paddock via evapotranspiration, runoff, and deep drainage. There is huge controversy over what the drainage or leakage term is in various parts of the country. This is partly because drainage is very hard to measure and partly because there is enormous spatial and temporal variability. Consensus is that leakage rates under native vegetation average less than 5 mm y-1, except for very wet or sandy areas. Leakage under dryland crops

Vineyard ' leakiness '
Page 5
mostly fall in the range of 30 ± 20 mm y-1 for summer rainfall areas and 40 ± 30 mm y-1 for winter rainfall areas. Leakage under some irrigated crops may be hundreds of mm y-1. The water balance at catchment scale can be represented by the equation:
∆Sgw = R – G (eq. 2) where ∆Sgw = the change in the groundwater storage R = recharge to groundwater G = the amount of groundwater that can leave a catchment. R in equation 2 may be less than D in equation 1 since not all drainage from the rootzone becomes recharge to groundwater. This is because shallow lateral flows may be intercepted by deep-rooted vegetation, or intersect the soil surface lower in the catchment and produce springs or seeps. For simplicity we may assume that the deep drainage (D in eq. 1) is similar to the recharge (R in eq. 2). Thus the critical issues for “leakiness” is the extent to which the amount of water draining past the root zone exceeds G, the rate that water leaves the aquifer. When R exceeds G the water table will rise. Small amounts of recharge cause the watertable level to rise quite rapidly. This is because most of the space is already filled by soil particles and water. The specific yield of the aquifer relates the amount of recharge to the change in height of the watertable. If the specific yield is 5% then 10 mm of recharge causes the groundwater to rise by 200 mm. The amount of water that leaves the catchment, G, is determined by the conductivity of the aquifer, the hydraulic gradient and the area through which water is discharging and can be represented by the equation:
G = ∆Ksat A (eq. 3) where ∆ = is the hydraulic gradient or slope of the watertable (or the pressure gradient in the case of a
confined aquifer) Ksat = the saturated conductivity of the aquifer A = the cross sectional area of the aquifer. A useful concept is the discharge capacity of an aquifer. The discharge capacity represents the maximum amount of water that can leave a groundwater system without the groundwater reaching the surface. The discharge capacity is set at the point in the aquifer where the product of ∆, Ksat and A in equation 3 is lowest. The problem for Australia is that recharge from agriculture exceeds the discharge capacity of aquifers over vast areas of the landscape. Hence the phenomenon of rising groundwater and the salts they contain.

Vineyard ' leakiness '
Page 6
2 Impact of salinity on the grape and wine industry The impact is twofold; land salinsation and the declining quality of irrigation water – both from rivers and groundwater. Already 5.7 million hectares of land is considered saline or at risk of salinisation. This area is forecast to rise to 17 million ha by 2050. On current trends, eight major tributaries in the Murray – Darling Basin will exceed 800 EC by 2050. Whilst the area of land threatened by salinity is staggering, it is unlikely to have a major impact on the grape and wine industry as a whole. Few vineyards would be located in low-lying areas prone to salinisation, and in the longer term new vineyards could be planted in areas that will not be affected by salt. Declining water quality represents a greater threat to the grape and wine industry. Supply water salinity of 800 EC does not prevent irrigation, but it does mean that irrigation will have to be carried out more carefully and that extra water may be needed to leach salts from the root zone. Rising groundwater in irrigation areas is also a problem. The MDBC predicts that almost all the irrigated southern part of the basin will have a watertable within 2 m of the soil surface within ten years. This groundwater is often of reasonable quality, and its depth can be controlled by tile drains and pumping. However drainage is costly, and practices such as regulated deficit irrigation and partial root zone drying may be more difficult to implement over high watertables. It is important to note that there is little that the grape and wine industry can do to halt the advance in salinity. A sobering example given in the chapter by Hatton et al. in the book Trees Water and Salt (Stirzaker et al 2002) shows model predictions of an intermediate scale catchment before and after clearing. In this case the discharge capacity was around 2 mm y-1, meaning that if the leakage over the whole catchment averaged 2 mm y-1 the watertable would not rise to the surface. On clearing the average leakage rises to 20 mm y-1 and the saline area migrates two thirds of the way up the stream course over the next 100 years. In a further simulation, a one km belt of trees, which uses all the incident rainfall and some groundwater, is planted across the catchment. The effect on halting the march of salinity in the catchment as a whole is negligible. The implication is that a perfectly managed vineyard with no leakage cannot save itself from salinity. Salinisation is a catchment scale phenomenon, and relatively small interventions will be swamped by the larger scale processes. 3 Impact of the grape and wine industry on salinity The impact of salinity goes far beyond the loss of land and declining water quality described above. 20 000 km of major roads and 1 600 km of rail already traverse salt affected country. By 2050, 200 towns, 20 000 km of streams and 2 000 000 ha of native vegetation will be affected. Such statistics propel the salinity debate out of the agriculture arena. There are serious implications for nature conservation, infrastructure, urban water supplies and flood risk. The blame for the above statistics cannot be laid at the foot of any single industry, if blame is to be apportioned at all. The problem though, for a high profile export concern like the wine industry, is that all Australian agriculture may be tarred with the same brush in unsympathetic quarters. Grapes are usually irrigated, and irrigated agriculture has a poor environmental record in most parts of the world where it is practiced. Irrigation always seems to be under pressure either from

Vineyard ' leakiness '
Page 7
rising poor quality watertables or over-exploitation of rivers and aquifers if the water quality is high. Both problems occur in southern Australia, with a cap on diversions from the Murray-Darling system and the need for draining, pumping and disposal of poor quality water. However the MDBC does not view irrigation salinity with the same alarm as its dryland counterpart. The reason for this is that it is possible to implement engineering solutions for many irrigated areas. Though expensive, irrigated horticulture is usually sufficiently lucrative to cover these costs. It is possible that through policy and regulation that salinity can be managed in irrigated areas. The same cannot be said for dryland agriculture. Stirzaker (1999) shows why leakage is inevitable for irrigated agriculture, but the grape industry may be more environmentally friendly than most. First, much of the industry uses drip irrigation. Second it is the one irrigated crop that is often intentionally water stressed at certain growth stages. Third vines are genuinely deep rooted. Fourth, it is an industry with one of the highest uptakes of irrigation scheduling. Fifth, indications are that the culture among grape growers is predisposed to be parsimonious with water. Conclusion The question is not whether the grape and wine industry is “leaky”. Apart from forestry and some perennial pastures, all land use in Australia is leaky. The question should be “what does the grape and wine industry contribute to the wider economy in relation to its impact on the environment?” The MDBC is moving toward a system of “end of valley targets”, which means that the agriculture in a sub catchment will be judged against the quality and quantity of water produced by that catchment. High value enterprises using small areas of land may mean that other areas in the same catchment are released for agroforestry or deep rooted pastures that reduce the net leakage of the catchment as a whole. If the grape and wine industry can continue to demonstrate a commitment to efficient water use, it has a vital role in balancing agricultural productivity with catchment health. References Murray-Darling Basin Ministerial Council (1999). The salinity audit of the Murray-Darling Basin: a 100-year
perspective . Murray-Darling Basin Commission, Canberra National Land and Water Resources Audit (2001) Australian dryland salinity assessment 2000. Land and Water
Australia, Canberra Stirzaker R Vertessy R and Sarre A (2002) Trees Water and Salt. An Australian guide to using trees for healthy
catchments. RIRDC, Canberra Stirzaker R.J. (1999) The problem of irrigated horticulture: matching the bio-physical efficiency with the economic
efficiency. Agroforestry systems 45: 187-202.

Vineyard ' leakiness '
Page 8

Vineyard ' leakiness '
Page 9
Vineyard leakiness – Monitoring methods and current evidence
Evan W. Christen and Paul Hutchinson CSIRO Land and Water, Griffith, NSW, 2680
Introduction Globally, irrigated agriculture leaks water and solutes beyond the root-zone and evidence for this is ubiquitous. In Australia, water leaking beyond the crop root zone or deep drainage, is made evident by widespread shallow (<2 m) water tables throughout the major irrigation areas of south-eastern Australia. Deep drainage creates serious problems of waterlogging and land salinisation. In horticultural areas, such the Murrumbidgee Irrigation Area, Shepparton Irrigation Region and the Riverland along the Murray River, the risk of waterlogging has been so great that many farms are now protected by expensive (~$3000/Ha) subsurface drains (or tile drains) that control local water table heights and root-zone salinity. Australian viticulture also leaks water beyond the root-zone. In this paper we will show the evidence for this fact. We also describe what is known about the timing of deep drainage and the methods that can be used to monitor deep drainage. Grape vines potentially can develop deep root systems. They produce a high value crop and are adapted to regulating their water use through periods of drought. These attributes make vines very suitable for the Australian climate and one of only a few horticultural plant species that have the potential to produce economic yields without leaking water and solutes. We conclude this paper with a discussion on what research is required in order to meet this important objective. 1 Monitoring deep drainage Wine grapes are grown through a wide range of climates, topographies and soil types in Australia, ranging from deep red brown earths on undulating country in the sub-tropics to shallow top soils overlying limestone in the cool temperate south. Each location presents a series of minor obstacles to be overcome in order to monitor deep drainage defined as that water which moves below the root system. However, the first obstacle is the same everywhere – to define the extent of the root system. The maximum vertical extent of this root system must be known in relation to the location of any soil water monitoring device before any conclusions are made about the occurrence or volume of deep drainage. This section therefore begins with a review on the methods of estimating the vertical extent of the root zone of a grape vine. 1.1 Root zone extent There are four ways of obtaining estimates of root zone extent that are divided into destructive and non-destructive methods. Destructive methods include digging soil pits and soil coring. The non-destructive methods are soil moisture monitoring and soil penetration resistance. Soil pits are used extensively to examine the properties of the soil with depth. A pit is dug with a backhoe along the inter-row. The pit is typically 20-30 cm from the vine line and extends between two vine trunks. The soil on the face of the excavated hole is carefully removed using a scraper or soil pick to reveal a soil sample that was undamaged during the excavations. This soil is then examined for roots and the root zone extent determined.

Vineyard ' leakiness '
Page 10
Soil coring is performed with a narrow hollow tube that has an cutting edge at the tip. The core is driven with a sledge hammer, electric jackhammer or hydraulic press to depth in the vine-row and inter-row. The soil core is removed, cut into sections, placed in a medium porosity sieve and the roots removed from the soil by washing with water. Multiple samples are taken at different locations around a vine and the root zone extent is mapped. Figure 1 shows a map of the root zone around a grape vine irrigated with drip irrigation in Hanwood, NSW, (Cox, 1995). In this case the density of the roots was estimated by visual assessment of soil cores. The root zone is offset from the emitter, about 40 cm wide and 60 cm deep.
5
25
45
65
85
0 20 40 60 80 100 120 140
Depth (cm)
Distance from vine (cm)
0-11-22-3
Root Score
Emitter
Figure 1. Extent of grapevine root zone with drip irrigation Soil moisture sensors can be used to map the root zone extent. For devices such as a neutron probe, profiling capacitance sensor such as Diviner (manf: Sentek Pty Ltd), Gopher (manf:Sentek) or an array of gypsum blocks such as GBug (manf: Measurement Engineering Australia Pty Ltd) a season of data is required to determine the zone of water extraction due to the frequency of measurements. However, with the aid of high frequency logged soil moisture data such as Enviroscan (manf: Sentek Pty Ltd) or C-Probe (manf: Agr-Link Pty Ltd) the root zone extent can be mapped within a few days by observing the diurnal changes in soil moisture. The extent of the root zone is identified as the maximum depth where steps of daytime water extraction are visible. Figure 2 shows data collected with an Enviroscan soil moisture sensor. The rooting depth is 70 cm, because the amplitude of the diurnal steps cannot be identified beyond this depth. The last method for determining root zone depth is using a soil penetrometer. This instrument is a narrow rod that is terminated with a conical point. A spring gauge or electronic load cell is connected to the rod (Figure 3) to measure the pressure required to insert the penetrometer into the soil. Myburgh et al. (1996) compared the root zone depths, determined from soil pits, with the soil penetrometer resistance readings. They found that the root zone of a wine grape is limited to

Vineyard ' leakiness '
Page 11
that portion of the soil where the soil penetration resistance is less that 2 MPa at a soil-water content of field capacity.
Figure 2. Soil moisture monitoring data from Enviroscan
Figure 3. Penetrometer in use
No diurnal fluctuation

Vineyard ' leakiness '
Page 12
1.2 Deep drainage measurement The instrument selected to monitor deep drainage depends on the proximity of the water table to the root system, the level of complexity and the required accuracy. For applications where there is a shallow water table (<2 m) deep drainage is most easily observed by monitoring the water table height in a testwell. Figure 4 shows a testwell installed in a furrow irrigated vineyard in Griffith. A 3 m long PVC tube is slotted for its full length, covered with a fine mesh sock and installed in a vertical hole in the soil.
Figure 4. Testwell in vineyard with capacitance logger The water level in the testwell follows the rise and fall of the water table in the soil. This data can be measured manually with a plopping bell or recorded with water level sensor. The volume of deep drainage is given approximately by the height of the water table rise multiplied by the Air-Filled Porosity (AFP) of the soil above the water table. To obtain an accurate estimate of deep drainage from test well data consideration must also be given to the lateral and vertical flow of the local groundwater system. Where shallow watertables are present (<2m) water moving below the rootzone usually results in a rise in the watertable within 2 – 24 hours. In areas where grapevines are fully irrigated, roots are concentrated from 0.1 to 1m. This is generally due to inhospitable soil conditions to root growth below this depth and frequent irrigation of vines that discourages deeper root growth. The soil zone between the bottom of the root zone and the watertable is usually at or above the Drained Upper Limit (DUL), thus there is no storage available below the root zone and drainage is reflected relatively quickly as a watertable rise. In heavy subsoils the difference between the saturation water content and the DUL (the AFP) is usually small, <= 5%. E.g. AFP of 5% and watertable height change of 100mm can be inferred to represent 5 mm of drainage. A typical set
Vineyard ' leakiness '
Page 13
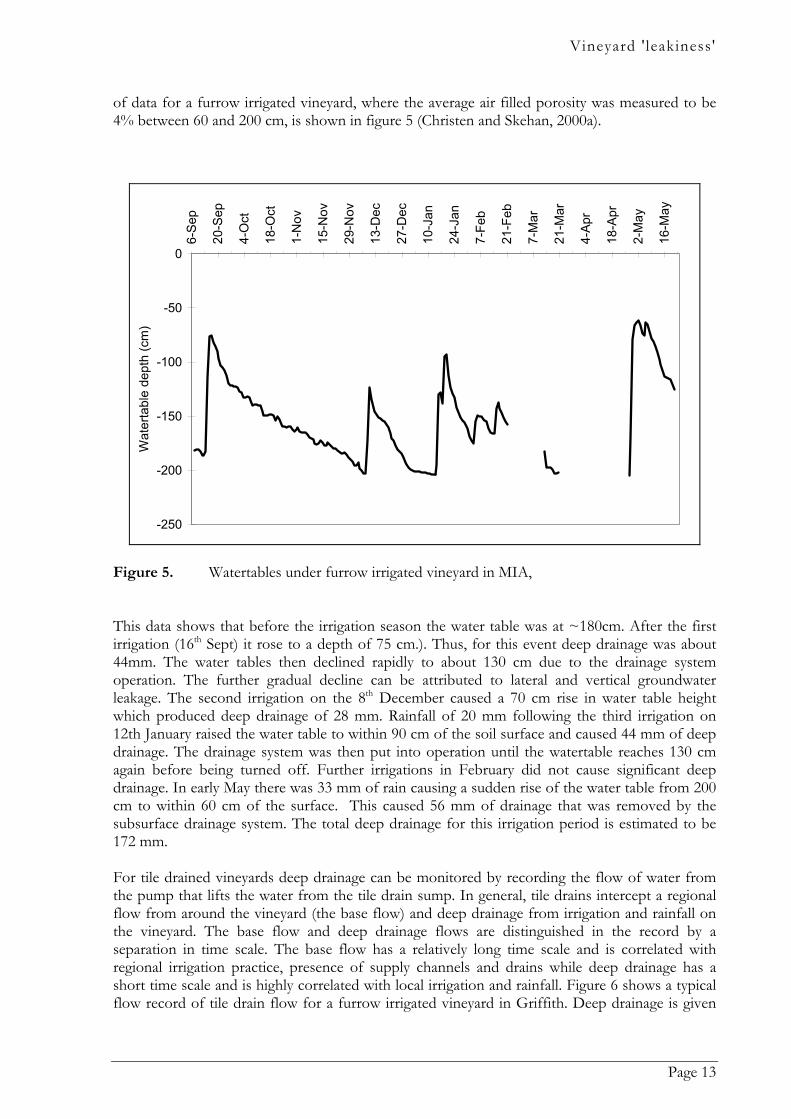
of data for a furrow irrigated vineyard, where the average air filled porosity was measured to be 4% between 60 and 200 cm, is shown in figure 5 (Christen and Skehan, 2000a).
-250
-200
-150
-100
-50
0
6-Se
p
20-S
ep
4-O
ct
18-O
ct
1-N
ov
15-N
ov
29-N
ov
13-D
ec
27-D
ec
10-J
an
24-J
an
7-Fe
b
21-F
eb
7-M
ar
21-M
ar
4-Ap
r
18-A
pr
2-M
ay
16-M
ay
Wat
erta
ble
dept
h (c
m)
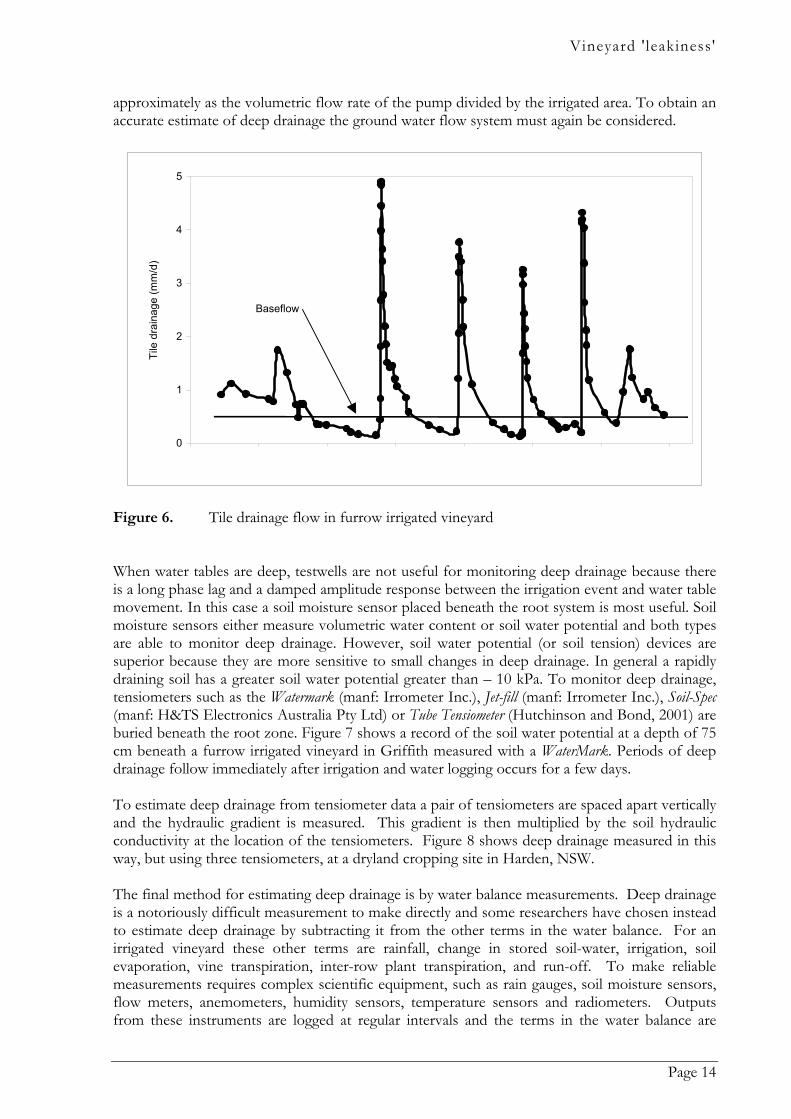
Figure 5. Watertables under furrow irrigated vineyard in MIA, This data shows that before the irrigation season the water table was at ~180cm. After the first irrigation (16th Sept) it rose to a depth of 75 cm.). Thus, for this event deep drainage was about 44mm. The water tables then declined rapidly to about 130 cm due to the drainage system operation. The further gradual decline can be attributed to lateral and vertical groundwater leakage. The second irrigation on the 8th December caused a 70 cm rise in water table height which produced deep drainage of 28 mm. Rainfall of 20 mm following the third irrigation on 12th January raised the water table to within 90 cm of the soil surface and caused 44 mm of deep drainage. The drainage system was then put into operation until the watertable reaches 130 cm again before being turned off. Further irrigations in February did not cause significant deep drainage. In early May there was 33 mm of rain causing a sudden rise of the water table from 200 cm to within 60 cm of the surface. This caused 56 mm of drainage that was removed by the subsurface drainage system. The total deep drainage for this irrigation period is estimated to be 172 mm. For tile drained vineyards deep drainage can be monitored by recording the flow of water from the pump that lifts the water from the tile drain sump. In general, tile drains intercept a regional flow from around the vineyard (the base flow) and deep drainage from irrigation and rainfall on the vineyard. The base flow and deep drainage flows are distinguished in the record by a separation in time scale. The base flow has a relatively long time scale and is correlated with regional irrigation practice, presence of supply channels and drains while deep drainage has a short time scale and is highly correlated with local irrigation and rainfall. Figure 6 shows a typical flow record of tile drain flow for a furrow irrigated vineyard in Griffith. Deep drainage is given
Vineyard ' leakiness '
Page 14
approximately as the volumetric flow rate of the pump divided by the irrigated area. To obtain an accurate estimate of deep drainage the ground water flow system must again be considered.
0
1
2
3
4
5
Tile
dra
inag
e (m
m/d
)
Baseflow
Figure 6. Tile drainage flow in furrow irrigated vineyard When water tables are deep, testwells are not useful for monitoring deep drainage because there is a long phase lag and a damped amplitude response between the irrigation event and water table movement. In this case a soil moisture sensor placed beneath the root system is most useful. Soil moisture sensors either measure volumetric water content or soil water potential and both types are able to monitor deep drainage. However, soil water potential (or soil tension) devices are superior because they are more sensitive to small changes in deep drainage. In general a rapidly draining soil has a greater soil water potential greater than – 10 kPa. To monitor deep drainage, tensiometers such as the Watermark (manf: Irrometer Inc.), Jet-fill (manf: Irrometer Inc.), Soil-Spec (manf: H&TS Electronics Australia Pty Ltd) or Tube Tensiometer (Hutchinson and Bond, 2001) are buried beneath the root zone. Figure 7 shows a record of the soil water potential at a depth of 75 cm beneath a furrow irrigated vineyard in Griffith measured with a WaterMark. Periods of deep drainage follow immediately after irrigation and water logging occurs for a few days. To estimate deep drainage from tensiometer data a pair of tensiometers are spaced apart vertically and the hydraulic gradient is measured. This gradient is then multiplied by the soil hydraulic conductivity at the location of the tensiometers. Figure 8 shows deep drainage measured in this way, but using three tensiometers, at a dryland cropping site in Harden, NSW. The final method for estimating deep drainage is by water balance measurements. Deep drainage is a notoriously difficult measurement to make directly and some researchers have chosen instead to estimate deep drainage by subtracting it from the other terms in the water balance. For an irrigated vineyard these other terms are rainfall, change in stored soil-water, irrigation, soil evaporation, vine transpiration, inter-row plant transpiration, and run-off. To make reliable measurements requires complex scientific equipment, such as rain gauges, soil moisture sensors, flow meters, anemometers, humidity sensors, temperature sensors and radiometers. Outputs from these instruments are logged at regular intervals and the terms in the water balance are

Vineyard ' leakiness '
Page 15
calculated. This method of measuring deep drainage requires a high level of precision because errors associated with instrument calibrations and operation will accumulate in the estimate of deep drainage. This method is not for the faint hearted or the budget conscious researcher.
0
5
10
15
20
25
30
6-Sep 6-Oct 5-Nov 5-Dec 4-Jan
Soil
tens
ion
at 7
5 cm
dep
th (k
Pa)
Supply endDrain end
Figure 7. Soil water potential at 75 cm, beneath young vineyard

Vineyard ' leakiness '
Page 16
Figure 8. Deep drainage by tensiometery, wheat crop at Harden 2 Evidence for leakiness Evidence of deep drainage has been collected from flood, furrow and drip irrigated vineyards in the Riverina. This includes large surveys and monitoring of individual vineyards. In all cases these vineyards had shallow water tables present and in all but one case the vineyards were tile drained. The methods used to estimate deep drainage were to monitor flows from tile drains and water table response.

Vineyard ' leakiness '
Page 17
35
26
48
0
10
20
30
40
50
60
SPRING SUMMER AUTUMN WINTER
Dra
inag
e (m
m)
Figure 9. Tile drainage flows 1990/91 (DLWC data) Drainage measurements for the 1990/91 season were made in 37 flood and furrow irrigated vineyards in the MIA (Figure 9). The annual deep drainage ranged between 12 and 311 mm with an average of 73 mm. A similar study, but with fewer farms in 1999, found that annual deep drainage ranged between 5 and 180mm with an average of 70 mm (McCaffery, 1999). Deep drainage is greatest in Spring as canopies are not fully developed, evapotranspiration is low and the soil profile is wet with Winter rainfall. Rainfall after early season irrigation also contributed to significant drainage in Spring. In Summer the canopy develops and there is less drainage because the majority of the applied water is being transpired. Rainfall also has less impact on deep drainage during Summer. Deep drainage is least during Autumn and Winter. Rainfall in the region is relatively low, 400mm annual average, and is evenly distributed about 30 mm per month, and as such generally results in little deep drainage from rainfall, unless there are unusually wet conditions. The period represented above had 236 mm of rain in total. This was distributed as 52, 24, 35 and 125 mm across the seasons. In comparison to the long-term average this data was recorded in a year where Spring, Summer and Autumn were dry but winter was wet. This further shows that deep drainage is dominantly due to irrigation rather than rainfall. Cock et al. (1991) surveyed 16 Sultana vineyards in the Riverland and estimated deep drainage by measuring soil moisture in the profile. There data is shown in Table 1 for sprinkler, furrow and micro-sprinkler irrigated vineyards.

Vineyard ' leakiness '
Page 18
Table 1. Drainage estimates in Sultana vineyards in Riverland
Irrigation method Total irrigation (mm)
Total Drainage (mm)
Percentage drained
Furrow (6 farms)
778 452 58
Overhead sprinkler (7 farms)
769 413 54
Micro sprinkler (2 farms)
716 308 43
These data show that vineyards leak as much as 60% of the applied water. Vineyard management impacts strongly on leakiness as the following case examples show. 2.1 Early irrigation Christen and Skehan (1999, 2001) monitored drainage under young vines (2-3 years old) in the Murrumbidgee irrigation area on a clay loam soil underlain by medium clay. The vineyard was furrow irrigated and had drains installed 1.8 m deep and 20 m apart (i.e. every 6 rows of vines). Figure 10 shows the drainage from each irrigation event. This data shows that the deep drainage was greatest on the first irrigation. It occurred because the farmer irrigated before there was a sufficient soil water deficit (SMD) to accept the 45 mm of water applied in the furrows and because the furrows had been reworked and the soil loosened. The latter increased infiltration rates and soil roughness, reduced the irrigation advance speed and hence reduced application uniformity and generated more deep drainage.
16%
8% 7%6%
2%
0%
5%
10%
15%
20%
1st (45mm) 2nd (63mm) 3rd (78mm) 4th (73mm) 5th (68mm)Irrigation number and amount
Perc
anta
ge o
f irri
gatio
n dr
aine
d
Figure 10. Proportion of applied irrigation water removed by the drains for each irrigation
event

Vineyard ' leakiness '
Page 19
As the season progressed the canopy developed and the soil profile dried to a SMD of 50-70 mm. This allowed more irrigation water to be retained in the profile. Also the soil compacted during the season and the furrows were smoothed under the influence of water. The infiltration rate therefore was reduced and advance speeds increased, improving the irrigation application uniformity. Rainfall events in the irrigation period can lead to greater deep drainage. For the above data set there was a 30 mm rainfall event 6 days after the 4th irrigation. The irrigation interval at this stage was about 21 days. This rainfall resulted in 3 mm of tile drainage due to inadequate storage available in the profile. 2.2 Irrigation method and scheduling An assessment of irrigation performance and resultant improvement was undertaken by Christen and Skehan (2000b) in a 50 ha vineyard in the Murrumbidgee Irrigation Area using flood irrigation on 400 m rows. The existing irrigation practice relied on scheduling by “gut feeling” and irrigation application by broad-based furrows that wetted the entire floor area of the vineyard. The vineyard had a subsurface drainage system (tile drainage) consisting of laterals 40m apart and about 2m deep flowing to a main sump. The vineyard was intensively monitored from January to May for the 1996/97 season under the farmers own irrigation management. This monitoring included the irrigation applied, rainfall, tile drainage and water table characteristics of the farm. In 1997/98 season changes were made to the irrigation and drainage management. Flood irrigation was replaced by narrow furrows, irrigations were scheduled with tensiometers (re-irrigating at about 80kPa, after flowering) and during irrigations the subsurface drainage pump was turned off and also when the water level in the sump fell below 1.2m. For data comparison and calculations only the period from January to May was used. Changing the irrigation method resulted, approximately, in one third of the vineyard surface area being wetted. In addition, the advance time for the irrigation water was halved. The main effect of the irrigation scheduling changes was to increase the irrigation interval by about 6 days, from 11 to 17 days in peak season. The main result of managing the tile drainage pump was that the pump was off more than it was on. Early in the season the water table was high and so the pump was switched on, but as the vine canopy developed and started to use more water the pump was not needed. Even after irrigation, the water tables dropped away quite quickly without the pump being on. Table 2 summarizes key differences found between the two seasons. In both periods the crop water requirement were similar, although there was more rain in the season when irrigation management was improved. Irrigation was reduced by about 33% by increasing the irrigation interval by 54% in the peak season and by using narrow furrows and getting the water to the end of the rows more quickly. The improved irrigation practice resulted in a large overall improvement in the water use efficiency by better matching irrigation to crop water requirement and also by making better use of rainfall. The improved irrigation management resulted in about 10% extra water in excess of crop water use being applied as compared to 42% extra previously. By reducing the water applied to the vineyard the amount of salt brought into the vineyard (the salt in the irrigation water) was also reduced.

Vineyard ' leakiness '
Page 20
By improving the irrigation management and tile drainage management the total amount of tile drainage from the vineyard was reduced by 88%. The quantity of salt removed by the tile drainage system was also reduced, but still adequate to control root zone salinity. This has the potential to reduce salt loads to downstream environments if drainage water flows into channels and streams. Table 2. Summary of changes caused by improved irrigation and tile drainage management
Factors Management Change Previous
(96/97) Improved (97/98)
SEASONAL Potential Evapotranspiration (mm) 951 887 Rainfall (mm) 93 132 Crop water use (mm) 481 443 IRRIGATIONS Irrigation applied total (mm) 590 354 Down 33 % Amount per irrigation (mm) 56 66 Up 18 % Irrigation interval (days) 11 17 Up 54 % Irrigation compared to requirement (irrig. Applied / crop requirement)
23 % too much
20% too little Down 43 %
Water use efficiency (irrig. + rainfall / crop requirement)
42 % too much
10 % too much Up 32 %
TILE DRAINAGE Water table depth (m) 1 - 1.8 1.5 - 2.3 Down Tile Drainage (mm) 73 9 Down 88 %
2.3 Comparison of irrigation methods A comparison of three vineyards using; flood, furrow and drip in the MIA was undertaken by Christen and Skehan (2000a). All three vineyards were monitored for irrigation applied, subsurface drainage, run off and watertables for the 1995/96 season (Table 3). Drip irrigation gave greater control over irrigation applications, small amounts of water were applied frequently. This resulted in no run off or tile drainage from irrigation. This is in comparison to irrigation with flood and furrows where run off and drainage fluctuates widely, demonstrating the difficulty of getting good control of surface water.

Vineyard ' leakiness '
Page 21
Table 3. Summary of irrigation system performance
System Number of irrigations
Total Water applied mm**
Run off from irrigation MM
Tile drainage from irrigation mm
Percentage tile drained
Flood 10 355 13 52 15 Furrow 6 385 41 37 10 Drip* 26 140* 0 0 0
* The drip irrigated vines were only 2 years old, thus reduced water use would be partly due to reduced ET. ** About 200mm of in season rainfall is not included in these figures. Only drip irrigation prevented surface runoff, this was clearly demonstrated when 65 mm of rain fell in 24 hours, resulting in only 1.5 mm of run off, the rest of the rainfall being absorbed in the dry inter-row area. Water tables under the surface irrigated vineyards fluctuated more over the season than under the drip irrigated vineyard. The water tables under drip irrigation usually did not show any rise after irrigation, indicating that the drip irrigation did not cause significant water percolation past the root zone. The only period when water tables fluctuated significantly was after 65mm of rain when water table at the bottom end of the farm rose by 510mm, and at the top end of the farm by 70mm (Figure 11). However, even with drip irrigation drainage can occur if it is managed poorly. Figure 12 shows the water table response of another drip irrigated vineyard in the MIA, (Cox, 1995). During this period of monitoring there was a watertable response to almost every irrigation. The watertable rises provide an estimate of 4 to 5 mm of drainage. This was measured directly below the vine row. Tensiometers in this position showed that there was free water at about 80cm depth. However, 100 cm away from the emitter, into the inter-row area, it was much drier.
-220
-200
-180
-160
-140
-120
-10027-Dec 28-Dec 29-Dec 30-Dec 31-Dec 1-Jan 2-Jan 3-Jan
Dep
th to
wat
erta
ble
(cm
) Top of rowsBottom of rows
Figure 11. Water tables under drip irrigation, 65 mm rain 31st December

Vineyard ' leakiness '
Page 22
2.4 Subsurface drainage management Many vineyards have subsurface drainage systems installed. These provide waterlogging control and prevent soil salinisation or reclaim salinised land for production. Drainage systems are usually highly effective in remediating problems of waterlogging and salinity. However, often they are too effective, removing water from the soil profile that could have been used by the crop, i.e. over drainage. Over drainage occurs due to drawing watertables down well below the crop root zone and any capillary fringe effect, e.g. > 1.5m in heavy soils, or due to bypass flow occurring during irrigations. This occurs in flood/furrow irrigation due to irrigation water moving through the profile to the drains during the irrigation event itself. A recommended practice now in the MIA is to turn drains off during the irrigation event and not to allow drains to lower the watertable to depths greater than 1.5m, Christen and Ayars (2001).
-145
-135
-125
-115
1 3 5 7 9 11 13 15 17 19 21 23 25 27 29 2 4 6
Wat
erta
ble
dept
h cm
February March
Figure 12. Watertable measured directly under drip emitter A comparison of managed and unmanaged drains was undertaken by Christen and Skehan (2000a). They found that by managing subsurface drains they reduced the total drainage over two seasons from 73 to 47 mm and that the salinity of the drainage water was reduced from 11 to 7 dS/m. This resulted in a 50% reduction in the salt load from 6 to 3 t/ha by managing the subsurface drains. 3 Further research and extension Australian irrigated viticulture leaks water beyond the root-zone. Data shown here demonstrates that this leakiness can represent 10 to 40% of the irrigation applied. The data also shows that in the warmer growing areas where flood and furrow are used, the majority of deep drainage occurs early in the growing season because of imperfect irrigation scheduling and the inefficiencies of flood and furrow irrigation. To reduce deep drainage, the industry will need to focus on the following four areas:

Vineyard ' leakiness '
Page 23
3.1 Early season management Early season deep drainage is likely to occur in flood and furrow irrigated vineyards when the grower irrigates early to minimise the risk of frost damage and to maximise the likelihood of obtaining strong early season growth. Early season drainage might be reduced by removing inter-row crops prior to budburst to increase frost protection and by using sensors to monitor soil moisture and manage early season growth. Research is required to determine the efficacy of frost protection via inter-row clearing versus early irrigation. Extension work is required to demonstrate to farmers that use of soil moisture sensors to monitor soil conditions during the early season is a viable alternative to giving the vineyard an early irrigation. 3.2 Improved irrigation methods Irrigation method has shown to play a major role in deep drainage. Leakiness is reduced when flood and furrow irrigation layout is improved by reducing row length, changing furrow shape and increasing flow rate. Drip irrigation reduces the risk of deep drainage because small volumes of water can be applied so that small moisture deficits can be managed. However, drip irrigated vineyards are still found to have deep drainage because the ability of the soil to move water horizontally has been overestimated by the irrigation designer and irrigator. This is particularly true of soils like sands and heavy clays. Research is required to determine the soil conditions when micro-sprinkler irrigation is better suited than drip. Extension work is required to demonstrate to farmers that improving their flood and furrow irrigation method need not be expensive and/or difficult to manage. 3.3 Inter-row and root zone management During winter, vines are dormant and the root-zone is refilling with winter rainfall. If the root-zone of the vines is limited in extent then it is possible that the profile will wet beyond the root-zone and cause deep drainage. For shallow rooted vines, winter inter-row crops are likely to reduce this deep drainage. Research is required to determine the effectiveness of winter inter-row crops at minimising deep drainage and to determine the limitations that are causing restricted root-zone extent. 3.4 Subsurface drainage management Most vineyards in the Riverina and Riverland have some form of subsurface drainage, either tile drainage or spearpoint groundwater pumping, to protect against waterlogging and salinisation. Thus most deep drainage is removed from the soil profile and does not result in crop damage. Studies have shown that changed management of these subsurface drainage systems can reduce the drainage by up to 50% without affecting vine growth or causing soil salinity, Christen and Skehan (1999). Research and extension work is required to better management drainage in conjunction with improved irrigation.

Vineyard ' leakiness '
Page 24
Acknowledgments Our thanks go to: Terry Murphy of Farm 195b at Hanwood, NSW for supplying moisture data from his vineyard, the Murray Darling Basin Commission for funding of vineyard drainage monitoring and the Grains Research and Development Council for funding monitoring of drainage under wheat. References Christen, E.W. and Skehan, D. (1999). Design and management of subsurface drainage for improved water quality: a field trial.
CSIRO Land and Water Technical Report 6/99, CSIRO Land and Water, Griffith Christen, E. and Skehan, D. (2000a) Design and management of subsurface drainage to reduce salt loads. CSIRO Land and
Water, Consultancy report 22-01 Christen, E.W. and Skehan, D. (2001) Design and Management of subsurface horizontal drainage to reduce salt
loads. ASCE Journal of Irrigation and Drainage Engineering. 127 (3): 148 –155, May/June 2001. Christen, E.W. and Skehan, D. (2000b) Improving and integrating irrigation and subsurface drainage management in
a vineyard: A case study. Irrigation Australia 2000 Conference proceedings. p 68-73. Editor G.J. Connellan, Irrigation Association of Australia
Christen, E.W. and Ayars, J.E. (2001) Subsurface drainage system design and management in irrigated agriculture: Best Management Practices for reducing drainage volume and salt load. Technical Report 38-01. CSIRO Land and Water, Griffith, NSW, 2680
Cox, S. (1995). Water, root and salt distributions under irrigated grapevines. Summer student report, CSIRO Land and Water, Griffith.
Cock, G.J., Cole, P.J., Zimmerman, A. and Harvey, G.C. (1991). Water balances of irrigated Sultana vineyards in the Riverland of South Australia. Technical report No.179, Dept. of Agric. South Australia, August 1991
Hutchinson, P.A. and Bond, W. (2001) Routine measurements of the soil water potential gradientnear saturation using a pair of tube tensiometers. Aus. J. Soil Res. 39: 1147-1156.
McCaffery, A. (1999). The Murrumbidgee Irrigation Area tile drainage monitoring project 1998/99. 1997/98 National Heritage Community group Project progress Report. Murrumbidgee Irrigation Ltd, Griffith, NSW.
Myburgh P., Cass A. & Clingeleffer P. (1996). Root systems and soils in Australian vineyards and orchards - an assessment. Barossa Valley Rotary Club Foundation Fellowship Report, Cooperative Research Center for Soil and Land Management, Adelaide.
Sinclair, P.J., Osborne, G.J., Hoogers, R., Ireland, D.P. and Bots, A.D. (1994). Soil and irrigation management practices to sustain vineyard productivity. Final report of project DAN 7GW to GWRDC. NSW Agriculture, Griffith, NSW.

Vineyard ' leakiness '
Page 25
Examining ‘leakiness’ of Australian vineyards using the VineLogic simulation model
D.C.Godwin1 and R.R.Walker2,3
13 Colony Crescent, Dubbo, NSW 2830; 2Cooperative Research Centre for Viticulture, PO Box 154, Glen Osmond, SA 5064;
3CSIRO Plant Industry, PMB, Merbein, Vic 3505. Introduction In viticultural systems ‘leakiness’ refers to water which moves from the volume of soil which is occupied by vine roots. For our purposes this has units of mm y-1 and a positive value implies water is lost from the rooted soil volume and a negative value implies there was a net upward flux of water into the soil profile from groundwater. Any water which drains from the rooting zone contributes to groundwater. Where drainage is restricted below the root zone this draining water may accumulate and cause the water table to rise. Any water in the profile in excess of the transpiration requirements of the vine and any that can be lost via soil surface evaporation is prone to leakage. Since rooting density declines with increasing soil depth the likelihood of all water deep in the profile being intercepted by roots diminishes. There have recently been expressed concerns about the magnitude and fate of this water ‘leaking’ or draining below vineyards. To supply water to the lowermost reaches of the rooted volume where root density is lowest, some leakiness is inevitable. This flux of water beyond the root zone can also remove solutes from the reach of vines. Measurement of leakiness in undisturbed soil below vines is difficult. The soil water balance of a volume of soil for a point in the landscape can be described by the equation:
SWt = SW t-1 + R + I - Ro – E – T – Td – D Where: SW t = Volume of soil water present at time t R = rainfall amount since time t-1 I = irrigation amount Ro = soil surface runoff E = soil surface evaporation T = transpiration Td = water removed by tile drains D = net drainage below the root zone When considered over the depth of rooting, leakiness refers to the D value. Experimentally, this can be difficult to measure. Since most of the components in the water balance equation depicted above are affected by weather, there is likely to be considerable year to year variation in D. VineLOGIC is a simulation model which describes the nuances of weather and their impacts on vine growth and water balance. It incorporates each of the major components of water balance described above and is ideally suited to estimate D in a range of circumstances when adequate data are available.

Vineyard ' leakiness '
Page 26
Description of VineLOGIC The VineLOGIC model is a simulation model of the growth, phenology, water and salt balance of the grape vine. It operates at a point scale and uses a daily time step, requiring daily weather data as inputs. VineLOGIC is a package comprising a user-friendly graphical interface; a comprehensive help system; data bases of weather, soil, variety and rootstock information; and the simulation model. There are versions tailored for use in both research and teaching environments. The model has several major components which are briefly described below. Life cycle and growth In its current mode of operation the model commences simulation in January and uses daily weather data and chilling requirement procedures to determine when bud ecodormancy occurs. After the period of ecodormancy the model then uses additional weather data and a heat sum approach to simulate when budburst occurs. The procedures used enable simulation of budburst dates which differ by variety, location and season. It is important to simulate the date of budburst accurately since this marks the start of canopy growth and hence vine water use. Following budburst the model uses thermal time to determine the date of first flowering. The model goes on to predict a harvest date and the duration of canopy growth. Simulation ends at leaf fall. From budburst onward the model simulates daily increments of leaf and shoot growth. As the canopy grows the model determines when laterals are produced. On each day of growth, the model calculates an amount of solar radiation intercepted by the canopy. Simulated light interception varies with canopy size, trellis design and pruning system. The energy intercepted is converted into biomass which is partitioned into leaves, shoots, fruit, roots and vine reserves. The partitioning varies daily according to the availability of assimilate, the magnitude of prevailing sinks and any stresses which may prevail. At flowering time the model computes a potential fruit load from the size of shoots. Adjustments to the fruit load are made during the fruit growth period on the basis of assimilate availability and stresses. Fruit yield, berry number and berry weight and canopy size are predicted. Water balance The water balance component of the model is derived from the Swagman Destiny model which has been described in detail elsewhere (Meyer et al. 1996). The water balance model uses 15 layers of varying thickness and simulates the balance to a depth of 5 metres in one dimension. The surface layer is assumed to be 2 cm thick and layers progressively thicker are used to the bottom of the root zone. Rooting depth is an input parameter to the model. Beyond the root zone, layers 50 cm thick are used. The model requires specification of the plant extractable water contents and saturation moisture contents for each layer, as well as maximum drainage rates from each layer. When these data are not directly available, they may be estimated from soil texture and bulk density. The model simulates the infiltration of water using a time to ponding approach to account for irrigation or rainfall intensity. Drainage through the profile is simulated using a simple cascading or “tipping bucket” system. The infiltration routines can accommodate zones in the soil profile where drainage is impeded and water accumulates, leading to perched water tables. The model also includes a linkage to deeper groundwater by using the regional piezometric head at 5.0 metres together with the maximum flux across the plane at the 5.0 metre depth as inputs. When drainable water accumulates in the profile (with a watertable) above the piezometric head, water flows out from the profile. Conversely, when the level of the water table is below the regional

Vineyard ' leakiness '
Page 27
piezometric head, water flows into the profile. When water flows into the root zone and is used by the vine, D in the water balance equation above is negative. The water balance model also simulates the uptake of water from roots throughout the profile in response to transpiration demand. Evaporation from the soil surface is also simulated. Simulated values of D will thus be affected by factors which affect the withdrawal of water from the soil profile as well as those which cause the downward flux of water. The model also accommodates the effects of tile drains. These can be placed at any depth in the soil profile. The model is one-dimensional and at this point assumes uniformity of application of irrigation water. It thus cannot accurately represent the situation where a wetted volume of soil may occur under the vine caused by irrigation while dry soil remains between the vine rows. Work is in progress to improve simulation of spatially non-uniform irrigation systems. Salt balance The model simulates the addition of salt to the soil from irrigation water and accounts for any losses which may occur with surface runoff. Simulation of the movement of salt through the profile is accomplished with a solute flux routine driven by the flux of water. Salt may move in a downward direction (leaching) with draining water or in an upward direction with water gradients created by surface evaporation and root water uptake. The model also simulates the fluxes of salt associated with movement of water into tile drains and the movement of salt into the soil profile from a rising saline water table. The impact of salinity on vine growth is simulated using a salt stress index which is determined from the prevailing salt concentrations in each of the soil layers, the water content and the distribution of plant roots. The salt stress index is used to modify rates of canopy growth and photosynthesis per unit leaf area. Simulation studies on leakiness The VineLOGIC model was used to examine several aspects of leakiness. Since leakiness will differ from year to year because of variations in weather, simulations were run over a ten-year period to gauge the range of leakiness for each scenario. Since the major sink for water in a vineyard is, or at least should be, the vine itself several simulations were run which manipulated the size of the vine canopy to determine its impact on leakiness. In these simulations no attempt was made to emulate the management of an actual vineyard where management would be driven by quality imperatives. These studies used daily weather data from Adelaide for the 10 years from 1967 to 1977 and soil properties for a sandy loam soil. The variety simulated was Chardonnay and in each case a maximum yield scenario was run. This scenario involved pruning with a high number of retained buds, generous irrigation regimes and with a full profile of water at the end of winter. The irrigation regime assumed vines would be irrigated when the top 60 cm of soil dried to 50% of its capacity, then an irrigation would fully recharge this volume of soil.

Vineyard ' leakiness '
Page 28
Soil Type Ks at 1.00 metre
(cm d-1) Annual Leakage (mm)
Sandy loam 10.0 -3 to 35 Clay loam 5.0 -3 to 12 Clay 0.5 -1 to5
Table 1. Effect of Soil Hydraulic properties on simulated annual leakage. Ks refers to a model input parameter describing the maximum drainage rate (cm water d-1) from a layer located 1.0 m deep in the profile
Table 1 shows the range of leakage occurring for 3 soil types using the weather data for Adelaide. In all cases cited in the simulations below leakage values are for the period from budburst to leaf fall. Preliminary simulations indicate leakage will occur from vineyards during the winter period when no transpiration occurs, especially if this coincides with a period of high winter rainfall. In vineyards which are predominantly rainfed this will be expected to be when the largest amount of leakage occurs, especially if no cover crop exists to extract water.
Vine Arrangement
(m × m)
Bare Soil Evaporation
(mm season-1)
Vine Transpiration (mm season-1)
Irrigation Applied
(mm season-1)
Peak Leaf Area Index
Annual Average Leakage
(mm) 3.3 × 2.4 231 565 343 1.32 12 3.0 × 2.4 214 673 344 1.48 12 2.4 × 1.0 189 766 415 2.47 9
Table 2. Effect of vine population and arrangement on transpiration, canopy size and leakage.
Table 3. Effect of trellis dimensions on vine transpiration and annual leakage. Trellis
dimensions refer to height and effective canopy width
Negative values of leakage occurred 1 year in 10 and indicate years in which there would be a net upflow of water from groundwater into the rooted soil volume. This can occur in dry years. In the sandy loam, maximum leakage of 35 mm occurred in a year with several large rainfall events. In another study (Table 2) the effects of vine population on leakage were investigated. Here the simulations were performed on a clay loam with the same irrigation regimes as described previously. In these simulations as vine population is increased (narrower row spacing and inter-vine distance) the proportion of evapotranspiration which is lost from bare soil is decreased and vine transpiration is increased. This larger transpiring surface dries the soil faster and using the
Trellis Dimensions
(m)
Vine Transpiration
(mm)
Annual Leakage
(mm) 2.0 × 1.2 718 4 1.5 × 0.8 683 3

Vineyard ' leakiness '
Page 29
irrigation regime cited leads to a larger volume of irrigation water applied. Despite the larger volume of irrigation water applied, annual leakage rate is greater than with a lower vine population. Manipulating trellis dimensions for a given vine population will cause differences in the amount of radiation intercepted. This in turn will cause differences in the transpiration/bare soil evaporation ratio as will changes to vine canopy growth which will impact on canopy demand for water. The simulations depicted in Table 3 indicate annual leakage can be impacted by changing trellis dimensions. Conclusions The simulation studies indicated that leakage varies from year to year and the magnitude is influenced by the size of the transpiring surface. Leakage was also shown to vary with soil properties and underlying hydrology. Since soil properties will vary from point to point within the vineyard as will corresponding vine vigour, considerable spatial variation in leakage in a vineyard could be expected. Many other aspects of vineyard hydrology and management can be investigated with VineLOGIC. Within its application boundaries it is a powerful tool for assessing the magnitude of leakiness from points in vineyards. Reference Meyer, W.S., Godwin, D.C. and White, R. 1996. SWAGMAN Destiny: A tool to project productivity change due to
salinity, waterlogging and irrigation management. Proceedings of the 8th Australian Agronomy Conference. www.regional.org.au/au/asa/1996/contributed/425meyer.htm#TopOfPage

Vineyard ' leakiness '
Page 30

Vineyard ' leakiness '
Page 31
Evidence in support of the view that vineyards are leaky – Indirect evidence and food for thought from precision viticulture research
Rob Bramley1,2 and Dean Lanyon1
1CSIRO Land and Water; 2Cooperative Research Centre for Viticulture PMB No. 2, Glen Osmond, SA 5064.
Introduction Recent research into vineyard variability and the associated development and application of precision viticulture (PV) has demonstrated that vineyards are highly variable (Bramley, 2001a,b; Bramley and Proffitt, 1999, 2000; Lamb and Bramley, 2001). Indeed, yield mapping in the Coonawarra, Clare Valley and Sunraysia suggests that within individual vineyard blocks under uniform management, yield variation is typically of the order of 8-10 fold (ie 2-20 t ha-1) with similar variation in fruit quality. However, as Figure 1 illustrates, patterns of spatial variation in yield are fairly stable over time - which is perhaps, the expected result for a perennial crop such as winegrapes. This affords the wine industry the opportunity to identify ‘management zones’ within vineyards for which differential, or targeted, management is warranted. It is not the intention of this paper to describe or explore PV; rather, using some of the results obtained in our PV research to date, we seek to illustrate the inevitability of vineyard leakiness, and to identify areas of research that may assist in minimising undesirable leakiness. For the purposes of this paper, leakiness is defined as the drainage loss of water and nutrients from the rootzone.
Figure 1. Yield variation in a 7.3 ha block of Cabernet Sauvignon in the Coonawarra –
vintages 1999-2001. The similarity in the pattern of spatial variation over the three years promoted construction of a composite map (bottom left) and the development of a targeted management strategy (bottom right).

Vineyard ' leakiness '
Page 32
Materials and methods In this paper, we present data collected from a 7.3 ha Coonawarra vineyard under Cabernet Sauvignon and a 24 ha vineyard in the Clare Valley supporting a number of premium winegrape varieties. Both of these vineyards are mechanically harvested - in recent years by machines fitted with a HarvestMaster™ yield monitor and differentially corrected global positioning system (dGPS). The methods used to obtain much of the data discussed in this paper have been detailed previously (Bramley, 2001b; Bramley and Williams, 2001; Bramley et al., 2000; 2002). Here, we describe just those methods used to collect data that have not been presented in previous work. Elevation data were collected using real time kinematic gps (RTKGPS). At the Clare site, readings were logged in every second row at intervals of approximately 10 m. In Coonawarra, readings were collected in every row at intervals along the row of approximately 3 m. RTKGPS is accurate to approximately ± 3 cm in the x-y-z plane whilst dGPS, as used for yield mapping and EM38 soil survey (eg Bramley et al. 2002), is typically accurate to ± 50 cm in the x-y planes only. Row spacings in both Coonawarra and Clare were 3 m. At Coonawarra, leaf area index (LAI) was measured immediately prior to harvest using a LAI-2000 plant canopy analyser (Sommer and Lang, 1994); LAI, pruning weight per vine and the number of pruned canes per vine were measured at 190 georeferenced locations within the 7.3 ha study area. Soil samples (5-15 and 30-40 cm depth) were taken from 190 georeferenced positions close to those where the vine measurements were made (Figure 2). Soil particle size analysis was conducted using standard methodology (USDA, 1996). Yield and EM38 maps were produced following the protocol of Bramley and Williams (2001) whilst maps of soil and vine properties were produced using a modification of this method as detailed by Bramley (2001b). For the purposes of this paper, and mindful of the broad similarities in patterns of spatial variation in yield and vineyard properties analysed for different years, summary maps for the three vintages were produced as follows: Data for individual years were normalised to a mean of zero and standard deviation of 1. The data were then grouped for all years and a single map surface interpolated for each attribute. In the case of LAI, pruning weight and cane number, weighted mean values for each attribute were also calculated for all years (weighted according to the number of observations available in any year), and a mean value of the coefficients of variation for each year (similarly weighted) also calculated. These were used to convert the normalised summary maps back to their original units. Digital elevation models were produced using the TOPOGRID command in ArcInfo. This is based upon the ANUDEM program (eg. Hutchinson, 1993). All interpolated surfaces were projected onto 2 m grids. Results and discussion Soil depth within the 7.3 ha Coonawarra vineyard varies substantially (244-648 mm; Figure 2; Bramley et al. 2000). Yield variation in any given year also varied substantially but the pattern of variation was broadly the same in each year (Figure 1). As Figure 3 shows, the low yielding areas correspond to areas of shallow soils which, in turn, correspond to limestone ridges. Conversely, higher yielding areas occur in the hollows, which are also the location of deeper soils. Note the strength of the topographic influence on soil depth and yield in spite of the elevation range within the vineyard being only 1.2 m (Figure 3).

Vineyard ' leakiness '
Page 33
a. b. c.
Figure 2. Terra rossa soil under Cabernet Sauvignon in a 7.3 ha Coonawarra vineyard. A
typical terra rossa profile (undifferentiated light red clay over limestone) is shown in (a), whilst selected samples from within the vineyard are shown for the 5-15 (b) and 30-40 cm depths (c) to illustrate the soil depth variability.
a. b.
Figure 3. Variation in elevation and (a) yield (1999-2001) and (b) soil depth in a 7.3 ha
Coonawarra vineyard under Cabernet Sauvignon.
Figure 4. Variation in soil depth, leaf area index prior to harvest (vintage 1999-2001) and
plant available water in a 7.3 ha Coonawarra vineyard.

Vineyard ' leakiness '
Page 34
Bramley et al. (2000) speculated that in areas of shallow soil, the volume of soil that vine roots can explore, and the associated volume of water available for plant growth places a limitation on vine growth and fruit production (ie yield). Using particle size data and the pedotransfer functions of Bristow et al. (1997), estimates of plant available water (PAW; mm m-1) were made and the results mapped (Figure 4). Here, PAW is defined as the difference in the volumetric soil moisture content at 300 and 15000 cm soil-matric suction. Multiplication of the soil depth map with the PAW map enabled estimation of the amount of plant available water in the root zone (PAWroot; mm). Note that, in the absence of any vineyard- or Coonawarra-specific functions for prediction of PAW, the functions of Bristow et al. (1997) were used in this analysis rather than those derived from temperate soils (eg da Silva and Kay, 1997), because they better matched the range of clay contents measured at the Coonawarra site. Note also, that the range of interpolated values of PAW is quite small, in contrast to the larger range in values of soil depth, with the consequence that spatial variation in PAWroot closely follows spatial variation in soil depth (Figure 4). There is also a strong similarity in the spatial structure of yield (Figures 1,3), soil depth (Figures 2-4), leaf area and PAWroot (Figure 4). This tends to confirm the suggestion of Bramley et al. (2000) that variable soil moisture availability is driving variation in the productive capacity of the Coonawarra block, notwithstanding that in some areas, roots may be able to penetrate into the limestone via cracks and fissures. Variation in yield (vintage 2001) at the Clare site, which is known to be potentially subject to the effects of soil salinity and/or sodicity, closely matched variation in bulk electrical soil conductivity as measured by EM38 survey (Figure 5a). Given the preponderance of conductivity values > 0.6 dS m-1 we infer that variation in the EM38 signal is predominantly reflecting variation in soil salinity (T.E. Evans – pers. comm.) rather than variation in soil texture (Bramley et al. 2000; Lamb and Bramley, 2001). The fact that the apparently saline areas tend to be in the low-lying parts of the landscape (Figure 5a), lends weight to this inference. Thus, we conclude that at the Clare site, vineyard productivity is constrained by the effects of spatially variable soil salinity. Figure 5a indicates a close alignment between salinity, position in the landscape and yield. This sort of variation has a dramatic impact on the vineyard manager’s ability to meet production targets when applying uniform management to inherently variable vineyards as indicated in Figure 5b. a.
b.
Figure 5. Variation in (a) yield (vintage 2001), bulk electrical soil conductivity and elevation,
and (b) ‘success’, in a 24 ha Clare Valley vineyard under mixed varieties. In (a), the yield data have been normalised to account for the differing yield potential of the varieties grown. In (b), ‘success’ is defined as the difference between the target yield and the actual yield achieved.
Vineyard ' leakiness '
Page 35
It is axiomatic that, if the soils in a vineyard impose a spatially variable constraint on the vines growing in it, such as those illustrated for the Clare and Coonawarra sites, the vineyard will operate sub-optimally when managed uniformly. This is because the use of applied resources will inevitably be inefficient; in other words, the vineyard will be leaky. One solution to this problem is offered by PV in terms of targeting management so that the inputs to the production system are better matched to the expected or desired outputs – in this case, grapes (and wine) – and the inherent variability of the vineyard. For such an approach to be successful, a clear understanding of the relationships between inputs and outputs to the winegrape production system will be essential (Bramley, 2001a). In other words, vineyard managers need some ‘rules’ by which their management decisions might be guided. They will also need an ability to assess soil property variation at a scale and resolution better aligned to the resolution at which variation in vineyard productivity can now be assessed. Bramley (2001a) has previously demonstrated the inadequacy of the current ‘industry standard’ 75 m grid in this regard. Leaving aside the problem of how soils (and plant tissues) ought to be sampled to provide information at an appropriate resolution for PV, there is a dearth of information from which viticulturists might develop ‘rules’ with respect to crop nutrition. The Australian soil test interpretation manual (Peverill et al., 1999) contains no information relevant to winegrapes with the exception of a small section on soil salinity. The companion plant test interpretation manual does provide nutritional information for winegrapes (Robinson et al., 1997), but much of the source material that is summarised pertains to a limited range of varieties, often grown in glasshouse conditions, and in many instances, not in Australia. Smart (2001) recently published ‘the golden rules of viticulture’ and identified, in particular, the need to achieve ‘balance’ in the vineyard. Thus, shoot balance was alternatively defined in terms of the ratio of leaf area to fruit weight, or the ratio of the fruit weight to pruning weight. In the former case, 10 cm2 g-1 was considered ‘balanced’, whilst with respect to the latter, a value of 5 was considered ‘ideal’ (Smart, 2001). Vine balance was defined on the basis of the pruning weight m-1 row with values < 0.5 indicating a ‘weak root system’ and values > 1 indicating a ‘strong root system’. Figure 6 presents an evaluation of ‘balance’ (Smart, 2001) for the Coonawarra site. This vineyard was planted on own roots in 1984 and thus, has had plenty of time in which to achieve ‘balance’. In terms of shoot balance however, the ratio of leaf area to fruit weight is substantially greater than 10 cm2 g-1 which suggests that the vines in this vineyard are unbalanced in that they are producing too much vegetative growth for the amount of fruit produced. In contrast, using the rule based on the ratio of fruit weight (ie yield per vine) to pruning weight, some of the vines, albeit in two small areas can be considered ‘ideal’. Note that neither of these maps (Figure 6) bear much relation, in terms of the spatial structure of the data, to those for yield, LAI, PAW or soil depth (Figures 1, 3 and 4). The same could be said of the map of pruning weight m-1 row, although it is noteworthy that much of the vineyard has vines with a ‘weak’ root system, and those areas with apparently stronger roots tend to occur in areas of deeper soils – which might be the expected result. Nevertheless, this analysis raises a question as to how useful generalised rules might be when applied to specific locations. Cook and Bramley (2000) and Bramley and Cook (2000) have made a similar point with respect to the use of soil tests as a basis for delivering fertilizer recommendations. The present analysis also suggests that if targeted management is to be either a useful counter to vineyard leakiness, or a means of achieving more efficient use of the inputs to production, then more robust rules will be required. Of necessity, these will need to consider the soil resources (eg soil depth, plant available water, fertility, etc…) available and varieties/rootstocks grown at a specific location.

Vineyard ' leakiness '
Page 36
Figure 6. Assessment of ‘balance’ (Smart, 2001) in a 7.3 ha Coonawarra vineyard under
Cabernet Sauvignon. Conclusions This work supports the view that variation in grape yield within vineyards is marked, but is temporally reasonably stable. For this reason alone, under uniform management strategies, vineyards will inevitably be leaky. Thus, until we have the necessary understanding and technical capacity to make targeted, variable rate application of inputs to the viticultural production system, vineyards will continue to leak. Our results also suggest that in order to tailor management of inputs to viticultural production systems to the inherent variability in their productive capacity, grapegrowers need more robust ‘rules’ to help guide them than those that are currently available. Research aimed at generating such rules should therefore be accorded high priority. Acknowledgments We are most grateful to Tony Proffitt, Terry Evans, John Matz and colleagues in Southcorp Wines, and to Susie Williams (CSIRO Land and Water) for their assistance in this work. The work was jointly funded by CSIRO Land and Water, Southcorp Wines, the Grape and Wine Research and Development Corporation and the Cooperative Research Centres Program.

Vineyard ' leakiness '
Page 37
References Bramley, R.G.V. 2001a. Progress in the development of precision viticulture - Variation in yield, quality and soil
properties in contrasting Australian vineyards. In: Precision tools for improving land management. (Eds L D Currie and P Loganathan). Occasional report No. 14. Fertilizer and Lime Research Centre, Massey University, Palmerston North. pp 25-43.
Bramley, R.G.V. 2001b. Variation in the yield and quality of winegrapes and the effect of soil property variation in two contrasting Australian vineyards. In ECPA 2001 - 3rd European Conference on Precision Agriculture 2 767-772 (Eds Blackmore, S. and Grenier, G.) agro Montpellier, Ecole Nationale Superieure Agronomique de Montpellier, France.
Bramley, R.G.V. and Cook, S.E. 2000. Some comments on the utility of soil test data for fertility management and resource assessment. ACLEP Newsletter 27. Australian Collaborative Land Evaluation Program, Canberra.
Bramley, R.G.V. and Proffitt, A.P.B. 1999. Managing variability in viticultural production. The Australian Grapegrower and Winemaker 427 11-16.
Bramley, R.G.V. and Proffitt, A.P.B. 2000. Managing variability in agricultural production: Opportunities for precision viticulture. Proceedings of the 5th International Symposium on Cool Climate Viticulture and Oenology (Workshop 12 – Precision Management), Melbourne, 16-20 January, 2000.
Bramley, R.G.V and Williams, S.K. 2001. A protocol for the construction of yield maps from data collected using commercially available grape yield monitors. www.crcv.com.au/CRCVProtocolBkfinal.pdf Cooperative Research Centre for Viticulture, Adelaide.
Bramley, R.G.V., Evans, T.E and Proffitt, A.P.B. 2002. Digital elevation models and EM38 survey – Useful tools in the assessment of constraints to vineyard productivity. Proceedings of the 11th Australian Wine Industry Technical Conference. Australian Wine Research Institute. In press.
Bramley, R.G.V., Proffitt, A.P.B., Corner, R.J. and Evans, T.D. 2000. Variation in grape yield and soil depth in two contrasting Australian vineyards. In Soil 2000: New Horizons for a New Century. Australian and New Zealand Second Joint Soils Conference. Volume 2: Oral papers (Eds. Adams, J.A. and Metherell, A.K.) 3-8 December 2000, Lincoln University. New Zealand Society of Soil Science. 29-30.
Bristow, K.L., Smettem, K.R.J., Ross, P.J., Ford, E.J., Roth, C. & K. Verburg. 1999. Obtaining hydraulic properties for soil water balance models: some pedotransfer functions for tropical Australia. In: Characterisation and Measurement of the Hydraulic Properties of Unsaturated Porous Media. M. Th. van Genuchten, F.J. Leij & L. Wu. (Eds.). University of California, Riverside, USA. p.1103-1120
Cook, S.E. and Bramley, R.G.V. 2000. Coping with variability in agricultural production – Implications for soil testing and fertilizer management. Communications in Soil Science and Plant Analysis 31 1531-1551.
da Silva, A.P. and Kay, B.D. 1997. Estimating the least limiting water range of soils from properties and management. Soil Science Society of America Journal 61 877-883
Hutchinson, M. F. 1993. Development of a continent-wide DEM with applications to terrain and climate analysis. In: M. F. Goodchild et al (eds), Environmental Modeling with GIS. New York, Oxford University Press: 392-399.
Lamb, D.W. and Bramley, R.G.V. 2001. Managing and monitoring spatial variability in vineyard variability. Natural Resource Management 4 25-30.
Peverill, K.I., Sparrow, L.A. and Reuter, D.J. (1999). Soil Analysis – An Interpretation Manual. CSIRO Publishing, Melbourne.
Robinson, J.B., Treeby, M. and Stephenson, R.A. 1997. Fruits, vines and nuts. In: Reuter, D.J. and Robinson, J.B. (Eds). Plant Analysis – An Interpretation Manual (2nd Ed). CSIRO Publishing, Melbourne.
Smart, R.E. 2001. Smart thinking on viticulture – Good wines comes from balanced vines. Australian and New Zealand Wine Industry Journal 16 53-54.
Sommer, K.J. and Lang, A.R.G. 1994. Comparitive analysis of two indirect methods of measuring leaf area index as applied to minimal and spur pruned grape vines. Australian Journal of Plant Physiology 21 197-206.
USDA 1996. Soil Survey Laboratory Methods Manual. Soil Survey Investigations Report No. 42. USDA, Washington DC.

Vineyard ' leakiness '
Page 38

Vineyard ' leakiness '
Page 39
Leaky Soils – Irrigation and vineyard management
Ben Robinson Scholefield Robinson Horticultural Services Pty Ltd, PO Box 145, Torrens Park SA 5062
Introduction Within the limitations of practical vineyard management it is impossible to avoid some losses of water, salt, and nutrients below the rootzone. The reasons for this are summarised below. Irrigation design considerations Even the best irrigation design can achieve only about 80% application efficiency. This is largely because achieving that extra 20% of efficiency would involve much increased costs. The grouping of irrigation units into areas of similar soils on the basis of Readily Available Water (RAW) frequently is done, but approximations are necessarily made to make irrigation management workable. The 75m by 75m grid used in soil surveys which are to become the basis for irrigation design itself is a compromise. Irrigation units have to be large enough to be manageable. The minimum size of irrigation units has to be manageable too. There is also the issue of siting scheduling aids, such as soil moisture sensors, if they are to provide a useful output to the irrigation manager. It is impossible to put in so many monitoring points that a perfect result can be achieved. A second level of inefficiency derives from the inability of the manager to perfectly match the demands of the vines. In large vineyards it is often not possible to apply water as often as strictly may be needed. In community irrigation schemes, the old, totally inflexible, roster system has in most cases been supplanted by water-on-order schemes, but in such schemes, some compromises in irrigation timing must be made. Often the irrigation manager must take a little more water than is needed to ensure that the rootzone is full, or he must take the water earlier than perhaps is needed to make provision for an impending period of hot weather. There are also self-imposed rosters. The most common of these are the use of automated irrigation systems and the use of off-peak power. Automated systems do not take account of changed weather and hence changed demand for water. To take advantage of off peak power, irrigation may be delayed, or brought forward, until off-peak power is available (eg. over a weekend, or at night). This will reduce irrigation costs, but there is increased risk of losses below the rootzone. Another irrigation practice which inevitably leads to loss of water below the rootzone and periods of waterlogged soil is frost control irrigation. The pumps must be started immediately temperature drops below a trigger point in the vineyard, no matter whether the soil is saturated or drained to field capacity. Leakiness is necessary or inevitable in many cases Leakiness below the rootzone is necessary if salt in the rootzone is to be managed properly. A leaching fraction (an excess of water over the amount of water that the plants will transpire) must be applied if there is any significant salt concentration in the irrigation water to ensure that salinity does not build up to intolerable levels.

Vineyard ' leakiness '
Page 40
The extent of leaching fraction required will vary depending on the geographic location of the vineyard. In low rainfall areas, such as inland Australia, the leaching fraction must be derived from irrigation water to keep salt moving past the roots and into the drainage system. In higher rainfall areas, such as coastal Australia, where irrigation water quality may not be as good as supplied by the inland rivers, leaching is avoided during the growing season, often to take account of limited irrigation water availability. The leaching fraction is satisfied by winter rainfall. In either case, the salt applied in the irrigation water will inevitably move into groundwater if it is not intercepted prior to that and taken to disposal basins. Leaching below the rootzone is also necessary in the case of remediation of sodic soils. In this case, calcium from gypsum displaces sodium from sodic clays and this sodium must be leached away if it is not to lead to specific ion toxicity in the crop. Leakiness is inevitable in other situations not already mentioned. Vineyards are often established using in-line dripper systems that have more than one dripper for each vine. The water and nutrients that are applied via the drippers that are not immediately adjacent to the young vine will be wasted and inevitably pass out of the rootzone. This loss is perhaps exacerbated by the fact that most managers will supply young vines with a luxury availability of both water and nutrients to ensure no check in growth occurs and to maximise the rate of establishment of those vines. Leakiness is also inevitable because rootzones are not uniform even within areas said to have a common RAW value. Parts of rows will receive more water than the rootzone can hold if a vineyard is irrigated to the requirements of the most common soil. Climatic internal relationships As noted earlier, in areas where winter rainfall is high, losses below the rootzone will occur in winter and spring, hence leakiness of the rootzone is inevitable. Losses occur as parts of vineyards which become waterlogged in winter drain out via direct percolation, via drains if they are installed or, or via down slope drainage in duplex soils (those with bleached zones above the clay). Generally, there is percolation below the rootzone even in soils which are considered to be strongly impermeable, such as the “Biscay” soils underlain by impermeable clays. As noted above, the positive benefit in this is that quite saline water can be used for irrigation if winter rainfall (hence leakiness) is relatively predictable from year to year. Nutrients There is little good information on the amount of nutrient leached below in the soil in dry land or irrigated vineyards in Australia, but we know that it is inevitable that nitrogen will be lost, as it is so soluble. It is clear that this will occur where there is heavy fertigation of young vines. Central fertigation systems which are relatively inflexible also lead to losses as excess nutrient is often applied to achieve a suitable retention of nitrogen within the rootzone. Acidification of rootzones can be a side-effect of this. A topic which has not been studied at all is the unpredictable mineralisation of organic forms of nitrogen applied as manures, composts or by turning in of cover crops. There are periods of the year when bursts of mineralisation occur as soil temperature and moisture levels change. These may coincide with periods during which the vines are not actively taking up nutrients, for example in early spring. If this is the case, losses to the groundwater or drainage may occur until the roots become active.

Vineyard ' leakiness '
Page 41
We know that phosphorus losses occur in surface particle movement from fertile irrigated land, but leakiness below the rootzone is less well-documented. In WA in the acid sands, phosphorus movement via subsurface percolation from agricultural land into estuaries is known to be a problem. Vineyards are being developed on land such as this so probably contribute to it in a minor way. The extent of this behaviour elsewhere in Australia has not studied. It has been shown in duplex soils in the South East of South Australia that phosphorus often moves through the acid sandy topsoil and becomes fixed on coffee rock, and other iron enriched layers just above the clays. Again the significance of this has not been looked at in vineyards. Trace elements and other nutrients are not generally considered to be mobile within the rootzone to any extent but there is a real shortage of data to confirm this. Legislative framework There is a seachange occurring in the administration of water rights and in water and planning law across Australia. The SA Water Resources Act and some of the recent planning legislation require from vineyard developers comprehensive irrigation and drainage management plans (IDMPs) before permission to develop a enterprise is granted. Among other things, this legislation requires that new developments provide the following:
A soil survey to identify restricting layers. Evidence that the system has been designed to an industry standard. A knowledge of the hydrology of the area and hence any potential impact on water
courses or aquifers. An assessment of the skill of the manager. A description of the monitoring programs that will be used in relation to irrigation
scheduling, movements in water tables, changes in groundwater levels etc. and a description of the way the data will be used and acted upon in future. Furthermore, the developer of projects above a certain size is required to make a
commitment to fund any remedial work if it is needed in the future. Irrigation and drainage management plans provide a framework within which individuals can do their best to manage leakiness in relation to the characteristics of the district within which the development has sited. Special conditions are often required if the development is located where it can have an impact on the water course of the Murray River or other streams or of ground waters. Summary Leakiness below the rootzone is inevitable in viticulture. In the low rainfall areas of Australia, this leakiness is necessary if salt levels in the rootzone are to be managed properly. In the wetter parts of the country, with higher winter rainfall, leakiness is inevitable because during winter and spring, rainfall will generally exceed the requirements of the vines and any cover crop which exists, and water will necessarily move through the rootzone. Leakiness is also inevitable because of the way irrigation systems are designed and the way they are managed or if soil amendment is necessary. The extent of leakiness in areas where rainfall is low has been reduced very much during the last decade or so as community irrigation systems have been upgraded and irrigation design has improved. Further improvements can be expected as a consequence of the increasing use of soil moisture monitoring equipment, better planning of developments, and more widespread use of data collected under Irrigation and Drainage Management Plans.

Vineyard ' leakiness '
Page 42

Vineyard ' leakiness '
Page 43
Barriers to the adoption of new agricultural management systems: Lessons to be learned from outside the grape and wine industry
Brianna Casey
Queensland Farmers’ Federation, PO Box 3128, South Brisbane, QLD 4101 Introduction Queensland Farmers’ Federation (QFF) is the peak rural industry organisation in Queensland, representing more than 17 000 primary producers across the State through 23 diverse member organisations. QFF is a federation of the major rural commodity organisations and value adders, working to resolve common issues within the State and beyond. QFF provides direction, leadership and representation on issues of common interest to primary producers in Queensland by:
• developing effective networks and alliances to lobby relevant bodies; • strengthening cooperation amongst producer organisations; • using effective communications to enhance understanding and appreciation of rural
industry in Queensland; and • providing a forum for member organisations to consider issues of common interest.
It is the goal of rural industry to develop profitable agricultural businesses within the capacity of the surrounding environment. The gross value of Queensland’s primary industry commodities produced is now forecast at a record $8.2 billion for 2001-02, up 4% from an expected $7.89 billion in June 2001 (QDPI, 2001). It is critical to the long-term future of agriculture, the environment and rural communities that responsible agricultural property management practices are adopted in order to preserve the wealth generation capacity of our natural resources. QFF strongly supports and advocates sustainable farming practices, and recognises the need for protection of environmental values through the sustainable use of natural resources. Approximately 87% of Queensland’s 1 727 200 square kilometres is devoted to the production of food, fibre and foliage. Ensuring the sustainable use of Queensland’s natural resources will maintain this viable industry into the future. However, natural resource management legislation is currently inundating landholders and farmers across Queensland. The last two years in particular have seen landholders across Queensland faced with legislation pertaining to vegetation management, water allocation management, water infrastructure development and overland flows; cultural heritage; coastal management; mining; land protection; waste management and biotechnology; in addition to the Commonwealth Environment Protection and Biodiversity Conservation Act 1999. The reform agenda Reform of natural resource management policy and legislation is rampant at the local, state and federal government levels. To most primary producers, natural resource management policy and legislation is a blur of rhetoric and technical and bureaucratic jargon, with little practical explanation and coordinated implementation. The gap between policy and implementation is substantial, and growing. There will be pressure from both primary producers and conservationists to clarify the mess with ‘black and white’ regulation. This is likely to be costly

Vineyard ' leakiness '
Page 44
and inefficient for both Government and rural industry. It is also likely to trigger an adversarial process of reform implementation via litigation. A process of progressive adoption of natural resource management practices through innovation leading to the adoption of best management practices is much preferred. This will achieve the dual objectives of increasing profitability and improving ustainability of primary production. QFF’s preferred approach Landholders throughout the country want to achieve environmentally sustainable production practices. However, without some adjustment to the current reform processes, this outcome is likely to prove elusive. QFF strongly supports the need for a legislative framework capable of delivering development rights and planning certainty to landholders whilst protecting important natural resources. Natural resource management reforms must be based on the following four ‘pillars’ (QFF, 1998a):
1. the need for adequate data and integrated information systems as a basis for making informed decisions;
2. a regionally planned approach; 3. a self-regulatory approach as far as possible; 4. adequate compensation where a landholder’s rights, and legitimate and reasonable
expectations have been diminished. Whilst the reform of natural resource management policy and legislation in some cases addresses one or more of the pillars, it will not be sustainable without all four pillars in place. It is clear that Government has a long way to go in order to address QFF’s four pillars, which have been sought by Queensland rural industries since the first days of natural resource management reform. Barriers to changing practices Landholders are expressing concern about the perceived erosion of freehold rights and the inequitable burden of natural resource management restrictions above and beyond their ‘general environmental duty of care’ under the Queensland Environmental Protection Act 1994 (State of Queensland, 1994). Regulation of natural resource planning and management should result in investment and planning certainty for the landholder, described in terms of rights and responsibilities and opportunities and obligations. By setting minimum standards, government can potentially provide planning certainty to landholders. However, regulation will be ineffective if weaknesses in policy are exacerbated by poor implementation of policy (Industry Commission, 1998). Consistent with the findings of the Inquiry into Ecologically Sustainable Land Management (Industry Commission, 1998), industry Codes of Practice and Best Management Practice encourage land management practices that demonstrate a commitment to preventing environmental harm. In doing so, sustainable land management practices associated with the ‘general environmental duty of care’ should have regard to the present state of the environment – not one that existed in the past, or one that may be desired by interest groups driven by particular ideologies.

Vineyard ' leakiness '
Page 45
Opportunities for the grape and wine industry The principles underpinning the development or enhancement of primary production practices in the grape and wine industry capable of demonstrating the protection of land-based and aquatic ecosystems are no different to those in other rural industries. Landholders should:
• Be informed of the minimum conditions with which to comply; • Have the capacity to implement the necessary practices to comply with those
conditions at the regional level; and • Focus on the current state of the environment.
A landholder may choose to demonstrate sustainable practices above and beyond what is required of them under their ‘general environmental duty of care’. However, this must be the choice of the landholder, not a mandated requirement unless the community, through government, is prepared to provide financial assistance where the landholder’s legitimate rights and expectations have been diminished. The preparation of industry Codes of Practice, Best Management Practice and similar initiatives are voluntary actions taken by industries wanting to take a step towards greater environmental responsibility. Several QFF member organisations are also investigating the development and implementation of Environmental Management Systems (EMS). What is an environmental code of practice ? Environmental Codes of Practice outline to primary producers how they can meet their ‘general environmental duty of care’ under the EP Act. The Minister for Environment may approve Codes of Practice under Section 548 of the Act, providing they state “ways of achieving compliance with the general environmental duty for any activity that causes or is likely to cause environmental harm” (State of Queensland, 1994). A Code of Practice is not a regulation under the EP Act; however, it does have legal standing. Whilst there is no offence in not complying with an approved Code of Practice, compliance provides a means of defence in the event of legal action being taken against a primary producer for alleged environmental harm. The QFF Environmental Code of Practice for Agriculture was approved in April 1998. The Code is applicable to all of agriculture, and recommends that primary producers take all reasonable and practicable measures to show due diligence in achieving the ‘expected environmental outcomes’ as defined in the Code (QFF, 1998b). The Code also states that particular care should be taken to prevent agricultural activities from having an adverse impact on ‘sensitive places’, such as World Heritage areas and other protected conservation areas; habitats of fish or amphibians including waterways and natural wetlands; and neighbouring or nearby enterprises. The inclusion of neighbouring or adjacent ‘sensitive places’ has resulted in an increased focus on off-site impacts of primary production. Following the release of the QFF Environmental Code of Practice for Agriculture, several QFF member organisations began developing commodity-specific Codes of Practice. Whilst some industry Codes of Practice are still in draft form, the following have been approved:

Vineyard ' leakiness '
Page 46
• CANEGROWERS Code of Practice for Sustainable Cane Growing in Queensland (CANEGROWERS, 1998)
• Queensland Fruit and Vegetable Growers Code of Practice for Sustainable Fruit and Vegetable Production in Queensland (QFVG, 1998)
• Queensland Pork Producers Inc Environmental Code of Practice for Queensland Piggeries (QDPI, 2000)
• CANEGROWERS Fish Habitat Code of Practice (CANEGROWERS, 2000) • Queensland Dairyfarmers’ Organisation Queensland Dairy Farming Environmental Code of
Practice (QDO, 2001) • Australian Prawn Farmers’ Association Environmental Code of Practice for Australian Prawn
Farmers (APFA, 2001) QFF and member organisations embarked on extensive awareness-raising campaigns following the release of the Codes of Practice in order to promote the importance of best practice environmental management amongst rural industry. QFF is encouraged by the number of inquiries made by primary producers on a weekly basis regarding Environmental Codes of Practice and opportunities to demonstrate best practice management. Best Management Practice The cotton industry has taken a slightly different approach to meeting the objectives of the EP Act. Following research by the Cotton Research and Development Corporation (CRDC), Land and Water Resources Research and Development Corporation and the Murray Darling Basin Commission, a Best Management Practice (BMP) Program was considered the best means to help cotton growers manage their operations in order to minimise the environmental risks associated with pesticide use. The BMP Program helps cotton growers identify and manage property areas that carry risk to the environment and human health through a process of self-assessment, with a commitment to continuous improvement. The Australian Cotton Industry Best Management Practices Manual (Williams and Williams, 2000) comprises Best Management Practice Booklets, Self-Assessment Worksheets, Action Plans and Risk Assessment. The BMP Manual recommends a management cycle of ‘Assess, Plan, Do, Check, Review’, similar to the Environmental Management System (EMS) Continuous Improvement Cycle (EMS Working Group, 2001). Growers rate themselves against four ranks, with Rank 1 being highest. Due to the diversity of the industry, it may not be possible for some growers to be assessed as Rank 1 for all components within the manual. Following completion of the manual, growers are audited by CRDC-approved auditors. Future directions Primary producers are facing increased pressure from government and the community to demonstrate enhanced sustainability of primary production systems. The options are many and varied. However, the most common approaches currently being considered by primary producers are industry programs aimed at self-assessing compliance with Codes of Practice; and Environmental Management Systems.

Vineyard ' leakiness '
Page 47
COMPASS QFF member organisation CANEGROWERS recently determined that a decision-making process capable of stimulating cane growers to check their compliance with the Code of Practice for Sustainable Cane Growing in Queensland was required. A benchmarking survey of Australian cane growers was undertaken in early 2000, indicating strong support for the Code (Azzopardi et al., 2001). Following the benchmarking survey, COMPASS (Combining Profitability and Sustainability in Sugar), a self-assessment process to assist growers in reviewing their farming practices, offering both financial and environmental outcomes, was developed. Similar to the cotton industry’s Best Management Practice approach, growers can rate themselves against four ranks:
1. Best Possible Practice; 2. Minimum Acceptable Practice; 3. Just Below Acceptable; and 4. Unacceptable Practice
Completion of a series of grower trials in March 2001 verified the relevance of the style and content of the workbook. The COMPASS Workbook has since been endorsed by the CANEGROWERS Council and New South Wales Cane Growers Association, with formal indications of support from the Queensland Environmental Protection Agency. Delivery of the COMPASS Workbook to Queensland and New South Wales CANEGROWERS is expected to commence in early 2002, by way of one-day workshops to small groups of growers. Growers and their families are encouraged to attend these workshops, delivered by trained facilitators with extensive in-field experience, in keeping with growers’ desire to pass on their properties to the next generation in sound environmental condition. Environmental Management Systems Several QFF member organisations are also investigating the development and implementation of Environmental Management Systems (EMS). An EMS is “a flexible management tool for minimising environmental impacts, through a clearly defined process of planning, implementation and review and through the requirements for continuous improvements of the system” (EMS Working Group, 2001). As in the BMP and COMPASS programs, EMS focuses on an ‘Assess, Plan, Do, Check, Review’ management cycle. An external audit is not essential under the EMS approach, however, independent certification and system audits may achieve market recognition and lead to improved market access. Indeed, many advocates of the EMS approach recommend ISO (International Organisation for Standardisation) accreditation. An EMS for Agriculture based on ISO 14001 must commit to continuous improvement and must meet any externally set standards, including Codes of Practice and BMP. Five principles must underpin the utilisation of EMS in agriculture in order to maximise industry participation. An EMS in agriculture should be (EMS Working Group, 2001):
1. Consistent with internationally recognised systems and be capable of independent audit; 2. Voluntary and industry led; 3. Demonstrate links between natural resource management and market objectives; 4. Simple, cost effective, user-friendly, able to be phased in at any level and provide clear
advantages to the enterprise adopting the EMS; and 5. Adaptable and provide for continuous improvement. These principles also underpin
existing industry programs, in particular BMP and COMPASS.

Vineyard ' leakiness '
Page 48
Rural industry is in the process of determining the potential utilisation of Environmental Management Systems in primary production. Some QFF member organisations have investigated the costs and benefits of an EMS approach within their commodity to a greater extent than others. Whilst it is generally accepted that an EMS may demonstrate evidence of sustainable production; compliance with regulation, and increased efficiency and profitability, there remain several key areas of concern. It is not yet clear whether adoption of an EMS will result in price premiums for product; whether EMS will be accepted by the community as ‘best practice’ environmental management; and importantly, the issue of who should pay for EMS implementation has not yet been resolved, bearing in mind the ‘clean and green’ push from consumers. A brief summary of the potential costs and benefits of utilising EMS in agriculture is shown in Table 1. The nature and extent of potential costs and benefits will vary depending on the type and scale of an enterprise, the forms of environmental management already in place, and the level or type of EMS adopted. EMS has the potential to become a useful tool for the grape and wine industry, however it must be industry-driven and backed by a supportive public and regulatory framework. Table 1. Potential costs and benefits of utilising Environmental Management
Systems in Agriculture
Potential Costs Potential Benefits Infrastructure and equipment changes Provides evidence of ‘clean and green’ production EMS education and training for the producer and/or staff
Demonstrates compliance with environmental legislation and regulations
Hire of consultants Improves the perception and image of rural industry
Certification costs (where independent certification is sought)
Promotes environmental sustainability, and promotes quality and efficiency gains
Some forms of environmental management may compromise production potentials
Encourages benchmarking, record-keeping and monitoring
Measuring, monitoring and recording tasks, where undertaken by the producer, will require time and effort to be diverted from other business activities
Improves market access (although a price premium is unlikely at this time)
The big picture Government and industry now have a common and serious problem – how to implement burgeoning reforms in an efficient and effective way. It is vitally important that these reforms address QFF’s four pillars for natural resource management: good science; a regionally planned approach; self-regulation as far as possible; and compensation where necessary (QFF, 1998a). Focussing on the third pillar, QFF is seeking a commitment to industry self regulation to demonstrate regulatory compliance by utilising industry initiatives including Codes of Practice, Best Management Practice, Environmental Management Systems and the like. It is recognised that the full development of EMS and similar industry initiatives will take time and will be best achieved in stages, with an emphasis on voluntary adoption to achieve the dual objectives of increased profitability and improved sustainability. Government must work with industry in the development of EMS and similar industry initiatives, the alternative is the stifling of innovation and an increase in litigation.

Vineyard ' leakiness '
Page 49
Rural industry growing Queensland The challenge for QFF is to assist the development of profitable agricultural businesses within the capacity of the surrounding environment, aquatic and terrestrial. Queensland’s primary producers recognise the vital importance of reducing land-based pressures, thus minimising risks of adverse impacts to aquatic and land-based ecosystems. However, it should be acknowledged that rural industries have been not only working towards, but achieving improved best management land use practices for many years. QFF members are committed to continuing this trend, investigating industry-driven alternate means of demonstrating enhanced sustainability, efficiency and profitability into the future, without the burden of increased regulation. References APFA 2001. Environmental Code of Practice for Australian Prawn Farmers. Australian Prawn Farmers’ Association,
Brisbane. Azzopardi, M., Marohasy, J. and Muller, W. 2001. The COMPASS Workbook: Assisting the Queensland and New South
Wales Sugar industry to move in the right direction. CANEGROWERS, Brisbane. CANEGROWERS 1998. Code of Practice for Sustainable Cane Growing in Queensland. CANEGROWERS, Brisbane. CANEGROWERS 2000. Fish Habitat Code of Practice, CANEGROWERS, Brisbane. Industry Commission 1998. A Full Repairing Lease – Inquiry into Ecologically Sustainable Land Management. Australian
Government Publishing Service, Canberra. EMS Working Group 2001. Proposed Framework for the Development of Environmental Management Systems in Agriculture.
Sustainable Land and Water Resources Management Committee, Canberra. QDO 2001. Queensland Dairy Farming Environmental Code of Practice. Queensland Dairyfarmers Organisation, Brisbane. QDPI 2000. Environmental Code of Practice for Queensland Piggeries. Government Printer, Brisbane QDPI 2001. Prospects for Queensland’s Primary Industries. DPI Publications, Brisbane QFF 1998a. Vegetation Management Issues Paper. Queensland Farmers Federation, Brisbane. QFF 1998b The Environmental Code of Practice for Agriculture. Queensland Farmers Federation, Brisbane. QFVG 1998. Code of Practice for Sustainable Fruit and Vegetable Production in Queensland. Queensland Fruit and Vegetable
Growers, Brisbane State of Queensland 1994. Environmental Protection Act 1994. Government Printer, Brisbane. Williams, A. and Williams, J. 2000. Australian Cotton Industry Best Management Practices Manual. Cotton Research and
Development Corporation, Narrabri.

Vineyard ' leakiness '
Page 50

Vineyard ' leakiness '
Page 51
Vineyard leakiness – ‘Industry’ reaction to and comment on workshop presentations3
Peter Hayes Southcorp Wines, PO Box 96, Magill, SA 5072
Introduction I am pleased to have accepted this invitation to address what appears, on the surface, to be a somewhat esoteric issue. However, I see the general topic of ‘leakiness’ to have a quite generic role and application to our production systems and their deployment of natural resources. The particular concerns with respect to leakiness relate to the implications, firstly, for efficiency, and secondly, for off site impacts on others and notions of ‘duty of care’ and good corporate citizenship. The reactions to, and comments on the workshop, as I summarise them below, are essentially mine, although I do believe most individuals and companies within our industry are concerned regarding potential adverse environmental effects of viticulture and allied processes. As for many, my greater concern is the uncertainty surrounding the awareness of the issues and the state of knowledge, skills, capacity and commitment from all relevant parties to address the issue. Consequently I also emphasise a concern that this issue must be integrated into a whole of catchment/whole of system type approach, and not gather a life of its own, adding confusion and further diluting resources and commitment to effective total system management. I have summarized my responses under the following headings which I consider are ‘Key Issues’, and have endeavored to illustrate some responses generated by industry which suggest possible reactions to issues such as this. Attitudinal issues Vineyards as ‘islands’ in large landscape processes - lack of awareness of contribution to
or from ‘outside’ and the sometimes relatively small size/impact of viticulture. Relative responsibilities of vineyard managers vs neighbours vs other farming systems;
community-concepts only variably understood. ‘Helplessness’ - issue size/time scale/diffuse. Tolerance of inefficiencies and non-uniformities - operators tend to address the more
immediate or obvious. Preference for convenience and so-called ‘practicality’ - large units, lesser samples without
‘tuning’ for spatial variation and appropriate technique. Preference for self directed/regulated ‘practical’ approach. Industry recognition of issues - national and regional policy and practice initiatives is
increasingly evident, and with tangible progress.
3 Editors note: Having heard the oral presentations that accompany the papers presented in these proceedings, Peter Hayes was asked to provide an ‘industry’ reaction to the material presented and to summarise the issues raised by it as a basis for subsequent workshop discussion. Peter Hayes is the National Viticulturist and Grower Relations Manager with Southcorp Wines.

Vineyard ' leakiness '
Page 52
Systemic issues Uncoordinated planning and approvals process. Poor definition and targeting of desired environmental outcomes and performance
indicators. Confusion/conflict in a plethora of approaches and ‘systems’ - EMS, BMP, Codes of
Practice, certification/non-certification, the role of ‘green labels’… Few clear models of links between farm scale and landscape/catchment scale. Under-promoted ‘Duty of Environmental Care’ and its consequences as good neighbours
and corporate citizens. Poor understanding of risk management and integrated business management - OH&S,
environment, productivity… Marketing Environment Increasingly international and competitive. Requirement for risk management in supply chain - predictability of volumes, style, price
and supply. Need for environmental credentials as a prerequisite for market access is more important
and verifiable than a ‘green label’ as a point of difference or for price premiums. Possible, but by no means certainty in environmental certification - EMS/ISO14000. Continuous improvement in quality:price equation – ‘moving goalposts’. This further
compounds uncertainty in managers who are also beset by changes in issues noted as ‘Systemic’ above.
Operational Environment Fruit quality/uniformity nexus - increasingly recognised. Water use/quality nexus - increasingly recognised. Excessive early season water application - issue of confidence/insurance for fruit set, but
often unnecessary and adds to deep drainage. Variable understanding of whole vineyard processes and environmental links from the
farm to its surrounds and the wider landscape - a problem for both researchers and for operators, and unlikely to be resolved by mono-discipline approaches.
Potential for awareness and professional development programs to better link quality and environmental outcomes via BMP’s and their demonstration.
Clear need for industry-based, regionally-adaptable environmental priorities, targets and Best Management Practices (BMP’s).
Industry Initiatives ‘Strategy 2025’ - recognition and priority assigned to environment. Industry driven support for CRCV with strong sustainability program - Program 2 and
‘Viticare’. Industry ‘Environment Policy’ and development of guidelines/codes for waste reduction
and management. ‘Ecovine’ study and report (see below) - this was a project jointly sponsored by ACF,
Land & Water Australia and Southcorp Wines. GWRDC RITA (Regional Innovation and Technology Adoption) program with high
environmental component.

Vineyard ' leakiness '
Page 53
The Ecovine Project
The project addressed the following question:
How can Australia's catchment management, regional planning and industry's voluntary environmental management systems work more effectively, in combination, to address the critical issues, like salinity, at the scale required ?
Some of the Key Findings were:
EMS are attractive to Government and rural industry because they align with the
voluntary approaches typically used in ‘regulating’ Australian agriculture. But it is too early to tell whether this approach will result in measurable environmental outcomes.
Clearly specifying the minimum standards expected of rural businesses is a key challenge for Governments.
Elegant and adaptable regulation, guidance and good governance are required to generate environmental outcomes across the diversity of agricultural businesses operating in Australia's diverse bio-regional conditions.
Some recommendations from this study include:
Recommendation 3: Due to the proliferation of organisations aiming to certify
‘sustainable agriculture’, an Australian minimum standard for accreditation of systems certifying sustainable land use is required.
The critical factors which determine environmental performance are the targets, criteria and indicators selected to guide the management system and the strength and clarity of the external signals arising from legislation, incentives, regulation or markets. It is the way in which these are linked to the EMS that will determine whether viable links to regional outcomes are achieved. Recommendation 5: EMS can contribute to meeting targets adopted in regional
plans by specifying suitable minimum performance standards. Incentives or other assistance should be used where the enterprises address high priority regional issues.
Opportunities Integrated, cooperative development of regionally adaptable quality-productivity-
environmental risk assessment, BMP and environmental outcome targets. Improved soil/landscape survey tools - for example a ground load sensing ‘rip & record’
soil strength sensor to classify a highly variable site cf. 75 m grid. Re-evaluation of the ‘golden rules’ of what constitutes the best viticultural parameters;
there are many parameters associated with high quality production which differ from these when assayed via precision viticulture techniques.
Professional development and regional group activities focused on farm-landscape issues and interactions between other land uses and capabilities.
Targeting, by industry, of support for initiatives in various federal and state environmental and business programs.
Related priority research driven by needs identified in the activities above.

Vineyard ' leakiness '
Page 54
Conclusions ‘Leakiness’ is not the issue - Non uniformity in this and non-adapted management is !!
(It’s part of the total scene). External landscape issues have potentially disastrous consequences, so involvement by
industry in whole catchment issues is extremely important. Quality imperatives are generally compatible with benign environmental useage. But
awareness, training and reward for quality are critical. Much greater consistency in land-use planning, approvals and monitoring is required,
undertaken in cooperation with regional communities. Opportunity for R&D to lead and influence environmental agenda, then to respond to
research, development and implementation needs/priorities. Informed attitudes, capacities and commitment are core.

Vineyard ' leakiness '
Page 55
Discussion session - Scoping the potential threat to the sustainability of Australian viticulture through ‘leakiness’
Dean Lanyon1, Rob Bramley1 and DeAnn Glenn2
1CSIRO Land and Water, PMB No. 2, Glen Osmond, SA 5064 2Grape and Wine Research and Development Corporation, PO Box 2592, Kent Town Business Centre, SA
5071.
Summary
Workshop participants agreed that at least some leakiness in vineyards was inevitable. Whilst in some situations, this may not necessarily be undesirable, it was agreed that insufficient monitoring, and almost no management of vineyard leakiness occurs; there is little industry understanding of the potential for leakiness to be a major threat to the sustainability of the Australian grape and wine industry. In light of the above, much of the discussion focussed on a need for research aimed at the development of improved understanding of viticultural production systems so that ‘rules’ by which growers can both manage and assess their management can be established. Key industry outcomes required included:
• Knowledge of the extent to which vineyard leakiness is contributing to regional scale land degradation compared to other forms of land use;
• A system for growers to measure leakiness, assess leakiness against a target, and report it – possibly to an authority (eg. Catchment authority) or a grower group;
• Technology developed to improve the measurement and control of leakiness; • The ability to assess what causes a leakiness problem such as inappropriate soil
management, poor pesticide use, etc…; • Knowledge of the contribution of various management practices to leakiness; and • Identification of Best Management Practices specific to location.
These outcomes could be achieved through research activities in three main areas:
• The monitoring (and thus quantification) of leakage and development of tools to assist with this;
• Development of an improved understanding of the system that is leaking, with particular focus on vineyard soils and the vineyard water balance leading to the development of Best Management Practice (BMP); and
• Linkage of vineyard leakiness to environmental degradation. Of necessity, any research activities would need to take account of regional characteristics and, more specifically, the resources available to individual growers in terms of soil, water (quantity and quality), climate, etc…

Vineyard ' leakiness '
Page 56
Introduction The purpose of this paper is to provide a summary of the discussions which occurred during the second day of the workshop. Having heard the presentations made on day 1, participants were asked to assist in scoping the leakiness issue, with particular reference to the following:
• Key issues and current status What are the key issues driving leakiness ? What is the industry doing now to address the problem ?
• Knowledge gaps and outcomes required from research
What are the outcomes required by industry ? Is there any critical basic information lacking ? What research is required to achieve these outcomes?
• Prioritisation of research and identification of adoption pathways
Prioritise research areas How should the research be structured (regionally, nationally, etc) and
should it be funded by the wine industry in isolation ? What would help to facilitate adoption ? (Codes of practice, etc ?)
The discussion was premised on the idea that the grape and wine industry, in its endeavour to hold and expand its global market share, is concerned that their management practices are being increasingly questioned in terms of their sustainability, particularly with respect to issues such as salinisation. For the purposes of the discussion, ‘leakiness’ was treated as an all-encompassing term that not only includes water movement but also includes the transport of salt, pesticides, fungicides and nutrients out of the root zone. It is important to stress therefore that leakiness cannot be considered purely as a water balance problem but must be integrated with other management practices and their timeliness. Vineyard leakiness, and its potential impact was therefore considered to be an issue requiring focus at a range of scales – local, regional and catchment in addition to small vineyard blocks. It was nevertheless accepted that implementation of measures to mitigate against unwanted leakiness would most likely be implemented at the scale of vineyard blocks or sub-blocks. What are the key issues driving leakiness ? Table 1 summarises the key issues impacting on leakiness in vineyards that were highlighted during discussion. It was recognised during the discussion, and further to Richard Stirzakers’ presentation, that vineyards are ‘islands in a bigger landscape’. Accordingly, the benefits of managing leakiness within vineyards may be much greater with respect to the vineyards themselves and the production systems operating in them than to the wider landscape. The corollary of this is that relative to other rural land uses, the contribution of the grape and wine industry to overall regional-scale land degradation as a consequence of leakiness is probably small (although it needs quantifying). Perceptions in our major markets may therefore drive the extent and urgency with which the issue is addressed.

Vineyard ' leakiness '
Page 57
Table 1. Summary of key issues impacting on leakiness and their significance
Issue Significance Winter rainfall Amount of winter rainfall; could promote excessive leaching and
runoff, yet most studies only consider within-growing season rainfall / irrigation
Summer rainfall Intensity and amount of summer rainfall; could cause runoff and excessive leaching
Groundwater The proximity of the groundwater to the root zone will impact on waterlogging and the likelihood of leached salts, nutrients and pesticides causing contamination of the groundwater and/or being mobilised to streams
Surface water Rivers such as the Murray are both sources and sinks for vineyard water and also serve important functions as a drinking water source and with respect to ecosystem services.
Irrigation The amount, scheduling and type of irrigation is critical to the management of leakiness.
Nutrients Leakiness amounts to inefficient use of nutrients and could lead to contamination of ground and surface waters
Pesticides As per nutrients Soil buffering capacity
Different soils have differing capacities to mitigate against leakiness; They will also vary in the degree of water leakage.
Soil degradation Sustainability issue. eg. acidification, salinisation, etc... Matching salt loads: excessive leaching can cause salt mobilisation to the groundwater, not enough can cause soil degradation. Insufficient groundcover may also lead to soil loss in high rainfall environments.
Wastewater reuse Quality of wastewater and its impact on soil, ground and surface waters
Variability Affects the growers ability to manage leakiness Mulch, composts and cover crops
Nutrient loading / inefficient nutrient use; the potential for the use of legume cover crops or nutrient rich mulches to contribute to N loss to groundwater is not known.
What is the industry doing to address the problem ? Available evidence suggests that the grape and wine industry is doing very little with respect to monitoring and controlling leakiness. The papers presented on Day 1 of the workshop strongly support the view that vineyards are leaky – whether through direct or indirect evidence. It is less clear whether such leakiness from vineyards results in environmental damage. The reason for this view has more to do with the lack of adequate information to assess the impact and magnitude of leakiness than leakiness per se. On a smaller scale, some growers are actively using soil moisture measurement devices in an attempt to better understand and control their irrigation and soil water extraction patterns, which in turn will reduce leakiness. Furthermore, new vineyard developments in irrigated areas are required to have appropriate soil surveys and irrigation designs completed before water can be used. However, little is done in the way of follow-up monitoring or auditing of these new vineyards to ensure the original development plan is ‘successful’ in reducing leakiness.

Vineyard ' leakiness '
Page 58
Knowledge gaps and outcomes required by industry In light of the above, there is a clear and general need for research activities geared towards decision making and risk assessment tools for the grape and wine industry. Mindful of the limited industry participation at the workshop, outcomes required by industry were summarised as:
1. Knowledge of the extent to which vineyard leakiness is contributing to regional scale land degradation compared to other forms of land use;
2. A system for growers to measure leakiness, assess leakiness against a target, and report it – possibly to an authority (eg. Catchment authority) or a grower group;
3. Technology developed to improve the measurement and control of leakiness; 4. The ability to assess what causes a leakiness problem such as inappropriate soil
management, poor pesticide use, etc…; 5. Knowledge of the contribution of various management practices to leakiness; and 6. Identification of Best Management Practices specific to location.
In an effort to identify where potential problems existed and what data was currently available to assist in addressing them, workshop participants constructed a regionally-based matrix (Table 2). Table 2. Summary matrix of regional leakinessA.
Issue Region Groundwater Rivers Salt Nutrients Pesticides Soil
Degradation Hunter I I I I MIA/Irrig Vic I, D2 I, D2 I, D2 I I, D2 I Sunraysia I, D I, D I I, D1 I I Riverland I, D2 I, D I, D I, D1 I, D1 I Padthaway I2,D I, D I I, D1 I Barossa I I I I I Clare Valley I I I I Coonawarra I2, D I I, D1 I McLaren V. I, D I, D I I, D I I, D1 Other Vic I2 I2 I2, D2 I3 I3 I3 SW WA I3, D2 I3, D2 I2, D2 I2, D1 I2, D1 I1, D1
Tasmania I I I AHere, I denotes that leakiness is of concern with respect to the issue identified with the suffixes 1, 2 and 3 denoting the extent of that concern. Thus, I1 indicates that leakiness is of at least some concern, whilst I3 indicates that the issue is a serious problem requiring attention as a matter of high priority; I2 is intermediate between these. D indicates that there are some data already available that may be of use in further researching the problem with the suffixes 1, 2 and 3 indicating the extent to which additional data are required. Thus, D3 indicates that sufficient data are already available to enable the problem to be addressed right now, D2 indicates that we have some data but this needs supplementing before recommendations as to remedial management can be made, and D1 indicates that only limited data are available. The lack of an I or D label indicates that to the knowledge of workshop participants, the issue is either of no concern or that there are no data available to assist in addressing it, and the absence of a suffix indicates that further investigation of the issue and availability of data sources is required before a rating can be given.

Vineyard ' leakiness '
Page 59
What research is required ? Activities required to meet the outcomes expected by the industry can be broken into three main areas:
1. The monitoring of leakage and development of tools to assist with this; 2. Development of an improved understanding of the system that is leaking; and 3. Linkage of vineyard leakiness to environmental degradation and offsite impacts.
Monitoring From Table 2 it is clear that there is a lack of data available to quantify leakiness. The lack of available data may be due either to a lack of monitoring activities and/or a lack of adequate monitoring tools to assess leakiness. It was apparent from discussion that the industry has insufficient current awareness of leakiness as an issue to expect monitoring programs to be established without research support. Thus, in terms of research required, there is a need for tools for growers that can assess leakiness with respect to:
1. Drainage and runoff; and 2. Salt, pesticide and nutrient movement.
For instance, the ‘drainage meter’ (see Appendix 1) is being used in the grains industry to monitor its contribution to groundwater salinity in dryland agriculture. This instrument is also being used to educate and demonstrate the occurrence of leakiness and the effectiveness of different systems that the growers implement. Such an instrument could be used in dryland viticulture. Whether it is suitable for irrigated viticulture warrants investigation. However, four key points emerge from experiences with measuring drainage in vegetables (Stirzaker) and vineyards (Christen and Hutchinson):
1. Drip irrigation leaks (in other words, it is not a panacea with respect to the leakiness problem);
2. Too little water is used in micro irrigation; 3. Nutrient leakage predominantly occurs at the start of irrigation/season; and 4. Growers characteristically ignore the sigmoidal growth pattern of plants when adjusting
their irrigation amounts (too much at the start, too little in the middle and too much at the end).
Research and extension aimed at ensuring that these points are understood, and which provides a basis (ie guidelines) for modified practice would be valuable. It was felt that through the promotion of leakiness monitoring tools by growers, growers would become aware of the likelihood of leakiness in relation to their management practice. Should this use be accompanied by a regional reporting to facilitate data collection and information transfer between growers, a useful data resource would accumulate. The opportunity also exists to make use of the many soil moisture sensors installed by consultants and the 5000 water quality points throughout SE SA. Clearly this would require coordination. The use of demonstration sites for intensive monitoring of leakiness under different management systems within each region was also seen to be of value.

Vineyard ' leakiness '
Page 60
Better understanding of the leaking system What follows is a summary of the issues highlighted by workshop participants that impact on the measurement and management of leakiness. 1. Improved quantification of leakiness
Much of the discussion centred around the lack of basic, good quality information relating to the vineyard water balance and an ability, given current knowledge, to answer the following questions:
• What are the balances between rainfall, irrigation, transpiration (vine, other), evaporation, drainage, runoff ?
• How do these vary between and within regions and at the vineyard block scale ? • What is the interaction between winter drainage/leaching and inter-row cropping ? • What is the minimum leaching fraction required in areas subject to soil salinity and
how does soil variability and weather influence it ? • What is transported in the subsurface drains (eg nutrients and pesticides) ? • What is transported offsite and what remains in the vineyard ?
2. Improved understanding of soil function
Integral to the water balance issue above, is understanding of the role of the soil. It is apparent from both Table 2, and a cursory inspection of the literature, that the Australian grape and wine industry has a poor understanding of the soil resources on which it depends (Bramley and Lanyon) – especially at a scale of spatial resolution that is commensurate with the scale at which vineyards are managed. There is much discussion of ‘soil types’, but little discussion of soil properties. The significance of this statement is enlarged by the fact that the workshop acknowledged that there is no single management system that can be applied uniformly to reduce leakiness, not only from an industry perspective but also from a regional and vineyard perspective. There is thus a real lack of information with respect to the effectiveness of various management practices (eg. use of cover crops, different types of irrigation, etc…) in reducing leakiness. Nevertheless, the recent development of an Australian viticultural soil key (Fitzpatrick et al., 2002 – Final Report on GWRDC Project CRS 95/1) allows growers to classify their soils against broad soil categories for which particular management issues are highlighted. Whilst this is a forward step towards the identification of soil-based management zones, insufficient data are available to develop management guidelines for each soil category.
Key questions to be addressed include:
• What is the buffering capacity of the soil for the various inputs to the viticultural
production system ? • Do we need deeper roots to reduce leakiness ? • How do root distributions vary with respect to landscape and management practices
? • When should an inter-row crop be used ? • Are soil properties (including microbial ecology) changing under viticultural practices
and are any changes detrimental ?

Vineyard ' leakiness '
Page 61
• Are soil amendments, as used in vineyards, successful ? How does their success vary between soils of differing properties ?
• Do we need a soil properties inventory? • What are the nutritional requirements of vines and to what extent do these vary
according to variety, rootstock, irrigation practice, soil properties ?
3. Improved understanding of field variability in time and space
All of the above issues are affected by consideration of the scale at which leakiness and the factors affecting it are assessed in both time and space:
• What are the management practices that currently predominate in each region and how might these be assessed ?
• How is the impact of these practices best assessed in diverse landscapes ? • What is the best way to sample a vineyard soil and the vines growing in it ?
A high priority should be attached to research aimed at improved holistic understanding of the viticultural production system and the development of ‘rules’ by which growers can both manage, and also assess their management. As a part of this, the development of simple tools such as the pesticide impact rating index (PIRI) should be encouraged. Clearly, if tools such as BMP (Casey) are to be introduced by the industry, some measures of best management will be critical (Hayes). Linking leakiness to environmental degradation The monitoring of leakiness alone is not adequate to make a risk assessment to environmental degradation. A risk assessment should also consider the fate of the leaked material and buffering capacity of the receiving area. The buffering capacity of the area can extend from the vineyard to the region or catchment or even further downstream. Addressing the specific nature of any offsite impact and separating any effects attributable to viticulture from those attributable to other land uses is a critical part of this problem. Assessment of the impact of vineyard leakiness within defined areas will help set limits or targets to drainage, nutrient use, irrigation water quality, and pesticide schedules etc... To do this, however, the following points will need to be addressed:
1. The regional water balance will need to be defined and consideration given to the interactions between viticulture and other industries. A desk-top study could satisfy this need.
2. An understanding of spatial and temporal variability will be critical at both the regional
and vineyard scale. Understanding of regional variability is currently anecdotal at best.
3. The use of models and other (research) tools to aid in the establishment of limits or targets for vineyards and regions. These could include:
• Water balance models such as SWIM • Groundwater models • VineLOGIC could be used to estimate the possible leakiness of vineyards under
different management practices and as an education/extension tool

Vineyard ' leakiness '
Page 62
• Remote sensing of vine vigour and/or mobile transpiration measurements integrated with GIS would help with acquisition of crop performance data at a range of scales and linked with hydrological models to better estimate crop water use.
How should the research be structured ? There was only limited discussion of the issue of how the research should be structured in terms of whether leakiness was a wine industry-specific or more general problem. This was no doubt due to the idea of vineyards being ‘islands in a bigger landscape’. Most of the discussion focussed on more operational matters:
1. The participation of growers in work aimed at the monitoring of leakiness was considered important for increasing the awareness of leakiness as an issue that the industry faces.
2. It was also considered important that in developing the basis for implementation of BMP,
and a better understanding the dynamics of the production system, the effect of different management practices on wine quality should be included in research agendas.
3. There was support for the idea that at least some of any new work aimed at addressing
leakiness should take advantage of existing experimental sites, such as the key regional sites being used by CRCV:
• MIA – McWilliams (interaction between nitrogen and irrigation; includes
consideration of final wines) • Riverland (Irrigation volume focus) • Sunraysia – Wingara (irrigation method and canopy manipulation; includes
consideration of final wines) • Tatura – Mitchelton (irrigation and soil/rooting volume) • Barossa (impact of soil salinity)
It was acknowledged that some of the identified research could benefit industries outside of viticulture. Opportunities for interaction with HAL and MDBC should be sought by GWRDC. A related issue is the fact that Australia only contributes around 20% of worldwide viticultural research and that access to world experiences and the overseas knowledge base would be an advantage to the Australian wine industry, such as:
• Germany – nitrogen modelling group; • New Zealand – water balance and measurement techniques (Clothier) • France, Montpellier – pesticide runoff (Voltz) • South Africa, Stellenbosch – soil management and drainage (van Huysteen)
There was some discussion on the possible need for the grape and wine industry to be able to “defend” itself in the face of end of valley salinity targets and other catchment management targets. It was considered that this may be best done by being proactive in “fixing” the viticultural house. Thus, if environmental degradation in a wine growing area were to become an issue, even if the wine industry were not the main culprit, they stand to be tarred by the same brush. It would therefore be to the advantage of the grape and wine industry to take a leadership role in

Vineyard ' leakiness '
Page 63
catchment management generally, which will require an understanding of the other industries in the region and interactions between them. GWRDC and the wine industry may wish to consider supporting "generic" research into catchment sustainabaility issues, rather than focussing entirely on vineyards. What would aid adoption? The adoption of management practices which reduce leakiness depends either on industry acknowledgement that there is a problem, or that through adopting new practices, a benefit will accrue. There was support for the idea that self-assessment by industry should occur first through the use of monitoring tools as a precursor to the development of BMP’s. Experiences from elsewhere (eg Queensland) suggest that such an approach ensures achievement of three desirable outcomes:
• Identification/acceptance of the problem; • A willingness to change in response to it; and • An industry led response.
However, in developing BMP’s, a number of issues need to be considered including the following:
• The ability of the manager/grower to change; • The BMP must be achievable, easily understandable, and continually improved; • Performance must be assessed against targets or industry standards, for example for
salt, water, nitrates, pesticides and soil condition; Against a background of inherent vineyard variability, measures of compliance will need to be carefully thought through Adoption of BMP’s and EMS’s It is important that BMP’s and EMS are subject to continual development and therefore closely linked to relevant research. It was also recognised that the industry would need to demonstrate the compliance of growers to ‘best practice’ and identify whether the degree of compliance would be based on the number of compliant growers or the tonnage of fruit they produced. Thus, the development of benchmarking tools was identified as being of high priority. These will also be required for the purposes of reporting against management targets, for irrigation licensing, for example.

Vineyard ' leakiness '
Page 64
Appendix 1
The Drainage Meter
Paul Hutchinson CSIRO Land & Water, Griffith, NSW 2680.
Summary Most farmers are generally aware that replacement of deep rooted plants with shallow rooted annual crops and the over-irrigation of crops has led to increased recharge (drainage) past the root zone and into the groundwater, causing high water tables and salinisation of land and waterways (Figure 1). However, farmers have not had the opportunity to manage the deep drainage from their farms because the monitoring tools have been too impractical and expensive. Researchers have also been disadvantaged by the high cost and complexity of current technologies to measure leakage. Figure 1. Prior to land clearing (top) the saline groundwater was low, but since the
introduction of shallow rooted plants (bottom), deep drainage has increased causing water tables to rise and salt outbreaks to occur.
This is about to change as growers and researchers will soon be able to monitor the moisture that escapes past the root zone of their crops using a simple and inexpensive Drainage Meter

Vineyard ' leakiness '
Page 65
developed by CSIRO with support from the Grains Research and Development Corporation (GRDC). The information gained will be valuable on two fronts – it will show when a farming system is “leaky” but may also be used as a tool to make tactical farming decisions in order to reduce deep drainage, such as when to plant deeper rooted plants to dry out sub-soils or when irrigation methods and the irrigation scheduling needs changing. The Drainage Meter In the past the measurement of deep drainage rates beneath the root-zone of a cropping system has been a notoriously difficult measurement to make because the flow velocities of interest are exceedingly small. For example, prior to the land clearing in the Mallee region of South Australia 50 to 100 years ago, the recharge was approximately 0.1 mm yr-1. Since then deep drainage rates have increased dramatically causing watertables to rise and river salinity to increase, but the mean rate under dryland agriculture is still only 10 mm yr-1 – a very slow flow rate and a huge technical challenge for any measurement technology. Technologies that have been used to measure deep drainage include weighing large cores of soil (weighing lysimeter), extracting water from beneath the crop in large buried cylinders (drainage lysimeter), hydraulic resistance fluxmeters, thermal field fluxmeters and arrays of water filled tensiometers, but no techniques has proved to be practical for farmers till now. The new Drainage Meter uses the discovery of the famous engineer Henry Darcy (1856) to estimate drainage rates, namely use of the law that carries his name:
q = K ∆H/L [Darcy’s Law] where K is the hydraulic conductivity of the soil and ∆H/L is the head drop per unit distance in the direction of the flow (the hydraulic gradient). In the Drainage Meter this law is implemented by direct measurement of the vertical component of the soil water potential gradient ∂ψ/∂z, the soil water potential ψ and the hydraulic conductivity of the soil beneath the crop. Deep drainage is then given by a derivation of Darcy’s Law,
q = K(ψ) (1 - ∂ψ/∂z). The technical breakthrough in the Drainage Meter was the development of a new instrument called a tube tensiometer to make routine measures of ψ and ∂ψ/∂z. This new device overcomes the primary disadvantages of existing tensiometers, as it does not require maintenance when the sensing tip dries beyond its air entry pressure and it is capable of being completely buried beyond the cultivation zone so that it does not foul tillage and harvesting equipment. The tip is also larger than in other tensiometers so that it can improve the spatial averaging in soils that have a highly developed structure and well-developed macropores, such as root and worm holes. Figure 2 shows a schematic of the tube tensiometer. The instrument consists of a long open-topped tube (1) filled with a material having a high hydraulic conductivity (diatomaceous earth). At the base of the tube is a cavity (6) that is separated from the diatomaceous earth by a fine mesh (5). This cavity is connected to the surface via a drain tube (3) and vent tube (2). At the base of the cavity is a pressure sensor (7) that is connected to the surface via a cable (4). The meter is installed by auguring a hole below the root system, lowering the instrument to the bottom, packing bentonite (8) around the lower part of the tube, diatomaceous earth on top of the instrument to form a tip (9), further layers of bentonite (10) and finally the top-soil (11).

Vineyard ' leakiness '
Page 66
Figure 2. The tube tensiometer (left) installed in a hole in the ground (right). As moisture moves through the soil past the tip, it is drawn by capillary action through the diatomaceous earth into the tube. The moisture fills the cavity at the base of the tube but cannot escape so, provided the soil is close to saturation, a water table climbs up the tube through the diatomaceous earth. Changes in the water table height within the tube are measured accurately with the pressure transducer. The soil water potential is equal to the depth of the water in the tube minus the length of the tube when in the range 0<ψ<-10 kPa. A pair of tube tensiometers are installed at different depths in the subsoil, eg. 20-50 cm apart and the soil moisture gradient ∂ψ/∂z is measured. Impacts The Drainage Meter has been deployed at locations across Australia from wheat fields in the high rainfall south-west slopes of New South Wales to native rainforest in the far north of Queensland. At Harden, NSW a trial was installed to test the theory that conservation farming in a high rainfall zone - a method of retaining stubble from the previous crop and direct drilling the new season seed into the soil to reduce run-off and soil erosion- was causing a significant increase in deep drainage when compared with the conventional tillage method of burning the stubble and cultivating before seeding (Figure 3).

Vineyard ' leakiness '
Page 67
Figure 3. Paul Hutchinson (right) talking to farmer Pat O’Connor and researchers John
Kirkegaard and student (left) about the Drainage Meter at the trial site at Harden, NSW.
The data from the Drainage Meter show the theory to be correct – deep drainage more than doubled when conservation farming techniques were used. The results were shown to local growers including the Harden Murrumburrah Landcare Group and it motivated these growers to begin their own investigations. The LandCare group obtained funding from the National Heritage Trust and with support from CSIRO and prospective licensee Measurement Engineering Australia Pty Ltd, Drainage Meters will be installed on five farms. The objective of the project is to develop and assess new farming systems that are both economic, less leaky and cause less salinisation. The Drainage Meter will play a vital role in this great challenge. Future plans The future for the Drainage Meter is bright. Adelaide based company Measurement Engineering aims to commercialise the Drainage Meter with support from the Grains Research Development Corporation, CSIRO and AusIndustry. They will integrate this technology with leading edge data collection and publication technologies so that collection and distribution of this important data is made easy, widespread and inexpensive.