· Web viewThe 2017 Arkansas Labor Market and Economic Report is produced by the...
173
2017 Arkansas Labor Market and Economic Report State and Local Workforce Development Areas
Transcript of · Web viewThe 2017 Arkansas Labor Market and Economic Report is produced by the...
2017Arkansas Labor Market and Economic ReportState and Local Workforce Development Areas

2017 Arkansas Labor Market and Economic Report
Asa Hutchinson, Governor State of Arkansas
Daryl Bassett, Director Department of Workforce Services
Prepared By:Department of Workforce Services
Labor Market InformationP.O. Box 2981
Little Rock, Arkansas 72203Telephone: (501) 682-3121www.discover.arkansas.gov
“Equal Opportunity Employer/Program”“Auxiliary aids and services are available upon request to individuals with disabilities”
Voice: 1-800-285-1121TDD: 1-800-285-1131
Released: October 2017
Table of Contents 1Executive Summary 2State of Arkansas 3
Population 2012-2016 3Quarterly Workforce Indicators 3Employment/Labor Force/Unemployment 2012-2016 42017 Monthly Unemployment Rates 4Cost of Living Index 5Median Household Income 2011-2015 6Per Capita Personal Income 2011-2015 6Employment Status by Race 2016 7Education 8State of Arkansas In Demand Occupations 9Wages of the 10 Largest Occupations 10Occupations Paying the Most 11Wage Estimates by Employer Size 12Number of Employees by Hourly Wage Rate 12Mean Wages of States Surrounding Arkansas 13Employment and Wages for Select STEM Occupations 14Industry 15
Top 5 Industry Supersectors 15Top 10 Growth 15Top 10 Fastest Growth 16Top 10 Decline 16Top 10 Fastest Decline 16
Occupations 17Top 5 Major Occupational Groups 17Top 10 Growth 17Top 10 Fastest Growth 18Top 10 Decline 18Top 10 Fastest Decline 18
Similar tables and graphs can be found under each Local Workforce Development AreaCentral Arkansas LWDA 19City of Little Rock LWDA 28Eastern Arkansas LWDA 37North Central Arkansas LWDA 46Northeast Arkansas LWDA 55Northwest Arkansas LWDA 64Southeast Arkansas LWDA 73Southwest Arkansas LWDA 82West Central Arkansas LWDA 91Western Arkansas LWDA 100
1Arkansas Economic Report 2017

Arkansas Economic Report 2017 2
Executive SummaryThe 2017 Arkansas Labor Market and Economic Report is produced by the Occupational/Career Information unit of the Labor Market Information Section to provide relevant information about the economy and workforce in Arkansas and the 10 Workforce Development Areas. The primary focus of this report includes the years 2012 to 2016, with some information covering shorter periods due to accessibility of data. Projection information for industry and occupational trends covers the years 2016 to 2018.
Arkansas increased in population to almost 3 million residents in 2016, increasing by 10,395 from 2015; and adding a total of 37,563 new residents from 2012 to 2016. Of Arkansas’s 10 Local Workforce Development Areas (LWDAs), Northwest Arkansas continues to see the largest increase in population, adding 11,821 in 2016. The Eastern, Southeast, and Southwest Arkansas LWDAs continued to see decreasing populations in 2016.
Between 2015 and 2016 the state’s labor force increased by 10,112 and employment increased by 23,820. Labor Force and employment were mixed across the LWDAs. The State’s unemployment rate dropped significantly to 4.0 percent in 2016 or by three and six-tenth percentage points since 2012. The unemployment rate continued to decline in 2017, ending the month of July at 3.4 percent. The unemployment rate decreased across all LWDAs in 2016 and through July 2017. The Central, City of Little Rock, and Northwest Arkansas LWDAs unemployment rates all fell at or below state levels through July 2017.
Short-term employment projections for 2016 to 2018 continue to see an increase in the Arkansas job market with 41,750 jobs, equivalent to a 3.06 percent rise in employment. Goods-Producing Industries are estimated to see a net gain of 4,466 jobs, while the Services-Providing Industries are forecast to increase employment by 33,437. Arkansas’s self-employed ranks are estimated to experience a net gain of 3,847, an increase of 2.86 percent.
Jobs requiring no formal educational credential are estimated to add more jobs than any other education level with 13,670 jobs between 2016 and 2018. Occupations requiring a Bachelor’s degree are expected to grow by 8,417.
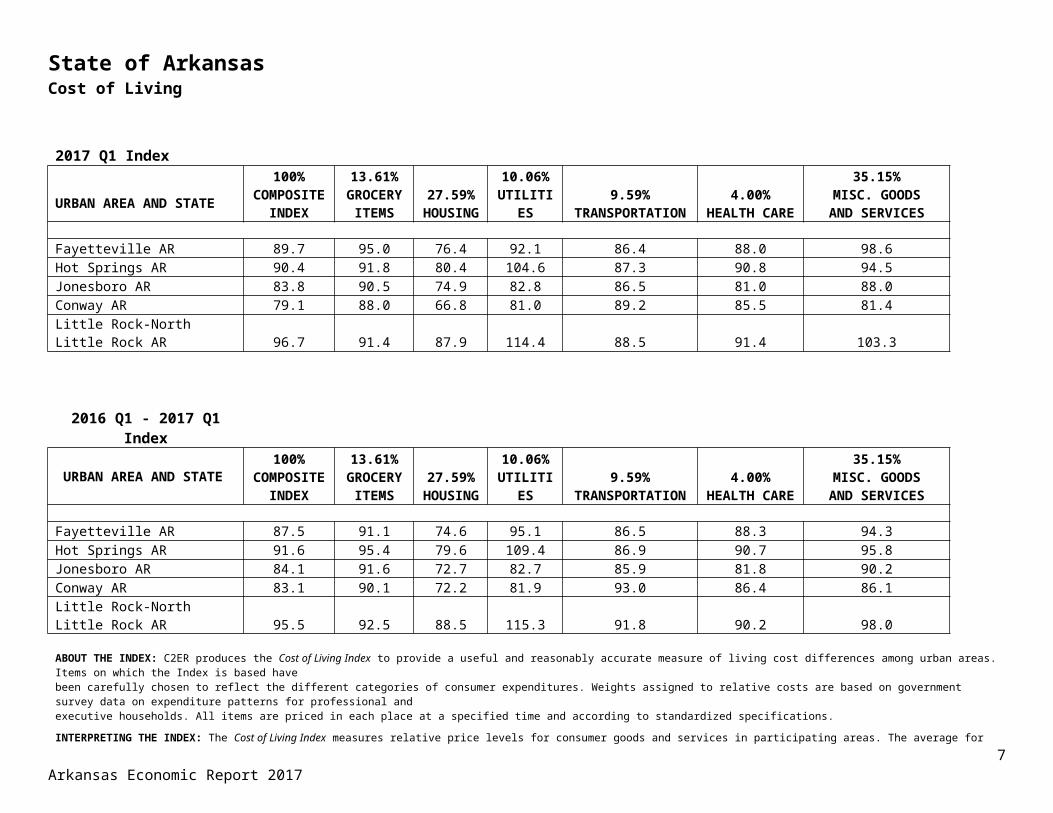
Arkansas’ per capita personal income increased over the 2011-2015 period to $38,257; however, the state’s per capita personal income in 2015 remained below the United States per capita personal income of $48,190. During the first quarter of 2017, the cost of living composite index in Arkansas’ urban areas was below the national average for all urban areas in the index.
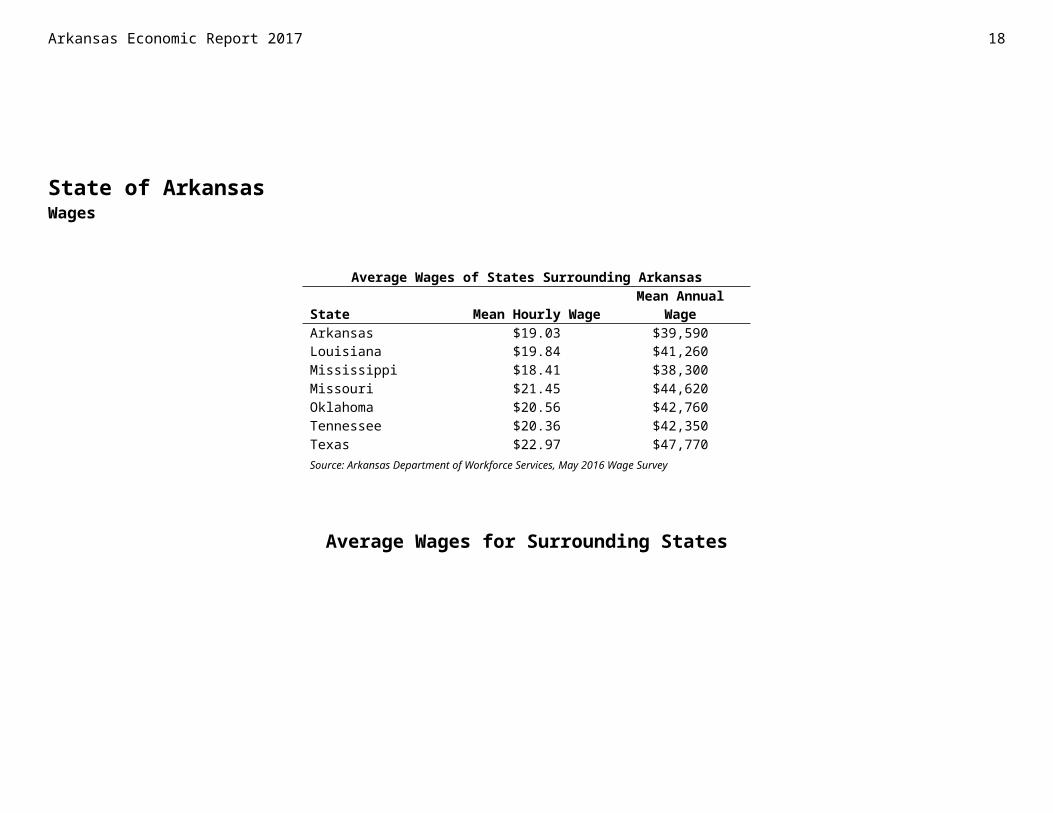
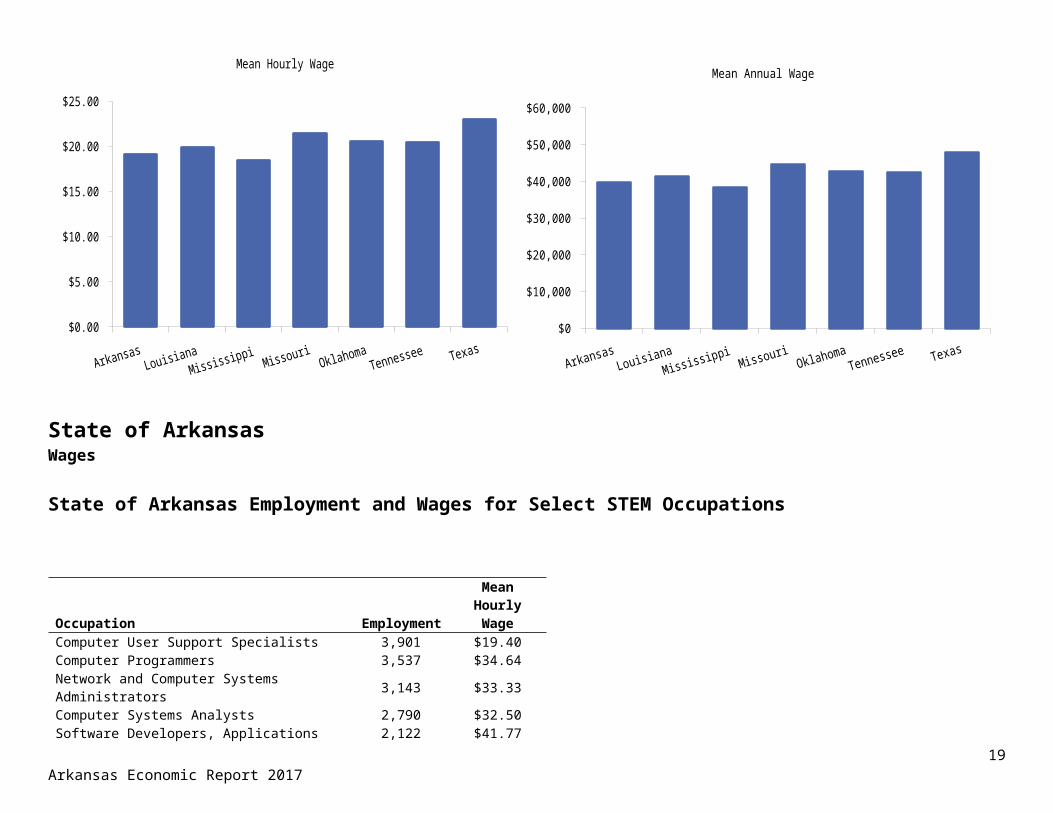
Almost 885,000 Arkansas workers earned at least $10 or more an hour in 2016, with the mean annual wage for all employer sizes estimated at $39,590 in 2016. Of the six states surrounding Arkansas, only Mississippi had a lower overall average hourly and average annual wage for all occupations. Of the surrounding states, Texas had the highest average annual wage that was about 21 percent higher than the average annual wage for Arkansas.
Sources used for this report include the United States Department of Labor, Bureau of Labor Statistics (BLS), United States Department of Commerce, Bureau of the Census, Arkansas Department of Workforce Services, Employment Assistance Division, Labor Market Information Section, United States Department of Commerce, Bureau of Economic Analysis (BEA), the Local Employment Dynamics Program (a partnership between the State of Arkansas and the United States Census Bureau), Population Reference Bureau and The Council for Community and Economic Research (C2ER).
This workforce product was funded by a grant awarded by the U.S. Department of Labor's Employment and Training Administration. The product was created by the recipient and does not necessarily reflect the official position of the U.S. Department of Labor. The Department of Labor makes no guarantees, warranties, or assurances of any kind, express or implied, with respect to such information, including any
information on linked sites and including, but not limited to, accuracy of the information or its completeness, timeliness, usefulness, adequacy, continued availability, or ownership. This product is copyrighted by the institution that created it. Internal use by an organization and/or personal use by an individual for non-commercial purposes is permissible. All other uses require the prior authorization of the copyright owner.
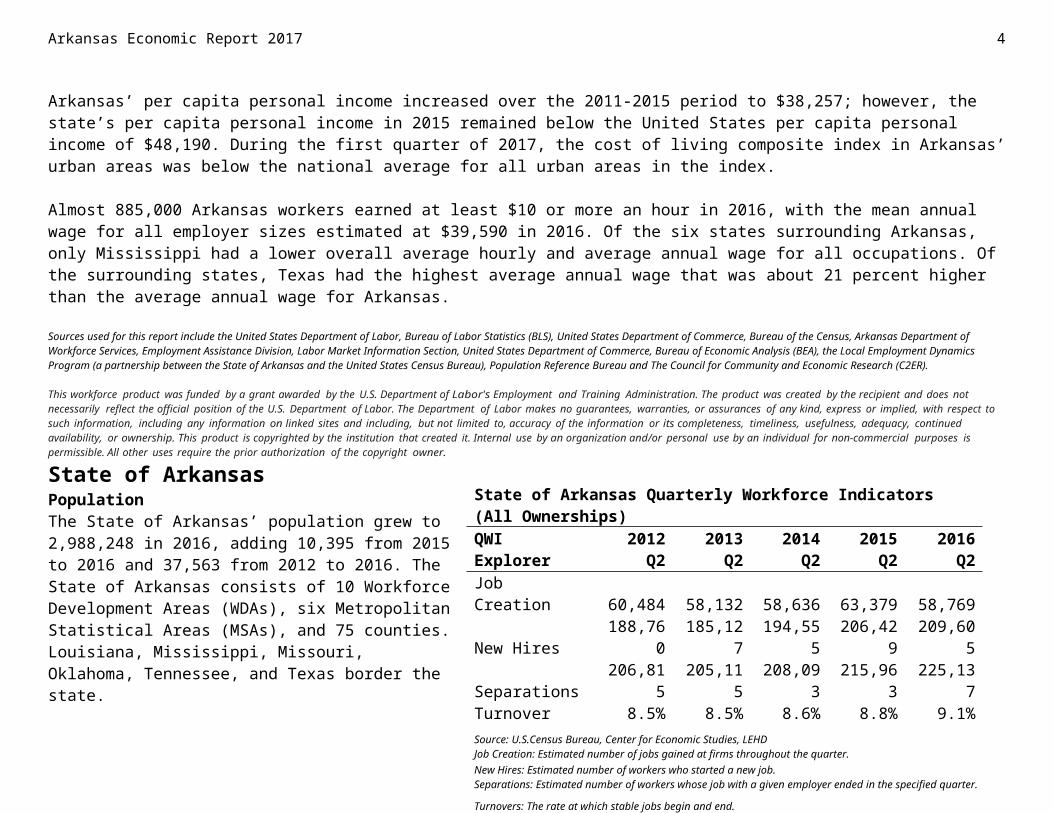
State of Arkansas PopulationThe State of Arkansas’ population grew to 2,988,248 in 2016, adding 10,395 from 2015 to 2016 and 37,563 from 2012 to 2016. The State of Arkansas consists of 10 Workforce Development Areas (WDAs), six Metropolitan Statistical Areas (MSAs), and 75 counties. Louisiana, Mississippi, Missouri, Oklahoma, Tennessee, and Texas border the state.
2012 2013 2014 2015 2016 2,930,000
2,940,000
2,950,000
2,960,000
2,970,000
2,980,000
2,990,000
3,000,000
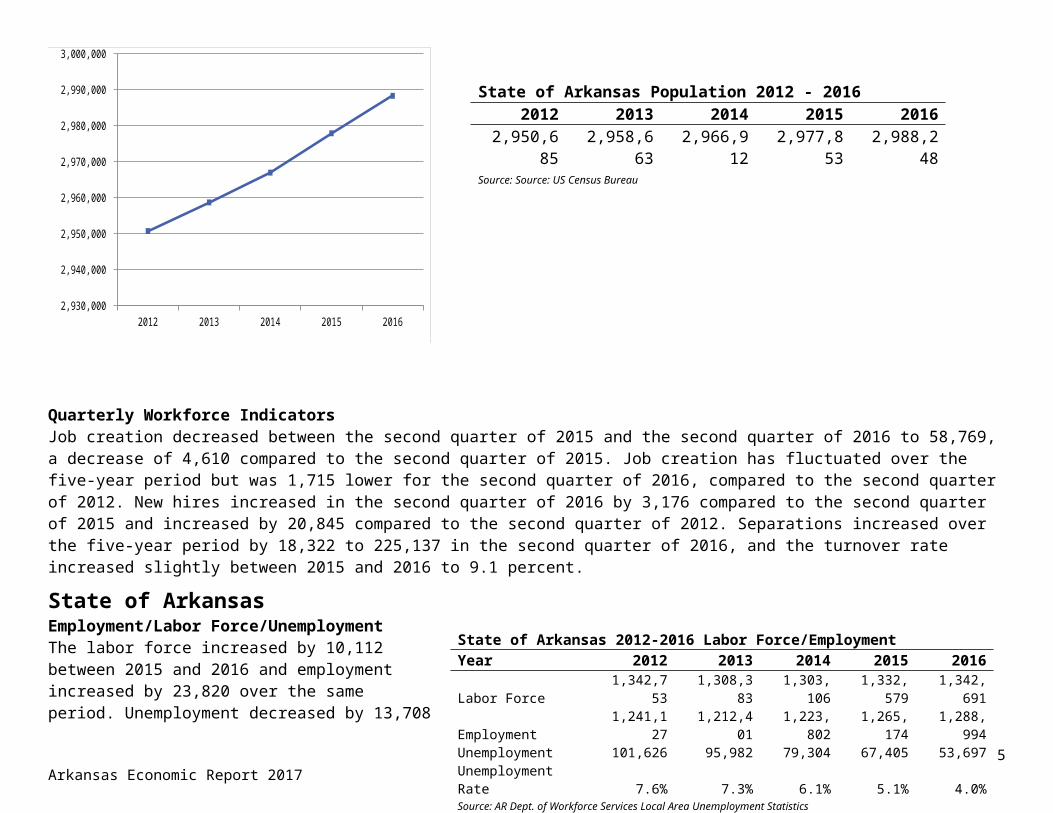
Quarterly Workforce Indicators Job creation decreased between the second quarter of 2015 and the second quarter of 2016 to 58,769, a decrease of 4,610 compared to the second quarter of 2015. Job creation has fluctuated over the five-year period but was 1,715 lower for the second quarter of 2016, compared to the second quarter of 2012. New hires increased in the second quarter of 2016 by 3,176 compared to the second quarter of 2015 and increased by 20,845 compared to the second quarter of 2012. Separations increased over the five-year period by 18,322 to 225,137 in the second quarter of 2016, and the turnover rate increased slightly between 2015 and 2016 to 9.1 percent.
3Arkansas Economic Report 2017
State of Arkansas Quarterly Workforce Indicators(All Ownerships)QWI Explorer 2012 Q2 2013 Q2 2014 Q2 2015 Q2 2016 Q2Job Creation 60,484 58,132 58,636 63,379 58,769New Hires 188,760 185,127 194,555 206,429 209,605Separations 206,815 205,115 208,093 215,963 225,137Turnover 8.5% 8.5% 8.6% 8.8% 9.1%
Source: U.S.Census Bureau, Center for Economic Studies, LEHDJob Creation: Estimated number of jobs gained at firms throughout the quarter.New Hires: Estimated number of workers who started a new job.Separations: Estimated number of workers whose job with a given employer ended in the specified quarter.
Turnovers: The rate at which stable jobs begin and end.
State of Arkansas Population 2012 - 20162012 2013 2014 2015 2016
2,950,685 2,958,663 2,966,912 2,977,853 2,988,248Source: Source: US Census Bureau
Arkansas Economic Report 2017 4
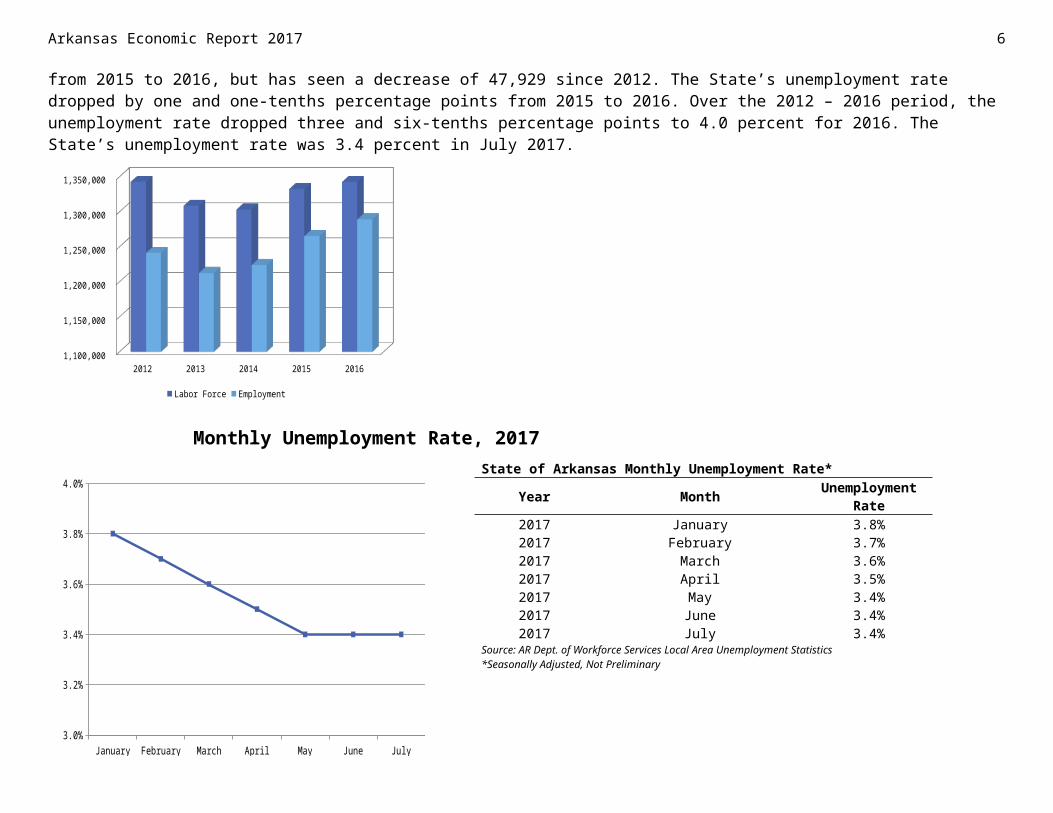
State of Arkansas Employment/Labor Force/UnemploymentThe labor force increased by 10,112 between 2015 and 2016 and employment increased by 23,820 over the same period. Unemployment decreased by 13,708 from 2015 to 2016, but has seen a decrease of 47,929 since 2012. The State’s unemployment rate dropped by one and one-tenths percentage points from 2015 to 2016. Over the 2012 – 2016 period, the unemployment rate dropped three and six-tenths percentage points to 4.0 percent for 2016. The State’s unemployment rate was 3.4 percent in July 2017.
2012 2013 2014 2015 2016 1,100,000
1,150,000
1,200,000
1,250,000
1,300,000
1,350,000
Labor Force Employment Monthly Unemployment Rate, 2017
State of Arkansas 2012-2016 Labor Force/EmploymentYear 2012 2013 2014 2015 2016Labor Force 1,342,753 1,308,383 1,303,106 1,332,579 1,342,691Employment 1,241,127 1,212,401 1,223,802 1,265,174 1,288,994Unemployment 101,626 95,982 79,304 67,405 53,697Unemployment Rate 7.6% 7.3% 6.1% 5.1% 4.0%Source: AR Dept. of Workforce Services Local Area Unemployment Statistics
State of Arkansas Monthly Unemployment Rate*
Year Month Unemployment Rate
2017 January 3.8%2017 February 3.7%2017 March 3.6%2017 April 3.5%2017 May 3.4%2017 June 3.4%2017 July 3.4%
Source: AR Dept. of Workforce Services Local Area Unemployment Statistics*Seasonally Adjusted, Not Preliminary
January February March April May June July3.0%
3.2%
3.4%
3.6%
3.8%
4.0%
State of Arkansas Cost of Living
2017 Q1 Index
URBAN AREA AND STATE
100%COMPOSIT
EINDEX
13.61%GROCER
YITEMS
27.59%HOUSIN
G
10.06%UTILITIE
S
9.59%TRANSPORTATIO
N
4.00%HEALTH
CARE
35.15%MISC. GOODS
AND SERVICES
Fayetteville AR 89.7 95.0 76.4 92.1 86.4 88.0 98.6Hot Springs AR 90.4 91.8 80.4 104.6 87.3 90.8 94.5Jonesboro AR 83.8 90.5 74.9 82.8 86.5 81.0 88.0Conway AR 79.1 88.0 66.8 81.0 89.2 85.5 81.4Little Rock-North Little Rock AR 96.7 91.4 87.9 114.4 88.5 91.4 103.3
2016 Q1 - 2017 Q1 Index
URBAN AREA AND STATE100%
COMPOSITE
INDEX
13.61%GROCER
YITEMS
27.59%HOUSIN
G
10.06%UTILITIE
S
9.59%TRANSPORTATIO
N
4.00%HEALTH
CARE
35.15%MISC. GOODS
AND SERVICES
5Arkansas Economic Report 2017
Arkansas Economic Report 2017 6
Fayetteville AR 87.5 91.1 74.6 95.1 86.5 88.3 94.3Hot Springs AR 91.6 95.4 79.6 109.4 86.9 90.7 95.8Jonesboro AR 84.1 91.6 72.7 82.7 85.9 81.8 90.2Conway AR 83.1 90.1 72.2 81.9 93.0 86.4 86.1Little Rock-North Little Rock AR 95.5 92.5 88.5 115.3 91.8 90.2 98.0
ABOUT THE INDEX: C2ER produces the Cost of Living Index to provide a useful and reasonably accurate measure of living cost differences among urban areas. Items on which the Index is based havebeen carefully chosen to reflect the different categories of consumer expenditures. Weights assigned to relative costs are based on government survey data on expenditure patterns for professional andexecutive households. All items are priced in each place at a specified time and according to standardized specifications.
INTERPRETING THE INDEX: The Cost of Living Index measures relative price levels for consumer goods and services in participating areas. The average for all participating places, both metropolitan and nonmetropolitan, equals 100, and each participant’s index is read as a percentage of the average for all places.
The Index does not measure inflation (price change over time). Because each quarterly report is a separate comparison of prices at a single point in time, and because both the number and the mix ofparticipants changes from one quarter to the next, Index data from different quarters cannot be compared. For inflation data, contact the US Bureau of Labor Statistics (BLS) at www.bls.gov.
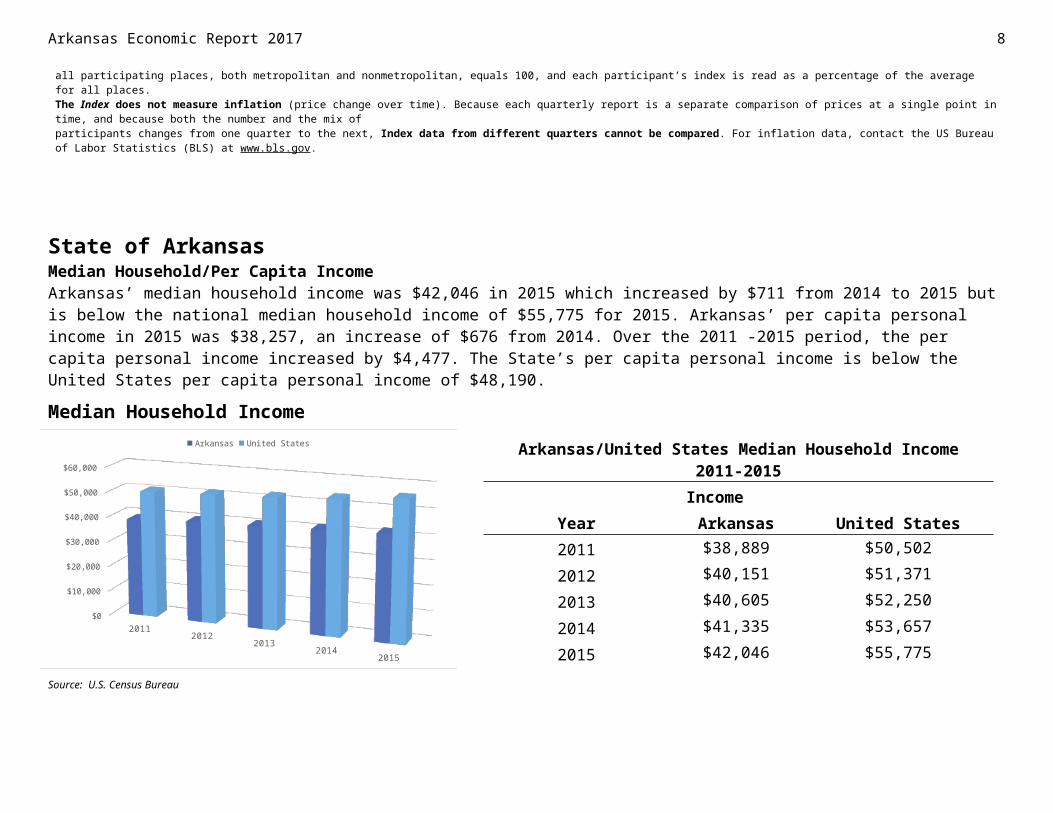
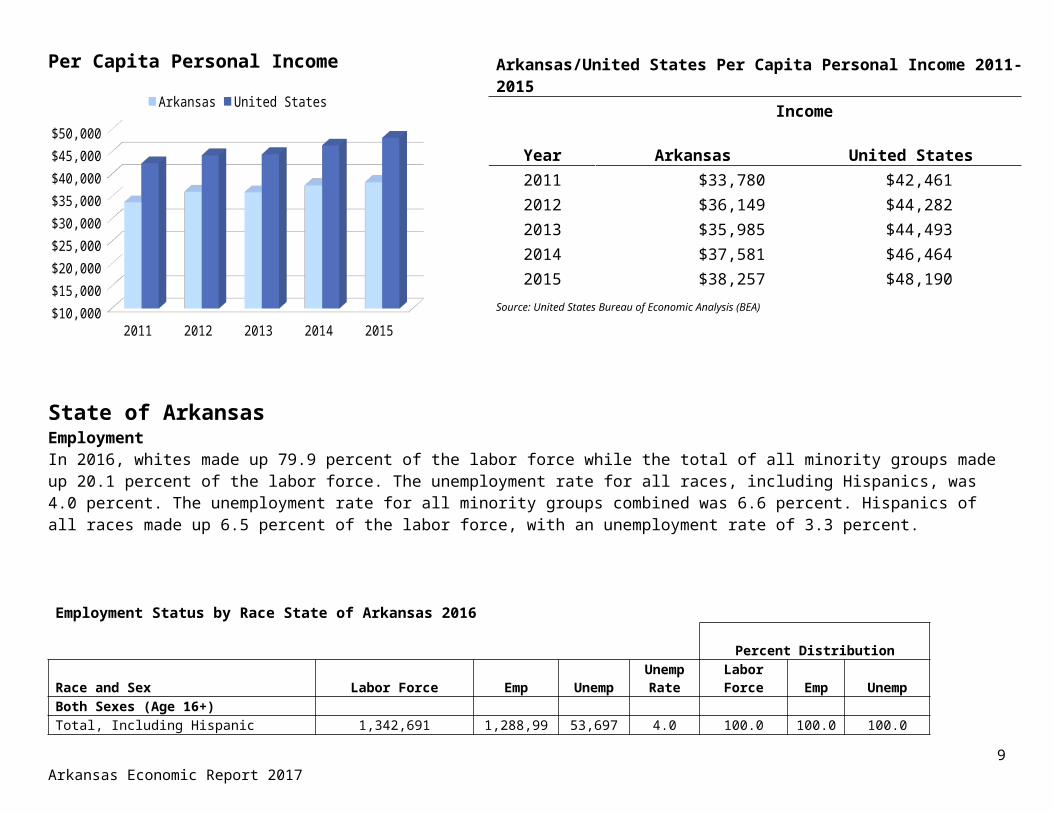
State of Arkansas Median Household/Per Capita IncomeArkansas’ median household income was $42,046 in 2015 which increased by $711 from 2014 to 2015 but is below the national median household income of $55,775 for 2015. Arkansas’ per capita personal income in 2015 was $38,257, an increase of $676 from 2014. Over the 2011 -2015 period, the per capita personal income increased by $4,477. The State’s per capita personal income is below the United States per capita personal income of $48,190.
Median Household Income
Source: U.S. Census Bureau
Per Capita Personal Income
State of Arkansas EmploymentIn 2016, whites made up 79.9 percent of the labor force while the total of all minority groups made up 20.1 percent of the labor force. The unemployment rate for all races, including Hispanics, was 4.0 percent. The unemployment rate for all minority groups combined was 6.6 percent. Hispanics of all races made up 6.5 percent of the labor force, with an unemployment rate of 3.3 percent.
7Arkansas Economic Report 2017
20112012
20132014
2015
$0
$10,000
$20,000
$30,000
$40,000
$50,000
$60,000
Arkansas United States
2011 2012 2013 2014 2015$10,000
$15,000
$20,000
$25,000
$30,000
$35,000
$40,000
$45,000
$50,000
Arkansas United States
Arkansas/United States Median Household Income 2011-2015 Income
Year Arkansas United States2011 $38,889 $50,502
2012 $40,151 $51,371
2013 $40,605 $52,250
2014 $41,335 $53,657
2015 $42,046 $55,775
Arkansas/United States Per Capita Personal Income 2011-2015 Income
Year Arkansas United States2011 $33,780 $42,4612012 $36,149 $44,2822013 $35,985 $44,4932014 $37,581 $46,4642015 $38,257 $48,190
Source: United States Bureau of Economic Analysis (BEA)
Arkansas Economic Report 2017 8
Employment Status by Race State of Arkansas 2016
Percent Distribution
Race and Sex Labor Force Emp UnempUnemp
RateLabor Force Emp Unemp
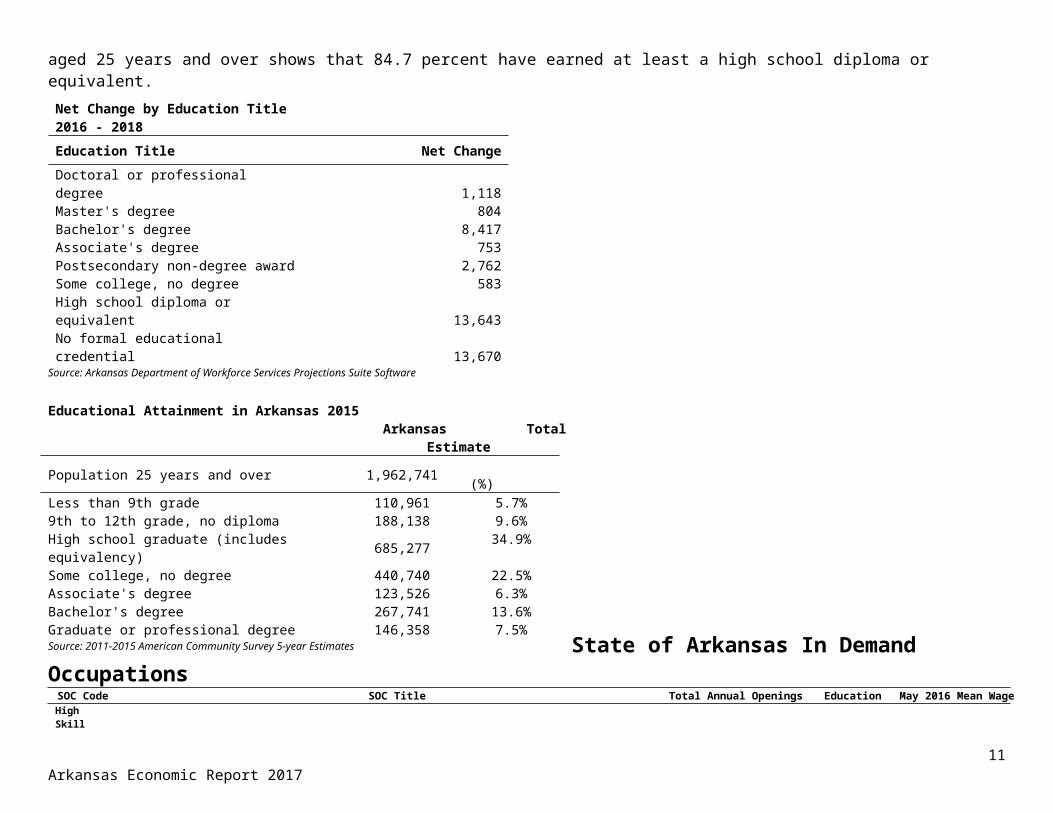
Both Sexes (Age 16+)Total, Including Hispanic 1,342,691 1,288,994 53,697 4.0 100.0 100.0 100.0 White 1,072,656 1,036,899 35,757 3.3 79.9 80.4 66.6 Black 189,683 174,855 14,828 7.8 14.1 13.6 27.6 American Indian/Alaska Native 7,736 7,383 353 4.6 0.6 0.6 0.7 Asian 20,906 20,330 576 2.8 1.6 1.6 1.1 Native Hawaiian/Other Pacific Islander 2,695 2,572 123 4.6 0.2 0.2 0.2 Remaining Races 29,050 28,066 984 3.4 2.2 2.2 1.8 Two or More Races 19,966 18,890 1,076 5.4 1.5 1.5 2.0 Total: Minority Group* 270,036 252,096 17,940 6.6 20.1 19.6 33.4Hispanic, All Races 87,946 85,061 2,885 3.3 6.5 6.6 5.4*Sum of Black, American Indian/Alaska Native, Asian, Native Hawaiian/Other Pacific Islander, Remaining Races, and Two or More Races.Note: Sum of individual items may not equal because of rounding. Persons of Hispanic origin may be of any race.Source: Arkansas Department of Workforce Services, the U.S. Department of Labor- Bureau of Labor Statistics, and the U.S. Census Bureau- AmericanCommunity Survey (2011-2015 5-Year Estimates)
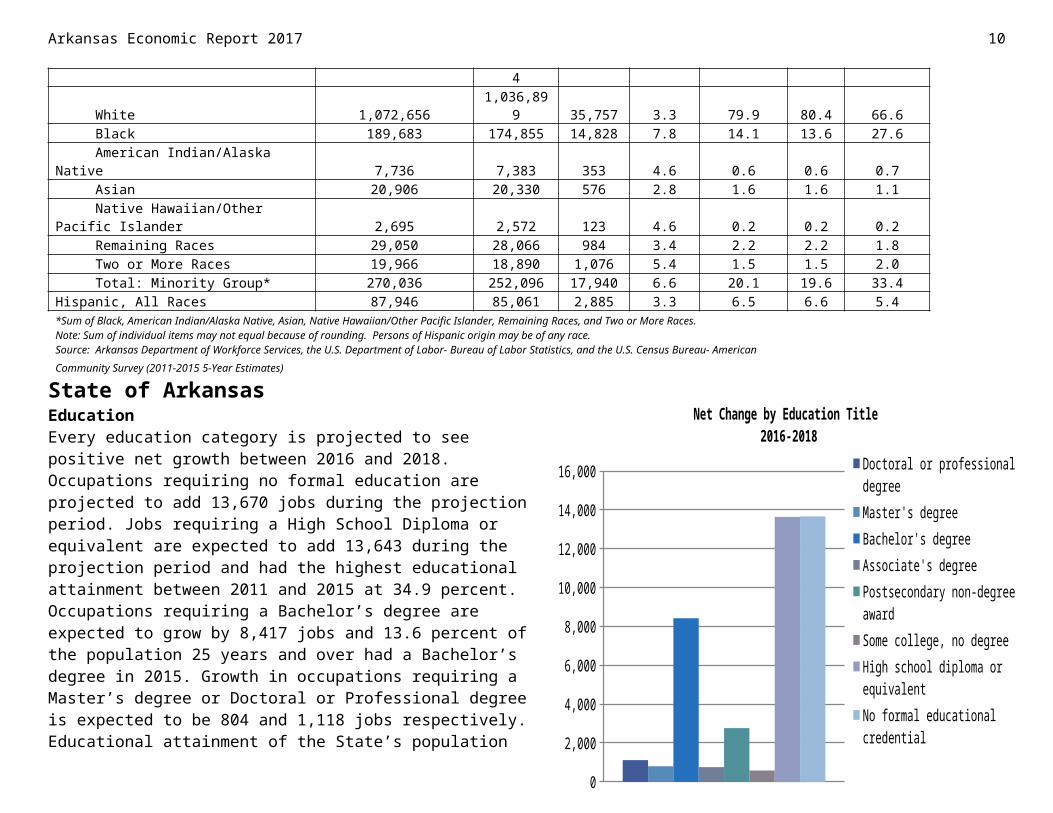
State of Arkansas EducationEvery education category is projected to see positive net growth between 2016 and 2018. Occupations requiring no formal education are projected to add 13,670 jobs during the projection period. Jobs requiring a High School Diploma or equivalent are expected to add 13,643 during the projection period and had the highest educational attainment between 2011 and 2015 at 34.9 percent. Occupations requiring a Bachelor’s degree are expected to grow by 8,417 jobs and 13.6 percent of the population 25 years and over had a Bachelor’s degree in 2015. Growth in occupations requiring a Master’s degree or Doctoral or Professional degree is expected to be 804 and 1,118 jobs respectively. Educational attainment of the State’s population aged 25 years and over shows that 84.7 percent have earned at least a high school diploma or equivalent. Net Change by Education Title2016 - 2018Education Title Net Change
Doctoral or professional degree 1,118Master's degree 804Bachelor's degree 8,417Associate's degree 753Postsecondary non-degree award 2,762Some college, no degree 583High school diploma or equivalent 13,643
No formal educational credential 13,670Source: Arkansas Department of Workforce Services Projections Suite Software
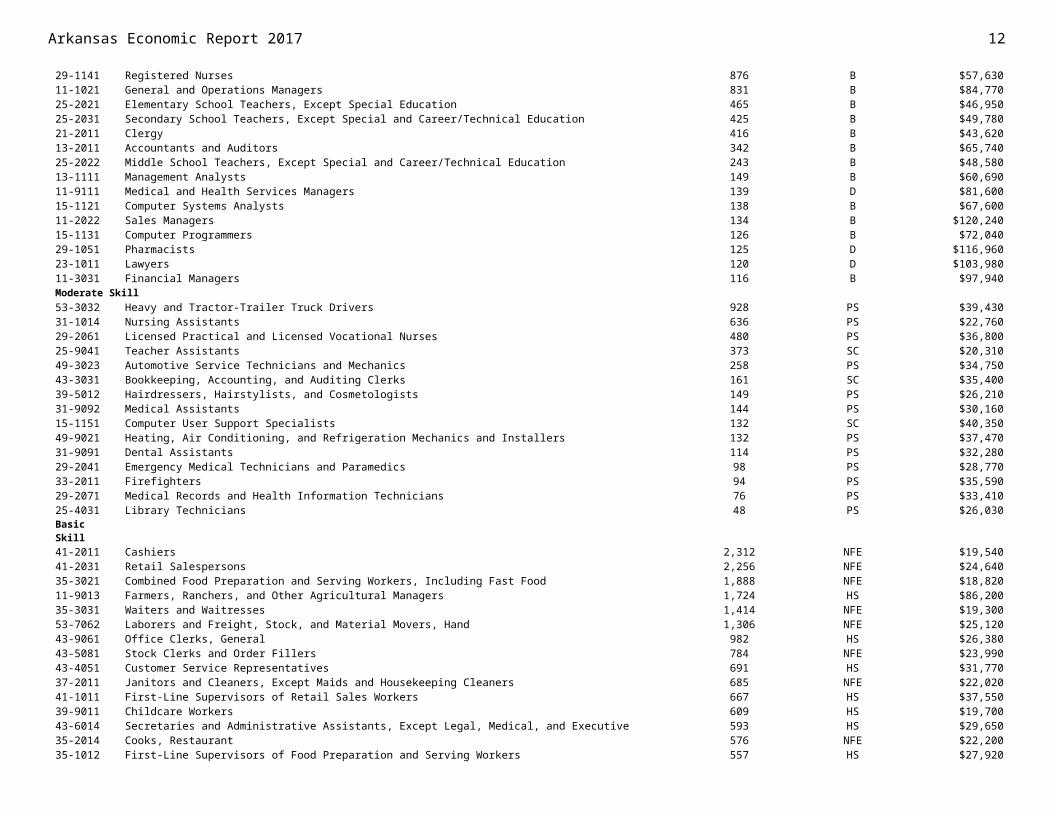
State of Arkansas In Demand OccupationsSOC Code SOC Title Total Annual Openings Education May 2016 Mean Wage
High Skill29-1141 Registered Nurses 876 B $57,63011-1021 General and Operations Managers 831 B $84,77025-2021 Elementary School Teachers, Except Special Education 465 B $46,95025-2031 Secondary School Teachers, Except Special and Career/Technical Education 425 B $49,78021-2011 Clergy 416 B $43,62013-2011 Accountants and Auditors 342 B $65,74025-2022 Middle School Teachers, Except Special and Career/Technical Education 243 B $48,58013-1111 Management Analysts 149 B $60,69011-9111 Medical and Health Services Managers 139 D $81,60015-1121 Computer Systems Analysts 138 B $67,60011-2022 Sales Managers 134 B $120,24015-1131 Computer Programmers 126 B $72,04029-1051 Pharmacists 125 D $116,96023-1011 Lawyers 120 D $103,98011-3031 Financial Managers 116 B $97,940Moderate Skill53-3032 Heavy and Tractor-Trailer Truck Drivers 928 PS $39,43031-1014 Nursing Assistants 636 PS $22,760
9Arkansas Economic Report 2017
0
2,000
4,000
6,000
8,000
10,000
12,000
14,000
16,000
Net Change by Education Title 2016-2018
Doctoral or professional degree
Master's degree
Bachelor's degree
Associate's degree
Postsecondary non-degree award
Some college, no degree
High school diploma or equivalent
No formal educational credential
Educational Attainment in Arkansas 2015 Arkansas Total Estimate
Population 25 years and over 1,962,741 (%)Less than 9th grade 110,961 5.7%9th to 12th grade, no diploma 188,138 9.6%High school graduate (includes equivalency) 685,277 34.9%Some college, no degree 440,740 22.5%Associate's degree 123,526 6.3%Bachelor's degree 267,741 13.6%Graduate or professional degree 146,358 7.5%Source: 2011-2015 American Community Survey 5-year Estimates
Arkansas Economic Report 2017 10
29-2061 Licensed Practical and Licensed Vocational Nurses 480 PS $36,80025-9041 Teacher Assistants 373 SC $20,31049-3023 Automotive Service Technicians and Mechanics 258 PS $34,75043-3031 Bookkeeping, Accounting, and Auditing Clerks 161 SC $35,40039-5012 Hairdressers, Hairstylists, and Cosmetologists 149 PS $26,21031-9092 Medical Assistants 144 PS $30,16015-1151 Computer User Support Specialists 132 SC $40,35049-9021 Heating, Air Conditioning, and Refrigeration Mechanics and Installers 132 PS $37,47031-9091 Dental Assistants 114 PS $32,28029-2041 Emergency Medical Technicians and Paramedics 98 PS $28,77033-2011 Firefighters 94 PS $35,59029-2071 Medical Records and Health Information Technicians 76 PS $33,41025-4031 Library Technicians 48 PS $26,030Basic Skill41-2011 Cashiers 2,312 NFE $19,54041-2031 Retail Salespersons 2,256 NFE $24,64035-3021 Combined Food Preparation and Serving Workers, Including Fast Food 1,888 NFE $18,82011-9013 Farmers, Ranchers, and Other Agricultural Managers 1,724 HS $86,20035-3031 Waiters and Waitresses 1,414 NFE $19,30053-7062 Laborers and Freight, Stock, and Material Movers, Hand 1,306 NFE $25,12043-9061 Office Clerks, General 982 HS $26,38043-5081 Stock Clerks and Order Fillers 784 NFE $23,99043-4051 Customer Service Representatives 691 HS $31,77037-2011 Janitors and Cleaners, Except Maids and Housekeeping Cleaners 685 NFE $22,02041-1011 First-Line Supervisors of Retail Sales Workers 667 HS $37,55039-9011 Childcare Workers 609 HS $19,70043-6014 Secretaries and Administrative Assistants, Except Legal, Medical, and Executive 593 HS $29,65035-2014 Cooks, Restaurant 576 NFE $22,20035-1012 First-Line Supervisors of Food Preparation and Serving Workers 557 HS $27,920Source: Department of Workforce ServicesDoctoral or professional degree (D) - Requires at least three years of full-time academic study beyond a bachelor's degree.Master's degree (M) - Requires one or two years of full-time academic study beyond a bachelor's degree.Bachelor's degree (B) - Requires for or five years of full-time academic study.Associate degree (A) - Requires at least two years of full-time academic study.Postsecondary non-degree award (PS) - Programs last a few weeks to more than a year; leads to a certificate or other award.Some college, no degree (SC) - Requires the completion of a high school or an equivalent program resulting in the award of a high school diploma or equivalent plus the completion of one or more postsecondary courses that did not result in a degree or award.High School diploma or equivalent (HS) - Requires the completion of a high school or an equivalent program resulting in the award of a high school diploma or an equivalent, such as a GED.No Formal Education (NFE) - Signifies that a formal credential issued by an educational instruction, such as a high school diploma or postsecondary certificate, is not typically needed for entry into the occupation.
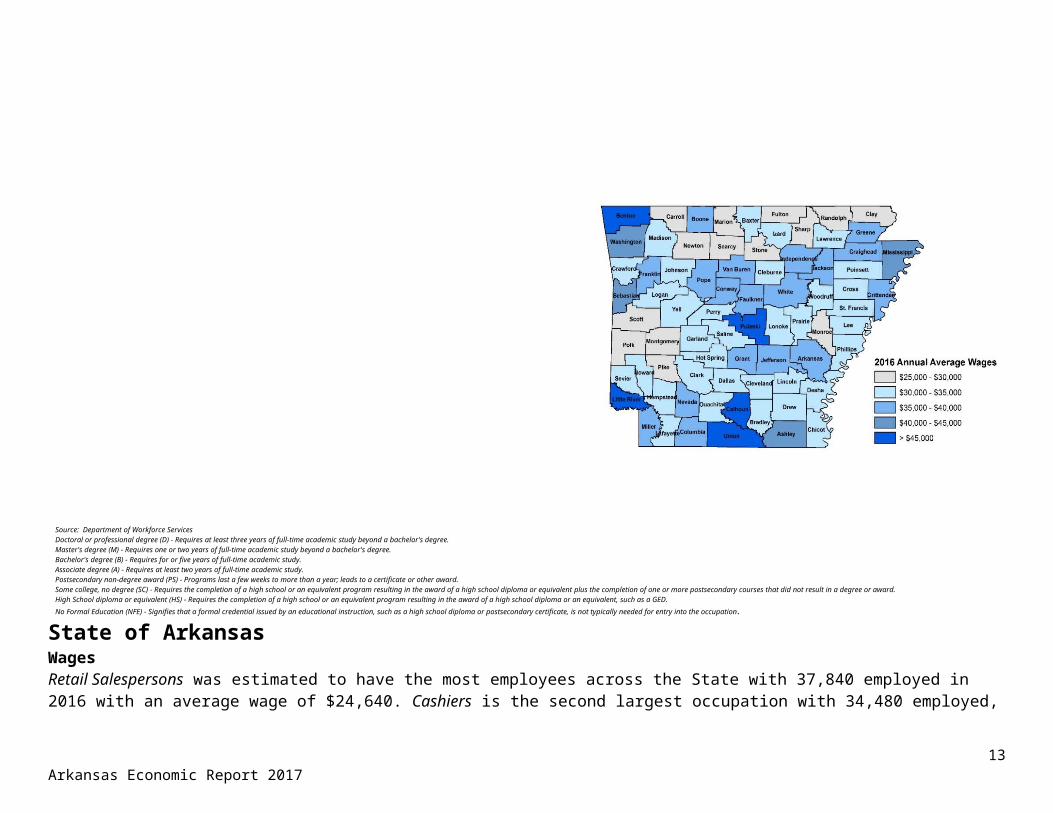
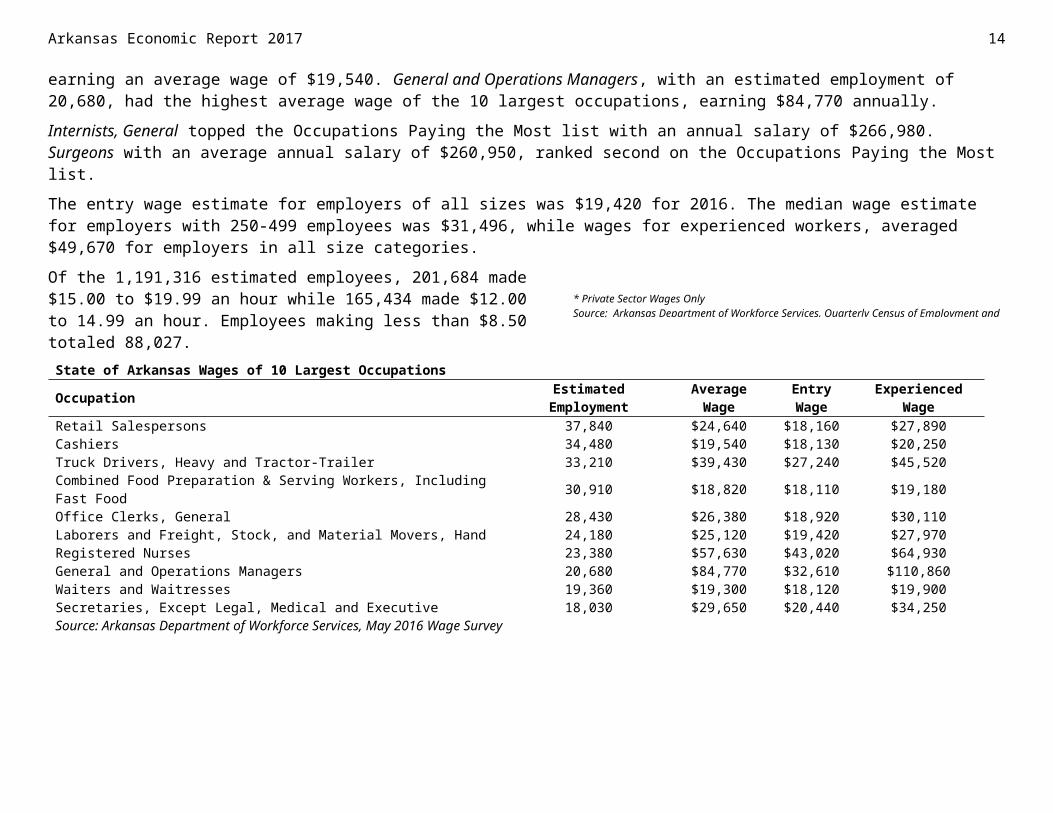
State of Arkansas WagesRetail Salespersons was estimated to have the most employees across the State with 37,840 employed in 2016 with an average wage of $24,640. Cashiers is the second largest occupation with 34,480 employed, earning an average wage of $19,540. General and Operations Managers, with an estimated employment of 20,680, had the highest average wage of the 10 largest occupations, earning $84,770 annually.
Internists, General topped the Occupations Paying the Most list with an annual salary of $266,980. Surgeons with an average annual salary of $260,950, ranked second on the Occupations Paying the Most list.
The entry wage estimate for employers of all sizes was $19,420 for 2016. The median wage estimate for employers with 250-499 employees was $31,496, while wages for experienced workers, averaged $49,670 for employers in all size categories.
Of the 1,191,316 estimated employees, 201,684 made $15.00 to $19.99 an hour while 165,434 made $12.00 to 14.99 an hour. Employees making less than $8.50 totaled 88,027. State of Arkansas Wages of 10 Largest Occupations
Occupation Estimated Employment
AverageWage
Entry Wage
Experienced Wage
Retail Salespersons 37,840 $24,640 $18,160 $27,890Cashiers 34,480 $19,540 $18,130 $20,250Truck Drivers, Heavy and Tractor-Trailer 33,210 $39,430 $27,240 $45,520Combined Food Preparation & Serving Workers, Including Fast Food 30,910 $18,820 $18,110 $19,180Office Clerks, General 28,430 $26,380 $18,920 $30,110Laborers and Freight, Stock, and Material Movers, Hand 24,180 $25,120 $19,420 $27,970Registered Nurses 23,380 $57,630 $43,020 $64,930General and Operations Managers 20,680 $84,770 $32,610 $110,860Waiters and Waitresses 19,360 $19,300 $18,120 $19,900Secretaries, Except Legal, Medical and Executive 18,030 $29,650 $20,440 $34,250Source: Arkansas Department of Workforce Services, May 2016 Wage Survey
State of Arkansas Wages
State of Arkansas Occupations Paying the Most
Occupation Average AnnualSalary
Internists, General $266,980Surgeons $260,950Orthodontists $259,010Obstetricians and Gynecologists $244,290Anesthesiologists $219,640Family and General Practitioners $212,480Podiatrists $190,710Pediatricians, General $188,140Dentists, General $185,170Nurse Anesthetists $158,940Health Specialties Teachers, Postsecondary $143,110
11Arkansas Economic Report 2017
* Private Sector Wages OnlySource: Arkansas Department of Workforce Services, Quarterly Census of Employment and Wages
Arkansas Economic Report 2017 12
Marketing Managers $134,570Compensation and Benefits Managers $125,100Sales Managers $120,240Advertising and Promotions Managers $119,710Pharmacists $116,960Medical Scientists, Except Epidemiologists $115,120Petroleum Engineers $113,730Computer and Information Systems Managers $112,320Architectural and Engineering Managers $112,050Psychiatrists $110,880Actuaries $108,800Law Teachers, Postsecondary $108,380Optometrists $106,800Judges, Magistrate Judges, and Magistrates $105,460Source: Arkansas Department of Workforce Services, May 2016 Wage Survey
State of Arkansas Wages
State of Arkansas Wage Estimates by Employer Size
All Sizes
0-49 Emplo...
50-99 Emplo...
100-249 Empl...
250-499 Empl...
500+ Emplo...$0
$20,000
$40,000
$60,000
$80,000Mean Experienced
State of Arkansas Number of Employees by Hourly Wage Rate
13Arkansas Economic Report 2017
<$8.50$8.50-$9.99$10.00-$11.99$12.00-$14.99$15.00-$19.99$20.00-$24.99
$25.00+
0 50,000100,000
150,000200,000
250,000300,000
Employees
State of Arkansas Wage Estimates by Employer SizeType of Wage Mean Median Entry Experienced
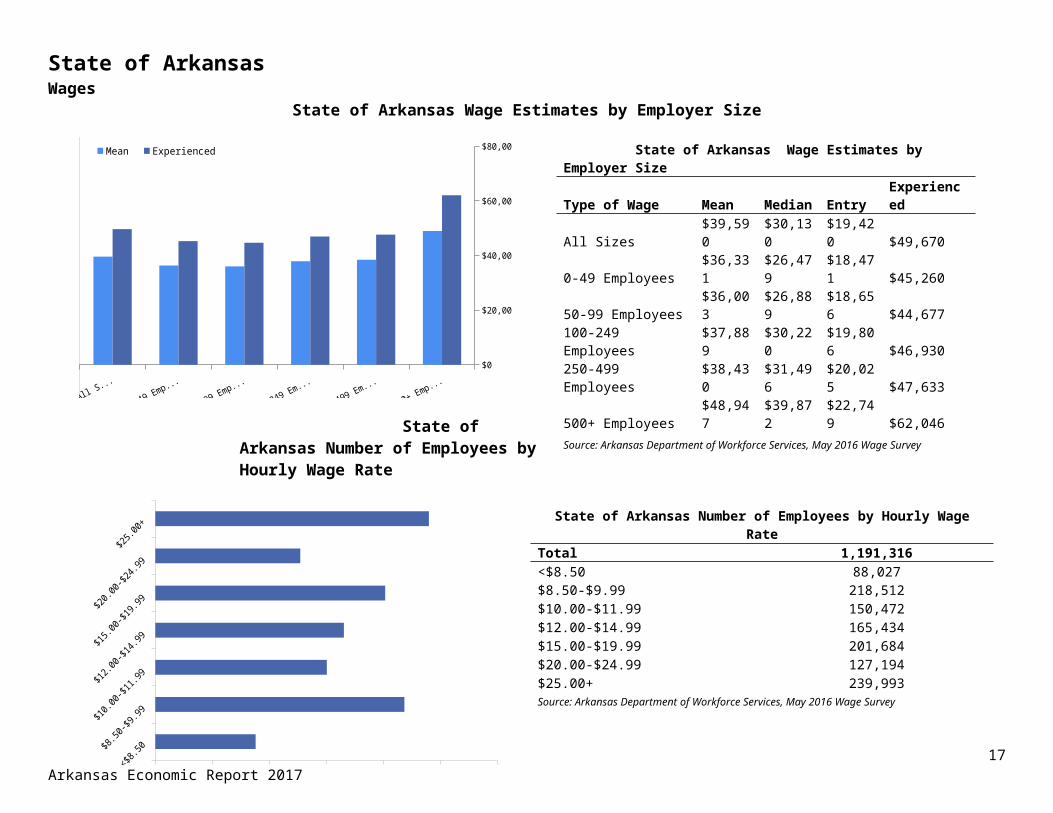
All Sizes $39,590 $30,130$19,420 $49,670
0-49 Employees $36,331 $26,479$18,471 $45,260
50-99 Employees $36,003 $26,889$18,656 $44,677
100-249 Employees $37,889 $30,220$19,806 $46,930
250-499 Employees $38,430 $31,496$20,025 $47,633
500+ Employees $48,947 $39,872$22,749 $62,046
Source: Arkansas Department of Workforce Services, May 2016 Wage Survey
State of Arkansas Number of Employees by Hourly Wage RateTotal 1,191,316<$8.50 88,027$8.50-$9.99 218,512$10.00-$11.99 150,472$12.00-$14.99 165,434$15.00-$19.99 201,684$20.00-$24.99 127,194$25.00+ 239,993Source: Arkansas Department of Workforce Services, May 2016 Wage Survey
Arkansas Economic Report 2017 14
State of Arkansas Wages
Average Wages for Surrounding States
ArkansasLouisiana
MississippiMissouri
OklahomaTennessee Texas
$0.00
$5.00
$10.00
$15.00
$20.00
$25.00
Mean Hourly Wage
ArkansasLouisiana
MississippiMissouri
OklahomaTennessee Texas
$0
$10,000
$20,000
$30,000
$40,000
$50,000
$60,000
Mean Annual Wage
Average Wages of States Surrounding ArkansasState Mean Hourly Wage Mean Annual WageArkansas $19.03 $39,590Louisiana $19.84 $41,260Mississippi $18.41 $38,300Missouri $21.45 $44,620Oklahoma $20.56 $42,760Tennessee $20.36 $42,350Texas $22.97 $47,770Source: Arkansas Department of Workforce Services, May 2016 Wage Survey
State of Arkansas Wages
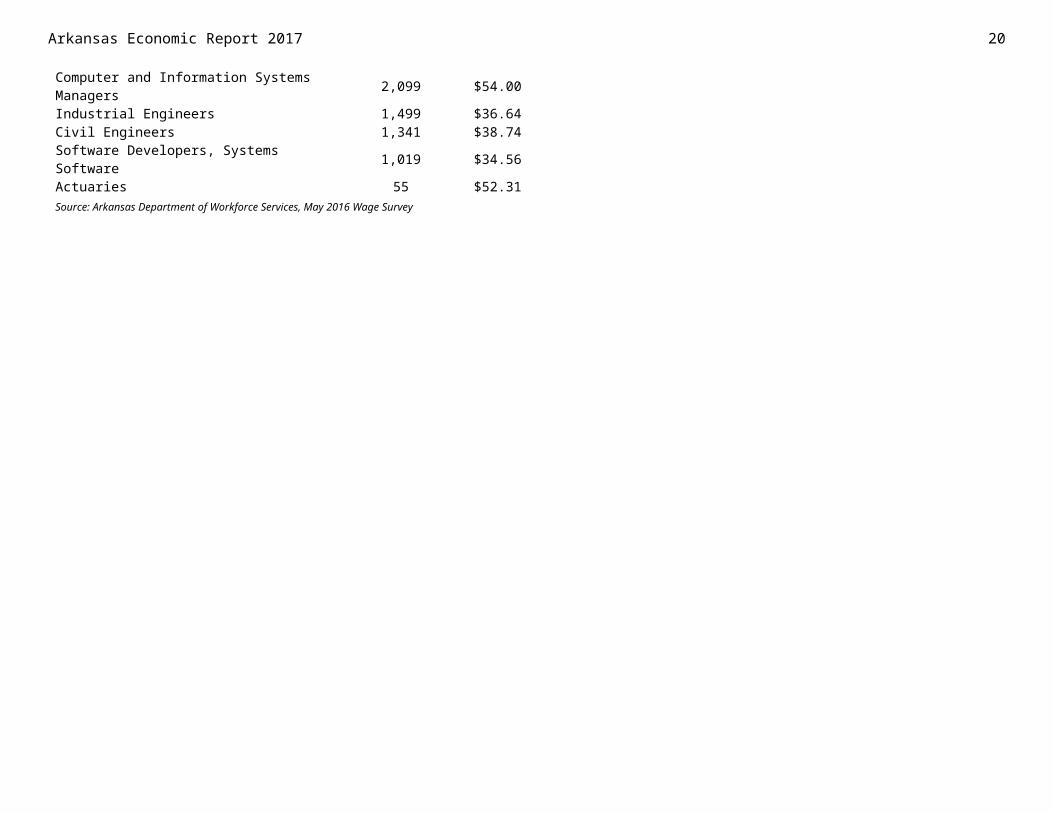
State of Arkansas Employment and Wages for Select STEM Occupations
Occupation EmploymentMean Hourly
WageComputer User Support Specialists 3,901 $19.40Computer Programmers 3,537 $34.64Network and Computer Systems Administrators 3,143 $33.33Computer Systems Analysts 2,790 $32.50Software Developers, Applications 2,122 $41.77Computer and Information Systems Managers 2,099 $54.00Industrial Engineers 1,499 $36.64Civil Engineers 1,341 $38.74Software Developers, Systems Software 1,019 $34.56Actuaries 55 $52.31Source: Arkansas Department of Workforce Services, May 2016 Wage Survey
15Arkansas Economic Report 2017

Arkansas Economic Report 2017 16
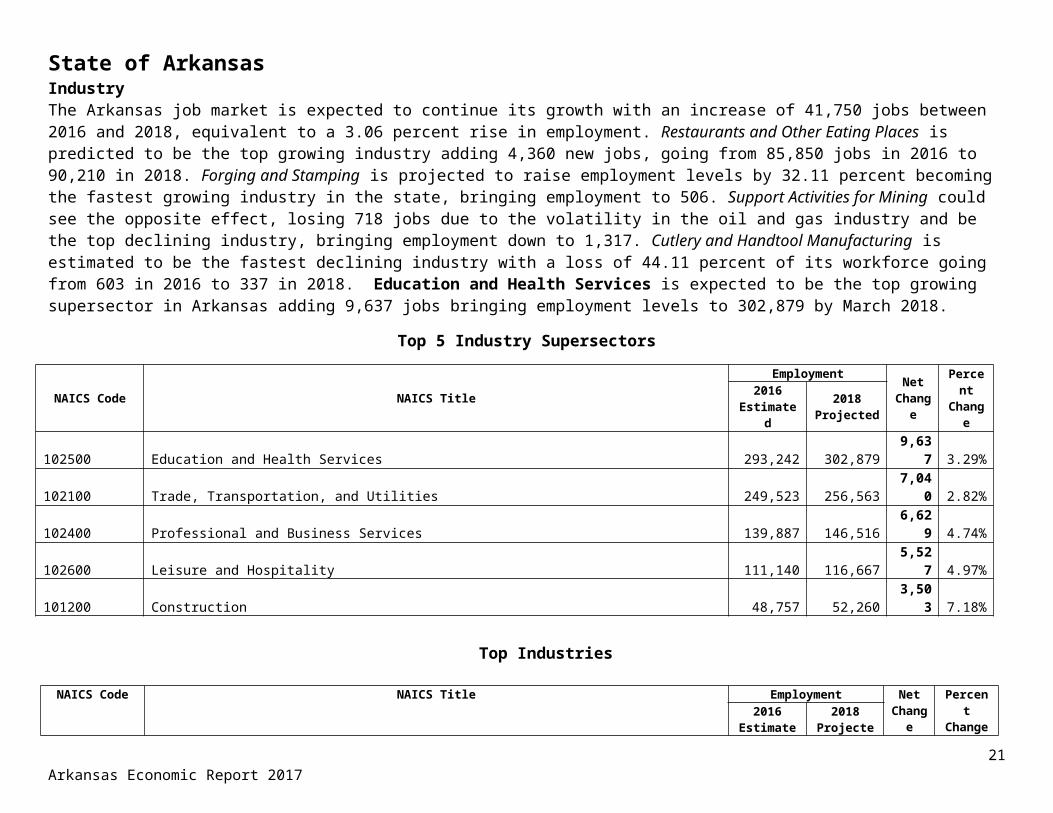
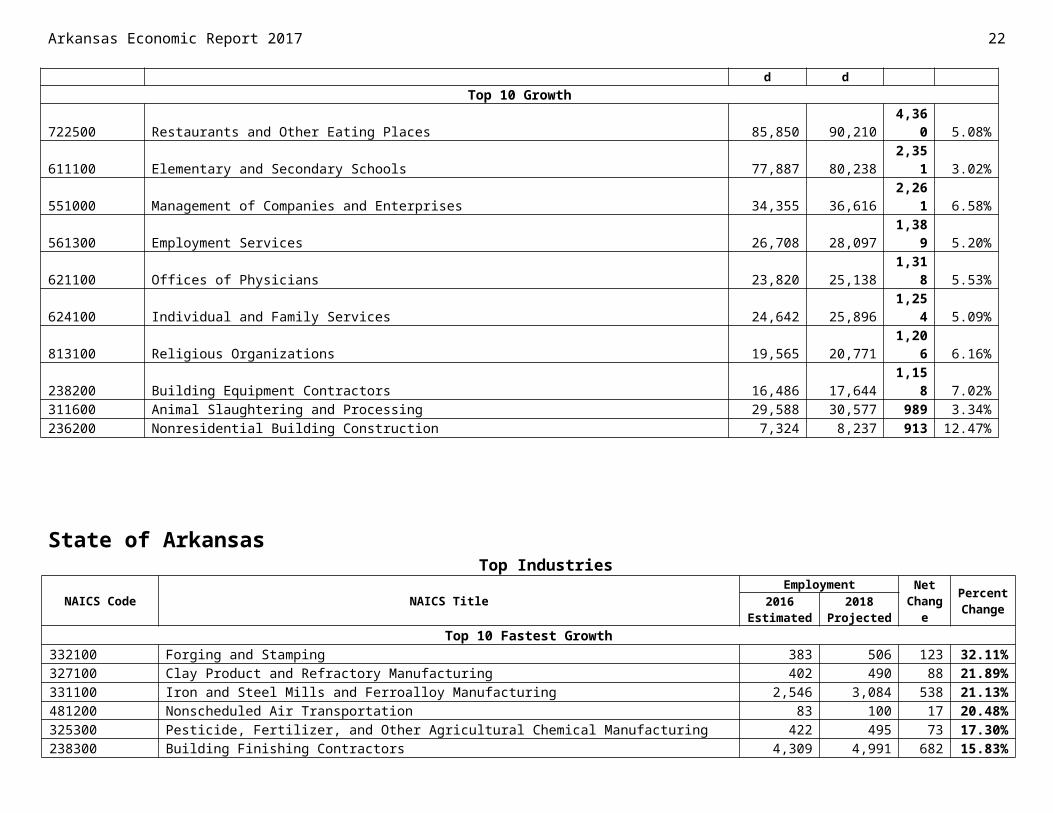
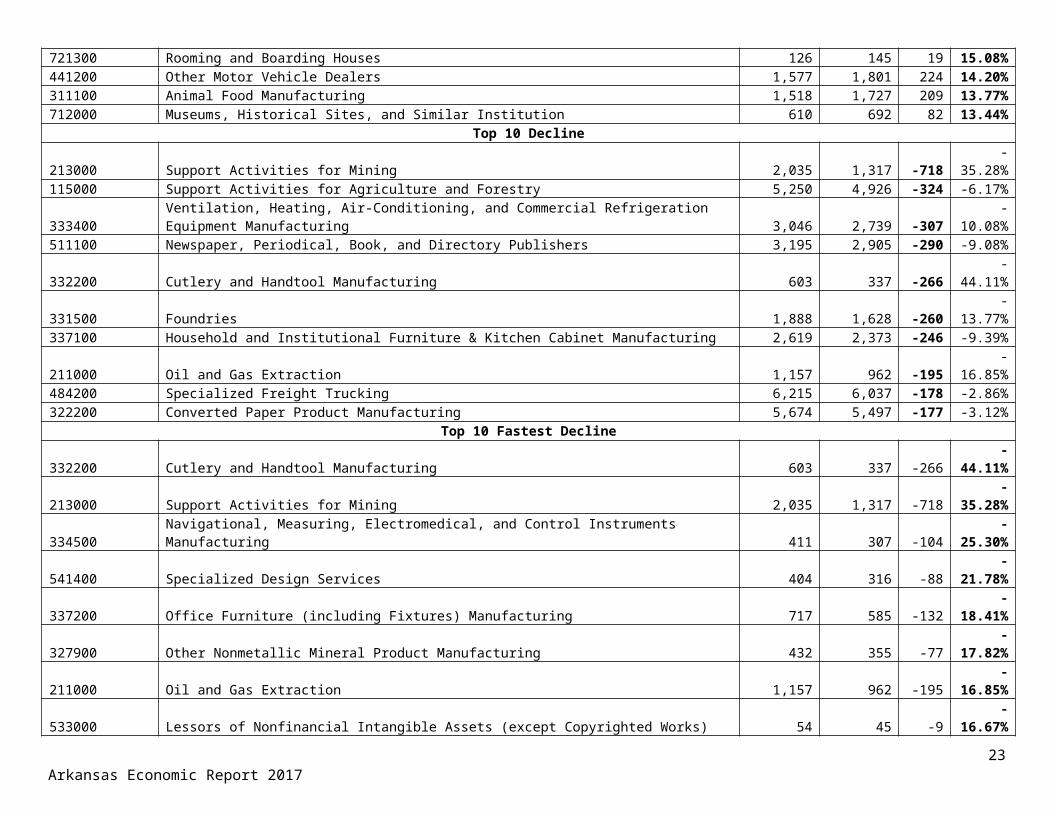
State of Arkansas IndustryThe Arkansas job market is expected to continue its growth with an increase of 41,750 jobs between 2016 and 2018, equivalent to a 3.06 percent rise in employment. Restaurants and Other Eating Places is predicted to be the top growing industry adding 4,360 new jobs, going from 85,850 jobs in 2016 to 90,210 in 2018. Forging and Stamping is projected to raise employment levels by 32.11 percent becoming the fastest growing industry in the state, bringing employment to 506. Support Activities for Mining could see the opposite effect, losing 718 jobs due to the volatility in the oil and gas industry and be the top declining industry, bringing employment down to 1,317. Cutlery and Handtool Manufacturing is estimated to be the fastest declining industry with a loss of 44.11 percent of its workforce going from 603 in 2016 to 337 in 2018. Education and Health Services is expected to be the top growing supersector in Arkansas adding 9,637 jobs bringing employment levels to 302,879 by March 2018.
Top 5 Industry Supersectors
NAICS Code NAICS TitleEmployment Net
ChangePercent Change2016
Estimated2018
Projected102500 Education and Health Services 293,242 302,879 9,637 3.29%102100 Trade, Transportation, and Utilities 249,523 256,563 7,040 2.82%102400 Professional and Business Services 139,887 146,516 6,629 4.74%102600 Leisure and Hospitality 111,140 116,667 5,527 4.97%101200 Construction 48,757 52,260 3,503 7.18%
Top Industries
NAICS Code NAICS TitleEmployment Net
ChangePercent Change2016
Estimated2018
ProjectedTop 10 Growth
722500 Restaurants and Other Eating Places 85,850 90,210 4,360 5.08%611100 Elementary and Secondary Schools 77,887 80,238 2,351 3.02%551000 Management of Companies and Enterprises 34,355 36,616 2,261 6.58%561300 Employment Services 26,708 28,097 1,389 5.20%621100 Offices of Physicians 23,820 25,138 1,318 5.53%624100 Individual and Family Services 24,642 25,896 1,254 5.09%813100 Religious Organizations 19,565 20,771 1,206 6.16%238200 Building Equipment Contractors 16,486 17,644 1,158 7.02%311600 Animal Slaughtering and Processing 29,588 30,577 989 3.34%236200 Nonresidential Building Construction 7,324 8,237 913 12.47%
State of Arkansas

Top Industries
NAICS Code NAICS TitleEmployment Net
ChangePercent Change2016
Estimated2018
ProjectedTop 10 Fastest Growth
332100 Forging and Stamping 383 506 123 32.11%327100 Clay Product and Refractory Manufacturing 402 490 88 21.89%331100 Iron and Steel Mills and Ferroalloy Manufacturing 2,546 3,084 538 21.13%481200 Nonscheduled Air Transportation 83 100 17 20.48%325300 Pesticide, Fertilizer, and Other Agricultural Chemical Manufacturing 422 495 73 17.30%238300 Building Finishing Contractors 4,309 4,991 682 15.83%721300 Rooming and Boarding Houses 126 145 19 15.08%441200 Other Motor Vehicle Dealers 1,577 1,801 224 14.20%311100 Animal Food Manufacturing 1,518 1,727 209 13.77%712000 Museums, Historical Sites, and Similar Institution 610 692 82 13.44%
Top 10 Decline213000 Support Activities for Mining 2,035 1,317 -718 -35.28%115000 Support Activities for Agriculture and Forestry 5,250 4,926 -324 -6.17%333400 Ventilation, Heating, Air-Conditioning, and Commercial Refrigeration Equipment Manufacturing 3,046 2,739 -307 -10.08%511100 Newspaper, Periodical, Book, and Directory Publishers 3,195 2,905 -290 -9.08%332200 Cutlery and Handtool Manufacturing 603 337 -266 -44.11%331500 Foundries 1,888 1,628 -260 -13.77%337100 Household and Institutional Furniture & Kitchen Cabinet Manufacturing 2,619 2,373 -246 -9.39%211000 Oil and Gas Extraction 1,157 962 -195 -16.85%484200 Specialized Freight Trucking 6,215 6,037 -178 -2.86%322200 Converted Paper Product Manufacturing 5,674 5,497 -177 -3.12%
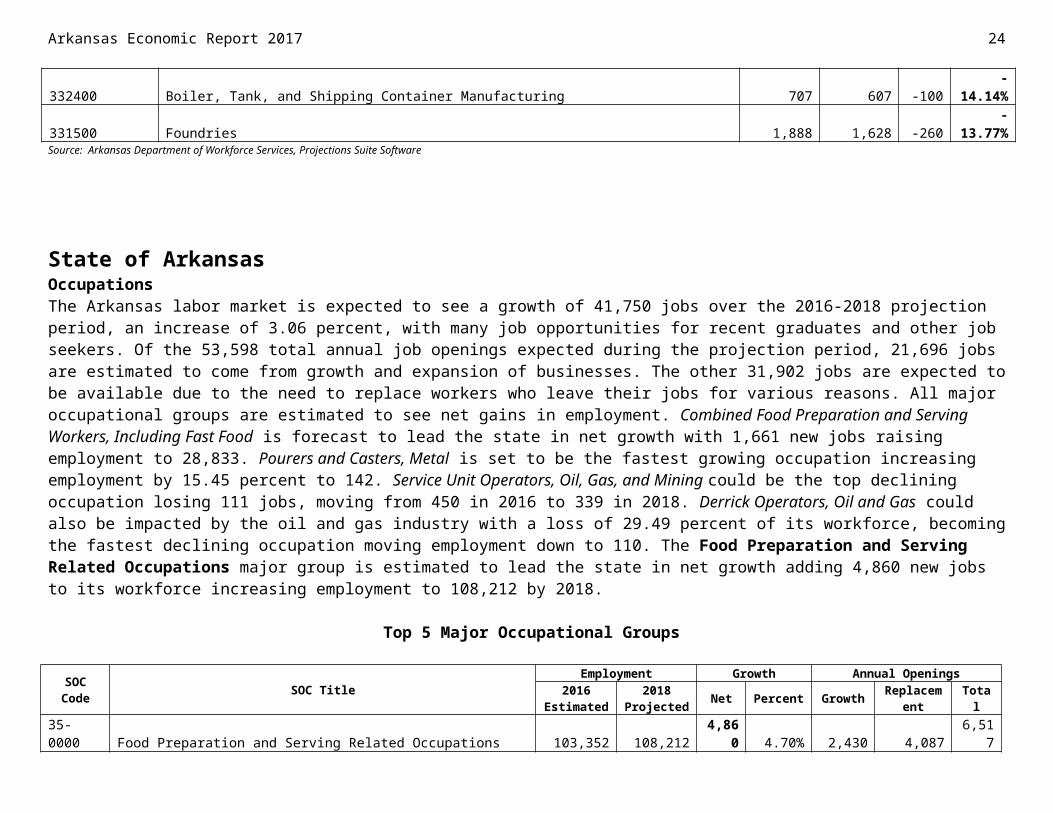
Top 10 Fastest Decline332200 Cutlery and Handtool Manufacturing 603 337 -266 -44.11%213000 Support Activities for Mining 2,035 1,317 -718 -35.28%334500 Navigational, Measuring, Electromedical, and Control Instruments Manufacturing 411 307 -104 -25.30%541400 Specialized Design Services 404 316 -88 -21.78%337200 Office Furniture (including Fixtures) Manufacturing 717 585 -132 -18.41%327900 Other Nonmetallic Mineral Product Manufacturing 432 355 -77 -17.82%211000 Oil and Gas Extraction 1,157 962 -195 -16.85%533000 Lessors of Nonfinancial Intangible Assets (except Copyrighted Works) 54 45 -9 -16.67%332400 Boiler, Tank, and Shipping Container Manufacturing 707 607 -100 -14.14%331500 Foundries 1,888 1,628 -260 -13.77%Source: Arkansas Department of Workforce Services, Projections Suite Software
State of Arkansas Occupations
17Arkansas Economic Report 2017
Arkansas Economic Report 2017 18
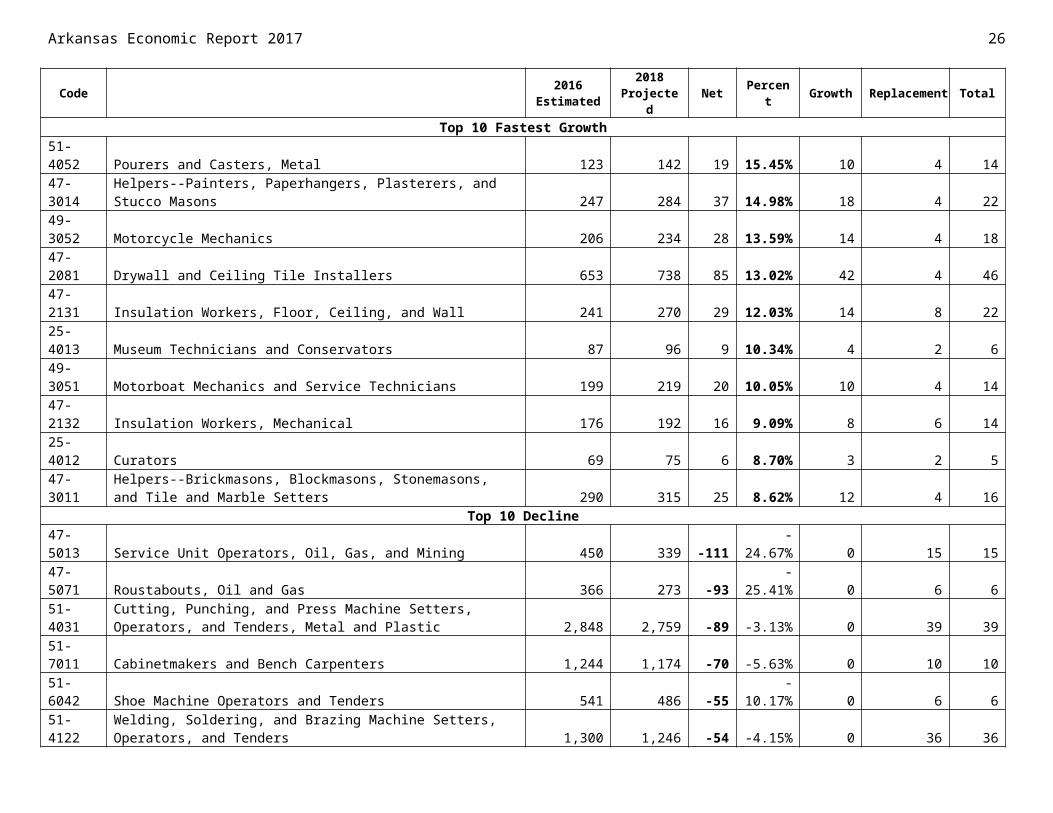
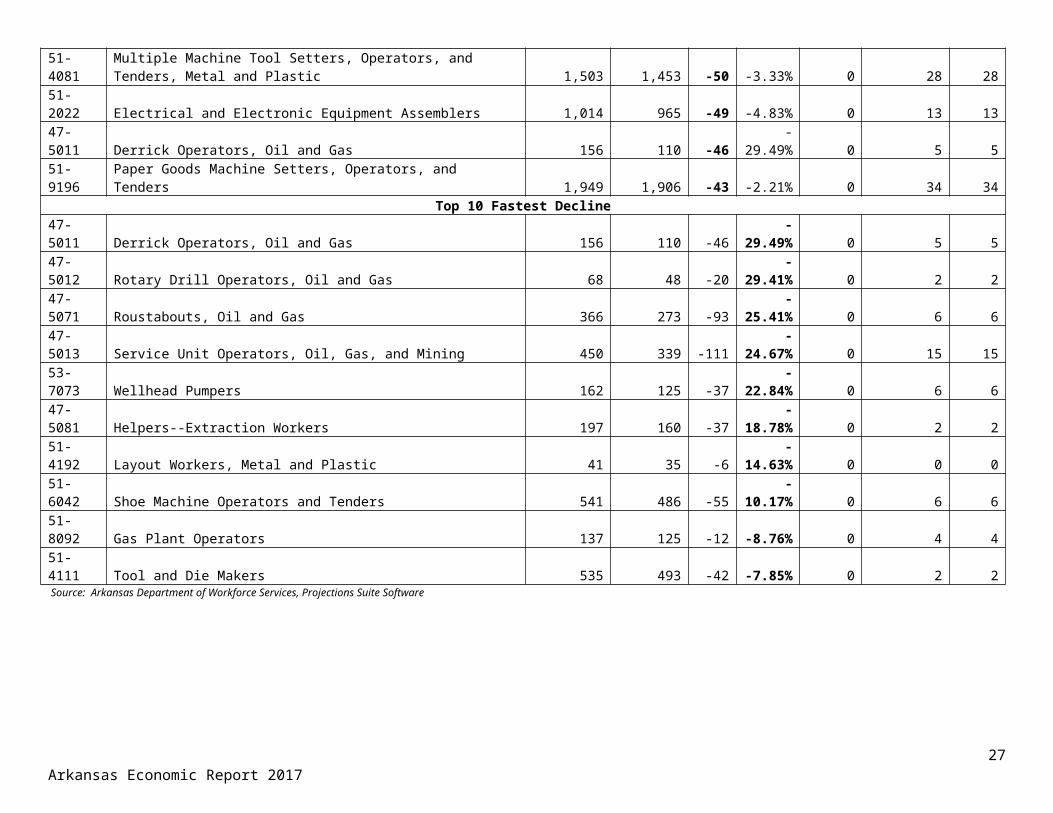
The Arkansas labor market is expected to see a growth of 41,750 jobs over the 2016-2018 projection period, an increase of 3.06 percent, with many job opportunities for recent graduates and other job seekers. Of the 53,598 total annual job openings expected during the projection period, 21,696 jobs are estimated to come from growth and expansion of businesses. The other 31,902 jobs are expected to be available due to the need to replace workers who leave their jobs for various reasons. All major occupational groups are estimated to see net gains in employment. Combined Food Preparation and Serving Workers, Including Fast Food is forecast to lead the state in net growth with 1,661 new jobs raising employment to 28,833. Pourers and Casters, Metal is set to be the fastest growing occupation increasing employment by 15.45 percent to 142. Service Unit Operators, Oil, Gas, and Mining could be the top declining occupation losing 111 jobs, moving from 450 in 2016 to 339 in 2018. Derrick Operators, Oil and Gas could also be impacted by the oil and gas industry with a loss of 29.49 percent of its workforce, becoming the fastest declining occupation moving employment down to 110. The Food Preparation and Serving Related Occupations major group is estimated to lead the state in net growth adding 4,860 new jobs to its workforce increasing employment to 108,212 by 2018.
Top 5 Major Occupational Groups
SOC Code SOC TitleEmployment Growth Annual Openings
2016 Estimated
2018 Projected Net Percent Growth Replacement Total
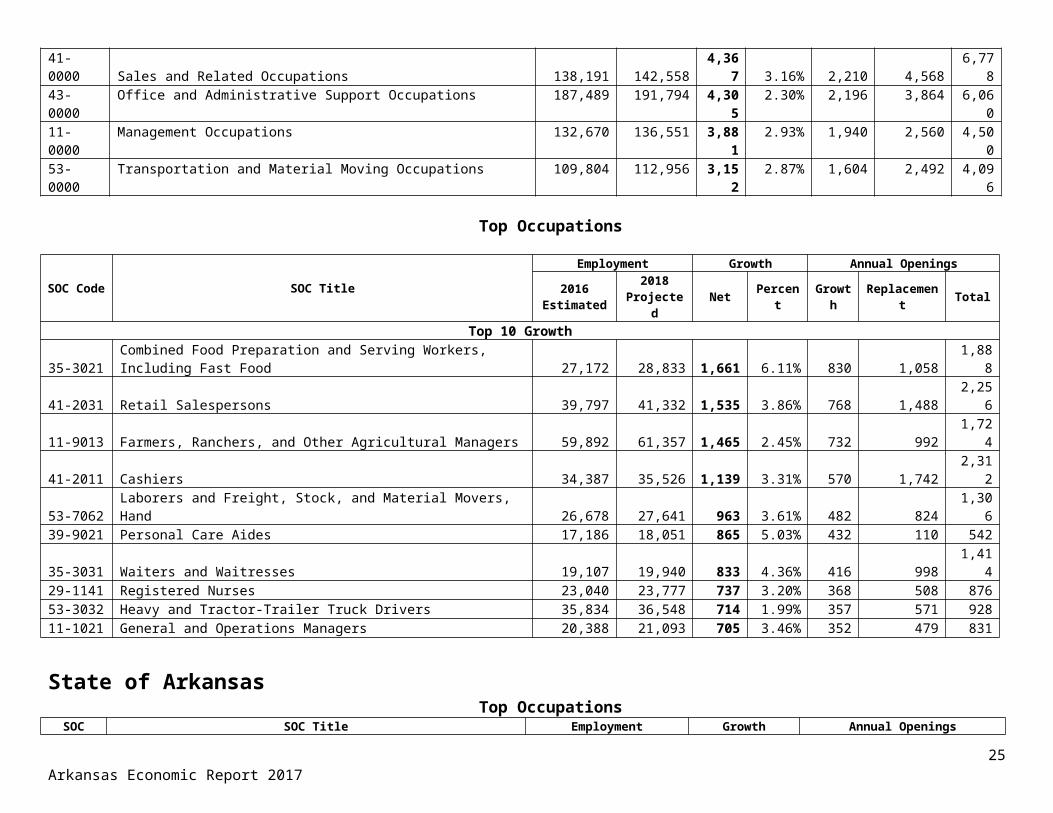
35-0000 Food Preparation and Serving Related Occupations 103,352 108,212 4,860 4.70% 2,430 4,087 6,51741-0000 Sales and Related Occupations 138,191 142,558 4,367 3.16% 2,210 4,568 6,77843-0000 Office and Administrative Support Occupations 187,489 191,794 4,305 2.30% 2,196 3,864 6,06011-0000 Management Occupations 132,670 136,551 3,881 2.93% 1,940 2,560 4,50053-0000 Transportation and Material Moving Occupations 109,804 112,956 3,152 2.87% 1,604 2,492 4,096
Top Occupations
SOC Code SOC TitleEmployment Growth Annual Openings
2016 Estimated
2018 Projected Net Percent Growth Replacement Total
Top 10 Growth35-3021 Combined Food Preparation and Serving Workers, Including Fast Food 27,172 28,833 1,661 6.11% 830 1,058 1,88841-2031 Retail Salespersons 39,797 41,332 1,535 3.86% 768 1,488 2,25611-9013 Farmers, Ranchers, and Other Agricultural Managers 59,892 61,357 1,465 2.45% 732 992 1,72441-2011 Cashiers 34,387 35,526 1,139 3.31% 570 1,742 2,31253-7062 Laborers and Freight, Stock, and Material Movers, Hand 26,678 27,641 963 3.61% 482 824 1,30639-9021 Personal Care Aides 17,186 18,051 865 5.03% 432 110 54235-3031 Waiters and Waitresses 19,107 19,940 833 4.36% 416 998 1,41429-1141 Registered Nurses 23,040 23,777 737 3.20% 368 508 87653-3032 Heavy and Tractor-Trailer Truck Drivers 35,834 36,548 714 1.99% 357 571 92811-1021 General and Operations Managers 20,388 21,093 705 3.46% 352 479 831
State of Arkansas Top Occupations
SOC Code SOC Title Employment Growth Annual Openings2016 2018 Net Percent Growth Replacement Total
Estimated ProjectedTop 10 Fastest Growth
51-4052 Pourers and Casters, Metal 123 142 19 15.45% 10 4 1447-3014 Helpers--Painters, Paperhangers, Plasterers, and Stucco Masons 247 284 37 14.98% 18 4 2249-3052 Motorcycle Mechanics 206 234 28 13.59% 14 4 1847-2081 Drywall and Ceiling Tile Installers 653 738 85 13.02% 42 4 4647-2131 Insulation Workers, Floor, Ceiling, and Wall 241 270 29 12.03% 14 8 2225-4013 Museum Technicians and Conservators 87 96 9 10.34% 4 2 649-3051 Motorboat Mechanics and Service Technicians 199 219 20 10.05% 10 4 1447-2132 Insulation Workers, Mechanical 176 192 16 9.09% 8 6 1425-4012 Curators 69 75 6 8.70% 3 2 547-3011 Helpers--Brickmasons, Blockmasons, Stonemasons, and Tile and Marble Setters 290 315 25 8.62% 12 4 16
Top 10 Decline47-5013 Service Unit Operators, Oil, Gas, and Mining 450 339 -111 -24.67% 0 15 1547-5071 Roustabouts, Oil and Gas 366 273 -93 -25.41% 0 6 6
51-4031Cutting, Punching, and Press Machine Setters, Operators, and Tenders, Metal and Plastic 2,848 2,759 -89 -3.13% 0 39 39
51-7011 Cabinetmakers and Bench Carpenters 1,244 1,174 -70 -5.63% 0 10 1051-6042 Shoe Machine Operators and Tenders 541 486 -55 -10.17% 0 6 651-4122 Welding, Soldering, and Brazing Machine Setters, Operators, and Tenders 1,300 1,246 -54 -4.15% 0 36 3651-4081 Multiple Machine Tool Setters, Operators, and Tenders, Metal and Plastic 1,503 1,453 -50 -3.33% 0 28 2851-2022 Electrical and Electronic Equipment Assemblers 1,014 965 -49 -4.83% 0 13 1347-5011 Derrick Operators, Oil and Gas 156 110 -46 -29.49% 0 5 551-9196 Paper Goods Machine Setters, Operators, and Tenders 1,949 1,906 -43 -2.21% 0 34 34
Top 10 Fastest Decline47-5011 Derrick Operators, Oil and Gas 156 110 -46 -29.49% 0 5 547-5012 Rotary Drill Operators, Oil and Gas 68 48 -20 -29.41% 0 2 247-5071 Roustabouts, Oil and Gas 366 273 -93 -25.41% 0 6 647-5013 Service Unit Operators, Oil, Gas, and Mining 450 339 -111 -24.67% 0 15 1553-7073 Wellhead Pumpers 162 125 -37 -22.84% 0 6 647-5081 Helpers--Extraction Workers 197 160 -37 -18.78% 0 2 251-4192 Layout Workers, Metal and Plastic 41 35 -6 -14.63% 0 0 051-6042 Shoe Machine Operators and Tenders 541 486 -55 -10.17% 0 6 651-8092 Gas Plant Operators 137 125 -12 -8.76% 0 4 451-4111 Tool and Die Makers 535 493 -42 -7.85% 0 2 2 Source: Arkansas Department of Workforce Services, Projections Suite Software
19Arkansas Economic Report 2017
Arkansas Economic Report 2017 20
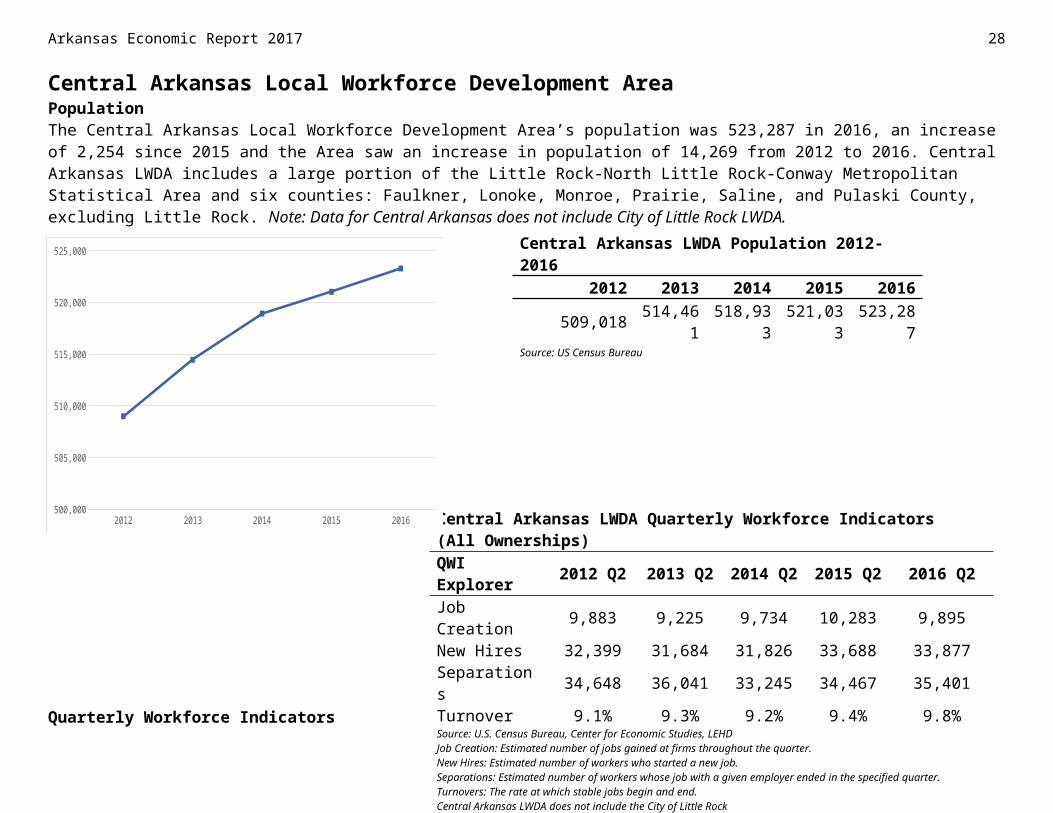
Central Arkansas Local Workforce Development AreaPopulationThe Central Arkansas Local Workforce Development Area’s population was 523,287 in 2016, an increase of 2,254 since 2015 and the Area saw an increase in population of 14,269 from 2012 to 2016. Central Arkansas LWDA includes a large portion of the Little Rock-North Little Rock-Conway Metropolitan Statistical Area and six counties: Faulkner, Lonoke, Monroe, Prairie, Saline, and Pulaski County, excluding Little Rock. Note: Data for Central Arkansas does not include City of Little Rock LWDA.
Quarterly Workforce IndicatorsJob creation decreased by 388, when comparing the second quarter of 2016 to the second quarter of 2015, to 9,895 and slightly increased by 12 when comparing to the second quarter of 2012. The number of new hires and the number of separations increased in the second quarter of 2016 compared to the same time period in 2015. New hires totaled 33,877 for the second quarter of 2016 while separations totaled 35,401. Turnover increased to 9.8 percent in the second quarter of 2016.
2012 2013 2014 2015 2016500,000
505,000
510,000
515,000
520,000
525,000 Central Arkansas LWDA Population 2012-20162012 2013 2014 2015 2016
509,018 514,461 518,933 521,033 523,287Source: US Census Bureau
Central Arkansas LWDA Quarterly Workforce Indicators(All Ownerships)QWI Explorer 2012 Q2 2013 Q2 2014 Q2 2015 Q2 2016 Q2Job Creation 9,883 9,225 9,734 10,283 9,895New Hires 32,399 31,684 31,826 33,688 33,877Separations 34,648 36,041 33,245 34,467 35,401Turnover 9.1% 9.3% 9.2% 9.4% 9.8%Source: U.S. Census Bureau, Center for Economic Studies, LEHDJob Creation: Estimated number of jobs gained at firms throughout the quarter.New Hires: Estimated number of workers who started a new job.Separations: Estimated number of workers whose job with a given employer ended in the specified quarter.Turnovers: The rate at which stable jobs begin and end.Central Arkansas LWDA does not include the City of Little Rock
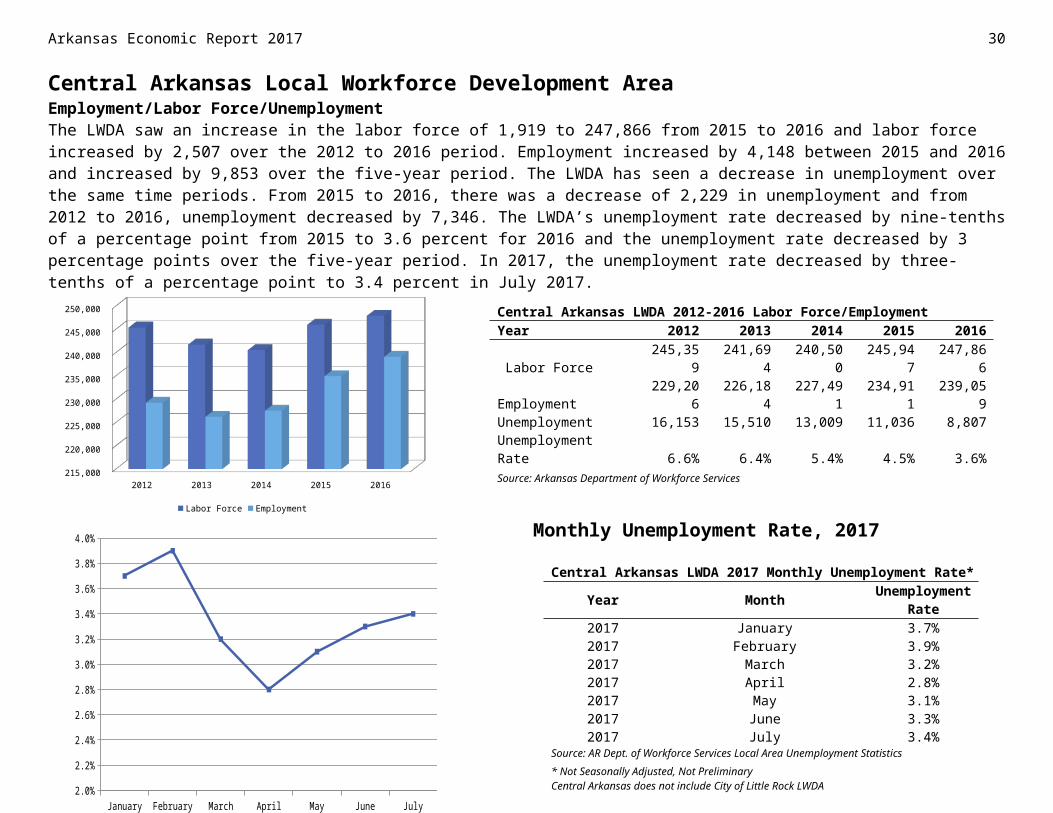
Central Arkansas Local Workforce Development AreaEmployment/Labor Force/UnemploymentThe LWDA saw an increase in the labor force of 1,919 to 247,866 from 2015 to 2016 and labor force increased by 2,507 over the 2012 to 2016 period. Employment increased by 4,148 between 2015 and 2016 and increased by 9,853 over the five-year period. The LWDA has seen a decrease in unemployment over the same time periods. From 2015 to 2016, there was a decrease of 2,229 in unemployment and from 2012 to 2016, unemployment decreased by 7,346. The LWDA’s unemployment rate decreased by nine-tenths of a percentage point from 2015 to 3.6 percent for 2016 and the unemployment rate decreased by 3 percentage points over the five-year period. In 2017, the unemployment rate decreased by three-tenths of a percentage point to 3.4 percent in July 2017.
2012 2013 2014 2015 2016 215,000
220,000
225,000
230,000
235,000
240,000
245,000
250,000
Labor Force Employment
Monthly Unemployment Rate, 2017
21Arkansas Economic Report 2017
Central Arkansas LWDA 2012-2016 Labor Force/EmploymentYear 2012 2013 2014 2015 2016 Labor Force 245,359 241,694 240,500 245,947 247,866Employment 229,206 226,184 227,491 234,911 239,059Unemployment 16,153 15,510 13,009 11,036 8,807Unemployment Rate 6.6% 6.4% 5.4% 4.5% 3.6%Source: Arkansas Department of Workforce Services
Central Arkansas LWDA 2017 Monthly Unemployment Rate*
Year Month Unemployment Rate
2017 January 3.7%2017 February 3.9%2017 March 3.2%2017 April 2.8%2017 May 3.1%2017 June 3.3%2017 July 3.4%
Source: AR Dept. of Workforce Services Local Area Unemployment Statistics* Not Seasonally Adjusted, Not PreliminaryCentral Arkansas does not include City of Little Rock LWDA
Arkansas Economic Report 2017 22
Central Arkansas Local Workforce Development Area WagesWith an estimated employment of 4,062, Combined Food Preparation and Serving Workers, Including Fast Food was the largest
occupation in the LWDA in 2016, with an estimated average wage of $19,110. Cashiers had the next largest estimated employment with 3,227, earning an estimated entry wage of $19,507. General and Operations Managers had the largest estimated experienced wage of all the occupations on the 10 Largest Occupations List at $96,943.
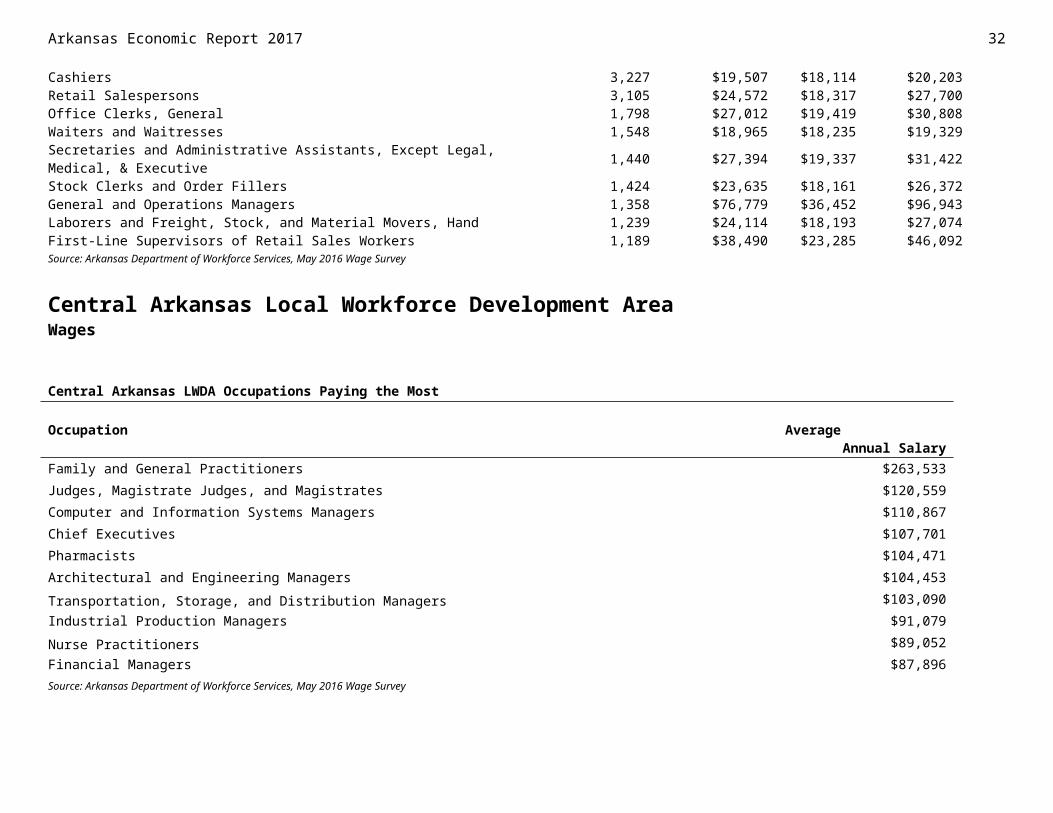
Family and General Practitioners, with an estimated average annual salary of $263,533, led the Occupations Paying the Most list in 2016. Occupations on the list were mixed with Financial Managers finishing the list, earning an average annual salary of $87,896.
Employers of all sizes had a median wage estimate of $29,194 in 2016 with an estimated experienced wage of $46,146. Employers with 50 to 99 employees had an estimated entry wage of $19,104. Estimated mean wages ranged from $33,730 for employers with 0 to 49 employees to $48,178 for employers with 500 or more employees. Of the 83,384 estimated employees in the Area, 11,374 employees made an hourly wage in the $12.00 to $14.99 range. Employees making less than $8.50 an hour totaled 6,793. Employees making $8.50 to $9.99 an hour totaled 16,719. Note: Wage data for Central Arkansas LWDA does not include Pulaski County.
Central Arkansas LWDA Wages of the 10 Largest Occupations
Occupation Estimated Employment
Average Wage
Entry Wage
Experienced Wage
Combined Food Preparation and Serving Workers, Including Fast Food 4,062 $19,110 $18,244 $19,542Cashiers 3,227 $19,507 $18,114 $20,203Retail Salespersons 3,105 $24,572 $18,317 $27,700
January February March April May June July2.0%
2.2%
2.4%
2.6%
2.8%
3.0%
3.2%
3.4%
3.6%
3.8%
4.0%
* Private Sector Wages OnlySource: Arkansas Department of Workforce Services, Quarterly Census of Employment and Wages
Office Clerks, General 1,798 $27,012 $19,419 $30,808Waiters and Waitresses 1,548 $18,965 $18,235 $19,329Secretaries and Administrative Assistants, Except Legal, Medical, & Executive 1,440 $27,394 $19,337 $31,422Stock Clerks and Order Fillers 1,424 $23,635 $18,161 $26,372General and Operations Managers 1,358 $76,779 $36,452 $96,943Laborers and Freight, Stock, and Material Movers, Hand 1,239 $24,114 $18,193 $27,074First-Line Supervisors of Retail Sales Workers 1,189 $38,490 $23,285 $46,092Source: Arkansas Department of Workforce Services, May 2016 Wage Survey
Central Arkansas Local Workforce Development Area Wages
Central Arkansas LWDA Occupations Paying the Most
Occupation AverageAnnual Salary
Family and General Practitioners $263,533Judges, Magistrate Judges, and Magistrates $120,559Computer and Information Systems Managers $110,867Chief Executives $107,701Pharmacists $104,471Architectural and Engineering Managers $104,453Transportation, Storage, and Distribution Managers $103,090Industrial Production Managers $91,079Nurse Practitioners $89,052Financial Managers $87,896Source: Arkansas Department of Workforce Services, May 2016 Wage Survey
23Arkansas Economic Report 2017
Arkansas Economic Report 2017 24
Central Arkansas Local Workforce Development AreaWages
Central Arkansas Wage Estimates by Employer Size
All Sizes
0-49 Employees
50-99 Employees
100-249 Emplo...
250-499 Emplo...
500+ Employees
$0
$5,000
$10,000
$15,000
$20,000
$25,000
$30,000
$35,000
$40,000
$45,000
$50,000
$55,000Entry Mean
Central Arkansas LWDA Number of Employees by Hourly Wage RateTotal 83,384<$8.50 6,793$8.50-$9.99 16,719$10.00-$11.99 10,312$12.00-$14.99 11,374$15.00-$19.99 14,020
Central Arkansas LWDA Wage Estimates by Employer SizeType of Wage Mean Median Entry ExperiencedAll Sizes $37,135 $29,194 $19,113 $46,1460-49 Employees $33,730 $25,854 $18,371 $41,40950-99 Employees $36,916 $27,553 $19,104 $45,855100-249 Employees $34,432 $26,986 $19,005 $42,145250-499 Employees $38,041 $32,951 $19,663 $47,230500+ Employees $48,178 $44,563 $24,347 $60,093Source: Arkansas Department of Workforce Services, May 2016 Wage Survey
$20.00-$24.99 8,698$25.00+ 15,468Source: Arkansas Department of Workforce Services, May 2016 Wage Survey
Central Arkansas Number of Employees by Hourly Wage Rate
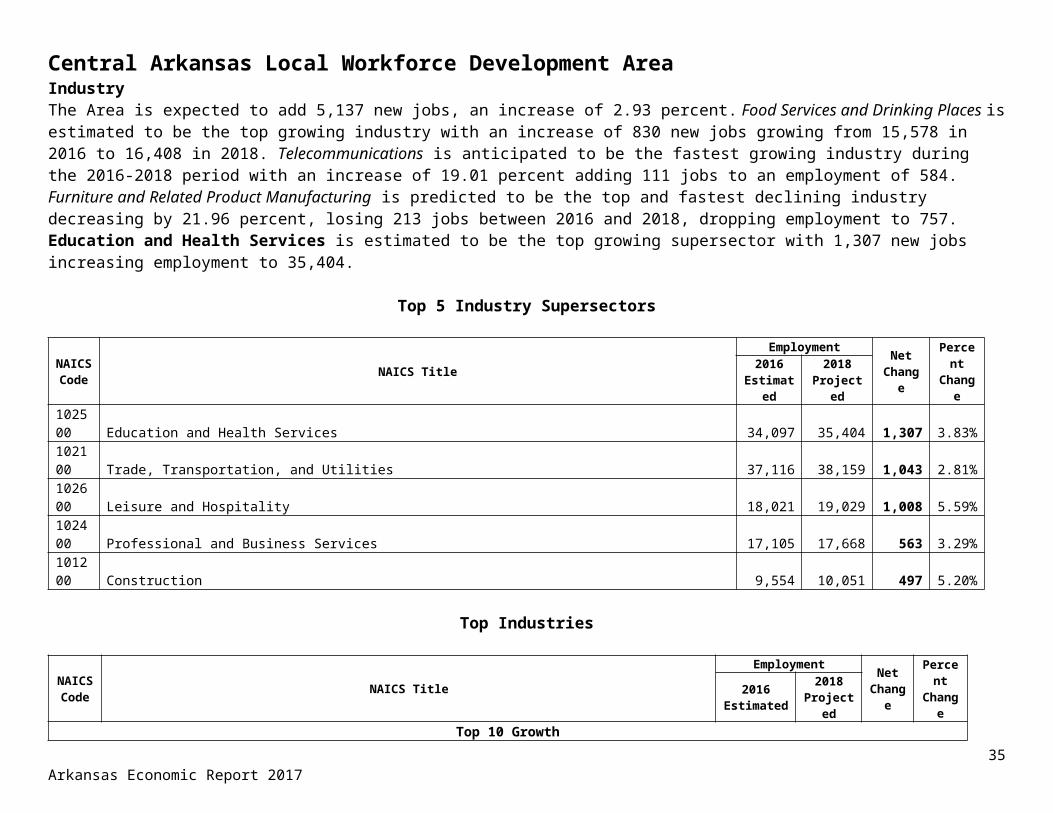
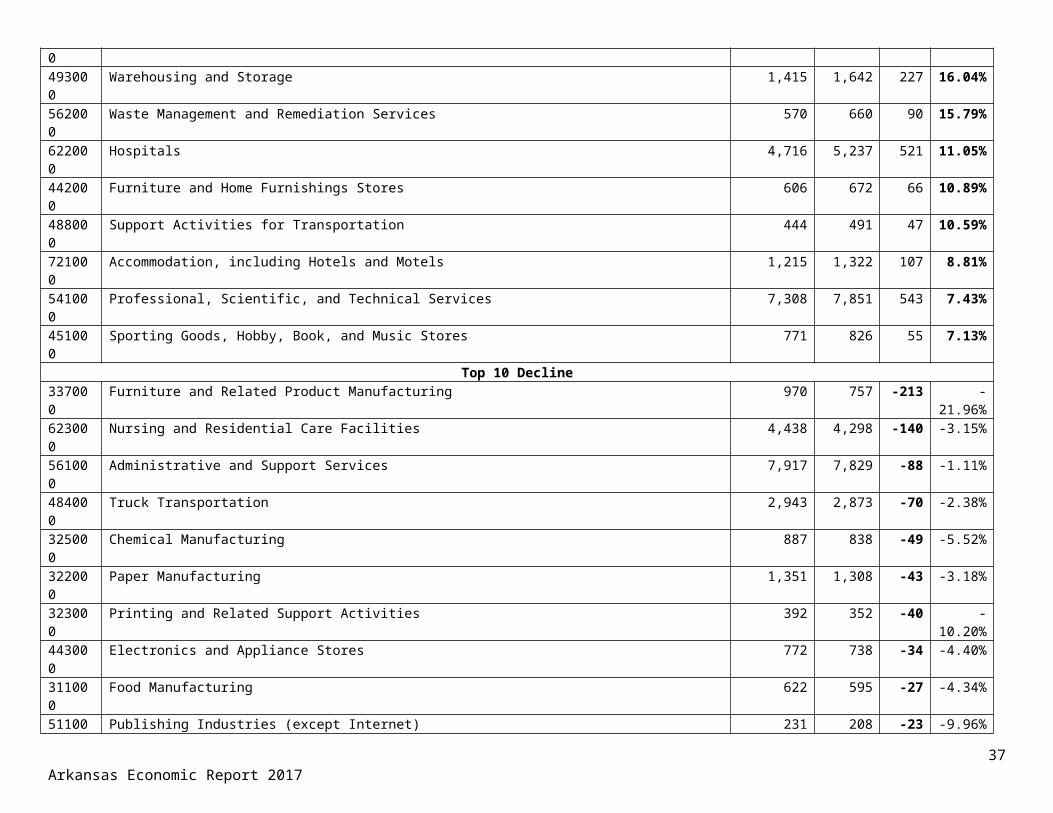
Central Arkansas Local Workforce Development AreaIndustryThe Area is expected to add 5,137 new jobs, an increase of 2.93 percent. Food Services and Drinking Places is estimated to be the top growing industry with an increase of 830 new jobs growing from 15,578 in 2016 to 16,408 in 2018. Telecommunications is anticipated to be the fastest growing industry during the 2016-2018 period with an increase of 19.01 percent adding 111 jobs to an employment of 584. Furniture and Related Product Manufacturing is predicted to be the top and fastest declining industry decreasing by 21.96 percent, losing 213 jobs between 2016 and 2018, dropping employment to 757. Education and Health Services is estimated to be the top growing supersector with 1,307 new jobs increasing employment to 35,404.
Top 5 Industry Supersectors
NAICS Code NAICS Title
Employment Net Change
Percent Change2016
Estimated2018
Projected102500 Education and Health Services 34,097 35,404 1,307 3.83%102100 Trade, Transportation, and Utilities 37,116 38,159 1,043 2.81%102600 Leisure and Hospitality 18,021 19,029 1,008 5.59%102400 Professional and Business Services 17,105 17,668 563 3.29%101200 Construction 9,554 10,051 497 5.20%
25Arkansas Economic Report 2017
<$8.50
$8.50-$9.99$10.00-$11.99$12.00-$14.99$15.00-$19.99$20.00-$24.99
$25.00+
0 2,000 4,000 6,000 8,000 10,000 12,000 14,000 16,000 18,000
Employees
Arkansas Economic Report 2017 26
Top Industries
NAICS Code NAICS Title
Employment Net Change
Percent Change2016
Estimated2018
ProjectedTop 10 Growth
722000 Food Services and Drinking Places 15,578 16,408 830 5.33%541000 Professional, Scientific, and Technical Services 7,308 7,851 543 7.43%622000 Hospitals 4,716 5,237 521 11.05%238000 Specialty Trade Contractors 6,734 7,084 350 5.20%621000 Ambulatory Health Care Services 6,084 6,422 338 5.56%624000 Social Assistance 5,468 5,766 298 5.45%813000 Religious, Grantmaking, Civic, Professional, and Similar Organizations 5,300 5,591 291 5.49%611000 Educational Services 13,391 13,681 290 2.17%493000 Warehousing and Storage 1,415 1,642 227 16.04%441000 Motor Vehicle and Parts Dealers 3,788 3,969 181 4.78%
Central Arkansas Local Workforce Development Area Top Industries
NAICS Code
NAICS TitleEmployment
Net Change
Percent Change
2016 Estimated
2018 Projected
Top 10 Fastest Growth517000 Telecommunications 584 695 111 19.01%518000 Data Processing, Hosting and Related Services 193 226 33 17.10%493000 Warehousing and Storage 1,415 1,642 227 16.04%562000 Waste Management and Remediation Services 570 660 90 15.79%622000 Hospitals 4,716 5,237 521 11.05%442000 Furniture and Home Furnishings Stores 606 672 66 10.89%488000 Support Activities for Transportation 444 491 47 10.59%721000 Accommodation, including Hotels and Motels 1,215 1,322 107 8.81%541000 Professional, Scientific, and Technical Services 7,308 7,851 543 7.43%451000 Sporting Goods, Hobby, Book, and Music Stores 771 826 55 7.13%
Top 10 Decline337000 Furniture and Related Product Manufacturing 970 757 -213 -21.96%623000 Nursing and Residential Care Facilities 4,438 4,298 -140 -3.15%561000 Administrative and Support Services 7,917 7,829 -88 -1.11%484000 Truck Transportation 2,943 2,873 -70 -2.38%325000 Chemical Manufacturing 887 838 -49 -5.52%
322000 Paper Manufacturing 1,351 1,308 -43 -3.18%323000 Printing and Related Support Activities 392 352 -40 -10.20%443000 Electronics and Appliance Stores 772 738 -34 -4.40%311000 Food Manufacturing 622 595 -27 -4.34%511000 Publishing Industries (except Internet) 231 208 -23 -9.96%
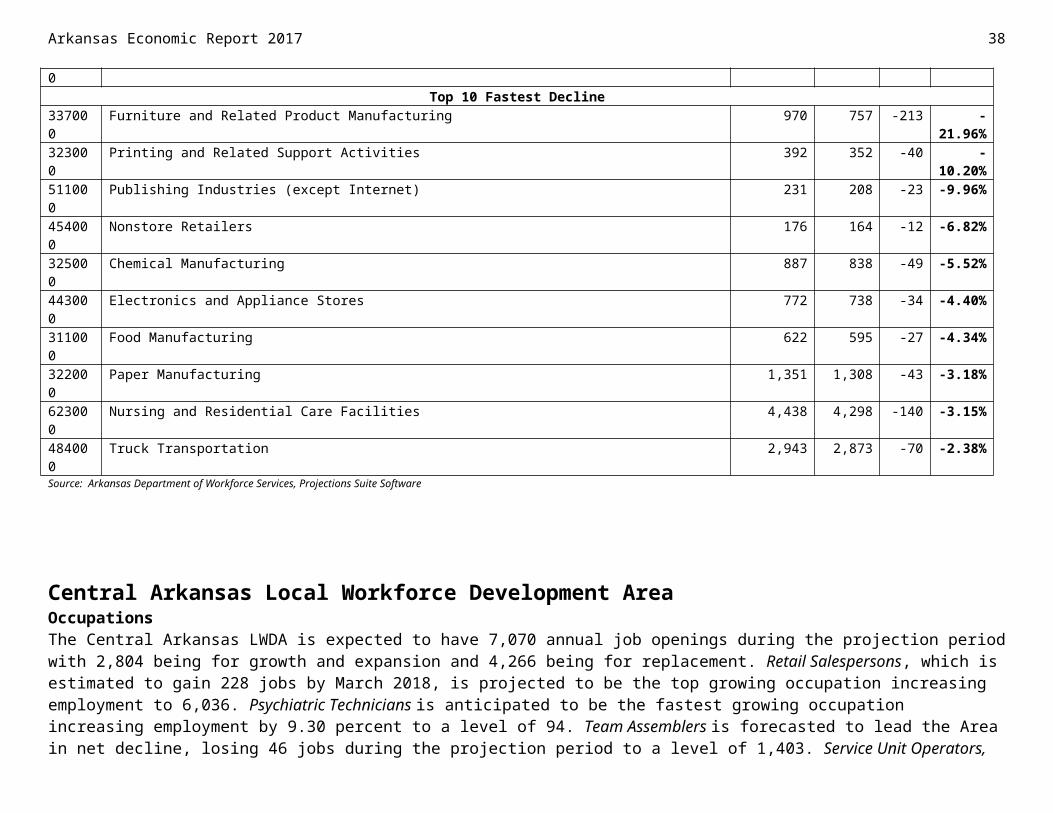
Top 10 Fastest Decline337000 Furniture and Related Product Manufacturing 970 757 -213 -21.96%323000 Printing and Related Support Activities 392 352 -40 -10.20%511000 Publishing Industries (except Internet) 231 208 -23 -9.96%454000 Nonstore Retailers 176 164 -12 -6.82%325000 Chemical Manufacturing 887 838 -49 -5.52%443000 Electronics and Appliance Stores 772 738 -34 -4.40%311000 Food Manufacturing 622 595 -27 -4.34%322000 Paper Manufacturing 1,351 1,308 -43 -3.18%623000 Nursing and Residential Care Facilities 4,438 4,298 -140 -3.15%484000 Truck Transportation 2,943 2,873 -70 -2.38%Source: Arkansas Department of Workforce Services, Projections Suite Software
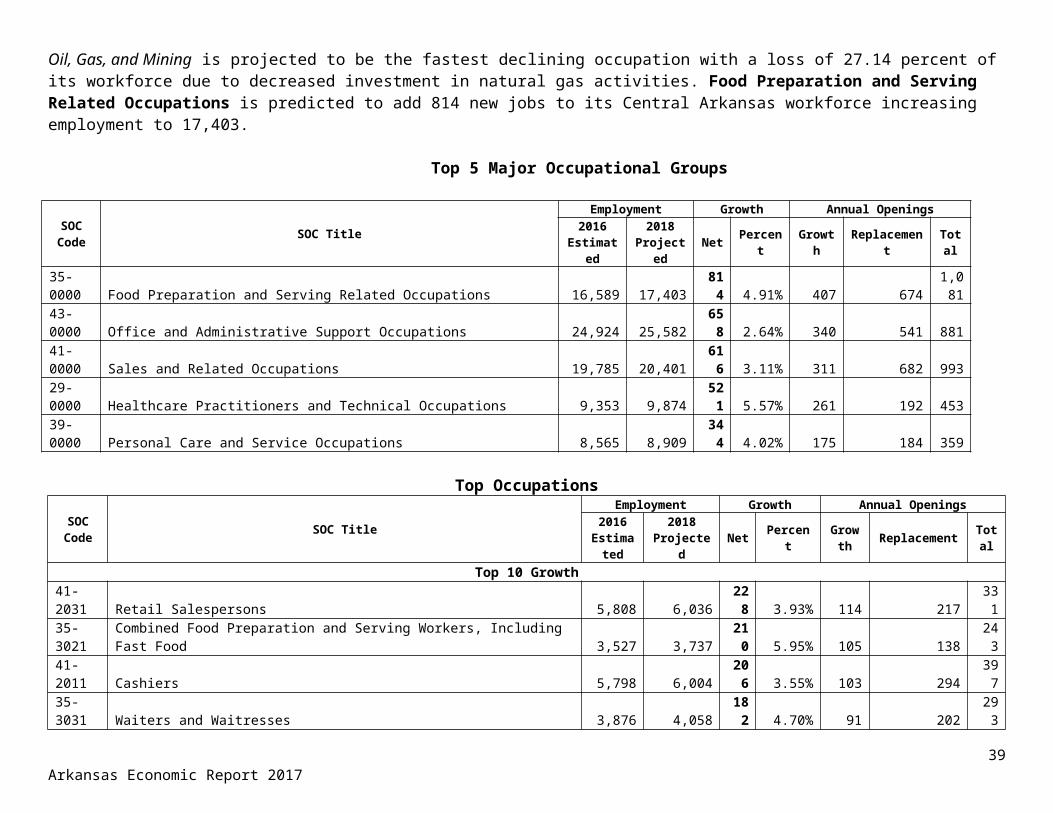
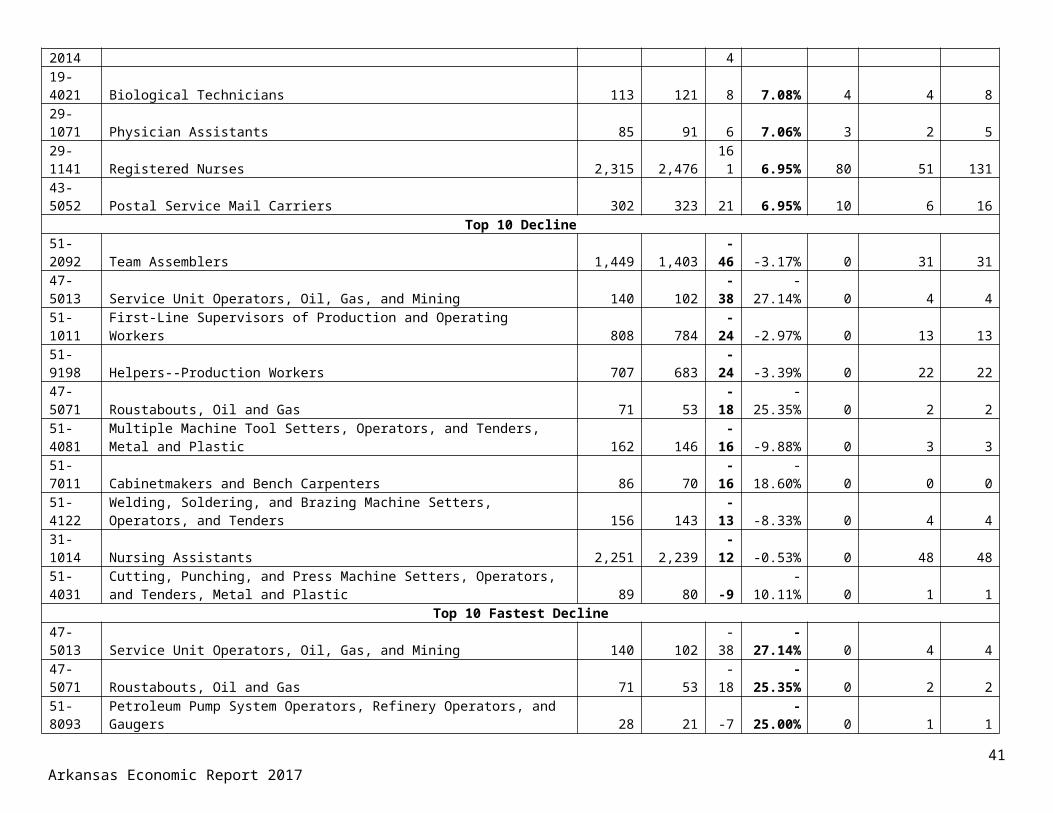
Central Arkansas Local Workforce Development Area Occupations The Central Arkansas LWDA is expected to have 7,070 annual job openings during the projection period with 2,804 being for growth and expansion and 4,266 being for replacement. Retail Salespersons, which is estimated to gain 228 jobs by March 2018, is projected to be the top growing occupation increasing employment to 6,036. Psychiatric Technicians is anticipated to be the fastest growing occupation increasing employment by 9.30 percent to a level of 94. Team Assemblers is forecasted to lead the Area in net decline, losing 46 jobs during the projection period to a level of 1,403. Service Unit Operators, Oil, Gas, and Mining is projected to be the fastest declining occupation with a loss of 27.14 percent of its workforce due to decreased investment in natural gas activities. Food Preparation and Serving Related Occupations is predicted to add 814 new jobs to its Central Arkansas workforce increasing employment to 17,403.
Top 5 Major Occupational Groups
SOC Code SOC Title
Employment Growth Annual Openings2016
Estimated2018
Projected Net Percent Growth Replacement Total
35-0000 Food Preparation and Serving Related Occupations 16,589 17,403 814 4.91% 407 6741,08
143-0000 Office and Administrative Support Occupations 24,924 25,582 658 2.64% 340 541 88141-0000 Sales and Related Occupations 19,785 20,401 616 3.11% 311 682 99329-0000 Healthcare Practitioners and Technical Occupations 9,353 9,874 521 5.57% 261 192 45339-0000 Personal Care and Service Occupations 8,565 8,909 344 4.02% 175 184 359
27Arkansas Economic Report 2017
Arkansas Economic Report 2017 28
Top OccupationsSOC Code SOC Title
Employment Growth Annual Openings2016
Estimated2018
Projected Net Percent Growth Replacement Total
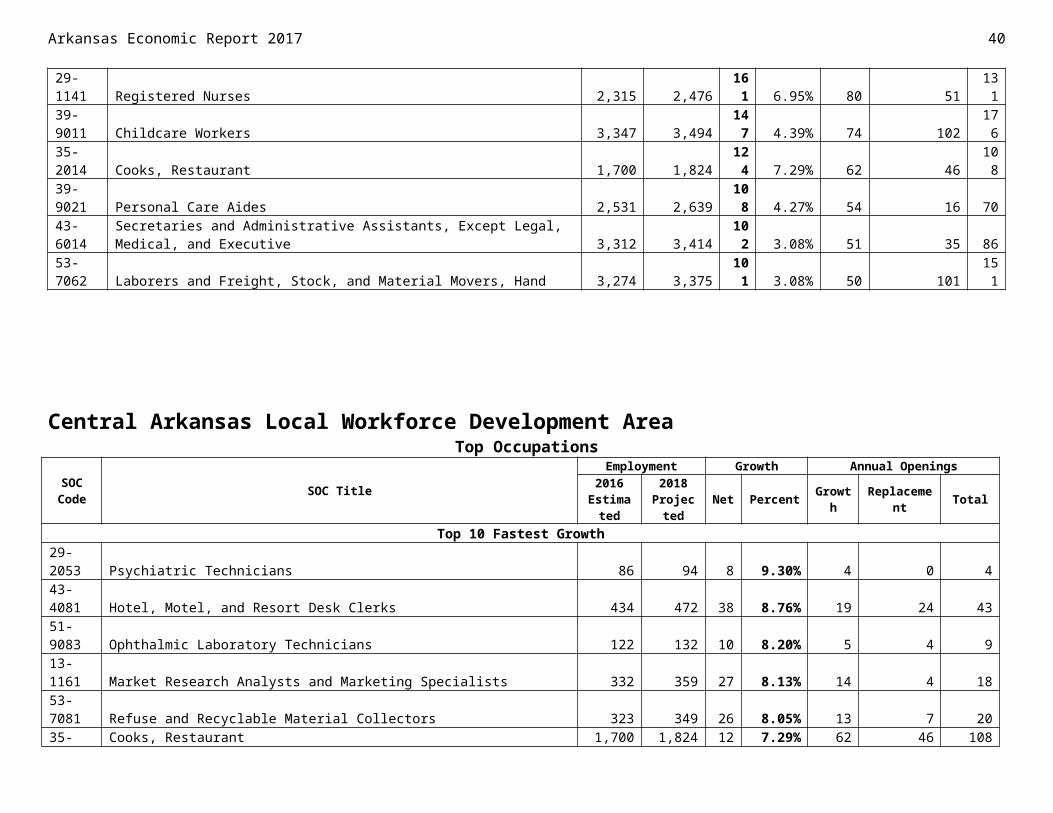
Top 10 Growth41-2031 Retail Salespersons 5,808 6,036 228 3.93% 114 217 33135-3021 Combined Food Preparation and Serving Workers, Including Fast Food 3,527 3,737 210 5.95% 105 138 24341-2011 Cashiers 5,798 6,004 206 3.55% 103 294 39735-3031 Waiters and Waitresses 3,876 4,058 182 4.70% 91 202 29329-1141 Registered Nurses 2,315 2,476 161 6.95% 80 51 13139-9011 Childcare Workers 3,347 3,494 147 4.39% 74 102 17635-2014 Cooks, Restaurant 1,700 1,824 124 7.29% 62 46 10839-9021 Personal Care Aides 2,531 2,639 108 4.27% 54 16 7043-6014 Secretaries and Administrative Assistants, Except Legal, Medical, and Executive 3,312 3,414 102 3.08% 51 35 8653-7062 Laborers and Freight, Stock, and Material Movers, Hand 3,274 3,375 101 3.08% 50 101 151
Central Arkansas Local Workforce Development Area Top Occupations
SOC Code SOC Title
Employment Growth Annual Openings2016
Estimated2018
Projected Net Percent Growth Replacement Total
Top 10 Fastest Growth29-2053 Psychiatric Technicians 86 94 8 9.30% 4 0 443-4081 Hotel, Motel, and Resort Desk Clerks 434 472 38 8.76% 19 24 4351-9083 Ophthalmic Laboratory Technicians 122 132 10 8.20% 5 4 913-1161 Market Research Analysts and Marketing Specialists 332 359 27 8.13% 14 4 1853-7081 Refuse and Recyclable Material Collectors 323 349 26 8.05% 13 7 2035-2014 Cooks, Restaurant 1,700 1,824 124 7.29% 62 46 10819-4021 Biological Technicians 113 121 8 7.08% 4 4 829-1071 Physician Assistants 85 91 6 7.06% 3 2 529-1141 Registered Nurses 2,315 2,476 161 6.95% 80 51 13143-5052 Postal Service Mail Carriers 302 323 21 6.95% 10 6 16
Top 10 Decline51-2092 Team Assemblers 1,449 1,403 -46 -3.17% 0 31 3147-5013 Service Unit Operators, Oil, Gas, and Mining 140 102 -38 -27.14% 0 4 451-1011 First-Line Supervisors of Production and Operating Workers 808 784 -24 -2.97% 0 13 1351-9198 Helpers--Production Workers 707 683 -24 -3.39% 0 22 2247-5071 Roustabouts, Oil and Gas 71 53 -18 -25.35% 0 2 251-4081 Multiple Machine Tool Setters, Operators, and Tenders, Metal and Plastic 162 146 -16 -9.88% 0 3 351-7011 Cabinetmakers and Bench Carpenters 86 70 -16 -18.60% 0 0 051-4122 Welding, Soldering, and Brazing Machine Setters, Operators, and Tenders 156 143 -13 -8.33% 0 4 4
31-1014 Nursing Assistants 2,251 2,239 -12 -0.53% 0 48 4851-4031 Cutting, Punching, and Press Machine Setters, Operators, and Tenders, Metal and Plastic 89 80 -9 -10.11% 0 1 1
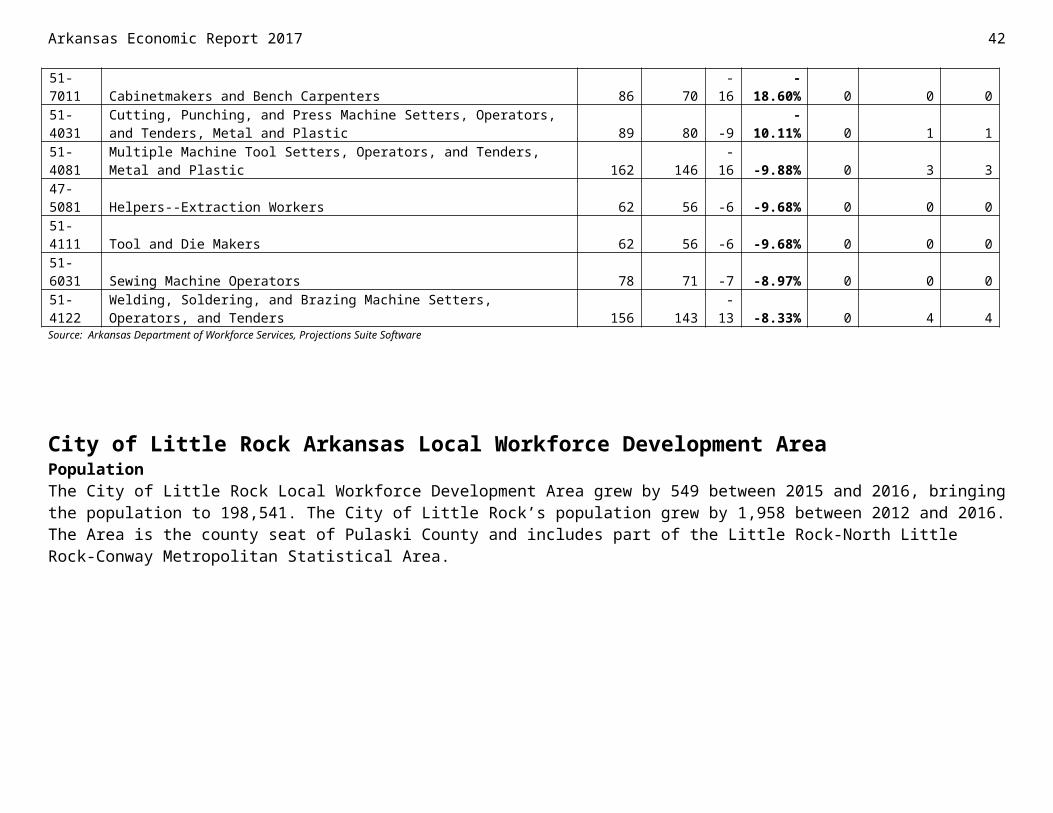
Top 10 Fastest Decline47-5013 Service Unit Operators, Oil, Gas, and Mining 140 102 -38 -27.14% 0 4 447-5071 Roustabouts, Oil and Gas 71 53 -18 -25.35% 0 2 251-8093 Petroleum Pump System Operators, Refinery Operators, and Gaugers 28 21 -7 -25.00% 0 1 151-7011 Cabinetmakers and Bench Carpenters 86 70 -16 -18.60% 0 0 051-4031 Cutting, Punching, and Press Machine Setters, Operators, and Tenders, Metal and Plastic 89 80 -9 -10.11% 0 1 151-4081 Multiple Machine Tool Setters, Operators, and Tenders, Metal and Plastic 162 146 -16 -9.88% 0 3 347-5081 Helpers--Extraction Workers 62 56 -6 -9.68% 0 0 051-4111 Tool and Die Makers 62 56 -6 -9.68% 0 0 051-6031 Sewing Machine Operators 78 71 -7 -8.97% 0 0 051-4122 Welding, Soldering, and Brazing Machine Setters, Operators, and Tenders 156 143 -13 -8.33% 0 4 4Source: Arkansas Department of Workforce Services, Projections Suite Software
City of Little Rock Arkansas Local Workforce Development AreaPopulationThe City of Little Rock Local Workforce Development Area grew by 549 between 2015 and 2016, bringing the population to 198,541. The City of Little Rock’s population grew by 1,958 between 2012 and 2016. The Area is the county seat of Pulaski County and includes part of the Little Rock-North Little Rock-Conway Metropolitan Statistical Area.
29Arkansas Economic Report 2017
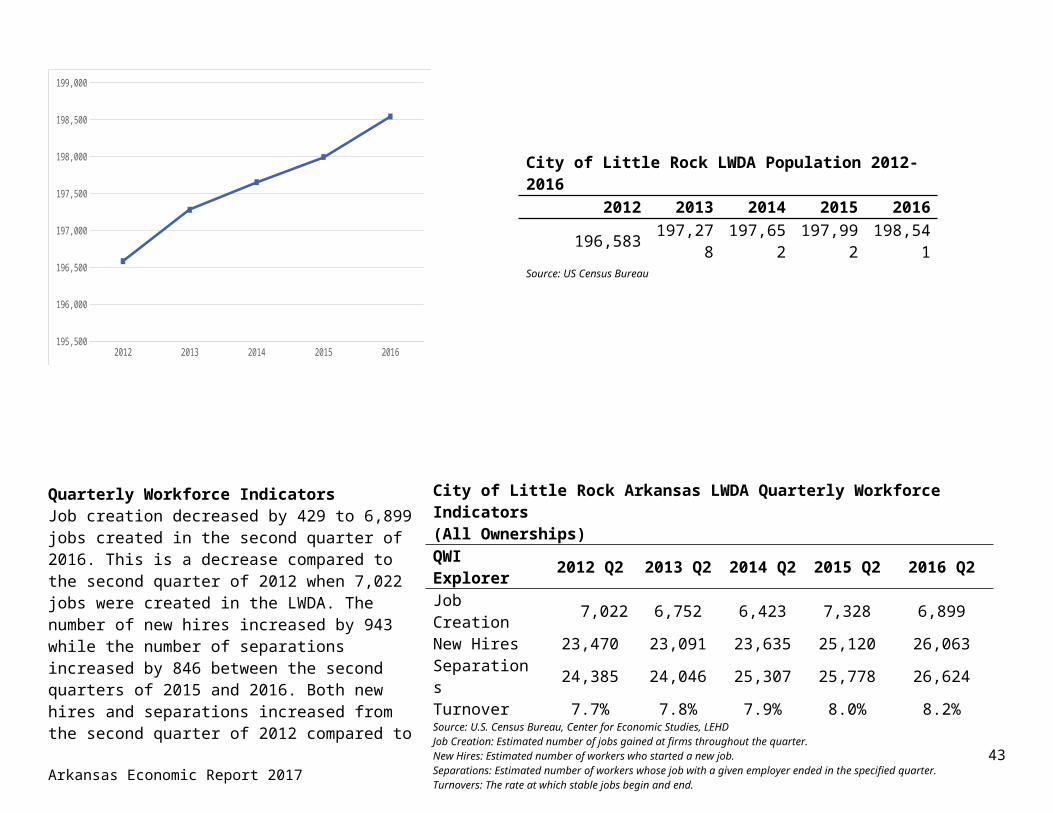
City of Little Rock LWDA Population 2012-20162012 2013 2014 2015 2016
196,583 197,278 197,652 197,992 198,541Source: US Census Bureau
Arkansas Economic Report 2017 30
Quarterly Workforce IndicatorsJob creation decreased by 429 to 6,899 jobs created in the second quarter of 2016. This is a decrease compared to the second quarter of 2012 when 7,022 jobs were created in the LWDA. The number of new hires increased by 943 while the number of separations increased by 846 between the second quarters of 2015 and 2016. Both new hires and separations increased from the second quarter of 2012 compared to second quarter 2016. The turnover rate increased from the second quarter of 2015 to 2016 by two-tenths of a percentage point to 8.2 percent.
2012 2013 2014 2015 2016195,500
196,000
196,500
197,000
197,500
198,000
198,500
199,000
City of Little Rock Arkansas LWDA Quarterly Workforce Indicators(All Ownerships)QWI Explorer 2012 Q2 2013 Q2 2014 Q2 2015 Q2 2016 Q2Job Creation 7,022 6,752 6,423 7,328 6,899New Hires 23,470 23,091 23,635 25,120 26,063Separations 24,385 24,046 25,307 25,778 26,624Turnover 7.7% 7.8% 7.9% 8.0% 8.2%Source: U.S. Census Bureau, Center for Economic Studies, LEHDJob Creation: Estimated number of jobs gained at firms throughout the quarter.New Hires: Estimated number of workers who started a new job.Separations: Estimated number of workers whose job with a given employer ended in the specified quarter.Turnovers: The rate at which stable jobs begin and end.
City of Little Rock Arkansas Local Workforce Development AreaEmployment/Labor Force/UnemploymentThe Labor Force increased in the LWDA by 813 from 2015 to 2016, and saw a decrease of 802 between 2012 and 2016. Employment increased by 1,746 from 2015 to 2016 and by 2,535 from 2012 to 2016. Unemployment and the unemployment rate decreased between 2015 and 2016, with unemployment decreasing by 933 and the unemployment rate decreasing by one percentage point to 3.5 in 2016. The unemployment rate decreased by three and four-tenths percentage points from 2012 to 2016. The Area unemployment rate continued to decline through July 2017, decreasing by two-tenths of a percentage point from January 2017 to 3.4 percent.
2012 2013 2014 2015 2016 84,000
86,000
88,000
90,000
92,000
94,000
96,000
98,000
Labor Force Employment
Monthly Unemployment Rate, 2017
31Arkansas Economic Report 2017
City of Little Rock LWDA 2012-2016 Labor Force/EmploymentYear 2012 2013 2014 2015 2016Labor Force 97,414 95,137 93,868 95,799 96,612Employment 90,672 88,879 88,712 91,461 93,207Unemployment 6,742 6,258 5,156 4,338 3,405Unemployment Rate 6.9% 6.6% 5.5% 4.5% 3.5%Source: Arkansas Department of Workforce Services
City of Little Rock LWDA 2017 Monthly Unemployment Rate*
Year Month Unemployment Rate
2017 January 3.6%2017 February 3.8%2017 March 3.3%2017 April 2.8%2017 May 3.1%2017 June 3.3%2017 July 3.4%
Source: AR Dept. of Workforce Services Local Area Unemployment Statistics*Not Seasonally Adjusted, Not Preliminary

Arkansas Economic Report 2017 32
City Of Little Rock Arkansas Local Workforce Development AreaWagesRegistered Nurses was the largest occupation in 2016 with 8,250 estimated employees with an estimated entry wage of $47,755. Retail Salespersons was the second largest occupation with an estimated employment of 8,232 and an estimated experienced wage of $26,367. General and Operations Managers had the highest estimated experienced wage of the 10 largest occupations at $125,923 in 2016.
Obstetricians and Gynecologists topped the list of Occupations Paying the Most, with an average annual salary of $261,724 for the Area. With an estimated average annual salary of $234,946, Family and General Practitioners ranked second on the list. Architectural and Engineering Mangers completed the list, earning $116,118 annually in 2016.
The City of Little Rock LWDA had an estimated median wage of $34,883 for employers of all sizes in 2016. Employers with 100 to 249 employees had an estimated entry wage of $19,896. Estimated mean wages ranged from $39,696 for employers with 100 to 249 employees to $54,043 for employers with 500 or more employees in the LWDA.
The Area’s total number of estimated employees by hourly wage was 254,497 with 29,657 estimated employees earning $20.00 to $24.99 an hour. The number of employees earning from $8.50 to0 $9.99 was estimated at 36,032. The number of employees earning less than $8.50 an hour was estimated at 14,166 in 2016. Note: Wage data for the City of Little Rock LWDA includes all of Pulaski County.
January February March April May June July2.0%
2.2%
2.4%
2.6%
2.8%
3.0%
3.2%
3.4%
3.6%
3.8%
4.0%
* Private Sector Wages OnlySource: Arkansas Department of Workforce Services, Quarterly Census of Employment and Wages
City of Little Rock LWDA Wages of 10 Largest Occupations
OccupationEstimated
Employment
Average Wage
Entry Wage
Experienced Wage
Registered Nurses 8,250 $62,472 $47,755 $69,831
Retail Salespersons 8,232 $23,642 $18,192 $26,367
Customer Service Representatives 6,547 $33,590 $24,087 $38,342
Office Clerks, General 5,934 $27,984 $19,911 $32,020
Cashiers 5,760 $20,534 $18,163 $21,720
Heavy and Tractor-Trailer Truck Drivers 5,043 $42,005 $28,057 $48,979
General and Operations Managers 4,852 $97,490 $40,624 $125,923
Laborers and Freight, Stock, and Material Movers, Hand 4,820 $25,893 $19,418 $29,130
Waiters and Waitresses 4,686 $20,778 $18,112 $22,110
First-Line Supervisors of Office and Administrative Support Workers 4,155 $51,577
$33,943 $60,395
Source: Arkansas Department of Workforce Services, May 2016 Wage Survey
City Of Little Rock Arkansas Local Workforce Development AreaWages
City of Little Rock LWDA Occupations Paying the Most
OccupationAverage Annual
SalaryObstetricians and Gynecologists $261,724Family and General Practitioners $234,946Surgeons $224,800Health Specialties Teachers, Postsecondary $170,034Nurse Anesthetists $152,929Dentists, General $138,548
33Arkansas Economic Report 2017
Arkansas Economic Report 2017 34
Advertising and Promotions Managers $138,380Medical Scientists, Except Epidemiologists $135,602Psychiatrists $126,013Architectural and Engineering Managers $116,118Source: Arkansas Department of Workforce Services, May 2016 Wage Survey
City Of Little Rock Arkansas Local Workforce Development AreaWages
City of Little Rock Wage Estimates by Employer Size
City of Little Rock LWDA Wage Estimates by Employer SizeType of Wage Mean Median Entry ExperiencedAll Sizes $45,027 $34,883 $20,549 $57,2660-49 Employees $41,417 $30,273 $19,275 $52,48850-99 Employees $41,641 $30,716 $19,288 $52,818100-249 Employees $39,696 $29,971 $19,896 $49,596250-499 Employees $41,600 $32,903 $20,837 $51,982500+ Employees $54,043 $46,042 $26,077 $68,025Source: Arkansas Department of Workforce Services, May 2016 Wage Survey

All Sizes
0-49 Employees
50-99 Employees
100-249 Employees
250-499 Employees
500+ Employees
$0
$10,000
$20,000
$30,000
$40,000
$50,000
$60,000Entry Mean
City of Little Rock Number of Employees by Hourly Wage Rate
35Arkansas Economic Report 2017
Arkansas Economic Report 2017 36
<$8.50
$8.50-$9.99
$10.00-$11.99
$12.00-$14.99
$15.00-$19.99
$20.00-$24.99
$25.00+
0 10,000 20,000 30,000 40,000 50,000 60,000 70,000
City of Little Rock Arkansas Local Workforce Development AreaIndustryThe City of Little Rock LWDA is expected to grow by 5,138 jobs between 2016 and 2018, or an increase of 2.64 percent. Food Services and Drinking Places is projected to be the top growing industry adding 524 jobs between 2016 and 2018 raising employment to 11,837. Construction of Buildings is anticipated to experience strong growth gain of 18.20 percent making it the fastest growing industry in the Area moving from 1,423 jobs in 2016 to 1,682 in 2018. Federal Government, Excluding Post Office, however, could see a decline in jobs with a loss of 117 bringing employment
Employees
City of Little Rock LWDA Number of Employees by Hourly Wage RateTotal 254,497<$8.50 14,166$8.50-$9.99 36,032$10.00-$11.99 26,773$12.00-$14.99 33,378$15.00-$19.99 44,525$20.00-$24.99 29,657$25.00+ 69,966Source: Arkansas Department of Workforce Services, May 2016 Wage Survey

down to 3,555. Nonmetallic Mineral Product Manufacturing could lose 10.42 percent of its workforce making it the fastest declining industry, moving employment down to 129. Trade, Transportation, and Utilities is projected to be the top growing major group with an increase of 971 raising employment to 30,261.
Top 5 Industry Supersectors
NAICS Code NAICS TitleEmployment Net
ChangePercent Change2016
Estimated2018
Projected102100 Trade, Transportation, and Utilities 29,290 30,261 971 3.32%102500 Education and Health Services 50,157 51,065 908 1.81%102300 Financial Activities 14,748 15,376 628 4.26%102600 Leisure and Hospitality 14,503 15,096 593 4.09%102400 Professional and Business Services 24,040 24,587 547 2.28%
Top Industries
NAICS Code NAICS TitleEmployment Net
ChangePercent Change2016
Estimated2018
ProjectedTop 10 Growth
722000 Food Services and Drinking Places 11,313 11,837 524 4.63%621000 Ambulatory Health Care Services 9,418 9,912 494 5.25%524000 Insurance Carriers and Related Activities 7,633 8,063 430 5.63%541000 Professional, Scientific, and Technical Services 10,034 10,423 389 3.88%622000 Hospitals 21,160 21,444 284 1.34%236000 Construction of Buildings 1,423 1,682 259 18.20%999200 State Government, Excluding Education and Hospitals 13,013 13,266 253 1.94%484000 Truck Transportation 2,345 2,570 225 9.59%624000 Social Assistance 4,940 5,125 185 3.74%551000 Management of Companies and Enterprises 3,846 3,999 153 3.98%
City of Little Rock Arkansas Local Workforce Development AreaTop Industries
NAICS Code NAICS Title
Employment Net Change
Percent Change2016
Estimated2018
ProjectedTop 10 Fastest Growth
236000 Construction of Buildings 1,423 1,682 259 18.20%112000 Animal Production 30 35 5 16.67%339000 Miscellaneous Manufacturing 223 259 36 16.14%
37Arkansas Economic Report 2017
Arkansas Economic Report 2017 38
333000 Machinery Manufacturing 820 917 97 11.83%237000 Heavy and Civil Engineering Construction 830 911 81 9.76%484000 Truck Transportation 2,345 2,570 225 9.59%512000 Motion Picture and Sound Recording Industries 267 288 21 7.87%481000 Air Transportation 279 300 21 7.53%443000 Electronics and Appliance Stores 432 464 32 7.41%515000 Broadcasting (except Internet) 547 585 38 6.95%
Top 10 Decline999100 Federal Government, Excluding Post Office 3,672 3,555 -117 -3.19%611000 Educational Services 12,139 12,023 -116 -0.96%511000 Publishing Industries (except Internet) 1,280 1,207 -73 -5.70%451000 Sporting Goods, Hobby, Book, and Music Stores 796 735 -61 -7.66%517000 Telecommunications 2,862 2,808 -54 -1.89%323000 Printing and Related Support Activities 700 652 -48 -6.86%326000 Plastics and Rubber Products Manufacturing 479 433 -46 -9.60%814000 Private Households 575 532 -43 -7.48%332000 Fabricated Metal Product Manufacturing 967 936 -31 -3.21%488000 Support Activities for Transportation 475 449 -26 -5.47%
Top 10 Fastest Decline327000 Nonmetallic Mineral Product Manufacturing 144 129 -15 -10.42%326000 Plastics and Rubber Products Manufacturing 479 433 -46 -9.60%451000 Sporting Goods, Hobby, Book, and Music Stores 796 735 -61 -7.66%814000 Private Households 575 532 -43 -7.48%323000 Printing and Related Support Activities 700 652 -48 -6.86%511000 Publishing Industries (except Internet) 1,280 1,207 -73 -5.70%488000 Support Activities for Transportation 475 449 -26 -5.47%332000 Fabricated Metal Product Manufacturing 967 936 -31 -3.21%999100 Federal Government, Excluding Post Office 3,672 3,555 -117 -3.19%517000 Telecommunications 2,862 2,808 -54 -1.89%
Source: Arkansas Department of Workforce Services, Projections Suite Software
City of Little Rock Arkansas Local Workforce Development AreaOccupationsArea employers are expected to have 7,041 annual openings during the projection period. Of these, 4,368 would be for replacement and 2,673 for growth and expansion. Retail Salespersons is estimated to be the top growing occupation adding 167 new jobs increasing employment to 5,265. Medical Appliance Technicians could see an increase of 15.38 percent, making it the fastest growing occupation increasing from 39 jobs in 2016 to 45 in 2018. On the negative side of the economy, Printing Press Operators is predicted to lose the most jobs with a decline of 14 jobs, bringing employment down to 317. Tire Builders could see an 8.93 percent reduction in its workforce, dropping employment to 51. Office and Administrative Support Occupations is forecasted to be the top growing major occupational group adding 601 jobs to bring employment to 33,200.
Top 5 Major Occupational Groups
SOC Code SOC Title
Employment Growth Annual Openings2016
Estimated2018
Projected Net Percent Growth Replacement Total
43-0000 Office and Administrative Support Occupations 32,599 33,200 601 1.84% 318 632 95041-0000 Sales and Related Occupations 20,187 20,761 574 2.84% 296 610 90635-0000 Food Preparation and Serving Related Occupations 12,662 13,151 489 3.86% 246 511 75729-0000 Healthcare Practitioners and Technical Occupations 18,762 19,233 471 2.51% 236 392 62853-0000 Transportation and Material Moving Occupations 10,632 11,068 436 4.10% 234 245 479
Top Occupations
SOC Code SOC Title
Employment Growth Annual Openings2016
Estimated2018
Projected Net Percent Growth Replacement Total
Top 10 Growth41-2031 Retail Salespersons 5,098 5,265 167 3.28% 84 190 27453-3032 Heavy and Tractor-Trailer Truck Drivers 2,487 2,653 166 6.67% 83 40 12329-1141 Registered Nurses 6,489 6,639 150 2.31% 75 143 21843-4051 Customer Service Representatives 4,735 4,883 148 3.13% 74 110 18435-3021 Combined Food Preparation and Serving Workers, Including Fast Food 2,380 2,507 127 5.34% 64 92 15653-7062 Laborers and Freight, Stock, and Material Movers, Hand 2,793 2,911 118 4.22% 59 86 14535-3031 Waiters and Waitresses 2,926 3,039 113 3.86% 56 153 20911-1021 General and Operations Managers 3,050 3,161 111 3.64% 56 72 12839-9021 Personal Care Aides 2,549 2,660 111 4.35% 56 16 7241-3021 Insurance Sales Agents 1,921 2,025 104 5.41% 52 50 102
City of Little Rock Arkansas Local Workforce Development Area Top Occupations
SOC Code SOC Title
Employment Growth Annual Openings2016
Estimated2018
Projected Net Percent Growth Replacement Total
Top 10 Fastest Growing51-9082 Medical Appliance Technicians 39 45 6 15.38% 3 1 451-7011 Cabinetmakers and Bench Carpenters 157 174 17 10.83% 8 2 1049-3042 Mobile Heavy Equipment Mechanics, Except Engines 84 93 9 10.71% 4 2 647-2051 Cement Masons and Concrete Finishers 98 108 10 10.20% 5 2 727-3042 Technical Writers 69 76 7 10.14% 4 2 627-4032 Film and Video Editors 53 58 5 9.43% 2 0 247-1011 First-Line Supervisors of Construction Trades and Extraction Workers 654 715 61 9.33% 30 6 3649-2091 Avionics Technicians 79 86 7 8.86% 4 2 6
39Arkansas Economic Report 2017
Arkansas Economic Report 2017 40
31-2011 Occupational Therapy Assistants 69 75 6 8.70% 3 2 515-2031 Operations Research Analysts 81 88 7 8.64% 4 1 5
Top 10 Decline51-5112 Printing Press Operators 331 317 -14 -4.23% 0 5 525-2021 Elementary School Teachers, Except Special Education 1,102 1,090 -12 -1.09% 0 24 2441-3031 Securities, Commodities, and Financial Services Sales Agents 669 658 -11 -1.64% 0 12 1225-2031 Secondary School Teachers, Except Special and Career/Technical Education 770 761 -9 -1.17% 0 19 1925-2022 Middle School Teachers, Except Special and Career/Technical Education 534 528 -6 -1.12% 0 12 1249-2022 Telecommunications Equipment Installers and Repairers, Except Line Installers 634 629 -5 -0.79% 0 6 651-9197 Tire Builders 56 51 -5 -8.93% 0 2 243-9011 Computer Operators 74 70 -4 -5.41% 0 0 051-5111 Prepress Technicians and Workers 54 50 -4 -7.41% 0 1 151-4081 Multiple Machine Tool Setters, Operators, and Tenders, Metal and Plastic 72 68 -4 -5.56% 0 2 2
Top 10 Fastest Decline51-9197 Tire Builders 56 51 -5 -8.93% 0 2 251-5111 Prepress Technicians and Workers 54 50 -4 -7.41% 0 1 151-4081 Multiple Machine Tool Setters, Operators, and Tenders, Metal and Plastic 72 68 -4 -5.56% 0 2 251-5113 Print Binding and Finishing Workers 54 51 -3 -5.56% 0 1 143-9011 Computer Operators 74 70 -4 -5.41% 0 0 051-5112 Printing Press Operators 331 317 -14 -4.23% 0 5 539-6011 Baggage Porters and Bellhops 80 77 -3 -3.75% 0 2 243-9051 Mail Clerks and Mail Machine Operators, Except Postal Service 119 115 -4 -3.36% 0 2 243-4011 Brokerage Clerks 102 99 -3 -2.94% 0 2 227-3041 Editors 152 149 -3 -1.97% 0 6 6
Source: Arkansas Department of Workforce Services, Projections Suite Software
Eastern Arkansas Local Workforce Development AreaPopulationThe Eastern Arkansas Local Workforce Development Area’s population declined by 1,271 residents between 2015 and 2016 to 120,753 residents. The Area has seen a decrease in population of 5,794 since 2012. The Eastern Arkansas LWDA includes five counties: Crittenden, Cross, Lee, Phillips, and Saint Francis. With Tennessee bordering to the east, Crittenden County is part of the Memphis Metropolitan Statistical Area.
Eastern Arkansas LWDA Quarterly Workforce Indicators(All Ownerships)QWI Explorer 2012 Q2 2013 Q2 2014 Q2 2015 Q2 2016 Q2Job Creation 1,985 1,904 2,050 2,443 1,943New Hires 5,839 5,925 6,668 7,326 7,171Separations 6,572 6,575 7,260 7,706 8,086Turnover 8.8% 9.2% 10.3% 9.8% 10.5%Source: U.S. Census Bureau, Center for Economic Studies, LEHDJob Creation: Estimated number of jobs gained at firms throughout the quarter.New Hires: Estimated number of workers who started a new job.Separations: Estimated number of workers whose job with a given employer ended in the specified quarter.Turnovers: The rate at which stable jobs begin and end.
Quarterly Workforce IndicatorsJob creation decreased in the second quarter of 2016 compared to the second quarter of 2015 by 500 jobs, with 1,943 jobs created. Job creation decreased in the LWDA by 42 when comparing second quarter 2012 to 2016. When comparing the second quarters of 2015 to 2016, new hires decreased by 155 and separations increased by 380. The turnover rate was 10.5 percent during the second quarter of 2016.
41Arkansas Economic Report 2017
2012 2013 2014 2015 2016 116,000
118,000
120,000
122,000
124,000
126,000
128,000 Eastern Arkansas LWDA Population 2012-20162012 2013 2014 2015 2016
126,547 125,058 123,482 122,024 120,753Source: US Census Bureau
Arkansas Economic Report 2017 42
Eastern Arkansas Local Workforce Development AreaEmployment/Labor Force/UnemploymentThe labor force decreased by 431 to 48,230 in 2016 from 2015, and has decreased by 3,393 from 2012 to 2016. Employment increased from 2015 to 2016, gaining 373 workers to 45,873. Unemployment and the unemployment rate saw significant decreases from 2015 to 2016, having 804 fewer unemployed and the unemployment rate dropping by one and sixth-tenths percentage points to 4.9 percent. Over the five-year period, the Area saw the unemployment rate drop by four and nine-tenths percentage points from 9.8 percent to 4.9 percent. Since the beginning of 2017, the unemployment rate fluctuated from 5.5 percent in February to 3.8 percent in April, ending July 2017 at 4.8 percent.
2012 2013 2014 2015 2016
40,000
42,000
44,000
46,000
48,000
50,000
52,000
Labor Force Employment
Monthly Unemployment Rate, 2017
January February March April May June July3.0%
3.5%
4.0%
4.5%
5.0%
5.5%
6.0%
Eastern Arkansas LWDA 2012-2016 Labor Force/EmploymentYear 2012 2013 2014 2015 2016Labor Force 51,623 49,313 48,499 48,661 48,230Employment 46,547 44,747 44,683 45,500 45,873Unemployment 5,076 4,566 3,816 3,161 2,357Unemployment Rate 9.8% 9.3% 7.9% 6.5% 4.9%Source: Arkansas Department of Workforce Services
Eastern Arkansas LWDA 2017 Monthly Unemployment Rate*
Year Month UnemploymentRate
2017 January 5.3%2017 February 5.5%2017 March 4.5%2017 April 3.8%2017 May 4.1%2017 June 4.6%2017 July 4.8%
Source: AR Dept. of Workforce Services Local Area Unemployment Statistics*Not Seasonally Adjusted, Not Preliminary
Eastern Arkansas Local Workforce Development Area WagesCashiers had the largest estimated employment in the LWDA in 2016 with 1,855 employed, earning an average wage of $19,248 in 2016. Elementary School Teachers, Except Special Education had the largest experienced wage on the 10 Largest Occupations list with $49,717 and 704 employed in this occupation.
Family and General Practitioners leads the Occupations Paying the Most list with an average annual wage of $210,042. Human Resource Managers rounds out the list with an average annual wage of $89,663.
Employers of all sizes in the Eastern Arkansas LWDA had an estimated entry wage of $18,201 in 2016. Employers with 250 to 499 employees had an estimated mean wage of $32,163. Employers of 50 to 99 employees had an estimated entry wage of $18,504, while estimated experienced wages were $41,696 for 2016.
Of the 36,706 estimated employees in the Area, those earning $8.50 to $9.99 an hour was the largest group on the list, with an estimated 8,978 employees. The estimated number of employees earning $12.00 to $14.99 an hour was 4,959.
Eastern Arkansas LWDA Wages of 10 Largest Occupations
Occupation Estimated Employment
Average Wage
Entry Wage
Experienced Wage
Cashiers 1,855 $19,248 $18,097 $19,824Combined Food Preparation and Serving Workers, Including Fast Food 1,364 $18,302 $18,044 $18,431Personal Care Aides 1,146 $18,277 $17,977 $18,426Heavy and Tractor-Trailer Truck Drivers 1,119 $38,156 $24,098 $45,184Laborers and Freight, Stock, and Material Movers, Hand 999 $24,383 $19,208 $26,971Nursing Assistants 979 $23,051 $18,283 $25,435Office Clerks, General 937 $25,862 $18,287 $29,649Retail Salespersons 916 $25,225 $18,177 $28,749Stock Clerks and Order Fillers 719 $21,756 $17,832 $23,718Elementary School Teachers, Except Special Education 704 $44,147 $33,006 $49,717Source: Arkansas Department of Workforce Services, May 2016 Wage Survey
43Arkansas Economic Report 2017
* Private Sector Wages OnlySource: Arkansas Department of Workforce Services, Quarterly Census of Employment and Wages
Arkansas Economic Report 2017 44
Eastern Arkansas Local Workforce Development Area Wages
Eastern Arkansas LWDA Occupations Paying the Most
Occupation AverageAnnual Salary
Family and General Practitioners $210,042Nurse Practitioners $147,204Pharmacists $125,187Chief Executives $106,564Architectural and Engineering Managers $105,267Judges, Magistrate Judges, and Magistrates $101,514Construction Managers $100,801Physical Therapists $95,062Occupational Therapists $90,588Human Resources Managers $89,663Source: Arkansas Department of Workforce Services, May 2016 Wage Survey

Eastern Arkansas Local Workforce Development Area Wages
Eastern Arkansas Wage Estimates by Employer Size
All Sizes
0-49 Emplo...
50-99 Empl...
100-249 Emp...
250-499 Emp...
500+ Emplo...$0
$5,000
$10,000
$15,000
$20,000
$25,000
$30,000
$35,000
$40,000
$45,000
$50,000
$55,000Entry Mean
Eastern Arkansas Number of Employees by Hourly Wage Rate
45Arkansas Economic Report 2017
Eastern Arkansas LWDA Wage Estimates by Employer SizeType of Wage Mean Median Entry Experienced
All Sizes$33,392 $25,938 $18,201 $40,988
0-49 Employees$31,952 $23,389 $18,092 $38,881
50-99 Employees$33,965 $26,476 $18,504 $41,696
100-249 Employees$34,709 $29,939 $19,093 $42,516
250-499 Employees$32,163 $27,315 $18,806 $38,841
500+ Employees$51,963 $52,627 $31,602 $62,144
Source: Arkansas Department of Workforce Services, May 2016 Wage Survey
Eastern Arkansas LWDA Number of Employees by Hourly Wage RateTotal 36,706<$8.50 4,047$8.50-$9.99 8,978$10.00-$11.99 4,435$12.00-$14.99 4,959$15.00-$19.99 5,817$20.00-$24.99 3,370$25.00+ 5,100Source: Arkansas Department of Workforce Services, May 2016 Wage Survey
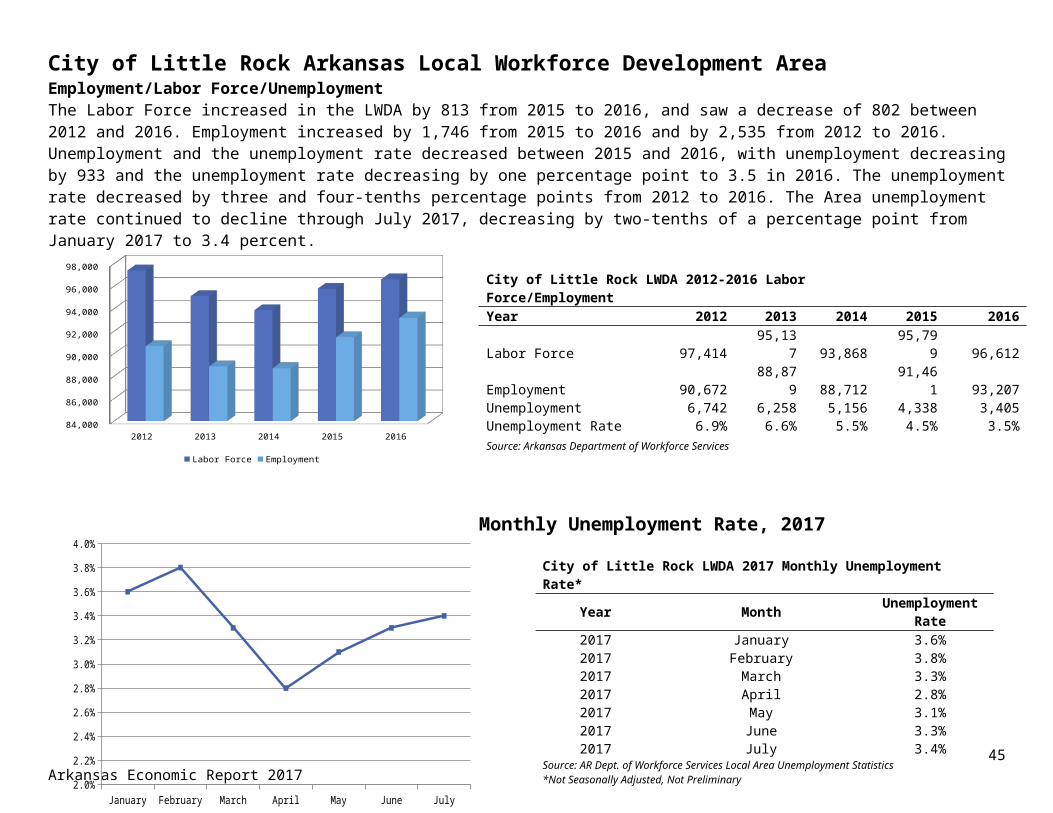
Arkansas Economic Report 2017 46
<$8.50
$8.50-$9.99
$10.00-$11.99
$12.00-$14.99
$15.00-$19.99
$20.00-$24.99
$25.00+
0 1,000 2,000 3,000 4,000 5,000 6,000 7,000 8,000 9,000 10,000
Eastern Arkansas Local Workforce Development Area IndustryThe Eastern Arkansas LWDA is expected to experience a net growth of 557 jobs between 2016 and 2018. Food Services and Drinking Places is estimated to be the top growing industry adding 143 jobs between 2016 and 2018 bringing its employment to 2,696. Nonmetallic Mineral Product Manufacturing is expected to be the fastest growing industry with a gain of 59.46 percent, or 66 new jobs going from 111 jobs in 2016 to 177 in 2018. Hospitals could see a drop of 197 jobs, or 36.41 percent of its workforce, making it the top and fastest declining industry in Eastern Arkansas, dropping employment to 344. Leisure and Hospitality leads the Area in net growth among the industry supersectors with 167 new jobs increasing employment 4.70 percent to 3,721.
Top 5 Industry Supersectors
NAICS Code NAICS TitleEmployment Net
ChangePercent Change2016
Estimated2018
Projected102600 Leisure and Hospitality 3,554 3,721 167 4.70%102100 Trade, Transportation, and Utilities 9,323 9,439 116 1.24%102400 Professional and Business Services 2,255 2,339 84 3.73%101200 Construction 1,032 1,115 83 8.04%102800 Government 4,272 4,328 56 1.31%
Top Industries
NAICS Code NAICS Title Employment Net Change
Percent Change2016 2018
Employees
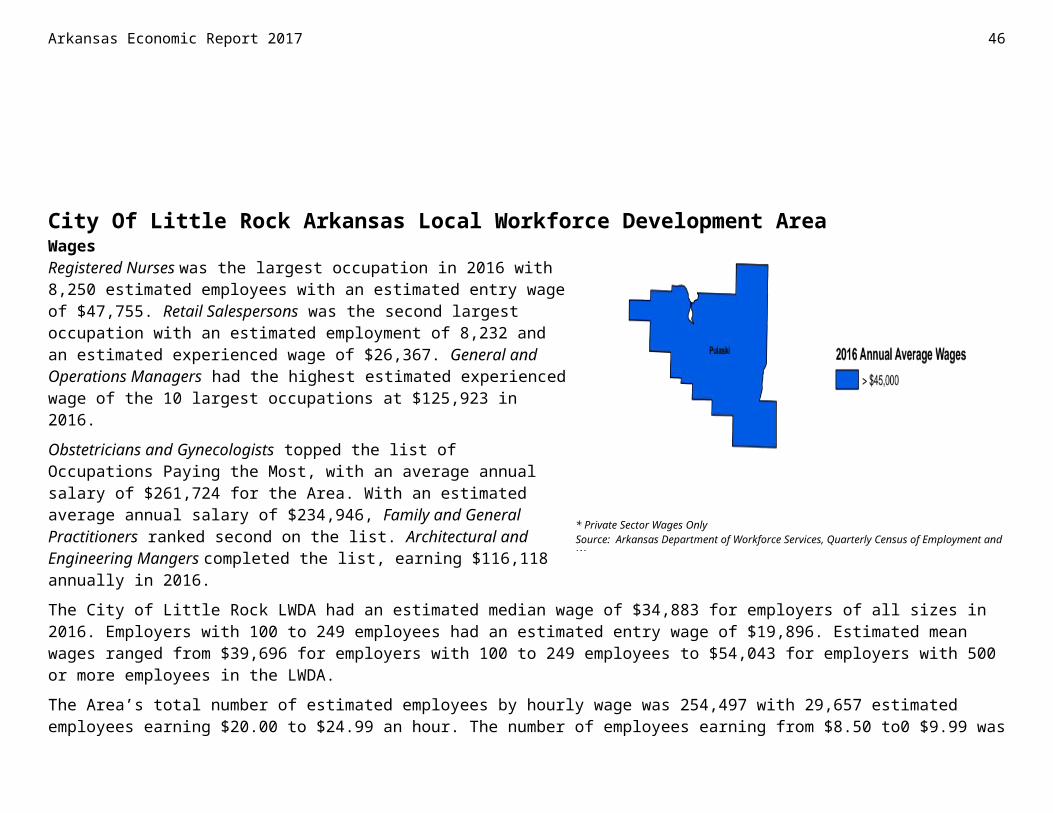
Estimated ProjectedTop 10 Growth
722000 Food Services and Drinking Places 2,553 2,696 143 5.60%561000 Administrative and Support Services 1,475 1,580 105 7.12%621000 Ambulatory Health Care Services 1,704 1,801 97 5.69%493000 Warehousing and Storage 716 796 80 11.17%624000 Social Assistance 2,339 2,406 67 2.86%327000 Nonmetallic Mineral Product Manufacturing 111 177 66 59.46%236000 Construction of Buildings 391 449 58 14.83%238000 Specialty Trade Contractors 512 568 56 10.94%111000 Crop Production 1,432 1,484 52 3.63%452000 General Merchandise Stores 1,465 1,508 43 2.94%
Eastern Arkansas Local Workforce Development Area Top Industries
NAICS Code NAICS TitleEmployment Net
ChangePercent Change2016
Estimated2018
Projected Top 10 Fastest Growing
327000 Nonmetallic Mineral Product Manufacturing 111 177 66 59.46%443000 Electronics and Appliance Stores 83 111 28 33.73%236000 Construction of Buildings 391 449 58 14.83%493000 Warehousing and Storage 716 796 80 11.17%238000 Specialty Trade Contractors 512 568 56 10.94%326000 Plastics and Rubber Products Manufacturing 192 209 17 8.85%485000 Transit and Ground Passenger Transportation 137 147 10 7.30%561000 Administrative and Support Services 1,475 1,580 105 7.12%621000 Ambulatory Health Care Services 1,704 1,801 97 5.69%722000 Food Services and Drinking Places 2,553 2,696 143 5.60%
Top 10 Decline622000 Hospitals 541 344 -197 -36.41%611000 Educational Services 4,459 4,340 -119 -2.67%488000 Support Activities for Transportation 330 238 -92 -27.88%484000 Truck Transportation 837 763 -74 -8.84%115000 Support Activities for Agriculture and Forestry 293 245 -48 -16.38%237000 Heavy and Civil Engineering Construction 129 98 -31 -24.03%721000 Accommodation, including Hotels and Motels 364 345 -19 -5.22%562000 Waste Management and Remediation Services 61 43 -18 -29.51%311000 Food Manufacturing 649 634 -15 -2.31%332000 Fabricated Metal Product Manufacturing 237 222 -15 -6.33%
47Arkansas Economic Report 2017
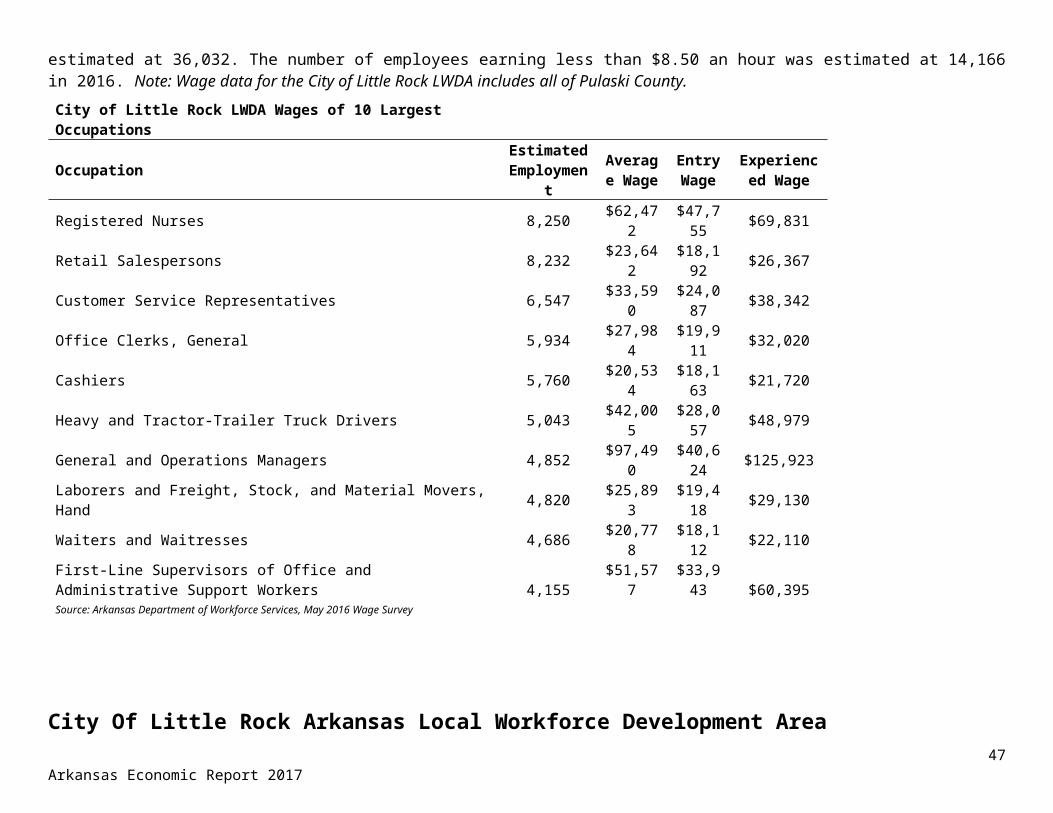
Arkansas Economic Report 2017 48
Top 10 Fastest Decline622000 Hospitals 541 344 -197 -36.41%562000 Waste Management and Remediation Services 61 43 -18 -29.51%488000 Support Activities for Transportation 330 238 -92 -27.88%237000 Heavy and Civil Engineering Construction 129 98 -31 -24.03%115000 Support Activities for Agriculture and Forestry 293 245 -48 -16.38%517000 Telecommunications 62 53 -9 -14.52%511000 Publishing Industries (except Internet) 90 81 -9 -10.00%814000 Private Households 75 68 -7 -9.33%484000 Truck Transportation 837 763 -74 -8.84%448000 Clothing and Clothing Accessories Stores 120 110 -10 -8.33%
Source: Arkansas Department of Workforce Services, Projections Suite Software
Eastern Arkansas Local Workforce Development Area OccupationsThe Eastern Arkansas LWDA is expected to have 1,518 annual job openings during the projection period with 1,026 being for replacement and the remaining 492 for growth and expansion. Cashiers is predicted to add the most jobs with 63 new jobs anticipated increasing employment to 2,007. Carpenters is forecasted to be the fastest growing occupation with an increase of 9.57 percent, moving from 115 jobs in 2016 to 126 in 2018. Registered Nurses could lose 40 jobs between 2016 and 2018 making it the top declining occupation, dropping employment to 318, while Radiologic Technologists could be the fastest declining occupation, losing 24.1 percent of its workforce dropping down to 22 in 2018. Food Preparation and Serving Related Occupations is anticipated to be the top growing major occupational group with 139 new jobs, increasing its total workforce to 3,395.
Top 5 Major Occupational Groups
SOC Code SOC TitleEmployment Growth Annual Openings
2016 Estimated
2018 Projected Net Percent Growth Replacement Total
35-0000 Food Preparation and Serving Related Occupations 3,256 3,395 139 4.27% 72 124 19641-0000 Sales and Related Occupations 4,724 4,856 132 2.79% 67 172 23939-0000 Personal Care and Service Occupations 2,637 2,716 79 3.00% 40 46 8647-0000 Construction and Extraction Occupations 1,421 1,500 79 5.56% 47 22 6931-0000 Healthcare Support Occupations 1,529 1,572 43 2.81% 24 32 56
Top Occupations
SOC Code SOC TitleEmployment Growth Annual Openings
2016 Estimated
2018 Projected Net Percent Growth Replacement Total
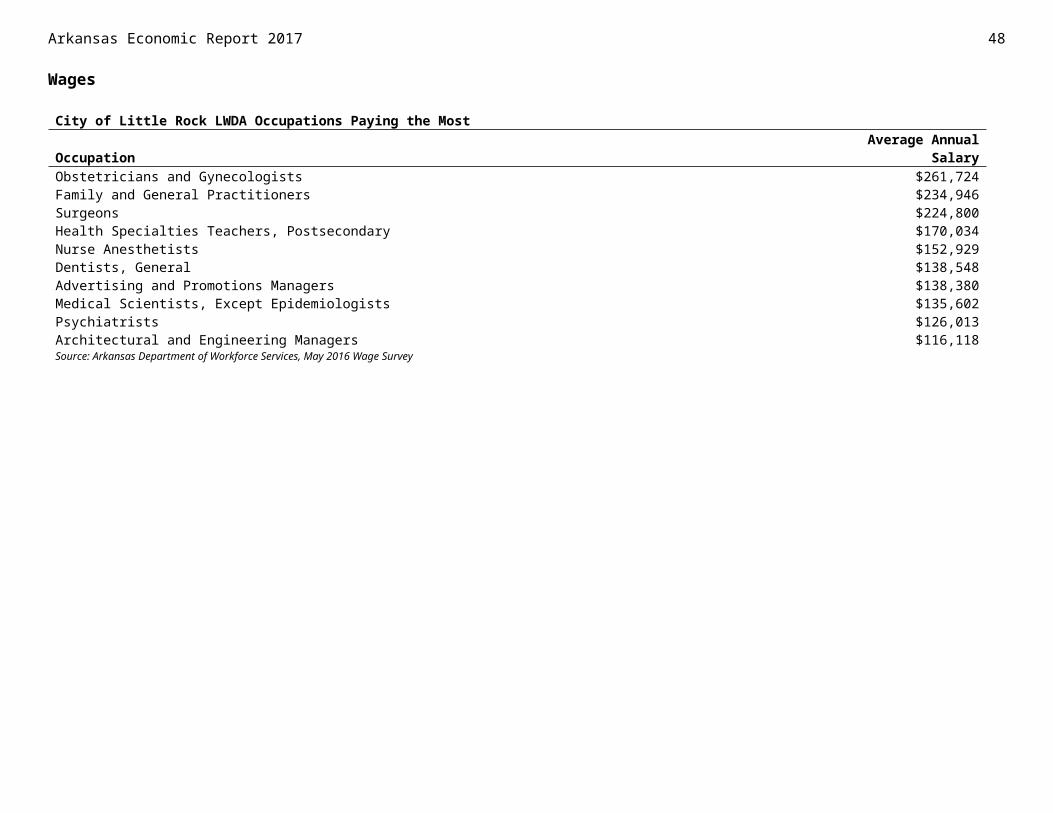
Top 10 Growth41-2011 Cashiers 1,944 2,007 63 3.24% 32 98 13035-3021 Combined Food Preparation and Serving Workers, Including Fast Food 1,090 1,150 60 5.50% 30 42 7239-9021 Personal Care Aides 1,331 1,383 52 3.91% 26 8 3453-7062 Laborers and Freight, Stock, and Material Movers, Hand 957 991 34 3.55% 17 30 4741-2031 Retail Salespersons 877 903 26 2.96% 13 33 4631-1011 Home Health Aides 399 423 24 6.02% 12 8 2051-2092 Team Assemblers 310 332 22 7.10% 11 6 1735-3031 Waiters and Waitresses 479 500 21 4.38% 10 25 3547-2061 Construction Laborers 284 305 21 7.39% 10 6 1635-2014 Cooks, Restaurant 271 291 20 7.38% 10 8 18
Eastern Arkansas Local Workforce Development Area Top Occupations
SOC Code SOC Title
Employment Growth Annual Openings2016
Estimated2018
Projected Net Percent Growth Replacement TotalTop 10 Fastest Growth
47-2031 Carpenters 115 126 11 9.57% 6 2 847-2111 Electricians 76 82 6 7.89% 3 1 447-2061 Construction Laborers 284 305 21 7.39% 10 6 1635-2014 Cooks, Restaurant 271 291 20 7.38% 10 8 1843-5061 Production, Planning, and Expediting Clerks 83 89 6 7.23% 3 2 549-9041 Industrial Machinery Mechanics 196 210 14 7.14% 7 4 1151-2092 Team Assemblers 310 332 22 7.10% 11 6 1721-2011 Clergy 212 225 13 6.13% 6 4 1031-1011 Home Health Aides 399 423 24 6.02% 12 8 2013-1151 Training and Development Specialists 100 106 6 6.00% 3 2 5
Top 10 Decline29-1141 Registered Nurses 358 318 -40 -11.2% 0 8 853-3032 Heavy and Tractor-Trailer Truck Drivers 1,170 1,145 -25 -2.1% 0 18 1825-2021 Elementary School Teachers, Except Special Education 680 661 -19 -2.8% 0 15 1525-2031 Secondary School Teachers, Except Special and Career/Technical Education 518 504 -14 -2.7% 0 13 1343-6014 Secretaries and Administrative Assistants, Except Legal, Medical, and Executive 777 764 -13 -1.7% 0 8 825-2022 Middle School Teachers, Except Special and Career/Technical Education 390 378 -12 -3.1% 0 8 829-2061 Licensed Practical and Licensed Vocational Nurses 318 307 -11 -3.5% 0 9 925-9041 Teacher Assistants 448 440 -8 -1.8% 0 10 1043-9061 Office Clerks, General 1,002 994 -8 -0.8% 0 21 2129-2034 Radiologic Technologists 29 22 -7 -24.1% 0 0 0
Top 10 Fastest Decline29-2034 Radiologic Technologists 29 22 -7 -24.1% 0 0 029-2012 Medical and Clinical Laboratory Technicians 32 27 -5 -15.6% 0 1 129-1141 Registered Nurses 358 318 -40 -11.2% 0 8 8
49Arkansas Economic Report 2017

Arkansas Economic Report 2017 50
47-2071 Paving, Surfacing, and Tamping Equipment Operators 48 44 -4 -8.3% 0 1 143-5032 Dispatchers, Except Police, Fire, and Ambulance 62 58 -4 -6.5% 0 2 247-2073 Operating Engineers and Other Construction Equipment Operators 89 84 -5 -5.6% 0 2 211-9111 Medical and Health Services Managers 92 87 -5 -5.4% 0 2 251-9121 Coating, Painting, and Spraying Machine Setters, Operators, and Tenders 116 110 -6 -5.2% 0 2 253-7081 Refuse and Recyclable Material Collectors 138 131 -7 -5.1% 0 3 343-4081 Hotel, Motel, and Resort Desk Clerks 99 94 -5 -5.1% 0 6 6
Source: Arkansas Department of Workforce Services, Projections Suite Software
North Central Arkansas Local Workforce Development AreaPopulationThe North Central Arkansas Local Workforce Development Area had a slight increase in population in 2016, adding 22 to bring the population to 237,437. But the population decreased over the five-year period of 2012 to 2016, decreasing by 1,305. The North Central Arkansas LWDA consists of 10 counties: Cleburne, Fulton, Independence, Izard, Jackson, Sharp, Stone, Van Buren, White, and Woodruff, with the state of Missouri bordering the area to the north.
2012 2013 2014 2015 2016 236,500
237,000
237,500
238,000
238,500
239,000
Quarterly Workforce Indicators
North Central Arkansas LWDA Population 2012-20162012 2013 2014 2015 2016
238,742 238,145 237,646 237,415 237,437Source: US Census Bureau
North Central Arkansas LWDA Quarterly Workforce Indicators(All Ownerships)QWI Explorer 2012 Q2 2013 Q2 2014 Q2 2015 Q2 2016 Q2Job Creation 4,657 3,900 3,613 4,031 3,518New Hires 12,069 11,748 11,311 12,207 11,876Separations 14,269 12,942 12,596 13,094 13,461Turnover 9.0% 8.6% 8.8% 9.3% 8.9%
Source: U.S.Census Bureau, Center for Economic Studies, LEHDJob Creation: Estimated number of jobs gained at firms throughout the quarter.New Hires: Estimated number of workers who started a new job.Separations: Estimated number of workers whose job with a given employer ended in the specified quarter.
Turnovers: The rate at which stable jobs begin and end.

There were 3,518 new jobs created in the second quarter of 2016, a decrease of 513 compared to the same quarter in 2015. New hires decreased by 331 compared to the second quarter of 2015 while separations increased by 367 compared to the same quarter. The turnover rate decreased by four-tenths of a percentage point to 8.9 percent.
51Arkansas Economic Report 2017
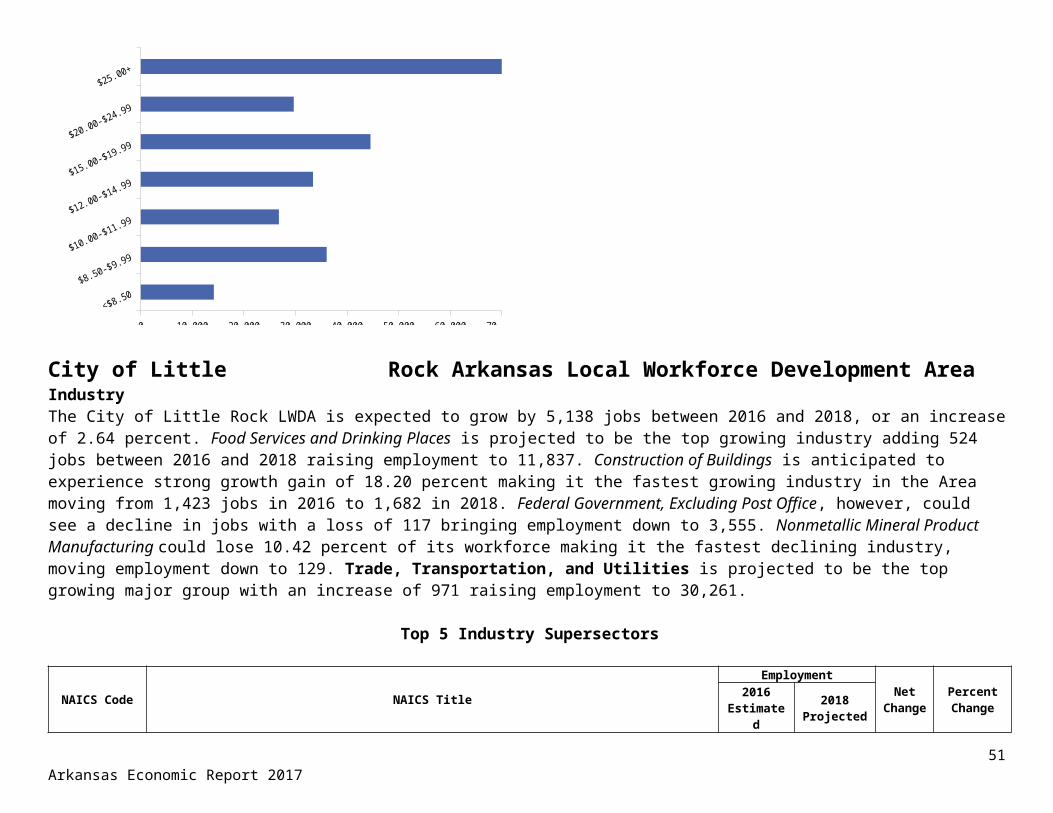
Arkansas Economic Report 2017 52
North Central Arkansas Local Workforce Development AreaEmployment/Labor Force/UnemploymentThe labor force decreased by 604 from 2015 to 2016 and decreased by 5,234 between 2012 and 2016. Employment increased by 434 while unemployment decreased by 1,038 from 2015 to 2016. The unemployment rate dropped to 5.4 percent or one and one tenths percentage points from 2015 to 2016. The unemployment rate continued to decline during 2017 to 4.8 percent in July.
2012 2013 2014 2015 2016 80,000
84,000
88,000
92,000
96,000
100,000
104,000
Labor Force Employment
Monthly Unemployment Rate, 2017
January February March April May June July3.0%
3.5%
4.0%
4.5%
5.0%
5.5%
6.0%
North Central Arkansas LWDA 2012-2016 Labor Force/EmploymentYear 2012 2013 2014 2015 2016Labor Force 100,563 96,644 94,933 95,933 95,329Employment 91,783 88,229 87,663 89,710 90,144Unemployment 8,780 8,415 7,270 6,223 5,185Unemployment Rate 8.7% 8.7% 7.7% 6.5% 5.4%Source: Arkansas Department of Workforce Services
North Central Arkansas LWDA 2017 Monthly Unemployment Rate*
Year Month UnemploymentRate
2017 January 5.8%2017 February 5.8%2017 March 4.8%2017 April 4.1%2017 May 4.4%2017 June 4.6%2017 July 4.8%
Source: AR Dept. of Workforce Services Local Area Unemployment Statistics
*Not Seasonally Adjusted, Not Preliminary
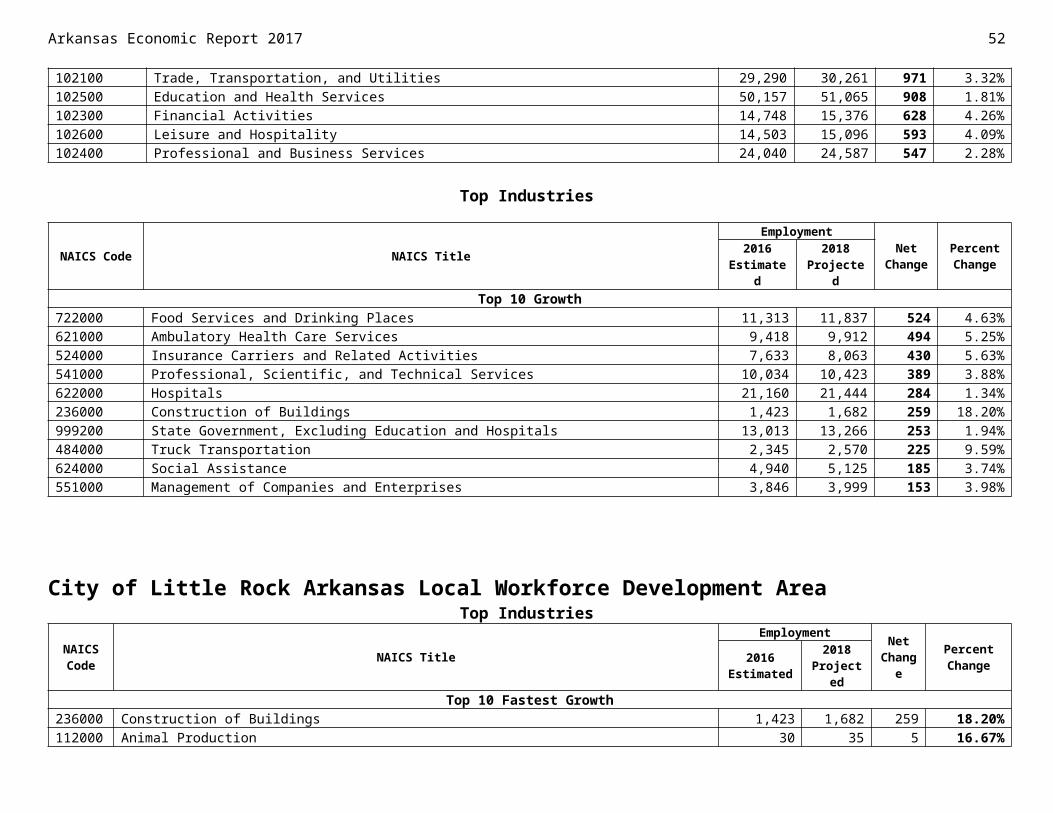
North Central Arkansas Local Workforce Development AreaWagesRetail Salespersons, with an estimated employment of 2,257 was the largest occupation in the LWDA with an experienced wage of $31,085 in 2016. Registered Nurses had the largest entry wage of the 10 largest occupations at $42,701 and had an estimated employment of 1,419.
Pediatricians, General topped the Occupations Paying the Most list, earning an average annual wage of $291,065. Internists, General was second with an average annual wage of $257,268. Civil Engineers completed the list with an average annual wage of $90,742 in 2016.
Employees of all employer sizes in North Central Arkansas had an estimated median wage of $27,529 in 2016. Employers with 100-249 employees had an estimated entry wage of $19,698 and experienced wage of $43,111. Entry wages for employers with 500 plus employees were estimated to be $21,289 in 2016.
Of the 70,329 employees in North Central Arkansas, employees making $8.50 to $9.99 an hour was the largest group with 14,981 employees. Employees making $15.00 to $19.99 an hour totaled 11,429 in 2016.
North Central Arkansas LWDA Wages of 10 Largest Occupations
Occupation Estimated Employment
Average Wage
Entry Wage
Experienced Wage
Retail Salespersons 2,257 $26,811 $18,263 $31,085Cashiers 1,992 $19,739 $18,157 $20,531Combined Food Preparation and Serving Workers, Including Fast Food 1,981 $18,455 $18,106 $18,630Heavy and Tractor-Trailer Truck Drivers 1,975 $36,401 $24,308 $42,448Office Clerks, General 1,796 $24,565 $18,244 $27,725Nursing Assistants 1,600 $22,449 $20,259 $23,544Registered Nurses 1,419 $57,220 $42,701 $64,479Waiters and Waitresses 1,324 $19,003 $18,111 $19,449Secretaries and Administrative Assistants, Except Legal, Medical, & Executive 1,310 $25,927 $19,416 $29,183Laborers and Freight, Stock, and Material Movers, Hand 1,222 $23,855 $18,411 $26,577Source: Arkansas Department of Workforce Services, May 2016 Wage Survey
53Arkansas Economic Report 2017
* Private Sector Wages OnlySource: Arkansas Department of Workforce Services, Quarterly Census of Employment and Wages

Arkansas Economic Report 2017 54
North Central Arkansas Local Workforce Development AreaWages
North Central LWDA Arkansas Occupations Paying the Most
Occupation AverageAnnual Salary
Pediatricians, General $291,065Internists, General $257,268Dentists, General $248,510Family and General Practitioners $246,446Judges, Magistrate Judges, and Magistrates $121,644Psychiatrists $120,928Pharmacists $107,390Construction Managers $104,173Architectural and Engineering Managers $92,605Civil Engineers $90,742Source: Arkansas Department of Workforce Services, May 2016 Wage Survey
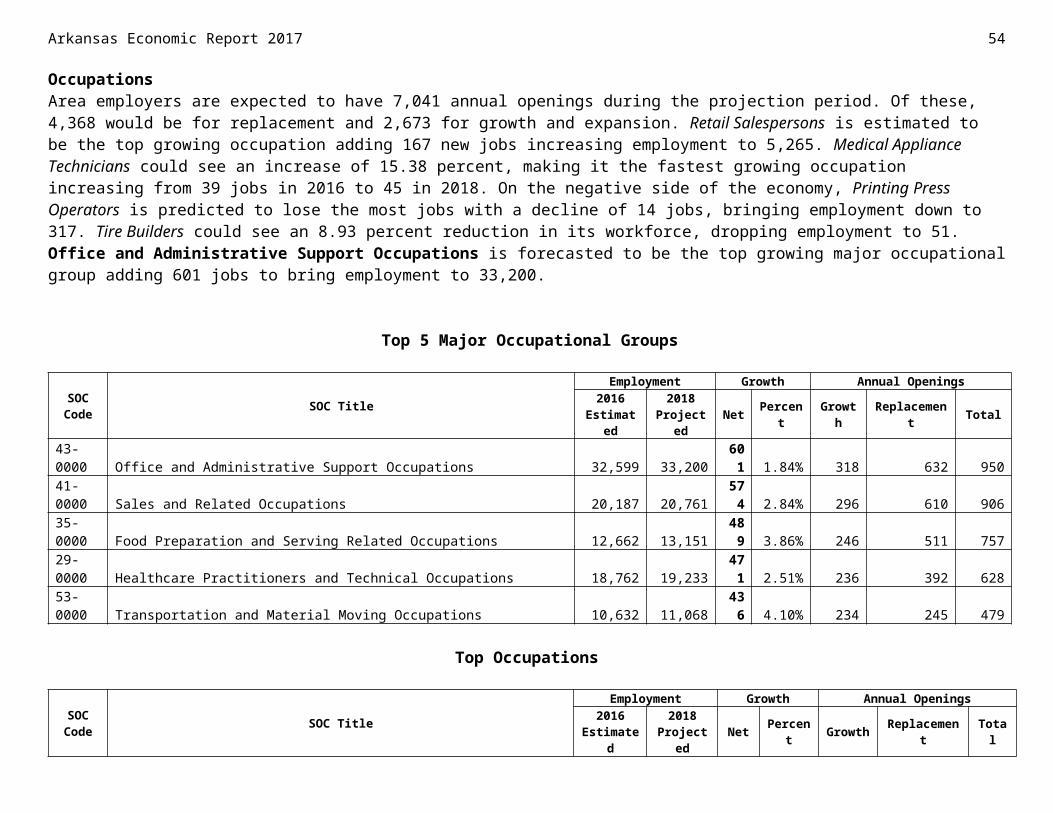
North Central Arkansas Local Workforce Development AreaWages
North Central Arkansas Wage Estimates by Employer Size
All Sizes
0-49 Employees
50-99 Employees
100-249 Employees
250-499 Employees
500+ Employees
$0
$5,000
$10,000
$15,000
$20,000
$25,000
$30,000
$35,000
$40,000
$45,000Entry Mean
North Central Arkansas Number of Employees by Hourly Wage Rate
55Arkansas Economic Report 2017
North Central Arkansas LWDA Wage Estimates by Employer SizeType of Wage Mean Median Entry ExperiencedAll Sizes $35,461 $27,529 $18,871 $43,755
0-49 Employees $33,612 $24,638 $18,195 $41,321
50-99 Employees $34,894 $25,751 $18,584 $43,049
100-249 Employees $35,307 $30,573 $19,698 $43,111
250-499 Employees $38,279 $34,197 $20,671 $47,083
500+ Employees $42,472 $33,052 $21,289 $53,063Source: Arkansas Department of Workforce Services, May 2016 Wage Survey
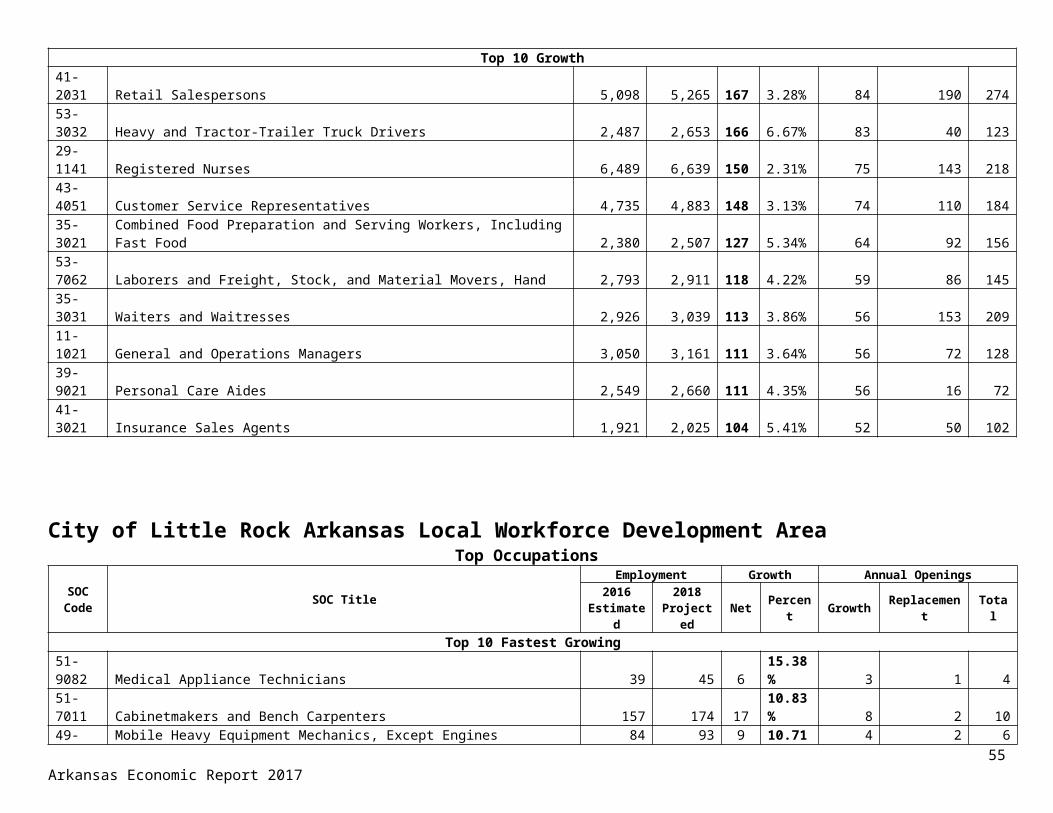
Arkansas Economic Report 2017 56
North Central Arkansas Local Workforce Development AreaIndustryThe North Central Arkansas LWDA is projected to add 1,742 jobs from first quarter 2016 through first quarter 2018, or increase employment by 2.08
percent. Administrative and Support Services is forecast to be the top growing industry with an increase of 305 new jobs, moving employment to 2,156. Plastics and Rubber Product Manufacturing is predicted to be the fastest growing industry with a 25.85 percent rise in employment, moving from 205 jobs in 2016 to 258 in 2018. Truck Transportation is predicted to be the top declining industry with a loss of 247 jobs, dropping employment to 1,532. Clothing and Clothing Accessories Stores could lose more than half of its local workforce between 2016 and 2018, dropping employment to 182. Education and Health Services is projected to be the top growing supersector with 716 new jobs increasing employment to 22,348.
Top 5 Industry Supersectors
NAICS Code NAICS Title Employment Net Change
Percent Change2016 Estimated 2018 Projected
102500 Education and Health Services 21,632 22,348 716 3.31%101300 Manufacturing 8,120 8,471 351 4.32%102400 Professional and Business Services 3,362 3,680 318 9.46%102600 Leisure and Hospitality 6,276 6,592 316 5.04%102700 Other Services (except Government) 2,671 2,785 114 4.27%
Top Industries
NAICS Code NAICS TitleEmployment Net
ChangePercent Change2016
Estimated 2018 Projected
Top 10 Growth561000 Administrative and Support Services 1,851 2,156 305 16.48%
<$8.50
$8.50-$9.99
$10.00-$11.99
$12.00-$14.99
$15.00-$19.99
$20.00-$24.99
$25.00+
0 2,000 4,000 6,000 8,000 10,000 12,000 14,000 16,000
North Central Arkansas LWDA Number of Employees by Hourly Wage RateTotal 70,329<$8.50 6,294$8.50-$9.99 14,981$10.00-$11.99 9,472$12.00-$14.99 10,133$15.00-$19.99 11,429$20.00-$24.99 7,812$25.00+ 10,208
Source: Arkansas Department of Workforce Services, May 2016 Wage Survey
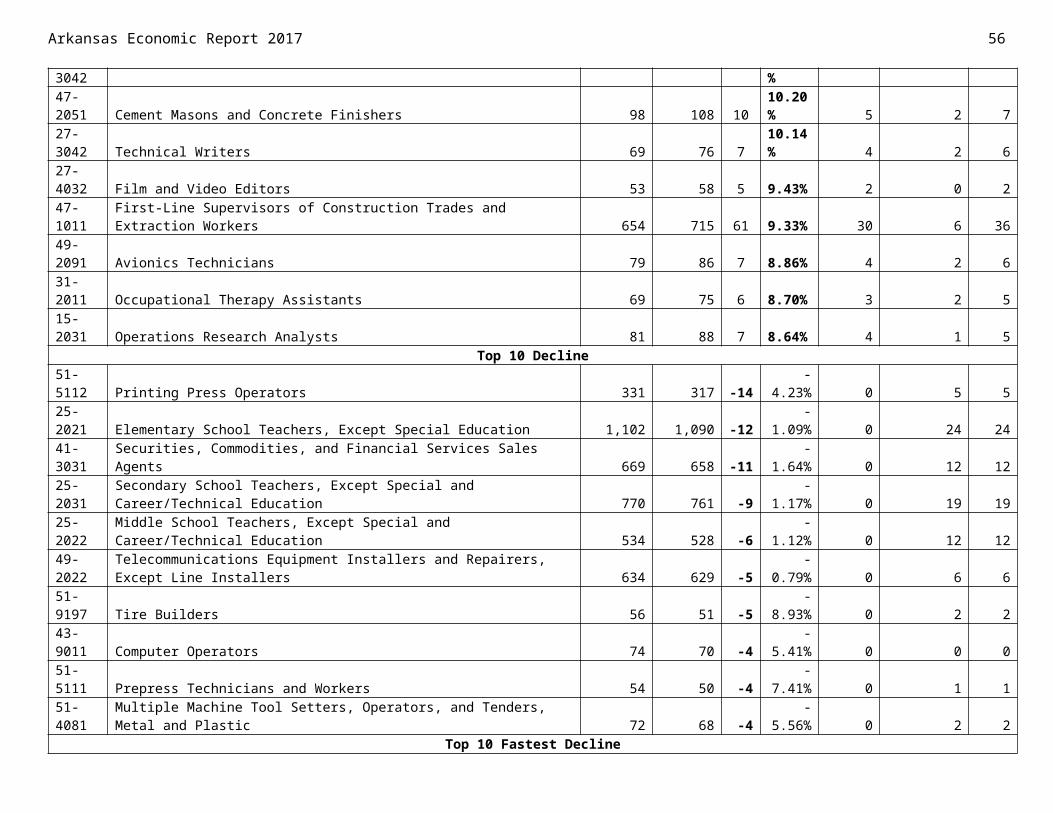
722000 Food Services and Drinking Places 5,410 5,693 283 5.23%336000 Transportation Equipment Manufacturing 1,047 1,312 265 25.31%623000 Nursing and Residential Care Facilities 3,195 3,427 232 7.26%621000 Ambulatory Health Care Services 3,596 3,825 229 6.37%311000 Food Manufacturing 2,173 2,329 156 7.18%611000 Educational Services 9,071 9,202 131 1.44%813000 Religious, Grantmaking, Civic, Professional, and Similar Organizations 1,547 1,671 124 8.02%452000 General Merchandise Stores 2,907 3,017 110 3.78%112000 Animal Production 656 751 95 14.48%
North Central Arkansas Local Workforce Development Area Top Industries
NAICS Code NAICS Title Employment Net Change
Percent Change2016 Estimated 2018 Projected
326000 Plastics and Rubber Products Manufacturing 205 258 53 25.85%336000 Transportation Equipment Manufacturing 1,047 1,312 265 25.31%113000 Forestry and Logging 35 41 6 17.14%713000 Amusement, Gambling, and Recreation Industries 409 477 68 16.63%561000 Administrative and Support Services 1,851 2,156 305 16.48%112000 Animal Production 656 751 95 14.48%333000 Machinery Manufacturing 754 822 68 9.02%813000 Religious, Grantmaking, Civic, Professional, and Similar Organizations 1,547 1,671 124 8.02%623000 Nursing and Residential Care Facilities 3,195 3,427 232 7.26%311000 Food Manufacturing 2,173 2,329 156 7.18%
Top 10 Decline484000 Truck Transportation 1,779 1,532 -247 -13.88%448000 Clothing and Clothing Accessories Stores 379 182 -197 -51.98%445000 Food and Beverage Stores 1,266 1,178 -88 -6.95%213000 Support Activities for Mining 226 141 -85 -37.61%211000 Oil and Gas Extraction 430 364 -66 -15.35%212000 Mining (except Oil and Gas) 227 167 -60 -26.43%339000 Miscellaneous Manufacturing 389 346 -43 -11.05%332000 Fabricated Metal Product Manufacturing 558 520 -38 -6.81%335000 Electrical Equipment, Appliance, and Component Manufacturing 228 190 -38 -16.67%524000 Insurance Carriers and Related Activities 419 382 -37 -8.83%
Top 10 Fastest Decline448000 Clothing and Clothing Accessories Stores 379 182 -197 -51.98%213000 Support Activities for Mining 226 141 -85 -37.61%212000 Mining (except Oil and Gas) 227 167 -60 -26.43%334000 Computer and Electronic Product Manufacturing 29 22 -7 -24.14%814000 Private Households 96 76 -20 -20.83%486000 Pipeline Transportation 132 106 -26 -19.70%
57Arkansas Economic Report 2017

Arkansas Economic Report 2017 58
485000 Transit and Ground Passenger Transportation 149 122 -27 -18.12%335000 Electrical Equipment, Appliance, and Component Manufacturing 228 190 -38 -16.67%211000 Oil and Gas Extraction 430 364 -66 -15.35%484000 Truck Transportation 1,779 1,532 -247 -13.88%
Source: Arkansas Department of Workforce Services, Projections Suite Software
North Central Arkansas Local Workforce Development AreaOccupationsThe Area is expected to have 3,142 total job openings annually between 2016 and 2018. Of these, 1,948 would be for replacement, while 1,194 would be for growth and expansion. Farmers, Ranchers, and Other Agricultural Managers is anticipated to gain 134 jobs between 2016 and 2018 making it the top growing occupation in the Area moving employment to 9,046. The occupation is also projected to have the most job openings with 215 annually. Packaging and Filling Machine Operators and Tenders are forecast to increase employment by 16.92 percent making it the fastest growing occupation in North Central Arkansas increasing jobs to 152. On the negative side of the economy, Heavy and Tractor-Trailer Truck Drivers could lose the most with a loss of 141 jobs dropping employment to 2,137, while Service Unit Operators, Oil, Gas, and Mining is expected to lose 29.51 percent of its workforce dropping down to only 43 jobs. Production Occupations is forecast to be the top growing occupational group adding 321 new jobs to an employment level of 7,764.
Top 5 Major Occupational Groups
SOC Code SOC Title
Employment Growth Annual Openings2016
Estimated2018
Projected Net Percent Growth Replacement Total
51-0000 Production Occupations 7,443 7,764 321 4.31% 210 167 37735-0000 Food Preparation and Serving Related Occupations 6,822 7,124 302 4.43% 152 260 41229-0000 Healthcare Practitioners and Technical Occupations 5,314 5,539 225 4.23% 114 114 22811-0000 Management Occupations 12,368 12,571 203 1.64% 106 224 33031-0000 Healthcare Support Occupations 2,782 2,935 153 5.50% 77 58 135
Top Occupations
SOC Code SOC Title
Employment Growth Annual Openings2016
Estimated2018
Projected Net Percent Growth Replacement TotalTop 10 Growth
11-9013 Farmers, Ranchers, and Other Agricultural Managers 8,912 9,046 134 1.50% 67 148 21531-1014 Nursing Assistants 1,894 2,009 115 6.07% 58 40 9835-3021 Combined Food Preparation and Serving Workers, Including Fast Food 1,667 1,760 93 5.58% 46 65 11151-9198 Helpers--Production Workers 656 735 79 12.04% 40 20 60

37-2011 Janitors and Cleaners, Except Maids and Housekeeping Cleaners 1,046 1,114 68 6.50% 34 19 5351-4121 Welders, Cutters, Solderers, and Brazers 577 634 57 9.88% 28 16 4451-2092 Team Assemblers 603 657 54 8.96% 27 13 4039-9021 Personal Care Aides 1,183 1,236 53 4.48% 26 8 3429-2061 Licensed Practical and Licensed Vocational Nurses 1,132 1,184 52 4.59% 26 32 5835-1012 First-Line Supervisors of Food Preparation and Serving Workers 830 878 48 5.78% 24 26 50
North Central Arkansas Local Workforce Development Area Top Occupations
SOC Code SOC TitleEmployment Growth Annual Openings
2016 Estimated
2018 Projected Net Percent Growth Replacement Total
Top 10 Fastest Growing51-9111 Packaging and Filling Machine Operators and Tenders 130 152 22 16.92% 11 4 1551-9122 Painters, Transportation Equipment 80 90 10 12.50% 5 2 751-9198 Helpers--Production Workers 656 735 79 12.04% 40 20 6051-4121 Welders, Cutters, Solderers, and Brazers 577 634 57 9.88% 28 16 4435-3011 Bartenders 53 58 5 9.43% 2 2 451-2092 Team Assemblers 603 657 54 8.96% 27 13 4013-1161 Market Research Analysts and Marketing Specialists 59 64 5 8.47% 2 0 229-1123 Physical Therapists 95 103 8 8.42% 4 2 637-3011 Landscaping and Groundskeeping Workers 455 493 38 8.35% 19 8 2737-1012 First-Line Supervisors of Landscaping, Lawn Service, and Groundskeeping Workers 153 165 12 7.84% 6 2 8
Top 10 Decline53-3032 Heavy and Tractor-Trailer Truck Drivers 2,278 2,137 -141 -6.19% 0 36 3641-2031 Retail Salespersons 2,513 2,465 -48 -1.91% 0 94 9447-5013 Service Unit Operators, Oil, Gas, and Mining 61 43 -18 -29.51% 0 2 241-3021 Insurance Sales Agents 227 212 -15 -6.61% 0 6 643-3031 Bookkeeping, Accounting, and Auditing Clerks 731 718 -13 -1.78% 0 7 747-5041 Continuous Mining Machine Operators 51 38 -13 -25.49% 0 1 149-3031 Bus and Truck Mechanics and Diesel Engine Specialists 195 183 -12 -6.15% 0 4 447-2031 Carpenters 485 474 -11 -2.27% 0 6 649-2022 Telecommunications Equipment Installers and Repairers, Except Line Installers 156 146 -10 -6.41% 0 2 243-4081 Hotel, Motel, and Resort Desk Clerks 105 97 -8 -7.62% 0 6 6
Top 10 Fastest Decline47-5013 Service Unit Operators, Oil, Gas, and Mining 61 43 -18 -29.51% 0 2 247-5041 Continuous Mining Machine Operators 51 38 -13 -25.49% 0 1 149-9043 Maintenance Workers, Machinery 26 22 -4 -15.38% 0 0 011-3071 Transportation, Storage, and Distribution Managers 49 45 -4 -8.16% 0 1 143-4081 Hotel, Motel, and Resort Desk Clerks 105 97 -8 -7.62% 0 6 641-3021 Insurance Sales Agents 227 212 -15 -6.61% 0 6 649-2022 Telecommunications Equipment Installers and Repairers, Except Line Installers 156 146 -10 -6.41% 0 2 251-3021 Butchers and Meat Cutters 78 73 -5 -6.41% 0 2 253-3032 Heavy and Tractor-Trailer Truck Drivers 2,278 2,137 -141 -6.19% 0 36 36
59Arkansas Economic Report 2017
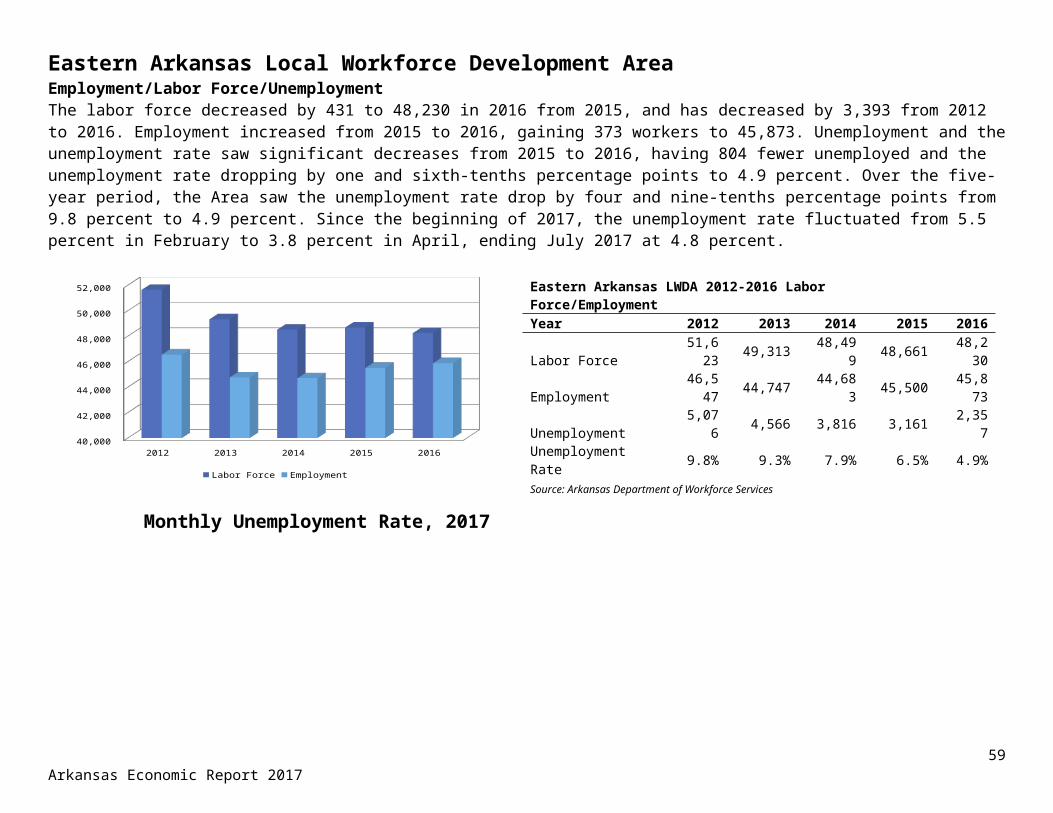
Arkansas Economic Report 2017 60
Source: Arkansas Department of Workforce Services, Projections Suite Software
Northeast Arkansas Local Workforce Development AreaPopulationThe Northeast Arkansas Workforce Development Area’s population was 266,394 in 2016, an increase of 875 since 2015, and it saw an increase of 2,987 from 2012 to 2016. The Northeast Arkansas LWDA consists of the Jonesboro Metropolitan Statistical Area and seven counties: Clay, Craighead, Greene, Lawrence, Mississippi, Poinsett, and Randolph. Both Missouri and Tennessee border the Area.
2012 2013 2014 2015 2016 261,000
262,000
263,000
264,000
265,000
266,000
267,000
Quarterly Workforce Indicators Job creation increased from the second quarter of 2015 by 745 to 5,909 for the same time period in 2016, and the Area’s job creation increased by 1,444 compared to the second quarter 2012. New hires were 20,167 or 2,320 more
Northeast Arkansas LWDA Population 2012-20162012 2013 2014 2015 2016
263,407 263,575 264,406 265,519 266,394Source: US Census Bureau
Northeast Arkansas LWDA Quarterly Workforce Indicators(All Ownerships)QWI Explorer 2012 Q2 2013 Q2 2014 Q2 2015 Q2 2016 Q2Job Creation 4,465 4,794 4,853 5,164 5,909New Hires 16,529 16,161 17,825 17,847 20,167Separations 18,781 18,931 20,182 20,180 22,068Turnover 9.0% 8.5% 8.8% 9.0% 9.8%Source: U.S.Census Bureau, Center for Economic Studies, LEHDJob Creation: Estimated number of jobs gained at firms throughout the quarter.New Hires: Estimated number of workers who started a new job.Separations: Estimated number of workers whose job with a given employer ended in the specified quarter.Turnovers: The rate at which stable jobs begin and end.
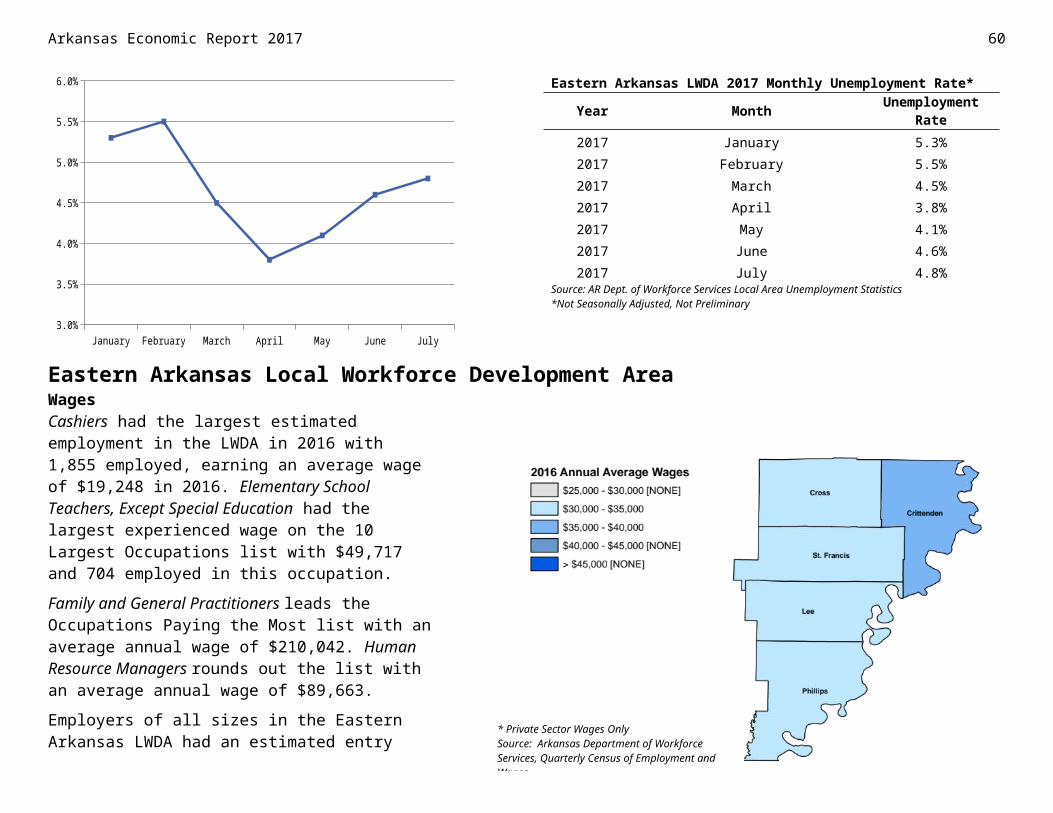
than in 2015. Separations increased from the second quarter of 2015 by 1,888 to 22,068. The turnover rate was 9.8 percent in the second quarter of 2016.
61Arkansas Economic Report 2017
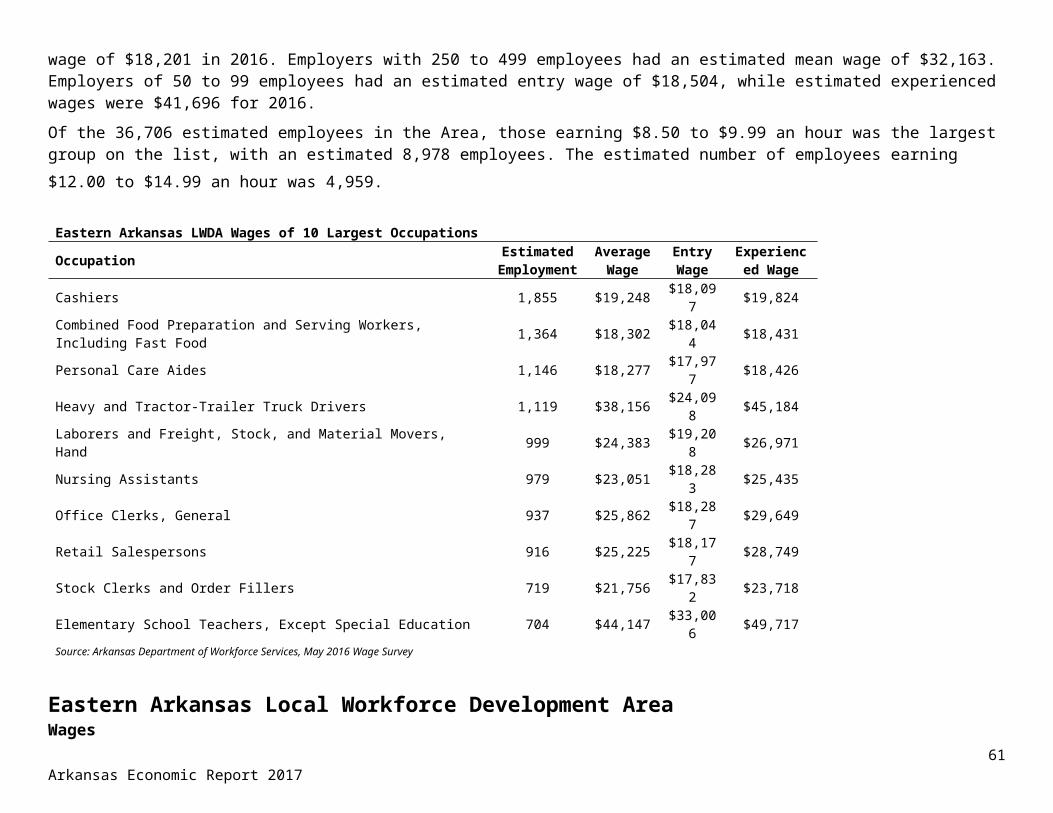
Arkansas Economic Report 2017 62
Northeast Arkansas Local Workforce Development AreaEmployment/Labor Force/UnemploymentThe labor force increased to 119,918 in 2016, or by 975 since 2015, but it decreased over the 2012-2016 period by 771. Employment increased by 2,596 while unemployment decreased by 1,621 from 2015 to 2016. The unemployment rate decreased to 4.3 percent, a decline of one and four-tenths percentage points from 2015 to 2016. The Area’s unemployment rate dropped to 4.1 by July 2017.
2012 2013 2014 2015 2016 100,000
105,000
110,000
115,000
120,000
125,000
Labor Force Employment
Monthly Unemployment Rate, 2017
Northeast Arkansas LWDA 2012-2016 Labor Force/EmploymentYear 2012 2013 2014 2015 2016Labor Force 120,689 117,019 117,132 118,943 119,918Employment 110,309 107,318 109,214 112,133 114,729Unemployment 10,380 9,701 7,918 6,810 5,189Unemployment Rate 8.6% 8.3% 6.8% 5.7% 4.3%Source: Arkansas Department of Workforce Services
Northeast Arkansas LWDA 2017 Monthly Unemployment Rate*
Year Month Unemployment Rate
2017 January 4.5%2017 February 4.5%2017 March 3.7%2017 April 3.1%2017 May 3.4%2017 June 4.2%2017 July 4.1%
Source: AR Dept. of Workforce Services Local Area Unemployment Statistics*Not Seasonally Adjusted, Not Preliminary
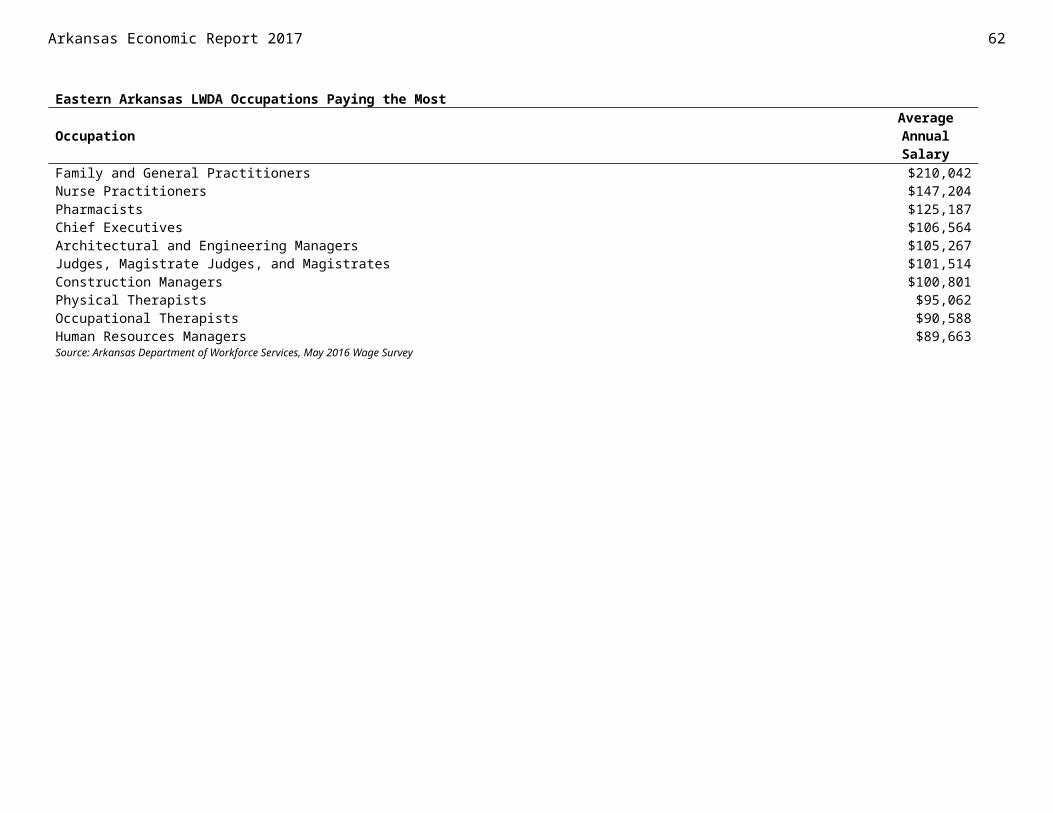
Northeast Arkansas Local Workforce Development Area
WagesCombined Food Preparation and Serving Workers, Including Fast Food was the largest occupation of 2016 for the Area with an estimated employment of 3,259, earning an entry wage of $18,138. The second largest, Retail Salespersons, had an estimated employment of 3,197 with an average wage of $23,344. General and Operations Managers had the largest average wage of the 10 largest occupations, at $75,224 annually.
Surgeons, with an average annual salary of $290,321, was the occupation paying the most in the LWDA in 2016. Internists, General earned an annual average wage of $271,376, placing it second on the list. Optometrists finished the list, earning $118,441 in 2016.
Employers of all sizes had an estimated experienced wage of $44,155 in Northeast Arkansas for 2016. Employers with 100-249 employees had an estimated mean wage of $37,122 and an estimated entry wage of $19,963. Estimated entry wages for the Area were $19,070 for employers of all sizes.
Of the 98,062 estimated employees in Northeast Arkansas, employees making $15.00 to $19.99 an hour numbered 17,387. Employees making $8.50 to $9.99 was the largest group in the Area with 20,130.
63Arkansas Economic Report 2017
January February March April May June July3.0%
3.2%
3.4%
3.6%
3.8%
4.0%
4.2%
4.4%
4.6%
* Private Sector Wages OnlySource: Arkansas Department of Workforce Services, Quarterly Census of Employment and Wages
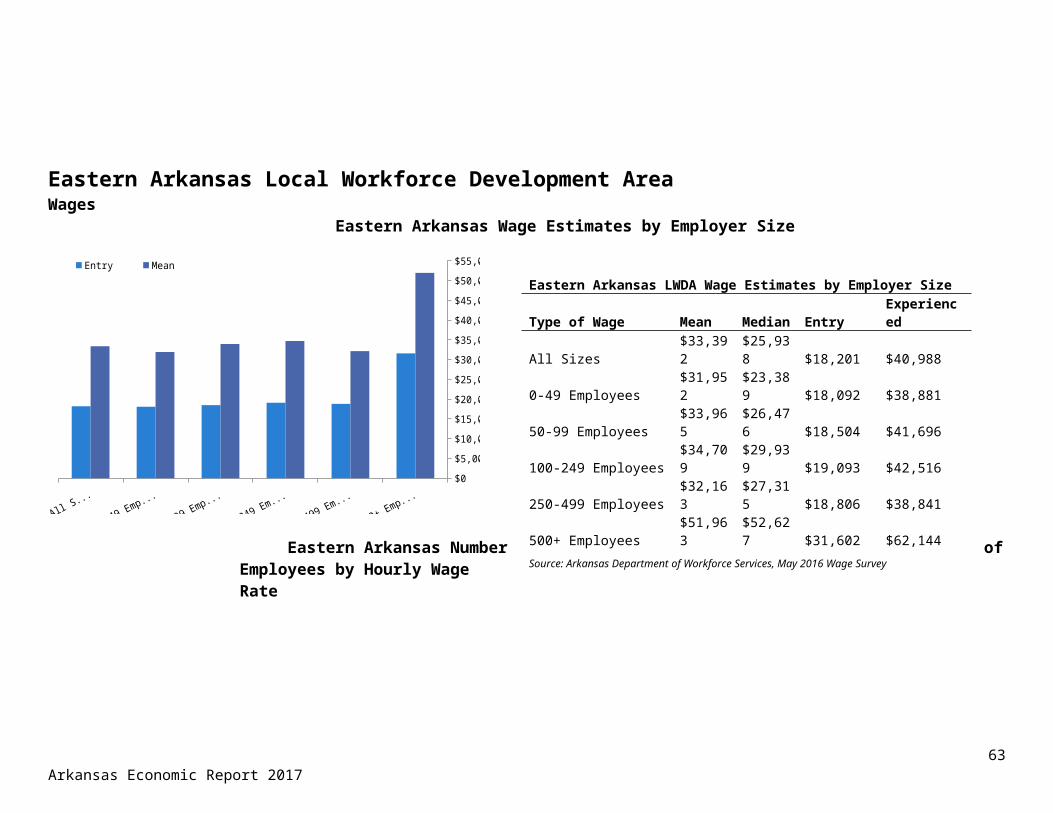
Arkansas Economic Report 2017 64
Northeast Arkansas LWDA Wages of 10 Largest Occupations
Occupation Estimated Employment
Average Wage
Entry Wage
Experienced Wage
Combined Food Preparation and Serving Workers, Including Fast Food 3,259 $18,886 $18,138 $19,261Retail Salespersons 3,197 $23,344 $18,232 $25,900Team Assemblers 3,140 $27,468 $20,827 $30,789Cashiers 2,707 $19,320 $18,130 $19,915Office Clerks, General 2,419 $25,688 $19,222 $28,920Laborers and Freight, Stock, and Material Movers, Hand 2,044 $25,658 $19,482 $28,747Waiters and Waitresses 2,013 $19,165 $18,240 $19,627Registered Nurses 1,972 $54,822 $43,485 $60,491Janitors and Cleaners, Except Maids and Housekeeping Cleaners 1,861 $20,988 $18,058 $22,454General and Operations Managers 1,578 $75,224 $33,744 $95,964Source: Arkansas Department of Workforce Services, May 2016 Wage Survey
Northeast Arkansas Local Workforce Development AreaWages
Northeast Arkansas LWDA Occupations Paying the Most
Occupation AverageAnnual Salary
Surgeons $290,321Internists, General $271,376Psychiatrists $259,143Family and General Practitioners $203,511Dentists, General $190,758Nurse Anesthetists $185,970Farmers, Ranchers, and Other Agricultural Managers $179,566Chief Executives $156,463Pharmacists $137,570Optometrists $118,441Source: Arkansas Department of Workforce Services, May 2016 Wage Survey
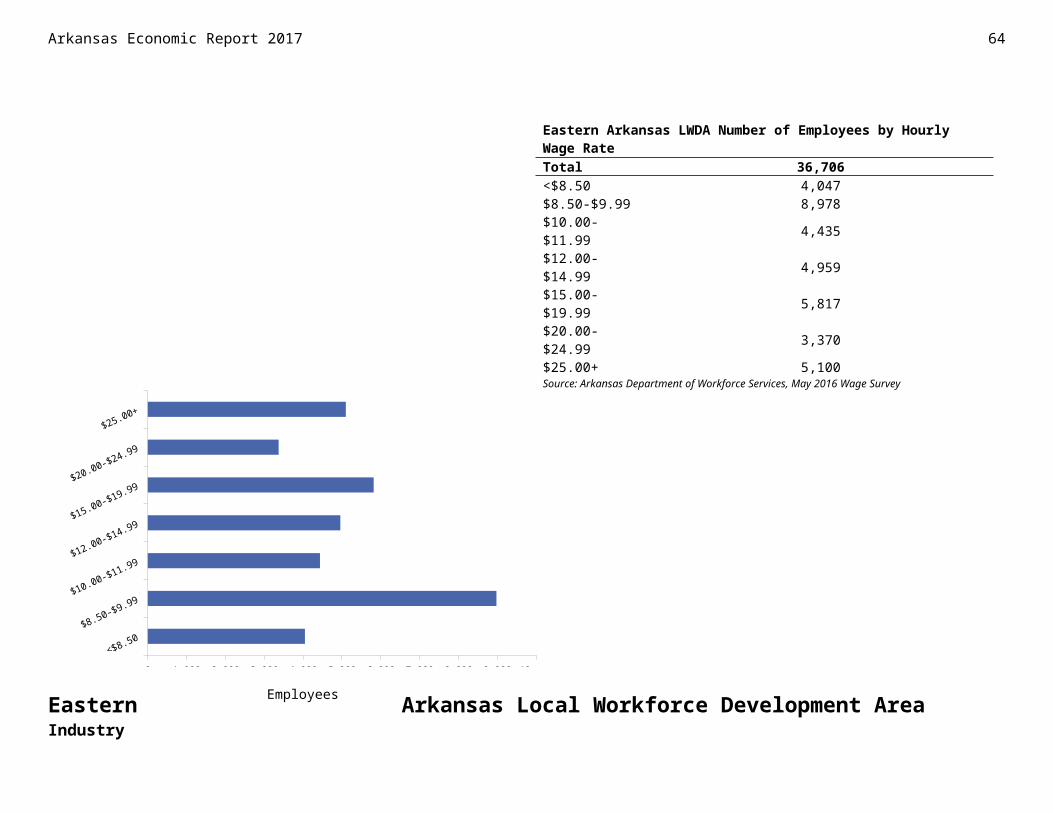
Northeast Arkansas Local Workforce Development AreaWages
Northeast Arkansas Wage Estimates by Employer Size
All Sizes
0-49 Employees
50-99 Employees
100-249 Employees
250-499 Employees
500+ Employees$0
$5,000
$10,000
$15,000
$20,000
$25,000
$30,000
$35,000
$40,000
$45,000Entry Mean
Northeast Arkansas Number of Employees by Hourly Wage Rate
65Arkansas Economic Report 2017
Northeast Arkansas LWDA Wage Estimates by Employer SizeType of Wage Mean Median Entry Experienced
All Sizes $35,793$28,260 $19,070 $44,155
0-49 Employees $33,928$25,255 $18,304 $41,741
50-99 Employees $33,724$25,482 $18,332 $41,421
100-249 Employees $37,122$30,966 $19,963 $45,701
250-499 Employees $36,155$30,178 $19,556 $44,454
500+ Employees $40,058$34,224 $21,354 $49,410
Source: Arkansas Department of Workforce Services, May 2016 Wage Survey
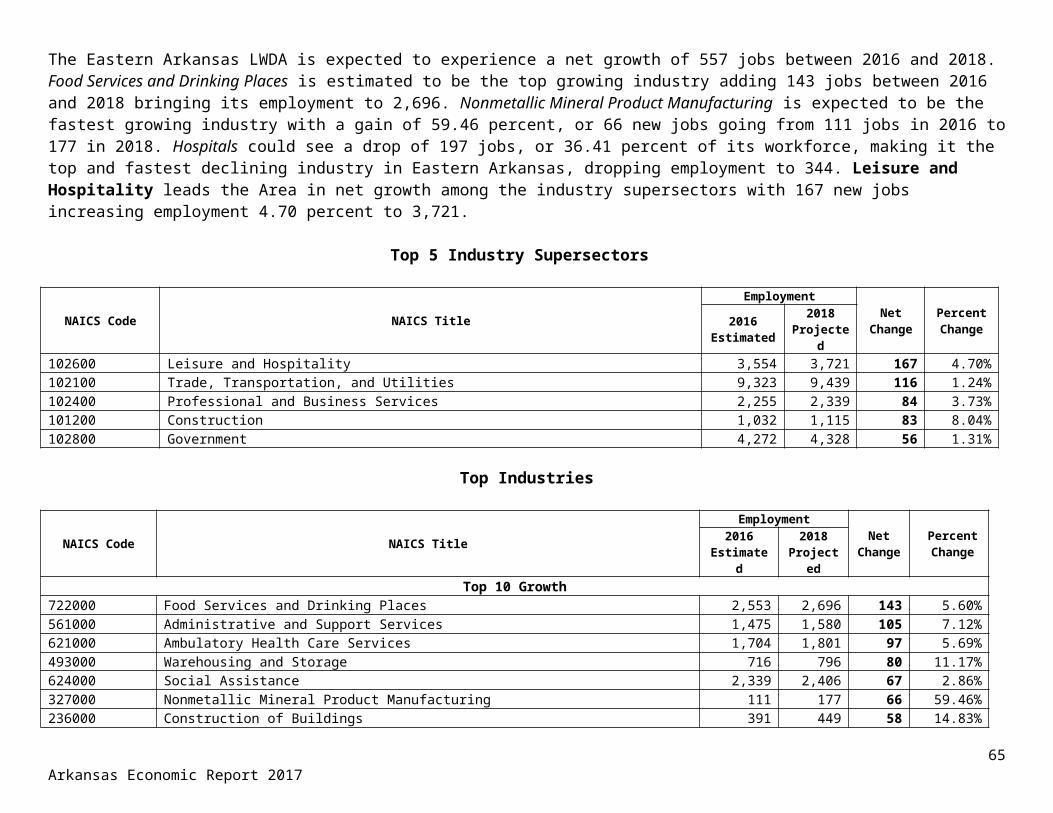
Arkansas Economic Report 2017 66
<$8.50
$8.50-$9.99
$10.00-$11.99
$12.00-$14.99
$15.00-$19.99
$20.00-$24.99
$25.00+
0 5,000 10,000 15,000 20,000 25,000
Northeast Arkansas Local Workforce Development AreaIndustryThe Northeast Arkansas LWDA is expected to add 4,719 jobs during the projection period, a 4.18 percent rise in employment. Driving this growth, Food Manufacturing is estimated to gain 762 jobs raising employment to 3,198. Animal Production may also ramp up employment in the Area with an anticipated increase of 45.16 percent to an employment of 495, making it the fastest growing industry. Transportation Equipment Manufacturing is expected to fall in employment with a cut of 150 jobs, moving employment down to 3,723, making it the top declining industry. Wholesale Electronic Markets and Agents and Brokers could be the fastest declining industry with a 19.28 percent decline, moving employment down to 134. Manufacturing is expected to be the top growing supersector with an increase of 1,348, or a 7.02 percent increase in employment to a level of 20,540.
Top 5 Industry Supersectors
NAICS Code NAICS Title
Employment Net Change
Percent Change2016
Estimated2018
Projected101300 Manufacturing 19,192 20,540 1,348 7.02%102500 Education and Health Services 27,492 28,816 1,324 4.82%102600 Leisure and Hospitality 8,898 9,378 480 5.39%102400 Professional and Business Services 6,973 7,298 325 4.66%101100 Natural Resources and Mining 3,353 3,606 253 7.55%
Top Industries
Employees
Northeast Arkansas WDA Number of Employees by Hourly Wage RateTotal 98,062<$8.50 8,094$8.50-$9.99 20,130$10.00-$11.99 12,643$12.00-$14.99 15,227$15.00-$19.99 17,387$20.00-$24.99 10,365$25.00+ 14,216Source: Arkansas Department of Workforce Services, May 2016 Wage Survey
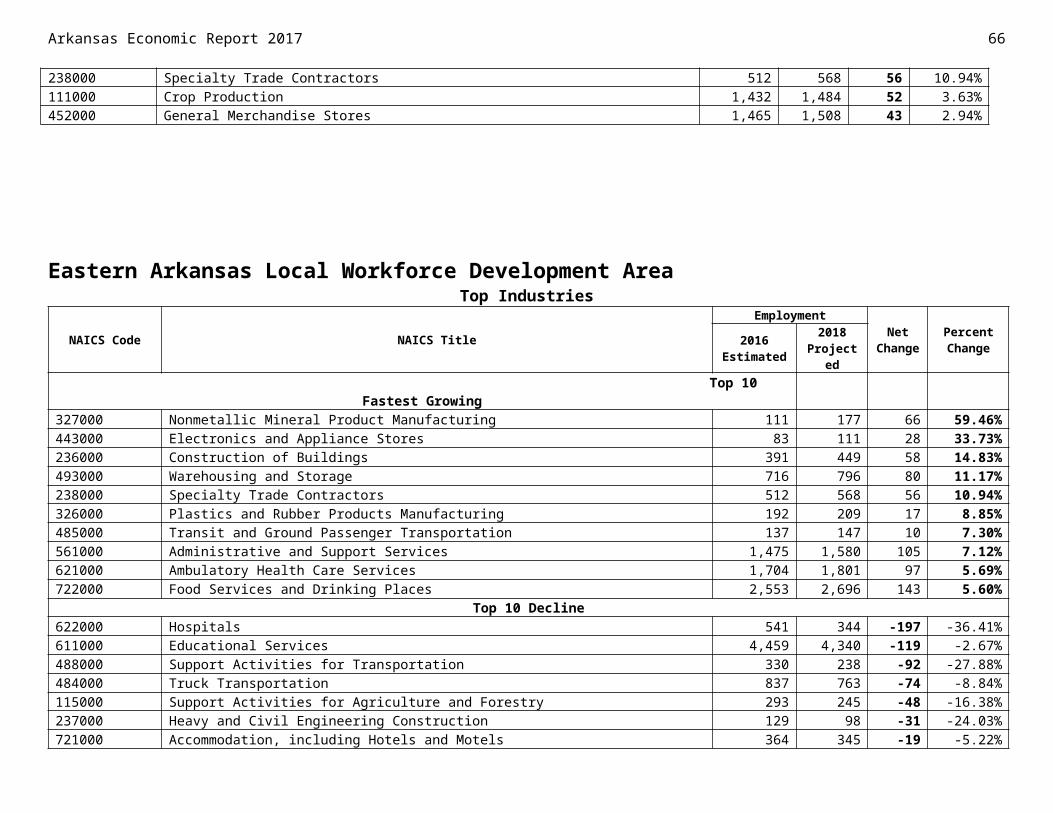
NAICS Code NAICS Title
Employment Net Change
Percent Change2016
Estimated2018
ProjectedTop 10 Growth
311000 Food Manufacturing 2,436 3,198 762 31.28%611000 Educational Services 11,194 11,726 532 4.75%722000 Food Services and Drinking Places 7,877 8,291 414 5.26%621000 Ambulatory Health Care Services 4,910 5,215 305 6.21%331000 Primary Metal Manufacturing 3,035 3,308 273 9.00%624000 Social Assistance 4,184 4,396 212 5.07%622000 Hospitals 4,812 5,020 208 4.32%333000 Machinery Manufacturing 2,172 2,343 171 7.87%561000 Administrative and Support Services 4,463 4,631 168 3.76%112000 Animal Production 341 495 154 45.16%
Northeast Arkansas Local Workforce Development Area Top Industries
NAICS Code NAICS Title
Employment Net Change
Percent Change2016
Estimated2018
ProjectedTop 10 Fastest Growth
112000 Animal Production 341 495 154 45.16%311000 Food Manufacturing 2,436 3,198 762 31.28%551000 Management of Companies and Enterprises 593 670 77 12.98%713000 Amusement, Gambling, and Recreation Industries 412 452 40 9.71%331000 Primary Metal Manufacturing 3,035 3,308 273 9.00%531000 Real Estate 701 761 60 8.56%333000 Machinery Manufacturing 2,172 2,343 171 7.87%332000 Fabricated Metal Product Manufacturing 1,419 1,523 104 7.33%238000 Specialty Trade Contractors 2,163 2,312 149 6.89%453000 Miscellaneous Store Retailers 580 618 38 6.55%
Top 10 Decline336000 Transportation Equipment Manufacturing 3,873 3,723 -150 -3.87%424000 Merchant Wholesalers, Nondurable Goods 1,539 1,433 -106 -6.89%221000 Utilities 364 300 -64 -17.58%115000 Support Activities for Agriculture and Forestry 929 871 -58 -6.24%425000 Wholesale Electronic Markets and Agents and Brokers 166 134 -32 -19.28%335000 Electrical Equipment, Appliance, and Component Manufacturing 698 669 -29 -4.15%517000 Telecommunications 252 223 -29 -11.51%812000 Personal and Laundry Services 663 643 -20 -3.02%511000 Publishing Industries (except Internet) 201 182 -19 -9.45%814000 Private Households 116 100 -16 -13.79%
Top 10 Fastest Decline67
Arkansas Economic Report 2017

Arkansas Economic Report 2017 68
425000 Wholesale Electronic Markets and Agents and Brokers 166 134 -32 -19.28%221000 Utilities 364 300 -64 -17.58%814000 Private Households 116 100 -16 -13.79%517000 Telecommunications 252 223 -29 -11.51%511000 Publishing Industries (except Internet) 201 182 -19 -9.45%322000 Paper Manufacturing 69 63 -6 -8.70%512000 Motion Picture and Sound Recording Industries 83 77 -6 -7.23%424000 Merchant Wholesalers, Nondurable Goods 1,539 1,433 -106 -6.89%115000 Support Activities for Agriculture and Forestry 929 871 -58 -6.24%454000 Nonstore Retailers 157 150 -7 -4.46%
Source: Arkansas Department of Workforce Services, Projections Suite Software
Northeast Arkansas Local Workforce Development AreaOccupationsThe Northeast Arkansas LWDA is expected to have 5,147 annual openings during the projection period with 2,463 for growth and expansion and 2,684 for replacement. Farmers, Ranchers, and Other Agricultural Managers is anticipated to be the top growing occupation with a gain of 201 jobs raising its employment to 6,264. Farmworkers, Farm, Ranch, and Aquacultural Animals is estimated to be the fastest growing occupation increasing its employment by 33.02 percent to 286. Telecommunications Line Installers and Repairers is projected to be the fastest declining occupation losing 15.56 percent of its workforce bringing employment down to 76 jobs. The occupation is tied with Electrical Power-Line Installers and Repairers as the top declining occupation with each losing 14 jobs between 2016 and 2018. Production Occupations is anticipated to add the most new jobs among the major occupational groups in Northeast Arkansas adding 625 increasing employment to 14,936.
Top 5 Major Occupational Groups
SOC Code SOC Title
Employment Growth Annual Openings2016
Estimated2018
Projected Net Percent Growth Replacement Total
51-0000 Production Occupations 14,311 14,936 625 4.37% 371 320 69153-0000 Transportation and Material Moving Occupations 9,534 10,046 512 5.37% 258 228 48635-0000 Food Preparation and Serving Related Occupations 9,088 9,528 440 4.84% 220 352 57211-0000 Management Occupations 10,901 11,321 420 3.85% 210 207 41725-0000 Education, Training, and Library Occupations 8,061 8,453 392 4.86% 196 174 370
Top Occupations
SOC Code SOC Title
Employment Growth Annual Openings2016
Estimated2018
Projected Net Percent Growth Replacement Total
Top 10 Growth11-9013 Farmers, Ranchers, and Other Agricultural Managers 6,063 6,264 201 3.32% 100 100 200
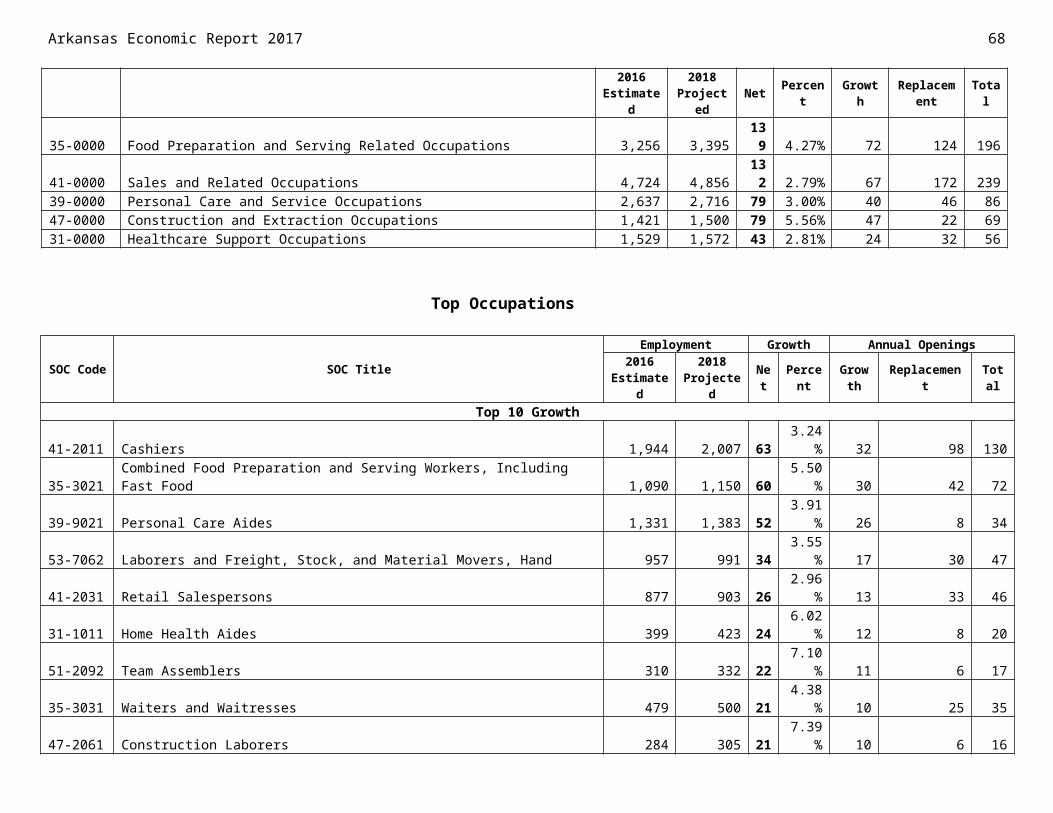
35-3021 Combined Food Preparation and Serving Workers, Including Fast Food 2,759 2,931 172 6.23% 86 108 19451-9023 Mixing and Blending Machine Setters, Operators, and Tenders 461 574 113 24.51% 56 10 6629-1141 Registered Nurses 1,970 2,075 105 5.33% 52 44 9653-7062 Laborers and Freight, Stock, and Material Movers, Hand 2,514 2,608 94 3.74% 47 78 12553-7051 Industrial Truck and Tractor Operators 766 859 93 12.14% 46 18 6435-3031 Waiters and Waitresses 1,955 2,047 92 4.71% 46 102 14839-9021 Personal Care Aides 1,493 1,583 90 6.03% 45 10 5549-9041 Industrial Machinery Mechanics 566 655 89 15.72% 44 14 5841-2031 Retail Salespersons 3,499 3,584 85 2.43% 42 131 173
Northeast Arkansas Local Workforce Development Area Top Occupations
SOC Code SOC TitleEmployment Growth Annual Openings
2016 Estimated
2018 Projected Net Percent Growth Replacement Total
Top 10 Fastest Growing45-2093 Farmworkers, Farm, Ranch, and Aquacultural Animals 215 286 71 33.02% 36 6 4251-9023 Mixing and Blending Machine Setters, Operators, and Tenders 461 574 113 24.51% 56 10 6651-9021 Crushing, Grinding, and Polishing Machine Setters, Operators, and Tenders 36 44 8 22.22% 4 0 453-7061 Cleaners of Vehicles and Equipment 364 422 58 15.93% 29 13 4249-9041 Industrial Machinery Mechanics 566 655 89 15.72% 44 14 5849-9043 Maintenance Workers, Machinery 109 124 15 13.76% 8 2 1013-1161 Market Research Analysts and Marketing Specialists 117 132 15 12.82% 8 1 953-7051 Industrial Truck and Tractor Operators 766 859 93 12.14% 46 18 6417-2112 Industrial Engineers 119 133 14 11.76% 7 4 1153-7064 Packers and Packagers, Hand 701 775 74 10.56% 37 18 55
Top 10 Decline49-9051 Electrical Power-Line Installers and Repairers 192 178 -14 -7.29% 0 8 849-9052 Telecommunications Line Installers and Repairers 90 76 -14 -15.56% 0 2 251-2022 Electrical and Electronic Equipment Assemblers 118 112 -6 -5.08% 0 2 2
51-4031Cutting, Punching, and Press Machine Setters, Operators, and Tenders, Metal and Plastic 731 725 -6 -0.82% 0 10 10
51-4072Molding, Coremaking, and Casting Machine Setters, Operators, and Tenders, Metal and Plastic 456 451 -5 -1.10% 0 8 8
51-9122 Painters, Transportation Equipment 193 188 -5 -2.59% 0 4 427-3022 Reporters and Correspondents 50 46 -4 -8.00% 0 2 2
41-4012Sales Representatives, Wholesale and Manufacturing, Except Technical and Scientific Products 1,008 1,004 -4 -0.40% 0 20 20
49-9091 Coin, Vending, and Amusement Machine Servicers and Repairers 57 53 -4 -7.02% 0 1 151-7042 Woodworking Machine Setters, Operators, and Tenders, Except Sawing 56 52 -4 -7.14% 0 1 1
Top 10 Fastest Decline49-9052 Telecommunications Line Installers and Repairers 90 76 -14 -15.56% 0 2 2
69Arkansas Economic Report 2017
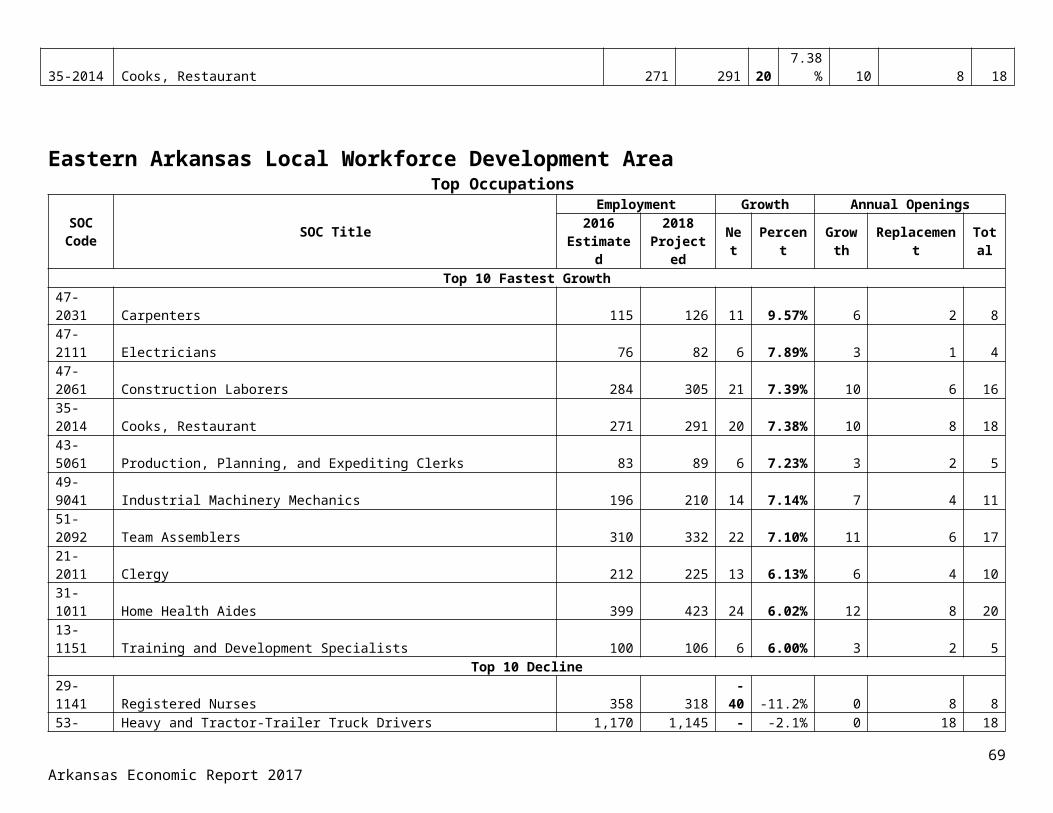
Arkansas Economic Report 2017 70
27-3022 Reporters and Correspondents 50 46 -4 -8.00% 0 2 227-3041 Editors 38 35 -3 -7.89% 0 2 249-9051 Electrical Power-Line Installers and Repairers 192 178 -14 -7.29% 0 8 851-7042 Woodworking Machine Setters, Operators, and Tenders, Except Sawing 56 52 -4 -7.14% 0 1 149-9091 Coin, Vending, and Amusement Machine Servicers and Repairers 57 53 -4 -7.02% 0 1 143-2011 Switchboard Operators, Including Answering Service 59 56 -3 -5.08% 0 1 151-2022 Electrical and Electronic Equipment Assemblers 118 112 -6 -5.08% 0 2 243-5041 Meter Readers, Utilities 65 62 -3 -4.62% 0 2 251-9122 Painters, Transportation Equipment 193 188 -5 -2.59% 0 4 4
Source: Arkansas Department of Workforce Services, Projections Suite Software
Northwest Arkansas Local Workforce Development AreaPopulationThe Northwest Arkansas Local Workforce Development Area’s population increased to 640,652 or by 11,821 in 2016. The Area has seen an increase in population of 40,604 from 2012 to 2016. The Northwest Arkansas LWDA consists of nine counties: Baxter, Benton, Boone, Carroll, Madison, Marion, Newton, Searcy, and Washington. The area borders two states, Missouri to the north and Oklahoma to the west. The Fayetteville-Springdale-Rogers Metropolitan Statistical Area, which includes McDonald County in Missouri, is located within this LWDA.
Quarterly Workforce IndicatorsJob creation decreased by 1,733 in Northwest Arkansas from second quarter of 2015 to second quarter of 2016 to 13,919,
2012 2013 2014 2015 2016 590,000
600,000
610,000
620,000
630,000
640,000
650,000
Northwest Arkansas LWDA Quarterly Workforce Indicators(All Ownerships)QWI Explorer 2012 Q2 2013 Q2 2014 Q2 2015 Q2 2016 Q2Job Creation 13,696 13,187 13,850 15,652 13,919New Hires 39,486 40,621 44,383 49,695 49,561Separations 40,802 42,132 44,807 49,207 51,035Turnover 8.2% 8.5% 8.5% 8.8% 9.3%Source: U.S.Census Bureau, Center for Economic Studies, LEHDJob Creation: Estimated number of jobs gained at firms throughout the quarter.New Hires: Estimated number of workers who started a new job.Separations: Estimated number of workers whose job with a given employer ended in the specified quarter.Turnovers: The rate at which stable jobs begin and end.
Northwest Arkansas LWDA Population 2012-20162012 2013 2014 2015 2016
600,048 609,063 617,584 628,831 640,652Source: US Census Bureau
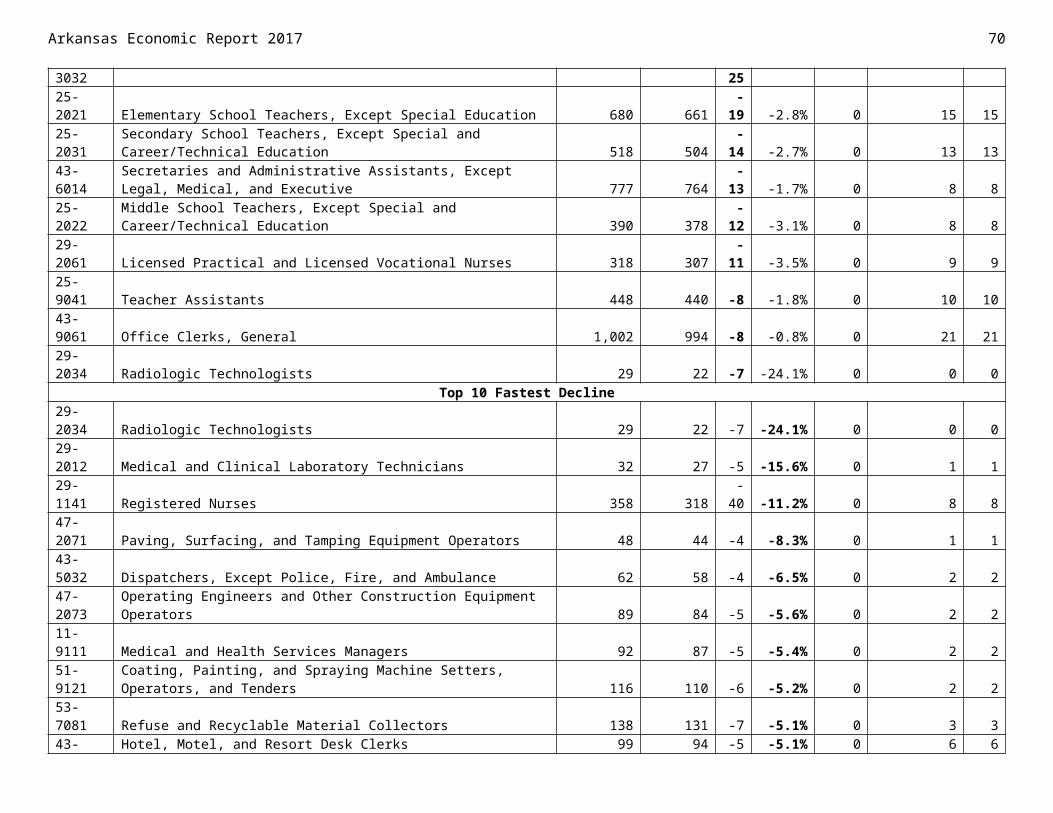
and new hires decreased by 134 to 49,561 for the same time period. Separations increased by 1,828 to 51,035 and turnover was at 9.3 percent for the second quarter of 2016.
Northwest Arkansas Local Workforce Development AreaEmployment/Labor Force/UnemploymentThe labor force and employment both increased from 2015 to 2016, with the labor force gaining 9,337 to 311,207 and employment increasing by 11,755 to 301,748. Unemployment decreased by 2,418 to 9,459 in 2016, and has seen a decline of 8,027 since 2012. The unemployment rate declined from 2015 to 2016 by nine-tenths of a percentage point to 3 percent, however the Area’s unemployment rate declined by three and two-tenths percentage points from 2012. The unemployment rate ended July 2017 at 3 percent.
2012 2013 2014 2015 2016 220,000
240,000
260,000
280,000
300,000
320,000
Labor Force Employment
Monthly Unemployment Rate, 2017
71Arkansas Economic Report 2017
Northwest Arkansas LWDA 2012-2016 Labor Force/EmploymentYear 2012 2013 2014 2015 2016Labor Force 281,953 279,994 286,626 301,870 311,207Employment 264,467 263,406 272,736 289,993 301,748Unemployment 17,486 16,588 13,890 11,877 9,459Unemployment Rate 6.2% 5.9% 4.8% 3.9% 3.0%Source: Arkansas Department of Workforce Services
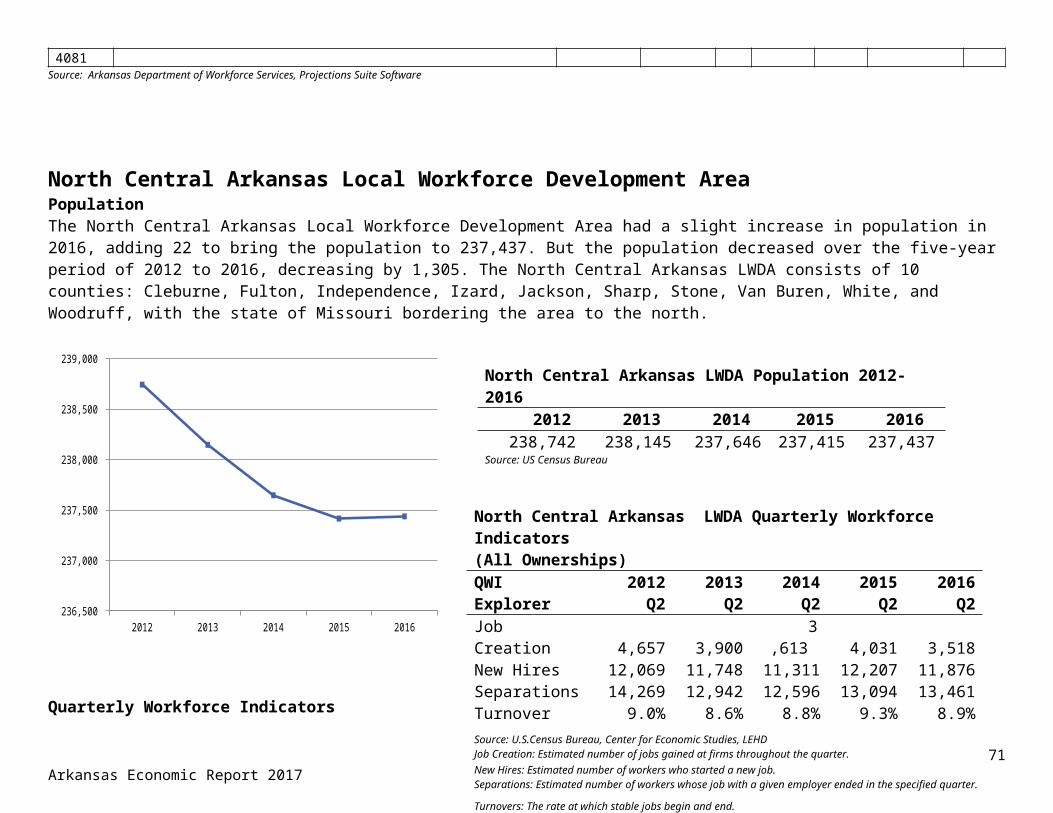
Arkansas Economic Report 2017 72
Northwest Arkansas Local Workforce Development AreaWagesHeavy and Tractor-Trailer Truck Drivers, with an estimated employment of 11,142, was the largest occupation in the Area in 2016 earning an entry wage of $31,278. General and Operations Mangers had the highest estimated experienced wage of the 10 largest occupations at $120,384 with 5,293 employed.
Internists, General had the highest average annual salary in the LWDA at $302,012 for 2016. Surgeons was second on the Occupations Paying the Most list with an average annual salary of $297,602. Marketing Mangers completed the list with an average annual salary of $163,349.
Employers of all sizes had an estimated experienced wage of $55,102 in Northwest Arkansas. Employers with 250 to 499 employees had an entry wage of $20,761 in 2016. Estimated entry wages for all sizes were $19,753 in 2016.
Of the 273,136 estimated employees in the Area, employees making $10.00 to $11.99 an hour totaled 35,205 in 2016. Employees making $25.00 or more an hour totaled 64,360. Employees earning under $8.50 an hour totaled 17,626.
Northwest Arkansas LWDA Wages of 10 Largest Occupations
JanFebr... M April May July
2.0%
2.2%
2.4%
2.6%
2.8%
3.0%
3.2%
3.4%
* Private Sector Wages OnlySource: Arkansas Department of Workforce Services, Quarterly Census of Employment and Wages
Northwest Arkansas LWDA 2017 Monthly Unemployment Rate*
Year Month Unemployment Rate
2017 January 3.2%2017 February 3.3%2017 March 2.7%2017 April 2.3%2017 May 2.6%2017 June 2.9%2017 July 3.0%
Source: AR Dept. of Workforce Services Local Area Unemployment Statistics
*Not Seasonally Adjusted, Not Preliminary
Occupation Estimated Employment
Average Wage
Entry Wage
Experienced Wage
Heavy and Tractor-Trailer Truck Drivers 11,142 $41,960 $31,278 $47,302Retail Salespersons 9,600 $25,643 $18,086 $29,422Cashiers 6,825 $19,556 $18,156 $20,256Combined Food Preparation and Serving Workers, Including Fast Food 6,799 $19,169 $18,104 $19,702Office Clerks, General 6,245 $27,168 $19,363 $31,070General and Operations Managers 5,293 $90,514 $30,775 $120,384Laborers and Freight, Stock, and Material Movers, Hand 4,888 $25,407 $20,024 $28,098Waiters and Waitresses 4,450 $18,872 $18,035 $19,290Sales Representatives, Wholesale and Manufacturing, Except Technical and Scientific Products 4,426 $71,014 $31,310 $90,866
Secretaries and Administrative Assistants, Except Legal, Medical, & Executive 4,410 $32,826 $23,088 $37,695Source: Arkansas Department of Workforce Services, May 2016 Wage Survey
Northwest Arkansas Local Workforce Development AreaWages
Northwest Arkansas LWDA Occupations Paying the Most
Occupation AverageAnnual Salary
Internists, General $302,012Surgeons $297,602Anesthesiologists $297,145Obstetricians and Gynecologists $291,049Dentists, General $261,629Family and General Practitioners $212,871Nurse Anesthetists $202,541Purchasing Managers $195,968Compensation and Benefits Managers $172,244Marketing Managers $163,349Source: Arkansas Department of Workforce Services, May 2016 Wage Survey
73Arkansas Economic Report 2017

Arkansas Economic Report 2017 74
Northwest Arkansas Local Workforce Development AreaWages
Northwest Arkansas Wage Estimates by Employer Size
Northwest Arkansas Number of Employees by Hourly Wage Rate
All Size
s
0-49 Employees
50-99 Employees
100-249 Employees
250-499 Employees
500+ Employees
$0$5,000$10,000$15,000$20,000$25,000$30,000$35,000$40,000$45,000$50,000$55,000$60,000Entry Mean
Northwest Arkansas LWDA Wage Estimates by Employer SizeType of Wage Mean Median Entry ExperiencedAll Sizes $43,319 $31,406 $19,753 $55,1020-49 Employees $38,454 $27,231 $18,733 $48,31550-99 Employees $36,420 $26,184 $18,600 $45,330100-249 Employees $39,998 $30,053 $19,889 $50,053250-499 Employees $40,561 $33,137 $20,761 $50,461500+ Employees $55,119 $41,089 $23,655 $70,850Source: Arkansas Department of Workforce Services, May 2016 Wage Survey

Northwest Arkansas Local Workforce Development AreaIndustryThe Northwest Arkansas LWDA has the largest employment base in the state and is predicted to be the top and fastest growing Area in the state, which provides job seekers with a variety of career choices among the many industries and occupations. This Area is projected to gain 14,398
jobs, an increase of 4.75 percent between 2016 and 2018. Management of Companies and Enterprises is predicted to be the top growing industry in the Area with 1,877 new jobs anticipated raising employment to 25,530. Construction of Buildings is predicted to increase by 20.15 percent, making it the fastest growing industry in the Area moving employment to 2,421. Computer and Electronic Product Manufacturing is projected to be the top and fastest declining industry with a loss of 168 jobs, or 28.67 percent of its workforce moving employment to 418. Education and Health Services is predicted to be the top growing supersector adding 3,030 new jobs increasing its workforce to 61,284.
Top 5 Industry Supersectors
NAICS Code NAICS Title
Employment Net Change
Percent Change2016
Estimated2018
Projected102500 Education and Health Services 58,254 61,284 3,030 5.20%102400 Professional and Business Services 45,899 48,891 2,992 6.52%102100 Trade, Transportation, and Utilities 59,188 61,877 2,689 4.54%102600 Leisure and Hospitality 27,770 29,262 1,492 5.37%101200 Construction 10,477 11,640 1,163 11.10%
Top Industries
NAICS Code
NAICS Title Employment Net Change
Percent Change2016 2018
75Arkansas Economic Report 2017
Employees
<$8.50$8.50-$9.99
$10.00-$11.99$12.00-$14.99$15.00-$19.99$20.00-$24.99
$25.00+
0 10,000 20,000 30,000 40,000 50,000 60,000 70,000
Employees
Northwest LWDA Number of Employees by Hourly Wage RateTotal 273,136<$8.50 17,626$8.50-$9.99 45,514$10.00-$11.99 35,205$12.00-$14.99 37,048$15.00-$19.99 45,666$20.00-$24.99 27,717$25.00+ 64,360Source: Arkansas Department of Workforce Services, May 2016 Wage Survey

Arkansas Economic Report 2017 76
Estimated Projected
Top 10 Growth551000 Management of Companies and Enterprises 23,653 25,530 1,877 7.94%611000 Educational Services 27,133 28,669 1,536 5.66%722000 Food Services and Drinking Places 22,151 23,359 1,208 5.45%238000 Specialty Trade Contractors 7,444 8,200 756 10.16%541000 Professional, Scientific, and Technical Services 11,857 12,527 670 5.65%621000 Ambulatory Health Care Services 10,527 11,181 654 6.21%311000 Food Manufacturing 14,966 15,498 532 3.55%813000 Religious, Grantmaking, Civic, Professional, and Similar Organizations 5,333 5,805 472 8.85%445000 Food and Beverage Stores 5,126 5,579 453 8.84%561000 Administrative and Support Services 9,829 10,280 451 4.59%
Northwest Arkansas Local Workforce Development Area Top Industries
NAICS Code NAICS Title
EmploymentNet
ChangePercent Change2016
Estimated2018
Projected
Top 10 Fastest Growth236000 Construction of Buildings 2,015 2,421 406 20.15%518000 Data Processing, Hosting and Related Services 244 289 45 18.44%312000 Beverage and Tobacco Product Manufacturing 255 302 47 18.43%814000 Private Households 436 513 77 17.66%314000 Textile Product Mills 507 583 76 14.99%485000 Transit and Ground Passenger Transportation 532 610 78 14.66%325000 Chemical Manufacturing 264 301 37 14.02%442000 Furniture and Home Furnishings Stores 817 928 111 13.59%811000 Repair and Maintenance 1,957 2,211 254 12.98%712000 Museums, Historical Sites, and Similar Institution 443 500 57 12.87%
Top 10 Decline334000 Computer and Electronic Product Manufacturing 586 418 -168 -28.67%331000 Primary Metal Manufacturing 1,042 910 -132 -12.67%332000 Fabricated Metal Product Manufacturing 2,953 2,838 -115 -3.89%333000 Machinery Manufacturing 1,412 1,313 -99 -7.01%323000 Printing and Related Support Activities 762 680 -82 -10.76%517000 Telecommunications 713 651 -62 -8.70%511000 Publishing Industries (except Internet) 866 806 -60 -6.93%115000 Support Activities for Agriculture and Forestry 424 414 -10 -2.36%515000 Broadcasting (except Internet) 345 335 -10 -2.90%523000 Securities, Commodity Contracts, and Other Financial Investments and Related Activities 432 423 -9 -2.08%
Top 10 Fastest Decline334000 Computer and Electronic Product Manufacturing 586 418 -168 -28.67%
331000 Primary Metal Manufacturing 1,042 910 -132 -12.67%323000 Printing and Related Support Activities 762 680 -82 -10.76%517000 Telecommunications 713 651 -62 -8.70%333000 Machinery Manufacturing 1,412 1,313 -99 -7.01%511000 Publishing Industries (except Internet) 866 806 -60 -6.93%212000 Mining (except Oil and Gas) 105 100 -5 -4.76%332000 Fabricated Metal Product Manufacturing 2,953 2,838 -115 -3.89%515000 Broadcasting (except Internet) 345 335 -10 -2.90%115000 Support Activities for Agriculture and Forestry 424 414 -10 -2.36%
Source: Arkansas Department of Workforce Services, Projections Suite Software
Northwest Arkansas Local Workforce Development AreaOccupationsThe Northwest Arkansas LWDA is projected to have 14,428 annual job openings and the only Area where growth openings exceed replacement with 7,346 for growth and expansion and 7,082 for replacement. Retail Salespersons is estimated to drive growth adding 610 new jobs, making it the top growing occupation in Northwest Arkansas increasing employment to 11,546. Helpers--Carpenters is predicted to be the fastest growing occupation raising employment 13.79 percent. Electrical and Electronic Equipment Assemblers is forecasted to be the fastest declining occupation losing 12.82 percent of its workforce dropping to an employment of 238 and is tied with Molding, Coremaking, and Casting Machine Setters, Operators, and Tenders, Metal and Plastic as the top declining occupation with 35 job losses each. Office and Administrative Support Occupations is expected to be the top growing major group with an increase of 1,800 new jobs moving employment from 40,836 in 2016 to 42,636 in 2018.
Top 5 Major Occupational Groups
SOC Code SOC Title
Employment Growth Annual Openings2016
Estimated2018
Projected Net Percent Growth Replacement Total
43-0000 Office and Administrative Support Occupations 40,836 42,636
1,800 4.41% 904 851
1,755
41-0000 Sales and Related Occupations 31,619 33,271
1,652 5.22% 826 1,040
1,866
11-0000 Management Occupations 31,795 33,195
1,400 4.40% 700 616
1,316
35-0000 Food Preparation and Serving Related Occupations 24,403 25,707
1,304 5.34% 652 1,008
1,660
13-0000 Business and Financial Operations Occupations 16,739 17,910
1,171 7.00% 586 311 897
77Arkansas Economic Report 2017
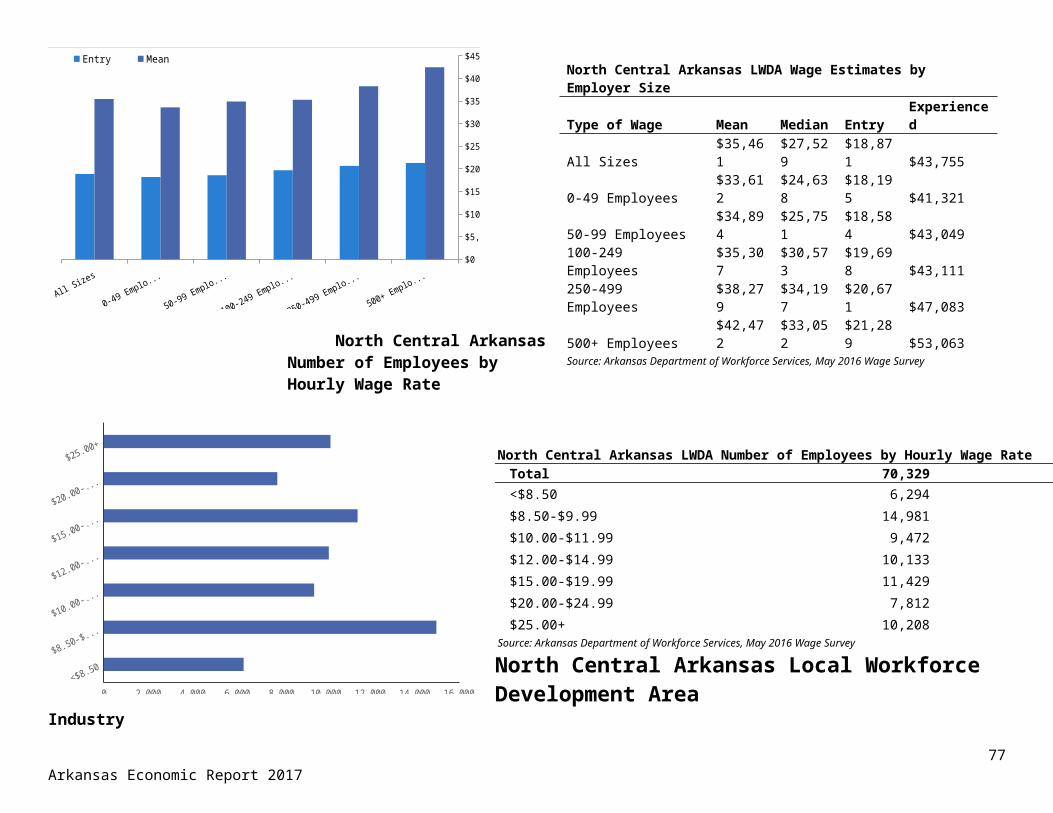
Arkansas Economic Report 2017 78
Top Occupations
Northwest Arkansas Local Workforce Development Area Top Occupations
SOC Code SOC Title
Employment Growth Annual Openings2016
Estimated2018
Projected Net Percent Growth Replacement Total
Top 10 Fastest Growth47-3012 Helpers--Carpenters 87 99 12 13.79% 6 2 815-2031 Operations Research Analysts 39 44 5 12.82% 2 0 247-2221 Structural Iron and Steel Workers 80 90 10 12.50% 5 2 747-3011 Helpers--Brickmasons, Blockmasons, Stonemasons, and Tile and Marble Setters 82 92 10 12.20% 5 2 747-3013 Helpers--Electricians 117 131 14 11.97% 7 2 941-3021 Insurance Sales Agents 1,031 1,147 116 11.25% 58 26 8449-2097 Electronic Home Entertainment Equipment Installers and Repairers 72 80 8 11.11% 4 1 547-2051 Cement Masons and Concrete Finishers 280 311 31 11.07% 16 4 2047-2021 Brickmasons and Blockmasons 165 183 18 10.91% 9 2 1147-3016 Helpers--Roofers 76 84 8 10.53% 4 1 5
Top 10 Decline51-2022 Electrical and Electronic Equipment Assemblers 273 238 -35 -12.82% 0 4 451-4072 Molding, Coremaking, and Casting Machine Setters, Operators, and Tenders, Metal and Plastic 479 444 -35 -7.31% 0 8 851-4081 Multiple Machine Tool Setters, Operators, and Tenders, Metal and Plastic 274 251 -23 -8.39% 0 5 551-5112 Printing Press Operators 373 350 -23 -6.17% 0 6 649-2022 Telecommunications Equipment Installers and Repairers, Except Line Installers 368 354 -14 -3.80% 0 4 451-4193 Plating and Coating Machine Setters, Operators, and Tenders, Metal and Plastic 127 113 -14 -11.02% 0 3 3
51-4033Grinding, Lapping, Polishing, and Buffing Machine Tool Setters, Operators, and Tenders, Metal and Plastic 240 228 -12 -5.00% 0 10 10
SOC Code SOC Title
Employment Growth Annual Openings2016
Estimated2018
Projected Net Percent Growth Replacement Total
Top 10 Growth41-2031 Retail Salespersons 10,936 11,546 610 5.58% 305 409 71435-3021 Combined Food Preparation and Serving Workers, Including Fast Food 5,794 6,182 388 6.70% 194 226 42011-9013 Farmers, Ranchers, and Other Agricultural Managers 13,138 13,514 376 2.86% 188 218 40641-2011 Cashiers 6,868 7,199 331 4.82% 166 348 51443-9061 Office Clerks, General 6,416 6,719 303 4.72% 152 136 28843-6014 Secretaries and Administrative Assistants, Except Legal, Medical, and Executive 5,147 5,436 289 5.61% 144 54 19811-1021 General and Operations Managers 5,050 5,337 287 5.68% 144 118 26253-3032 Heavy and Tractor-Trailer Truck Drivers 11,516 11,773 257 2.23% 128 184 31253-7062 Laborers and Freight, Stock, and Material Movers, Hand 5,477 5,705 228 4.16% 114 169 28335-3031 Waiters and Waitresses 4,678 4,903 225 4.81% 112 244 356
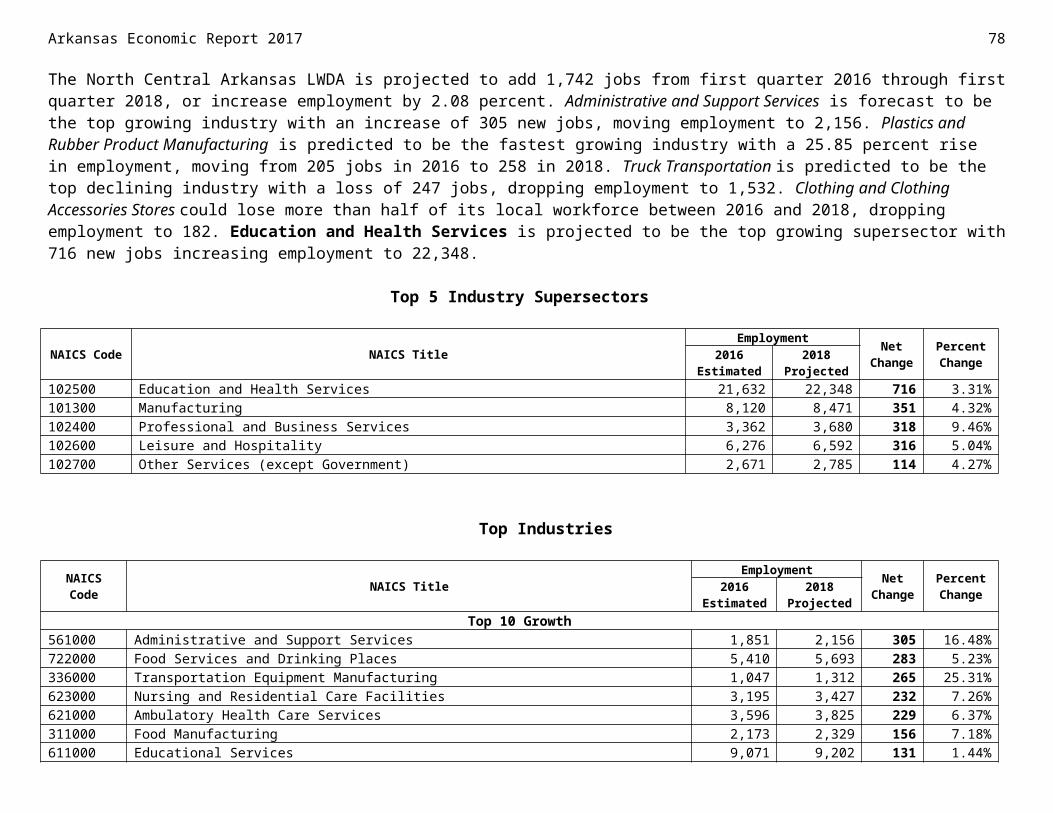
51-4111 Tool and Die Makers 149 137 -12 -8.05% 0 0 027-3022 Reporters and Correspondents 174 165 -9 -5.17% 0 6 627-3041 Editors 189 180 -9 -4.76% 0 6 6
Top 10 Fastest Decline51-2022 Electrical and Electronic Equipment Assemblers 273 238 -35 -12.82% 0 4 451-4193 Plating and Coating Machine Setters, Operators, and Tenders, Metal and Plastic 127 113 -14 -11.02% 0 3 351-4191 Heat Treating Equipment Setters, Operators, and Tenders, Metal and Plastic 44 40 -4 -9.09% 0 1 151-4081 Multiple Machine Tool Setters, Operators, and Tenders, Metal and Plastic 274 251 -23 -8.39% 0 5 551-4111 Tool and Die Makers 149 137 -12 -8.05% 0 0 051-4072 Molding, Coremaking, and Casting Machine Setters, Operators, and Tenders, Metal and Plastic 479 444 -35 -7.31% 0 8 851-5112 Printing Press Operators 373 350 -23 -6.17% 0 6 617-3027 Mechanical Engineering Technicians 67 63 -4 -5.97% 0 2 227-3022 Reporters and Correspondents 174 165 -9 -5.17% 0 6 6
51-4033Grinding, Lapping, Polishing, and Buffing Machine Tool Setters, Operators, and Tenders, Metal and Plastic 240 228 -12 -5.00% 0 10 10
Source: Arkansas Department of Workforce Services, Projections Suite Software
Southeast Arkansas Local Workforce Development AreaPopulationThe Southeast Arkansas Local Workforce Development Area’s population decreased by 2,629 from 2015 to 201,208 in 2016 from 2015, or by 2,629. The Area has seen a decrease in population of 8,742 from 2012 to 2016. The Southeast Arkansas LWDA includes the Pine Bluff Metropolitan Statistical Area and 10 counties: Arkansas, Ashley, Bradley, Chicot, Cleveland, Desha, Drew, Grant, Jefferson, and Lincoln. Louisiana and Mississippi border the Area.
79Arkansas Economic Report 2017
Southeast Arkansas LWDA Population 2012-20162012 2013 2014 2015 2016
209,950 207,384 205,368 203,837 201,208Source: US Census Bureau
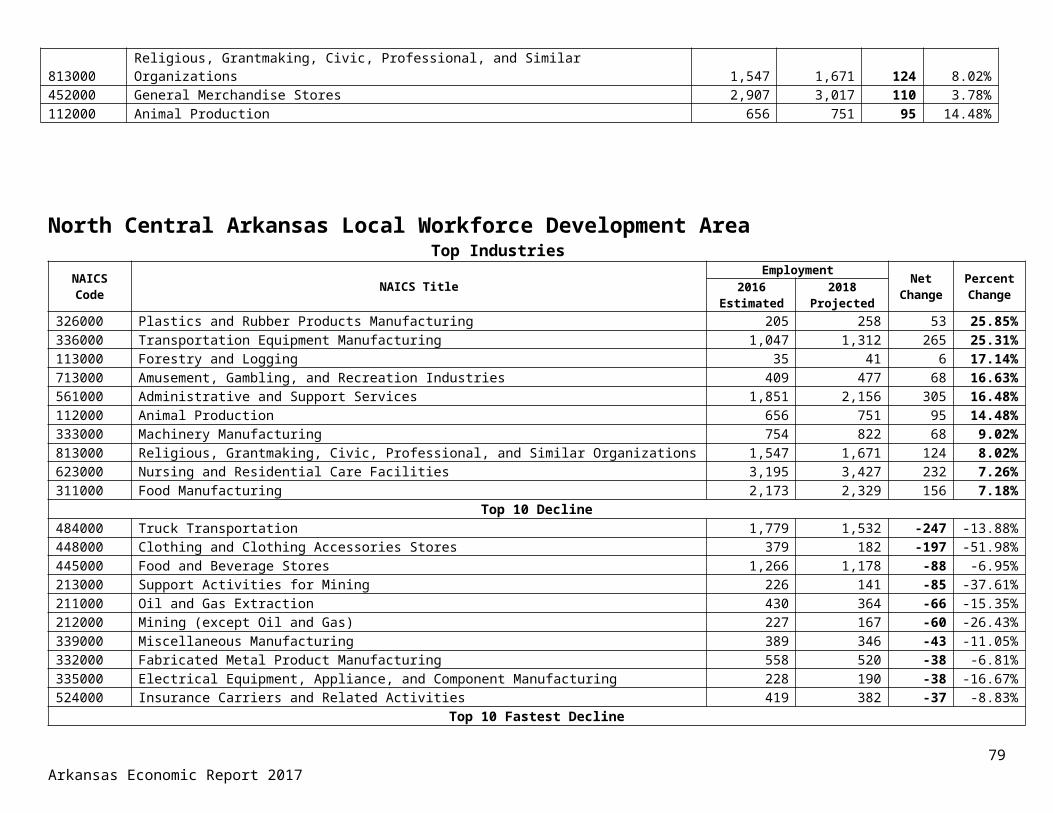
Arkansas Economic Report 2017 80
Quarterly Workforce IndicatorsJob creation decreased in Southeast Arkansas by 522 to 3,367 for the second quarter of 2016 compared to the second quarter of 2015. New hires decreased for the same time period by 67 to 10,416 while separations increased by 206 from 2015 to 2016. Turnover remained stable at 8.3 percent for the second quarter of 2016.
Southeast Arkansas Local Workforce Development AreaEmployment/Labor Force/UnemploymentSoutheast Arkansas saw a decrease in the labor force by 932 to 82,817 from 2015 to 2016, but employment increased by 217 to 78,513 for the same time period. Both the labor force and employment have decreased since 2012 by 8,357 and 3,729 respectively. Unemployment decreased by 1,149 to 4,304 from 2015 to 2016 and the unemployment rate dropped to 5.2 percent in 2016. After climbing to 5.2% in January 2017, the unemployment rate decreased sixth-tenths of a percentage point to settle at 4.9 percent in July 2017.
2012 2013 2014 2015 2016196,000
198,000
200,000
202,000
204,000
206,000
208,000
210,000
212,000
Southeast Arkansas LWDA Quarterly Workforce Indicators(All Ownerships)QWI Explorer 2012 Q2 2013 Q2 2014 Q2 2015 Q2 2016 Q2Job Creation 3,206 3,334 3,739 3,889 3,367New Hires 9,974 10,089 10,126 10,483 10,416Separations 12,687 12,251 11,288 11,852 12,058Turnover 7.9% 8.0% 7.9% 8.3% 8.3%Source: U.S.Census Bureau, Center for Economic Studies, LEHDJob Creation: Estimated number of jobs gained at firms throughout the quarter.New Hires: Estimated number of workers who started a new job.Separations: Estimated number of workers whose job with a given employer ended in the specified quarter.
Turnovers: The rate at which stable jobs begin and end.
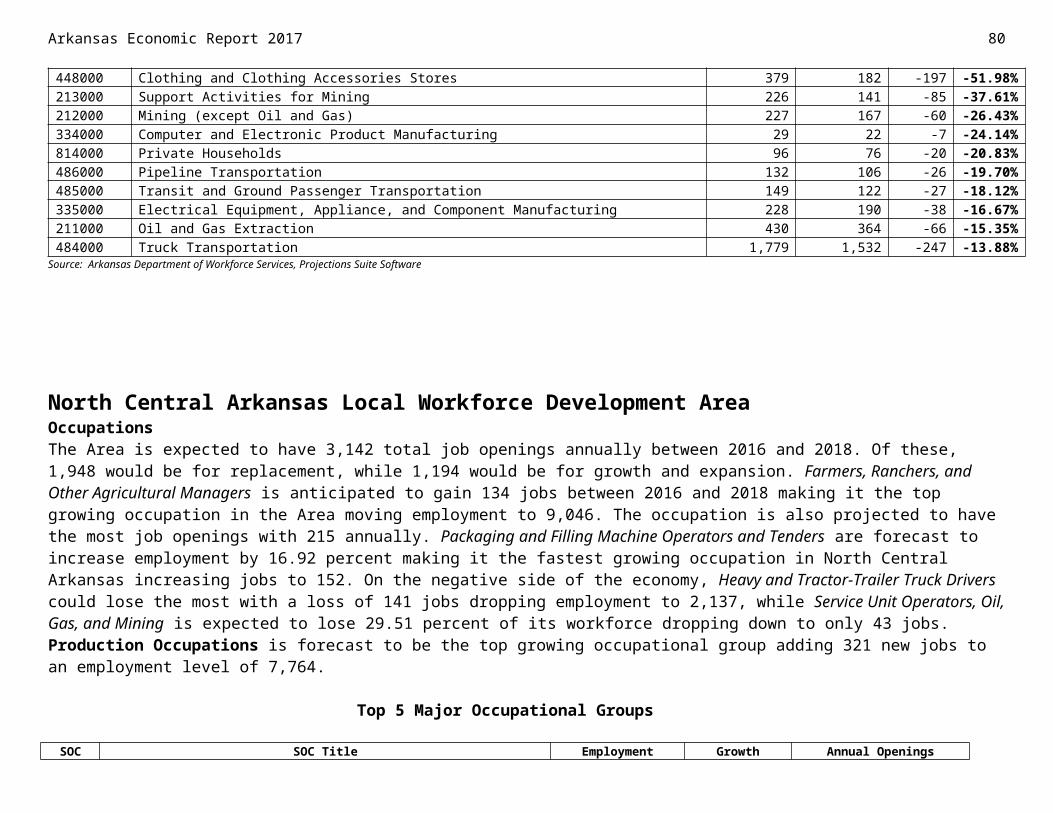
2012 2013 2014 2015 2016 70,000
75,000
80,000
85,000
90,000
95,000
Labor Force Employment
Monthly Unemployment Rate, 2017
January February March April May June July3.0%
3.5%
4.0%
4.5%
5.0%
5.5%
6.0%
Southeast Arkansas Local Workforce Development AreaWagesCashiers had the largest estimated employment in Southeast Arkansas with 2,186 employed, making an entry wage of $18,110 in 2016. Combined Food
81Arkansas Economic Report 2017
Southeast Arkansas LWDA 2012-2016 Labor Force/EmploymentYear 2012 2013 2014 2015 2016Labor Force 91,174 86,632 84,022 83,749 82,817Employment 82,242 78,372 77,305 78,296 78,513Unemployment 8,932 8,260 6,717 5,453 4,304Unemployment Rate 9.8% 9.5% 8.0% 6.5% 5.2%Source: Arkansas Department of Workforce Services
Southeast Arkansas LWDA 2017 Monthly Unemployment Rate*
Year Month UnemploymentRate
2017 January 5.5%2017 February 5.6%2017 March 4.7%2017 April 4.0%2017 May 4.3%2017 June 4.7%2017 July 4.9%
Source: AR Dept. of Workforce Services Local Area Unemployment Statistics*Not Seasonally Adjusted, Not Preliminary
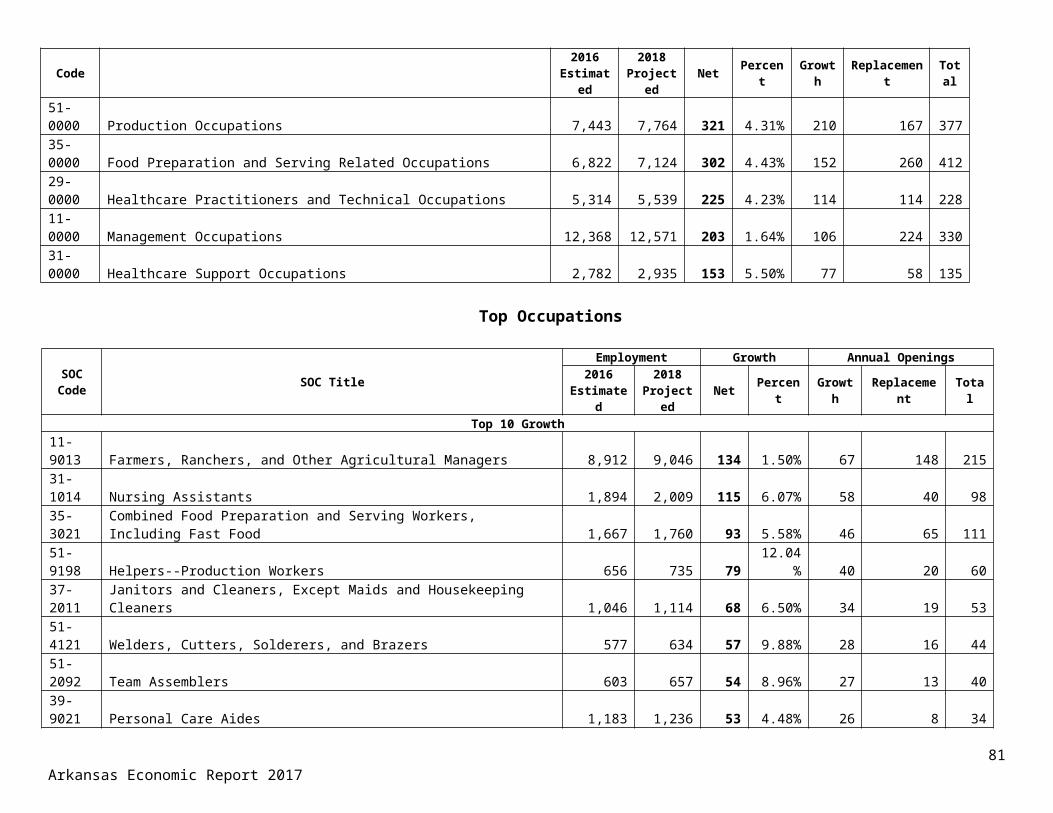
Arkansas Economic Report 2017 82
Preparation and Serving Workers, Including Fast Food had the second largest estimated employment with 1,828 employed. General and Operations Mangers had the largest experienced wage of the 10 largest occupations, making an experienced wage of $98,091 in 2016.
Family and General Practitioners, with an average annual wage of $163,455, was the occupation paying the most in 2016. Architectural and Engineering Mangers was second on the list, making an average wage of $133,155, while Microbiologists finished the list with an average wage of $96,792.
The entry wage estimate for all employer sizes in Southeast Arkansas was $19,215 in 2016. Employers with 250 to 499 employees had an estimated mean wage of $36,781. Experienced wages for all employer categories for the Area were at $45,050.
Of the 70,785 estimated number of employees, Southeast Arkansas employees making $15.00 to $19.99 an hour numbered 13,825 and was the largest group in 2016. Coming in as the second largest group, employees making $8.50 to $9.99 an hour numbered 13,513 in 2016.
Southeast Arkansas LWDA Wages of 10 Largest Occupations
Occupation Estimated Employment
Average Wage
Entry Wage
Experienced Wage
Cashiers 2,186 $18,864 $18,110 $19,240Combined Food Preparation and Serving Workers, Including Fast Food 1,828 $18,449 $18,092 $18,628Heavy and Tractor-Trailer Truck Drivers 1,794 $34,274 $23,593 $39,614Office Clerks, General 1,741 $25,264 $18,832 $28,479Correctional Officers and Jailers 1,623 $34,546 $27,997 $37,820Laborers and Freight, Stock, and Material Movers, Hand 1,517 $24,114 $19,027 $26,657Retail Salespersons 1,492 $24,475 $18,188 $27,618Nursing Assistants 1,355 $21,577 $18,246 $23,242Secretaries and Administrative Assistants, Except Legal, Medical, & Executive 1,187 $27,399 $19,742 $31,227General and Operations Managers 1,157 $76,785 $34,173 $98,091Source: Arkansas Department of Workforce Services, May 2016 Wage Survey
Southeast Arkansas Local Workforce Development AreaWages
Southeast Arkansas LWDA Occupations Paying the Most
Occupation Average Annual Salary
Family and General Practitioners $163,455Architectural and Engineering Managers $133,155Dentists, General $123,771Medical Scientists, Except Epidemiologists $123,170Pharmacists $120,102
* Private Sector Wages OnlySource: Arkansas Department of Workforce Services, Quarterly Census of Employment and Wages
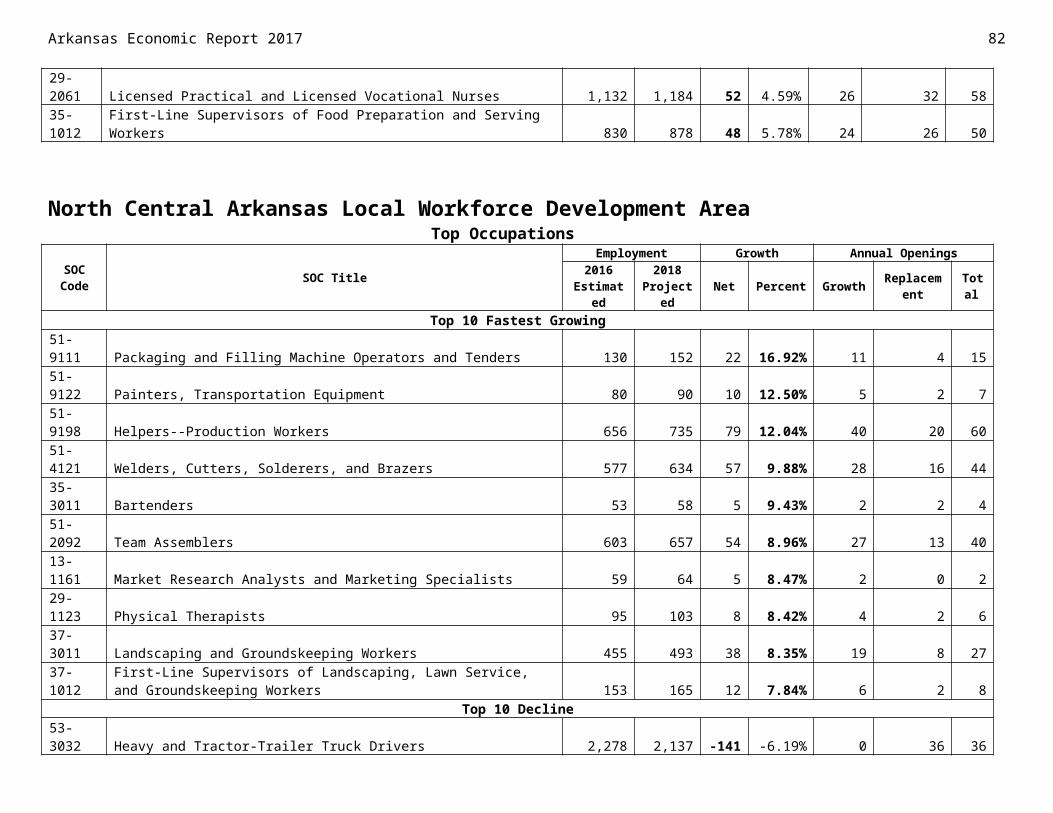
Sales Managers $118,941Nurse Practitioners $103,816Industrial Production Managers $100,486Chemists $98,617Microbiologists $96,792Source: Arkansas Department of Workforce Services, May 2016 Wage Survey
Southeast Arkansas Local Workforce Development AreaWages
Southeast Arkansas Wage Estimates by Employer Size
83Arkansas Economic Report 2017
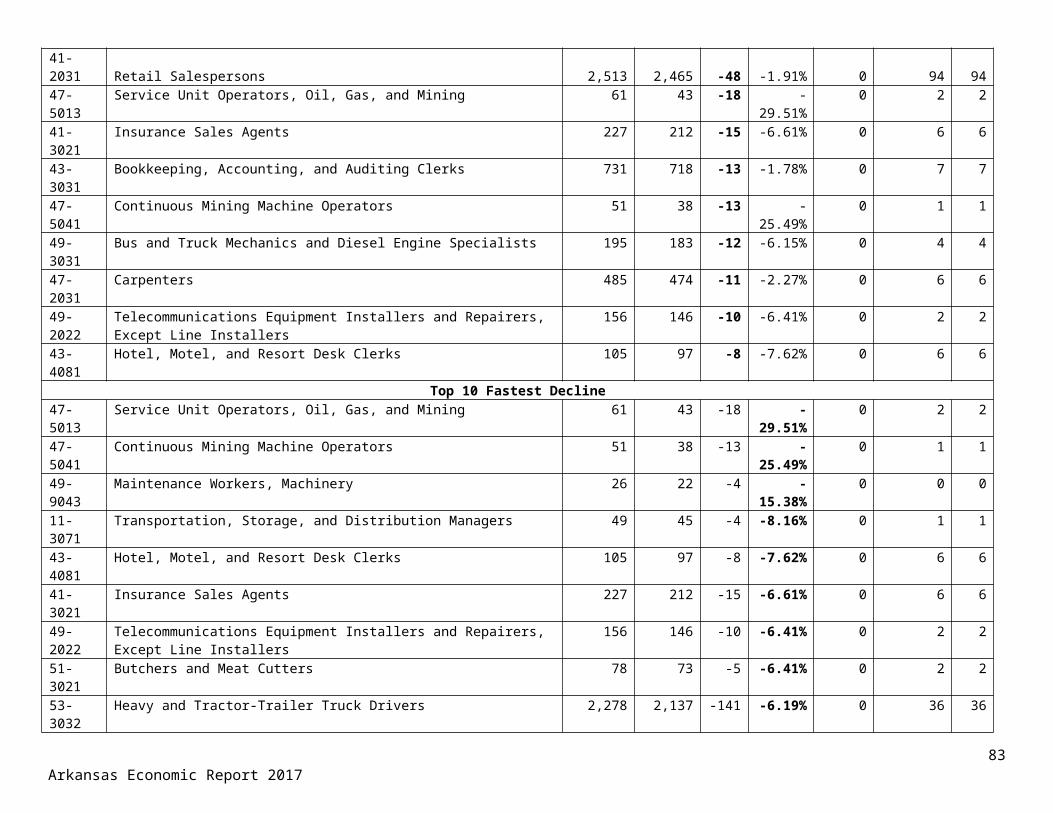
Arkansas Economic Report 2017 84
All Sizes
0-49 Employees
50-99 Employees
100-249 Employees
250-499 Employees
500+ Employees
$0
$5,000
$10,000
$15,000
$20,000
$25,000
$30,000
$35,000
$40,000
$45,000
$50,000Entry Mean
Southeast Arkansas Number of Employees by Hourly Wage Rate
Southeast Arkansas Local Workforce Development AreaIndustryThe Southeast Arkansas LWDA is expected to gain only 369 new jobs between
2016 and 2018. Food Services and Drinking Places is expected to be the top growing occupation in the Area, growing by 207 jobs to an employment level of 4,128. At 17.73 percent, Professional, Scientific, and Technical Services is predicted to be the fastest growing industry moving from 908 in 2016 to 1,069 in 2018. Paper Manufacturing is estimated to be the top declining industry losing an anticipated 181 jobs and moving employment down to 3,155. Private Households is estimated to be the fastest declining industry with a loss of 44.03 percent of its workforce, dropping
<$8.50
$8.50-$9.99$10.00-$11.99$12.00-$14.99$15.00-$19.99$20.00-$24.99
$25.00+
0 2,000 4,000 6,000 8,000 10,000 12,000 14,000 16,000
Southeast Arkansas LWDA Wage Estimates by Employer SizeType of Wage Mean Median Entry ExperiencedAll Sizes $36,438 $29,435 $19,215 $45,0500-49 Employees $33,850 $24,939 $18,223 $41,66350-99 Employees $32,991 $25,892 $18,772 $40,100100-249 Employees $36,127 $30,635 $19,768 $44,306250-499 Employees $36,781 $32,505 $20,024 $45,159500+ Employees $43,997 $37,525 $23,226 $54,382Source: Arkansas Department of Workforce Services, May 2016 Wage Survey
Southeast Arkansas LWDA Number of Employees by Hourly Wage RateTotal 70,785<$8.50 5,743$8.50-$9.99 13,513$10.00-$11.99 8,940$12.00-$14.99 9,887$15.00-$19.99 13,825$20.00-$24.99 7,579$25.00+ 11,298Source: Arkansas Department of Workforce Services, May 2016 Wage Survey
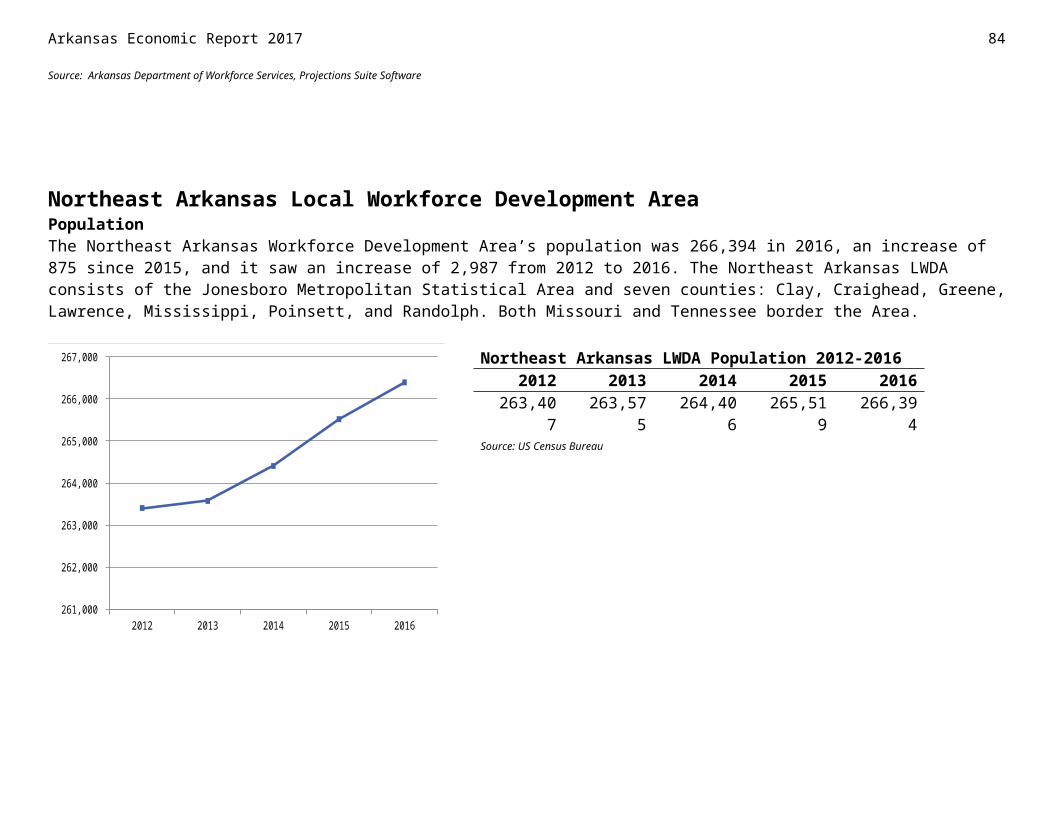
employment below 100. Professional and Business Services is projected to be the top growing industry supersector, adding 267 jobs, moving the employment level to 3,502.
Top 5 Industry Supersectors
NAICS Code NAICS Title
Employment Net Change
Percent Change2016
Estimated2018
Projected102400 Professional and Business Services 3,235 3,502 267 8.25%102500 Education and Health Services 19,561 19,805 244 1.25%102600 Leisure and Hospitality 4,549 4,790 241 5.30%102100 Trade, Transportation, and Utilities 12,046 12,121 75 0.62%101200 Construction 1,986 2,036 50 2.52%
Top Industries
NAICS Code NAICS Title
Employment Net Change
Percent Change2016
Estimated2018
ProjectedTop 10 Growth
722000 Food Services and Drinking Places 3,921 4,128 207 4.50%541000 Professional, Scientific, and Technical Services 908 1,069 161 3.68%621000 Ambulatory Health Care Services 2,517 2,659 142 8.12%611000 Educational Services 8,421 8,503 82 8.38%561000 Administrative and Support Services 1,870 1,951 81 4.68%624000 Social Assistance 3,420 3,500 80 3.02%452000 General Merchandise Stores 2,237 2,308 71 5.05%493000 Warehousing and Storage 503 556 53 4.77%999300 Local Government, Excluding Education and Hospitals 2,838 2,886 48 7.93%111000 Crop Production 1,305 1,348 43 4.37%
Southeast Arkansas Local Workforce Development Area Top Industries
NAICS Code NAICS Title
Employment Net Change
Percent Change2016
Estimated2018
ProjectedTop 10 Fastest Growth
541000 Professional, Scientific, and Technical Services 908 1,069 161 17.73%339000 Miscellaneous Manufacturing 91 106 15 16.48%
85Arkansas Economic Report 2017

Arkansas Economic Report 2017 86
493000 Warehousing and Storage 503 556 53 10.54%326000 Plastics and Rubber Products Manufacturing 420 452 32 7.62%713000 Amusement, Gambling, and Recreation Industries 187 200 13 6.95%443000 Electronics and Appliance Stores 189 201 12 6.35%551000 Management of Companies and Enterprises 349 371 22 6.30%444000 Building Material and Garden Equipment and Supplies Dealers 561 593 32 5.70%621000 Ambulatory Health Care Services 2,517 2,659 142 5.64%442000 Furniture and Home Furnishings Stores 132 139 7 5.30%
Top 10 Decline322000 Paper Manufacturing 3,336 3,155 -181 -5.43%311000 Food Manufacturing 3,342 3,167 -175 -5.24%999200 State Government, Excluding Education and Hospitals 4,328 4,197 -131 -3.03%115000 Support Activities for Agriculture and Forestry 816 743 -73 -8.95%999100 Federal Government, Excluding Post Office 1,613 1,541 -72 -4.46%424000 Merchant Wholesalers, Nondurable Goods 713 645 -68 -9.54%814000 Private Households 134 75 -59 -44.03%221000 Utilities 609 555 -54 -8.87%522000 Credit Intermediation and Related Activities 1,489 1,435 -54 -3.63%622000 Hospitals 2,896 2,859 -37 -1.28%
Top 10 Fastest Decline814000 Private Households 134 75 -59 -44.03%323000 Printing and Related Support Activities 30 24 -6 -20.00%515000 Broadcasting (except Internet) 35 29 -6 -17.14%517000 Telecommunications 142 118 -24 -16.90%424000 Merchant Wholesalers, Nondurable Goods 713 645 -68 -9.54%511000 Publishing Industries (except Internet) 126 114 -12 -9.52%115000 Support Activities for Agriculture and Forestry 816 743 -73 -8.95%221000 Utilities 609 555 -54 -8.87%485000 Transit and Ground Passenger Transportation 69 63 -6 -8.70%454000 Nonstore Retailers 93 87 -6 -6.45%
Source: Arkansas Department of Workforce Services, Projections Suite Software
Southeast Arkansas Local Workforce Development AreaOccupations
Top 5 Major Occupational Groups
SOC Code SOC TitleEmployment Growth Annual Openings
2016 Estimated
2018 Projected Net Percent Growth Replacement Total
35-0000 Food Preparation and Serving Related Occupations 4,974 5,168 194 3.90% 98 180 55741-0000 Sales and Related Occupations 7,327 7,452 125 1.71% 70 260 66229-0000 Healthcare Practitioners and Technical Occupations 4,382 4,447 65 1.48% 38 92 25825-0000 Education, Training, and Library Occupations 5,455 5,517 62 1.14% 31 116 295
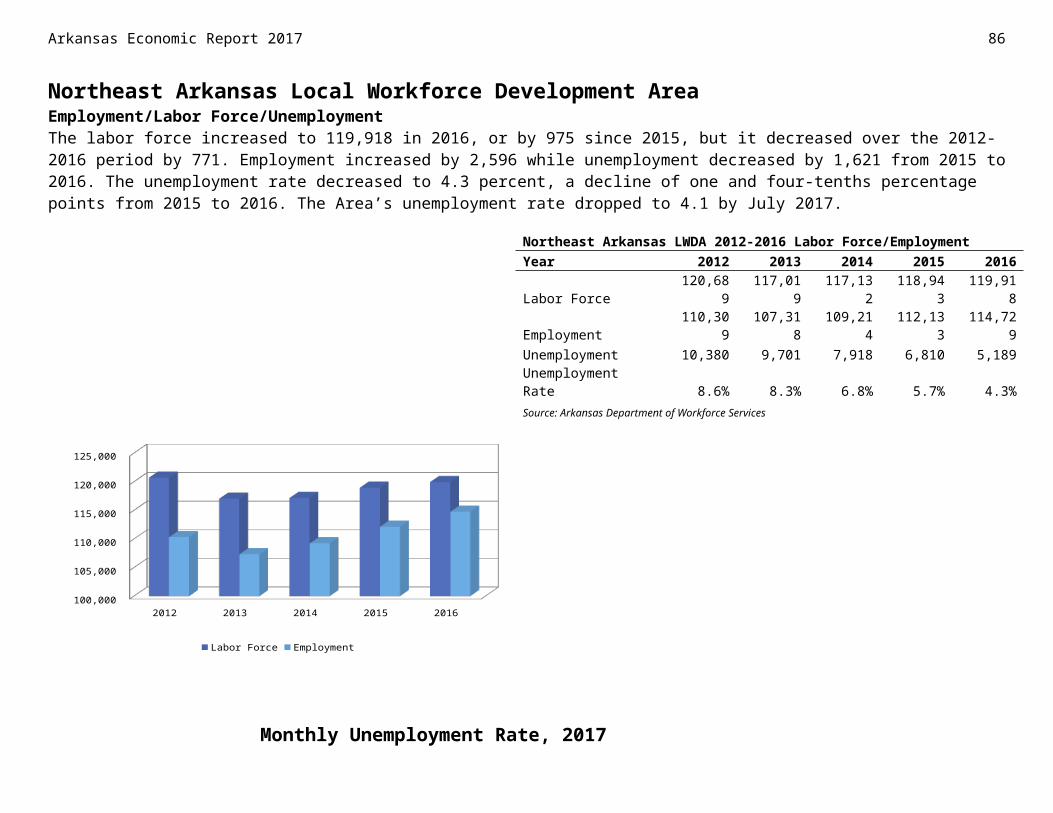
47-0000 Construction and Extraction Occupations 2,724 2,756 32 1.17% 22 42 129Southeast Arkansas LWDA employment is expected to increase by just 0.45 percent between 2016 and 2018, the slowest in the state. Of these, 504 would be for growth and expansion, while 1,912 would be for replacement. Combined Food Preparation and Serving Workers, Including Fast Food is predicted to be the top growing occupation in the Area gaining 84 new jobs between 2016 and 2018, increasing to a level of 1,488. Computer Systems Analysts is projected to be the fastest growing occupation, increasing employment by 12.50 percent to 63 employees. On the negative side of the local economy, Paper Goods Machine Setters, Operators, and Tenders is estimated to lose the most jobs with an anticipated loss of 44, moving employment from 827 in 2016 to 783 in 2018. Telecommunications Line Installers and Repairers is forecasted to be the fastest declining occupation, losing 22.58 percent of its workforce. Food Preparation and Serving Related Occupations is forecasted to be the top growing major occupational group, increasing employment by 194 to a level of 5,168.
Top Occupations
Southeast Arkansas Local Workforce Development AreaTop Occupations
SOC Code SOC Title
Employment Growth Annual Openings2016
Estimated2018
Projected Net Percent Growth Replacement Total
Top 10 Fastest Growth15-1121 Computer Systems Analysts 56 63 7 12.50% 4 0 413-1161 Market Research Analysts and Marketing Specialists 57 62 5 8.77% 2 0 235-2014 Cooks, Restaurant 410 440 30 7.32% 15 11 2629-1171 Nurse Practitioners 77 82 5 6.49% 2 2 435-3021 Combined Food Preparation and Serving Workers, Including Fast Food 1,404 1,488 84 5.98% 42 54 9629-2041 Emergency Medical Technicians and Paramedics 210 222 12 5.71% 6 3 9
87Arkansas Economic Report 2017
SOC Code SOC TitleEmployment Growth Annual Openings
2016 Estimated
2018 Projected Net Percent Growth Replacement Total
Top 10 Growth35-3021 Combined Food Preparation and Serving Workers, Including Fast Food 1,404 1,488 84 5.98% 42 54 9641-2011 Cashiers 2,484 2,534 50 2.01% 25 126 15141-2031 Retail Salespersons 1,841 1,891 50 2.72% 25 69 9435-2014 Cooks, Restaurant 410 440 30 7.32% 15 11 2635-3031 Waiters and Waitresses 410 431 21 5.12% 10 22 3239-9021 Personal Care Aides 1,196 1,214 18 1.51% 9 8 1741-1011 First-Line Supervisors of Retail Sales Workers 1,295 1,313 18 1.39% 9 30 3929-1141 Registered Nurses 1,132 1,148 16 1.41% 8 25 3337-2011 Janitors and Cleaners, Except Maids and Housekeeping Cleaners 1,141 1,156 15 1.31% 8 20 2851-4121 Welders, Cutters, Solderers, and Brazers 613 627 14 2.28% 7 17 24

Arkansas Economic Report 2017 88
23-1011 Lawyers 130 137 7 5.38% 4 2 635-3031 Waiters and Waitresses 410 431 21 5.12% 10 22 3249-9044 Millwrights 159 167 8 5.03% 4 4 813-2011 Accountants and Auditors 237 248 11 4.64% 6 6 12
Top 10 Decline51-9196 Paper Goods Machine Setters, Operators, and Tenders 827 783 -44 -5.32% 0 14 1433-3012 Correctional Officers and Jailers 1,695 1,653 -42 -2.48% 0 47 4751-9198 Helpers--Production Workers 829 797 -32 -3.86% 0 26 2643-3071 Tellers 450 424 -26 -5.78% 0 20 2037-2012 Maids and Housekeeping Cleaners 403 388 -15 -3.72% 0 9 953-7064 Packers and Packagers, Hand 426 411 -15 -3.52% 0 10 1039-9011 Childcare Workers 920 906 -14 -1.52% 0 28 2843-3031 Bookkeeping, Accounting, and Auditing Clerks 702 688 -14 -1.99% 0 7 749-9071 Maintenance and Repair Workers, General 1,025 1,014 -11 -1.07% 0 24 2449-1011 First-Line Supervisors of Mechanics, Installers, and Repairers 331 321 -10 -3.02% 0 6 6
Top 10 Fastest Decline49-9052 Telecommunications Line Installers and Repairers 31 24 -7 -22.58% 0 0 051-6031 Sewing Machine Operators 73 64 -9 -12.33% 0 0 049-2022 Telecommunications Equipment Installers and Repairers, Except Line Installers 74 68 -6 -8.11% 0 1 149-9051 Electrical Power-Line Installers and Repairers 99 91 -8 -8.08% 0 4 451-8091 Chemical Plant and System Operators 140 131 -9 -6.43% 0 5 551-9021 Crushing, Grinding, and Polishing Machine Setters, Operators, and Tenders 97 91 -6 -6.19% 0 2 243-3071 Tellers 450 424 -26 -5.78% 0 20 2051-8021 Stationary Engineers and Boiler Operators 139 131 -8 -5.76% 0 4 453-3031 Driver/Sales Workers 106 100 -6 -5.66% 0 2 251-9196 Paper Goods Machine Setters, Operators, and Tenders 827 783 -44 -5.32% 0 14 14Source: Arkansas Department of Workforce Services, Projections Suite Software
Southwest Arkansas Local Workforce Development AreaPopulationThe Southwest Arkansas Local Workforce Development Area’s population decreased by 1,709 from 2015 to 224,243 in 2016. The Area has seen a decline in population over the 2012-2016 period, losing 5,853 residents since 2012. Southwest Arkansas is the largest LWDA in the state in terms of the number of counties represented. Twelve counties are located within this region: Calhoun, Columbia, Dallas, Hempstead, Howard, Lafayette, Little River, Miller, Nevada, Ouachita, Sevier, and Union. Three states border the Area: Oklahoma to the west, Texas to the southwest, and Louisiana to the south. Miller County is part of the Texarkana AR/TX Metropolitan Statistical Area.
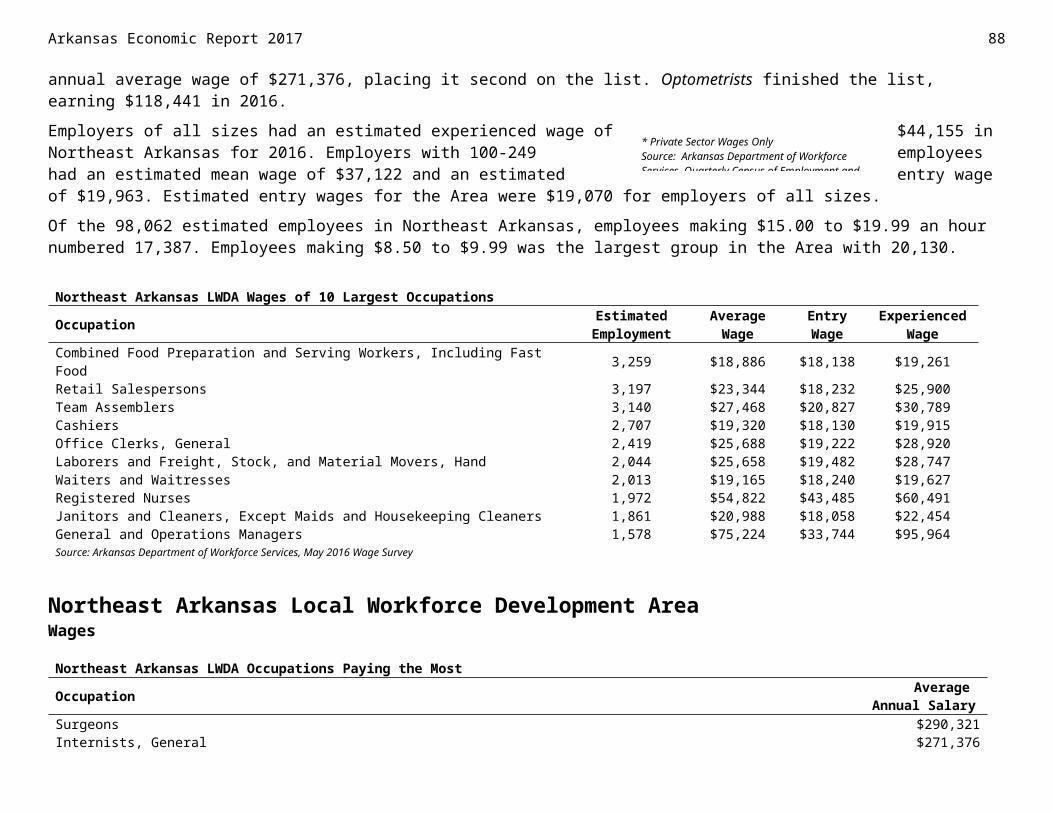
Quarterly Workforce IndicatorsJob creation decreased by 355 from the second quarter of 2015 to the second quarter of 2016 to 3,466 jobs, and also decreased from 2012 compared to 2016 with a decrease of 1,038. New hires decreased from the second quarter of 2015 to total 11,901 in the second quarter of 2016. Also, separations decreased, during the same time period, by 198, totaling 13,184 and the turnover rate was 8.2 percent in the second quarter of 2016.
89Arkansas Economic Report 2017
2012 2013 2014 2015 2016221,000
222,000
223,000
224,000
225,000
226,000
227,000
228,000
229,000
230,000
231,000Southwest Arkansas LWDA Population 2012-2016
2012 2013 2014 2015 2016 230,096 228,433 226,988 225,952 224,243
Source: US Census Bureau
Southwest Arkansas LWDA Quarterly Workforce Indicators(All Ownerships)QWI Explorer 2012 Q2 2013 Q2 2014 Q2 2015 Q2 2016 Q2Job Creation 4,504 3,231 3,297 3,821 3,466New Hires 12,563 10,686 11,999 12,462 11,901Separations 14,446 12,689 13,597 13,382 13,184Turnover 8.5% 7.7% 8.0% 7.9% 8.2%Source: U.S.Census Bureau, Center for Economic Studies, LEHDJob Creation: Estimated number of jobs gained at firms throughout the quarter.New Hires: Estimated number of workers who started a new job.Separations: Estimated number of workers whose job with a given employer ended in the specified quarter.Turnovers: The rate at which stable jobs begin and end.
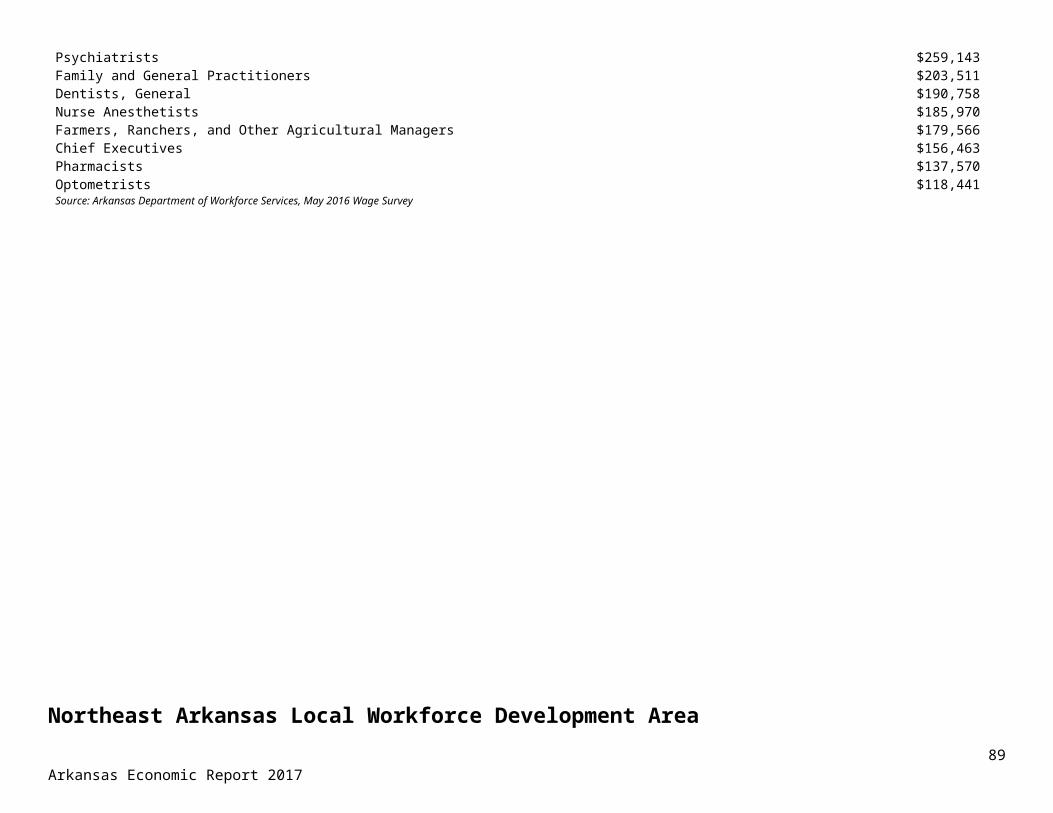
Arkansas Economic Report 2017 90
Southwest Arkansas Local Workforce Development AreaEmployment/Labor Force/UnemploymentThe labor force decreased from 2015 to 2016 by 442 to 94,423, while employment increased by 507 to 89,963. Over the five-year period from 2012 to 2016, the Area has seen a decrease of 5,307 in the labor force and a decrease of 1,619 in employment. But unemployment decreased by 949 from 2015 to 2016 and by 3,688 over the five-year period. In turn, the unemployment rate dropped one percentage point from 2015 to 2016 to 4.7 percent. After various fluctuations in the unemployment rate during 2017, the rate settled back to 4.7 percent in July 2017.
2012 2013 2014 2015 2016 80,000
82,000
84,000
86,000
88,000
90,000
92,000
94,000
96,000
98,000
100,000
Labor Force Employment
Monthly Unemployment Rate, 2017
January February March April May June July3.0%
203.0%
403.0%
603.0%
803.0%
1003.0%
1203.0%
Southwest Arkansas LWDA 2012-2016 Labor Force/EmploymentYear 2012 2013 2014 2015 2016Labor Force 99,730 94,912 93,533 94,865 94,423Employment 91,582 87,244 87,134 89,456 89,963Unemployment 8,148 7,668 6,399 5,409 4,460Unemployment Rate 8.2% 8.1% 6.8% 5.7% 4.7%Source: Arkansas Department of Workforce Services
Southwest Arkansas LWDA 2017 Monthly Unemployment Rate*
Year Month UnemploymentRate
2017 January 4.9%2017 February 5.0%2017 March 4.3%2017 April 3.7%2017 May 4.0%2017 June 4.5%2017 July 4.7%
Source: AR Dept. of Workforce Services Local Area Unemployment Statistics*Not Seasonally Adjusted, Not Preliminary
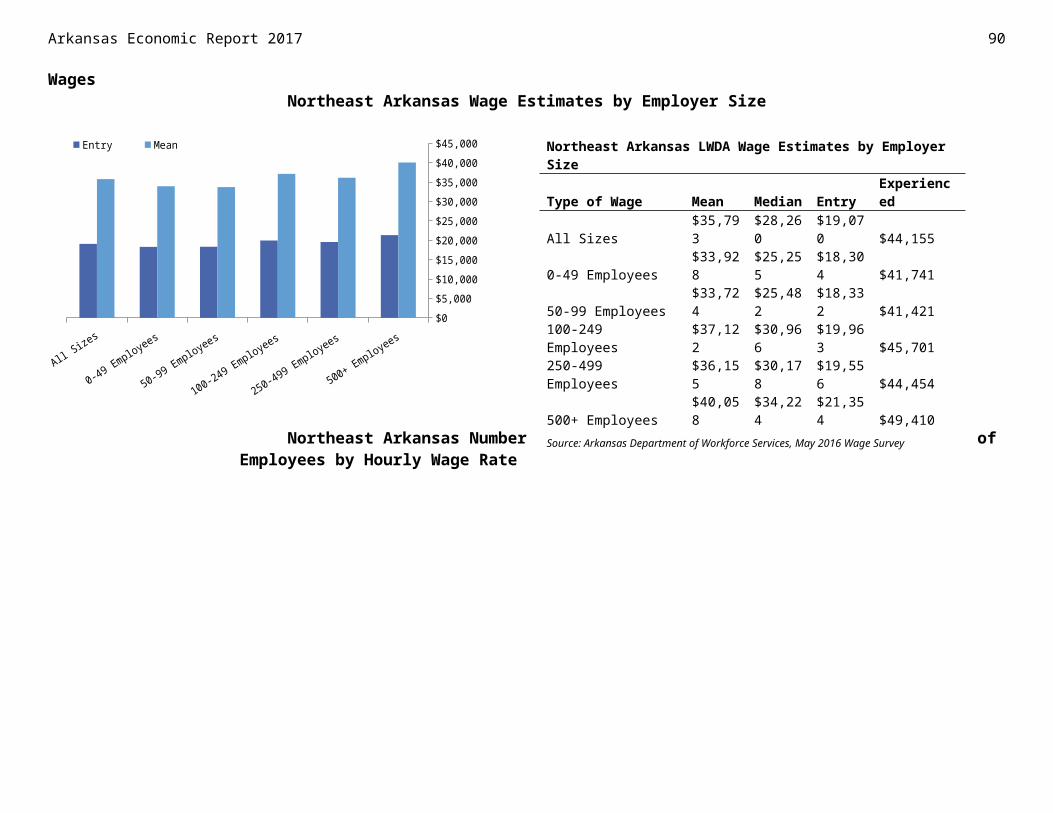
Southwest Arkansas Local Workforce Development Area WagesHeavy and Tractor-Trailer Truck Drivers was the largest occupation in the Area with 3,175 estimated employees, earning an annual average wage of $38,745 in 2016. Cashiers was second with an estimated employment of 2,845 with an entry wage of $18,131. General and Operations Managers had the highest experienced wage at $115,910.
Family and General Practitioners was the occupation paying the most for the LWDA, earning an average annual salary of $189,791. Dentists, General was second on the list, earning an average annual salary of $184,379. Completing the list, Environmental Engineers earned an average annual salary of $102,159 in 2016.
The median wage estimate for employers of all sizes in Southwest Arkansas was $29,492 in 2016. Employers with 50 to 99 employees had an estimated experienced wage of $39,778. Estimated entry wages for all employer categories was $19,256.
Of a total of 79,200 employees, 15,231 earned between $8.50 and $9.99 an hour. Employees earning $20.00 to $24.99 an hour totaled 9,271 in 2016.
Southwest Arkansas LWDA Wages of 10 Largest Occupations
Occupation Estimated Employment
AverageWage
Entry Wage
Experienced Wage
Heavy and Tractor-Trailer Truck Drivers 3,175 $38,745 $25,187 $45,524Cashiers 2,845 $18,654 $18,131 $18,915Combined Food Preparation and Serving Workers, Including Fast Food 2,269 $18,489 $18,122 $18,673Office Clerks, General 2,202 $25,366 $18,241 $28,929Laborers and Freight, Stock, and Material Movers, Hand 2,077 $25,443 $19,053 $28,638Retail Salespersons 1,952 $25,164 $18,130 $28,681Nursing Assistants 1,504 $21,161 $18,126 $22,679Secretaries and Administrative Assistants, Except Legal, Medical, & Executive 1,238 $26,745 $18,916 $30,659Licensed Practical and Licensed Vocational Nurses 1,170 $35,501 $27,972 $39,266General and Operations Managers 1,159 $89,980 $38,119 $115,910Source: Arkansas Department of Workforce Services, May 2016 Wage Survey
91Arkansas Economic Report 2017
* Private Sector Wages OnlySource: Arkansas Department of Workforce Services, Quarterly Census of Employment and Wages

Arkansas Economic Report 2017 92
Southwest Arkansas Local Workforce Development Area Wages
Southwest Arkansas LWDA Occupations Paying the Most
Occupation AverageAnnual Salary
Family and General Practitioners $189,791Dentists, General $184,379Pharmacists $130,337Software Developers, Systems Software $122,811Marketing Managers $119,453Petroleum Engineers $114,594Architectural and Engineering Managers $112,680Education Administrators, Postsecondary $110,276Personal Financial Advisors $103,982Environmental Engineers $102,159Source: Arkansas Department of Workforce Services, May 2016 Wage Survey
Southwest Arkansas Local Workforce Development Area
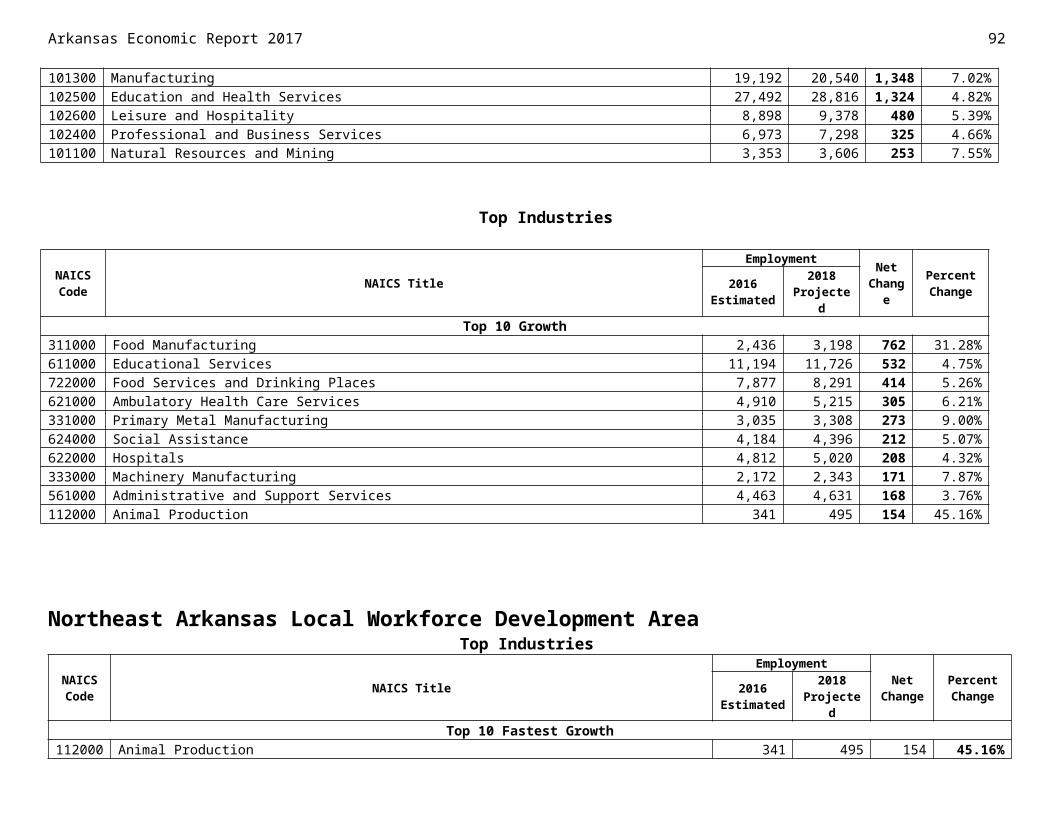
WagesSouthwest Arkansas Wage Estimates by Employer Size
All Sizes
0-49 Employees
50-99 Employees
100-249 Employees
250-499 Employees
500+ Employees$0
$5,000
$10,000
$15,000
$20,000
$25,000
$30,000
$35,000
$40,000
$45,000Entry Mean
Southwest Arkansas Number of Employees by Hourly Wage Rate
Southwest Arkansas Local Workforce Development Area IndustryEmployment in the Southwest Arkansas LWDA is projected to increase by 1,028 jobs, a 1.11 percent growth rate over the 2016-2018 projection period. Specialty Trade Contractors is predicted to lead the Area in net
93Arkansas Economic Report 2017
<$8.50$8.50-$9.99
$10.00-$11.99$12.00-$14.99$15.00-$19.99$20.00-$24.99
$25.00+
0 2,000 4,000 6,000 8,000 10,000 12,000 14,000 16,000
Southwest Arkansas LWDA Wage Estimates by Employer SizeType of Wage Mean Median Entry ExperiencedAll Sizes $36,882 $29,492 $19,256 $45,6940-49 Employees $35,445 $25,910 $18,277 $44,02950-99 Employees $32,695 $25,655 $18,530 $39,778100-249 Employees $39,246 $34,351 $21,425 $48,156250-499 Employees $38,612 $33,052 $19,381 $48,227500+ Employees $40,943 $35,824 $22,073 $50,377
Source: Arkansas Department of Workforce Services, May 2016 Wage Survey
Southwest Arkansas LWDA Number of Employees by Hourly Wage RateTotal 79,200<$8.50 6,291$8.50-$9.99 15,231$10.00-$11.99 10,543$12.00-$14.99 10,282$15.00-$19.99 13,588$20.00-$24.99 9,271$25.00+ 13,994Source: Arkansas Department of Workforce Services, May 2016 Wage Survey
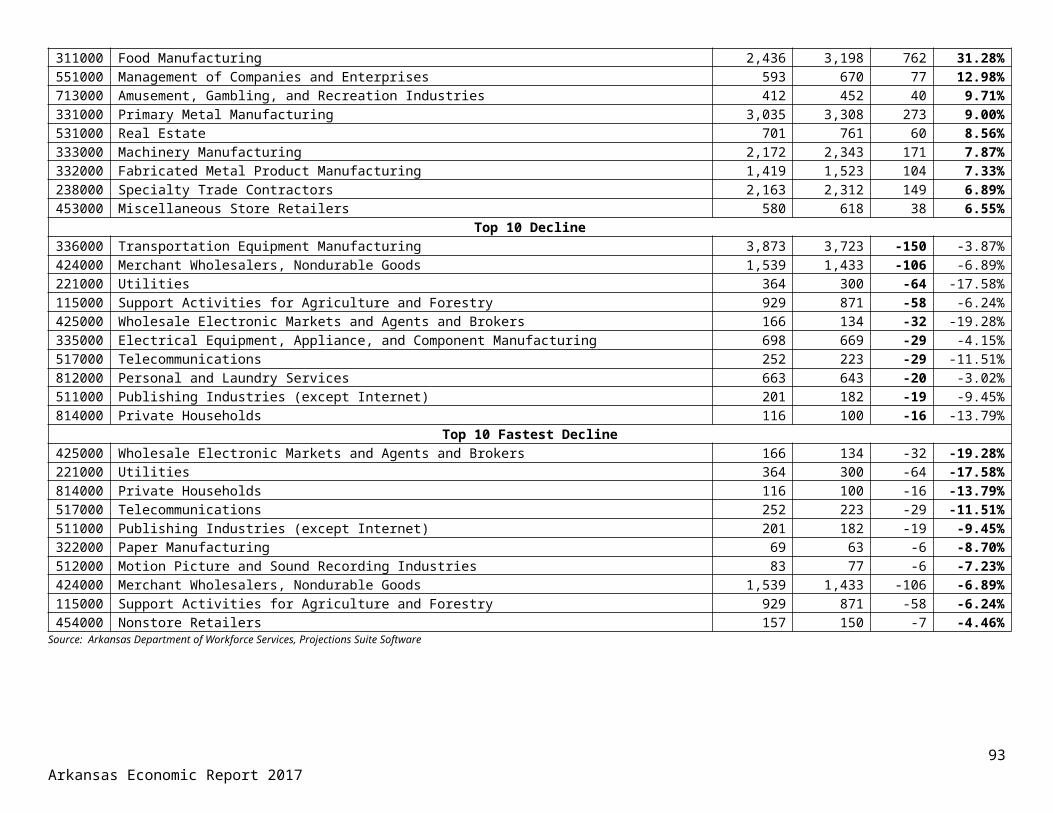
Arkansas Economic Report 2017 94
growth with 261 new jobs moving from 2,735 jobs in 2016 to 2,996 in 2018. Waste Management and Remediation Services is anticipated to be the fastest growing industry with an increase of 20.78 percent, or 106 new jobs increasing employment to 616. On the negative side of the economy, Support Activities for Mining is estimated to decline by 178 jobs, or 38.78 percent of its workforce, making it the top and fastest declining industry dropping to an employment of 281. Professional and Business Services is predicted to add the most jobs among the industry supersectors with 279 new jobs, increasing employment to 4,714.
Top 5 Industry Supersectors
NAICS Code NAICS Title
EmploymentNet Change Percent
Change2016 Estimated
2018 Projected
102400 Professional and Business Services 4,435 4,714 279 6.29%102100 Trade, Transportation, and Utilities 15,217 15,480 263 1.73%102600 Leisure and Hospitality 5,550 5,767 217 3.91%101200 Construction 3,892 4,067 175 4.50%102800 Government 6,371 6,494 123 1.93%
Top IndustriesNAICS Code NAICS Title
EmploymentNet Change Percent
Change2016 Estimated
2018 Projected
Top 10 Growth238000 Specialty Trade Contractors 2,735 2,996 261 9.54%722000 Food Services and Drinking Places 4,660 4,906 246 5.28%332000 Fabricated Metal Product Manufacturing 3,036 3,163 127 4.18%562000 Waste Management and Remediation Services 510 616 106 20.78%621000 Ambulatory Health Care Services 2,553 2,653 100 3.92%112000 Animal Production 843 917 74 8.78%624000 Social Assistance 2,299 2,372 73 3.18%321000 Wood Product Manufacturing 2,352 2,423 71 3.02%561000 Administrative and Support Services 1,738 1,809 71 4.09%551000 Management of Companies and Enterprises 1,069 1,133 64 5.99%
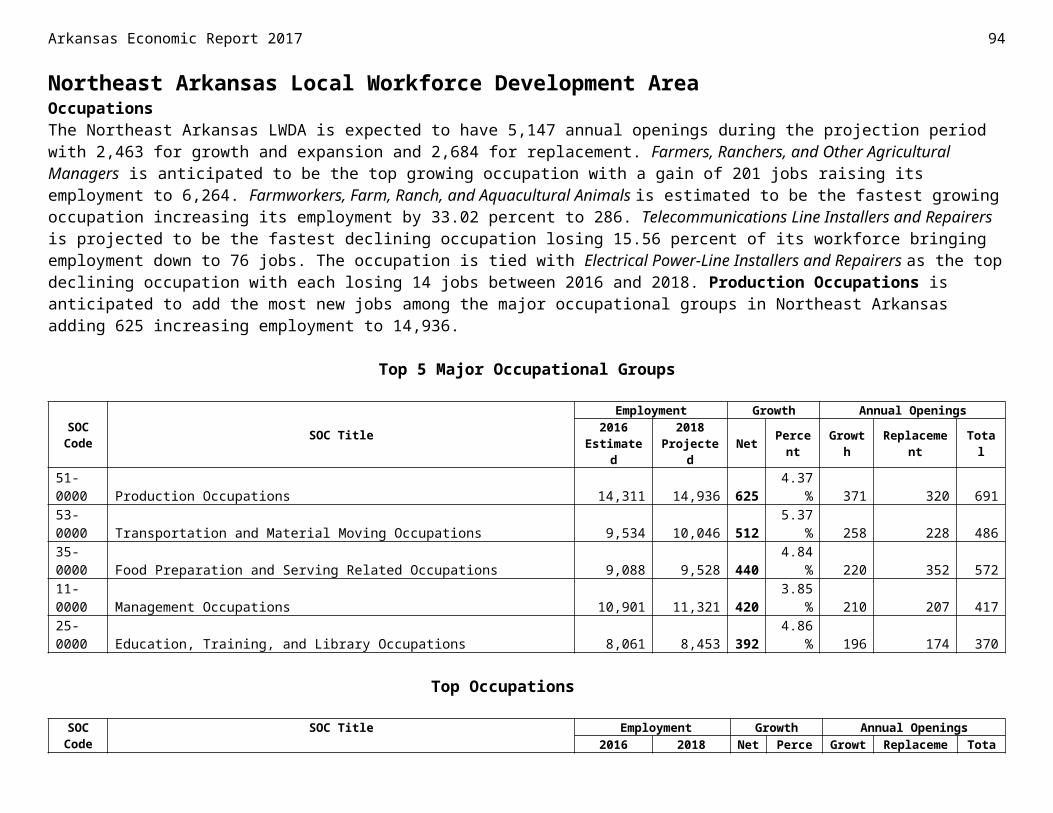
Southwest Arkansas Local Workforce Development Area Top Industries
NAICS Code NAICS Title
EmploymentNet Change Percent
Change2016 Estimated
2018 Projected
Top 10 Fastest Growth562000 Waste Management and Remediation Services 510 616 106 20.78%488000 Support Activities for Transportation 242 278 36 14.88%339000 Miscellaneous Manufacturing 88 97 9 10.23%238000 Specialty Trade Contractors 2,735 2,996 261 9.54%493000 Warehousing and Storage 45 49 4 8.89%112000 Animal Production 843 917 74 8.78%492000 Couriers and Messengers 265 288 23 8.68%336000 Transportation Equipment Manufacturing 449 482 33 7.35%486000 Pipeline Transportation 151 161 10 6.62%551000 Management of Companies and Enterprises 1,069 1,133 64 5.99%
Top 10 Decline213000 Support Activities for Mining 459 281 -178 -38.78%322000 Paper Manufacturing 1,364 1,209 -155 -11.36%622000 Hospitals 1,773 1,688 -85 -4.79%326000 Plastics and Rubber Products Manufacturing 2,750 2,672 -78 -2.84%611000 Educational Services 8,211 8,134 -77 -0.94%236000 Construction of Buildings 778 703 -75 -9.64%484000 Truck Transportation 3,109 3,051 -58 -1.87%211000 Oil and Gas Extraction 218 166 -52 -23.85%623000 Nursing and Residential Care Facilities 3,156 3,117 -39 -1.24%331000 Primary Metal Manufacturing 495 458 -37 -7.47%
Top 10 Fastest Decline213000 Support Activities for Mining 459 281 -178 -38.78%334000 Computer and Electronic Product Manufacturing 94 71 -23 -24.47%211000 Oil and Gas Extraction 218 166 -52 -23.85%814000 Private Households 197 162 -35 -17.77%322000 Paper Manufacturing 1,364 1,209 -155 -11.36%713000 Amusement, Gambling, and Recreation Industries 276 245 -31 -11.23%517000 Telecommunications 157 141 -16 -10.19%236000 Construction of Buildings 778 703 -75 -9.64%515000 Broadcasting (except Internet) 99 90 -9 -9.09%511000 Publishing Industries (except Internet) 153 140 -13 -8.50%
Source: Arkansas Department of Workforce Services, Projections Suite Software
Southwest Arkansas Local Workforce Development Area
95Arkansas Economic Report 2017
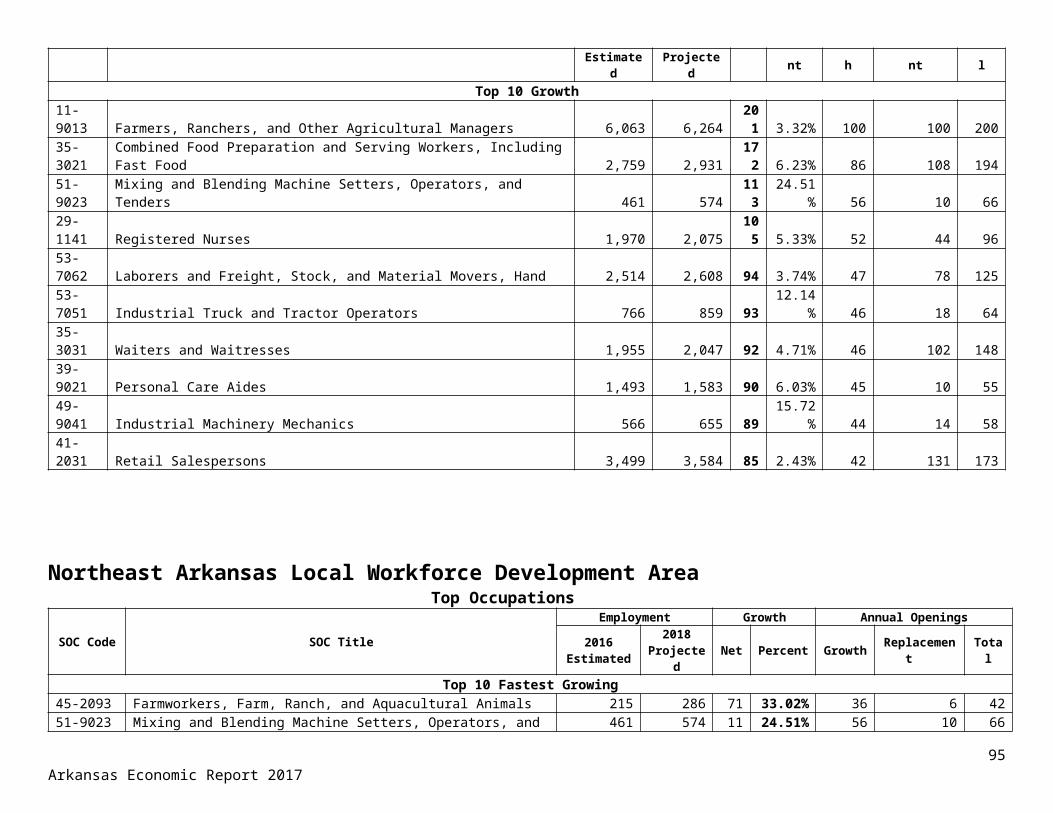
Arkansas Economic Report 2017 96
OccupationsBetween 2016 and 2018, Southwest Arkansas LWDA employers are estimated to have 2,954 job openings annually. The Area is forecast to have 2,166 replacement annual openings, or about 73.32 percent of the total job openings for the Area. Combined Food Preparation and Serving Workers, Including Fast Food is expected to be the top growing occupation adding 106 jobs between 2016 and 2018 increasing to an employment of 1,995. Electricians is predicted to be the fastest growing occupation, raising employment 8.38 percent to a level of 647. Roustabouts, Oil and Gas is forecasted to be the top and fastest declining occupation losing 55 jobs during the projection period, a 36.67 percent drop, going from 150 in 2016 to 95 in 2018. Food Preparation and Serving Related Occupations is estimated to be the top growing major occupational group increasing employment by 222 jobs to above 6,000.
Top 5 Major Occupational Groups
SOC Code SOC TitleEmployment Growth Annual Openings
2016 Estimated
2018 Projected Net Percent Growth Replacement Total
35-0000 Food Preparation and Serving Related Occupations 5,888 6,110 222 3.77% 115 222 33741-0000 Sales and Related Occupations 8,084 8,249 165 2.04% 90 276 36611-0000 Management Occupations 6,627 6,750 123 1.86% 64 133 19753-0000 Transportation and Material Moving Occupations 10,029 10,135 106 1.06% 77 223 30047-0000 Construction and Extraction Occupations 5,646 5,737 91 1.61% 102 91 193
Top Occupations
SOC Code SOC TitleEmployment Growth Annual Openings
2016Estimated
2018Projected Net Percent Growth Replacement Total
Top 10 Growth35-3021 Combined Food Preparation and Serving Workers, Including Fast Food 1,889 1,995 106 5.61% 53 74 12741-2011 Cashiers 2,439 2,505 66 2.71% 33 124 15753-7062 Laborers and Freight, Stock, and Material Movers, Hand 2,343 2,404 61 2.60% 30 72 10211-9013 Farmers, Ranchers, and Other Agricultural Managers 1,978 2,033 55 2.78% 28 33 6147-2111 Electricians 597 647 50 8.38% 25 9 3435-3031 Waiters and Waitresses 1,067 1,113 46 4.31% 23 56 7941-1011 First-Line Supervisors of Retail Sales Workers 1,500 1,537 37 2.47% 18 34 5241-2031 Retail Salespersons 2,068 2,102 34 1.64% 17 78 9545-2093 Farmworkers, Farm, Ranch, and Aquacultural Animals 428 461 33 7.71% 16 12 2839-9021 Personal Care Aides 914 945 31 3.39% 16 6 22
Southwest Arkansas Local Workforce Development Area Top Occupations
SOC Code SOC Title Employment Growth Annual Openings
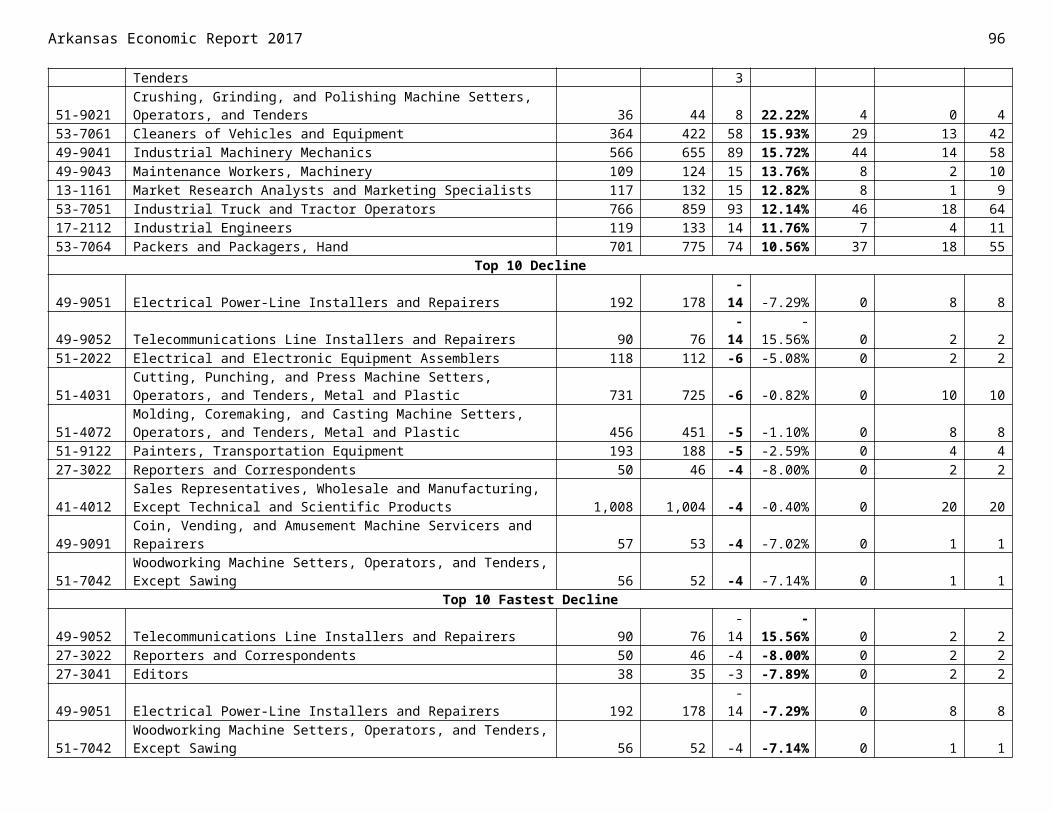
2016 Estimated
2018 Projected Net Percent Growth Replacement Total
Top 10 Fastest Growth47-2111 Electricians 597 647 50 8.38% 25 9 3445-2093 Farmworkers, Farm, Ranch, and Aquacultural Animals 428 461 33 7.71% 16 12 2849-9021 Heating, Air Conditioning, and Refrigeration Mechanics and Installers 65 70 5 7.69% 2 1 347-2181 Roofers 98 105 7 7.14% 4 2 653-7081 Refuse and Recyclable Material Collectors 192 205 13 6.77% 6 4 1039-2011 Animal Trainers 89 95 6 6.74% 3 3 615-1122 Information Security Analysts 75 80 5 6.67% 2 1 347-2151 Pipelayers 91 97 6 6.59% 3 1 435-2014 Cooks, Restaurant 416 442 26 6.25% 13 11 2435-3021 Combined Food Preparation and Serving Workers, Including Fast Food 1,889 1,995 106 5.61% 53 74 127
Top 10 Decline47-5071 Roustabouts, Oil and Gas 150 95 -55 -36.67% 0 2 247-5013 Service Unit Operators, Oil, Gas, and Mining 99 73 -26 -26.26% 0 4 451-9041 Extruding, Forming, Pressing, and Compacting Machine Setters, Operators, and Tenders 295 275 -20 -6.78% 0 10 1053-3032 Heavy and Tractor-Trailer Truck Drivers 3,823 3,803 -20 -0.52% 0 61 61
51-4033Grinding, Lapping, Polishing, and Buffing Machine Tool Setters, Operators, and Tenders, Metal and Plastic 171 152 -19 -11.11% 0 7 7
53-7073 Wellhead Pumpers 67 50 -17 -25.37% 0 2 251-9198 Helpers--Production Workers 566 552 -14 -2.47% 0 18 1851-4072 Molding, Coremaking, and Casting Machine Setters, Operators, and Tenders, Metal and Plastic 201 188 -13 -6.47% 0 3 351-9061 Inspectors, Testers, Sorters, Samplers, and Weighers 841 828 -13 -1.55% 0 21 2151-9111 Packaging and Filling Machine Operators and Tenders 287 274 -13 -4.53% 0 10 10
Top 10 Fastest Decline47-5071 Roustabouts, Oil and Gas 150 95 -55 -36.67% 0 2 247-5013 Service Unit Operators, Oil, Gas, and Mining 99 73 -26 -26.26% 0 4 453-7073 Wellhead Pumpers 67 50 -17 -25.37% 0 2 2
51-4033Grinding, Lapping, Polishing, and Buffing Machine Tool Setters, Operators, and Tenders, Metal and Plastic 171 152 -19 -11.11% 0 7 7
49-9052 Telecommunications Line Installers and Repairers 28 25 -3 -10.71% 0 0 051-9196 Paper Goods Machine Setters, Operators, and Tenders 88 79 -9 -10.23% 0 2 251-5112 Printing Press Operators 100 92 -8 -8.00% 0 2 251-9041 Extruding, Forming, Pressing, and Compacting Machine Setters, Operators, and Tenders 295 275 -20 -6.78% 0 10 1051-9121 Coating, Painting, and Spraying Machine Setters, Operators, and Tenders 91 85 -6 -6.59% 0 2 251-4072 Molding, Coremaking, and Casting Machine Setters, Operators, and Tenders, Metal and Plastic 201 188 -13 -6.47% 0 3 3Source: Arkansas Department of Workforce Services, Projections Suite Software
West Central Arkansas Local Workforce Development AreaPopulationThe West Central Arkansas Local Workforce Development Area saw a slight increase in population between 2015 and 2016 of 269 to total 315,795. The Area has seen an increase in population from 2012, gaining 260 from 2012 to 2016. The West Central Arkansas LWDA consists of 10 counties: Clark, Conway, Garland, Hot Spring, Johnson, Montgomery, Perry, Pike, Pope, and Yell; with the Hot Springs Metropolitan Statistical Area located within the LWDA.
97Arkansas Economic Report 2017
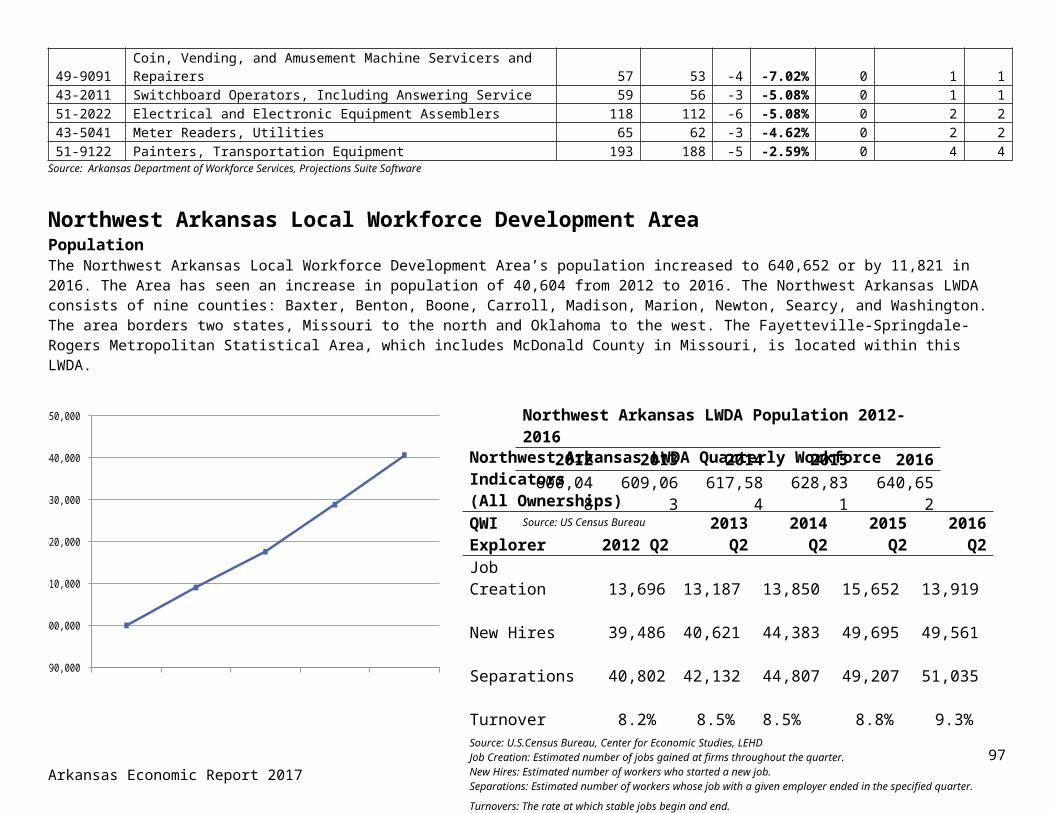
Arkansas Economic Report 2017 98
Quarterly Workforce IndicatorsJob creation decreased by 883 for the second quarter of 2016 compared to second quarter of 2015 in West Central Arkansas. New hires increased in 2016, by 333, compared to the second quarter of 2015 bringing the total of new hires to 19,425. Separations increased from the second quarter of 2015 by 2,207 to 22,609 in the second quarter of 2016. The turnover rate increased from 2015 to 2016 to 9.1 percent.
2012 2013 2014 2015 2016 314,800
315,000
315,200
315,400
315,600
315,800
316,000 West Central Arkansas LWDA Population 2012-20162012 2013 2014 2015 2016
315,535 315,163 315,549 315,526 315,795Source: US Census Bureau
West Central Arkansas LWDA Quarterly Workforce Indicators(All Ownerships)QWI Explorer 2012 Q2 2013 Q2 2014 Q2 2015 Q2 2016 Q2Job Creation 6,153 7,177 6,220 6,106 5,223New Hires 18,081 17,982 18,617 19,092 19,425Separations 20,324 20,292 20,337 20,402 22,609Turnover 8.7% 9.2% 9.0% 9.0% 9.1%Source: U.S. Census Bureau, Center for Economic Studies, LEHDJob Creation: Estimated number of jobs gained at firms throughout the quarter.New Hires: Estimated number of workers who started a new job.Separations: Estimated number of workers whose job with a given employer ended in the specified quarter.
Turnovers: The rate at which stable jobs begin and end.
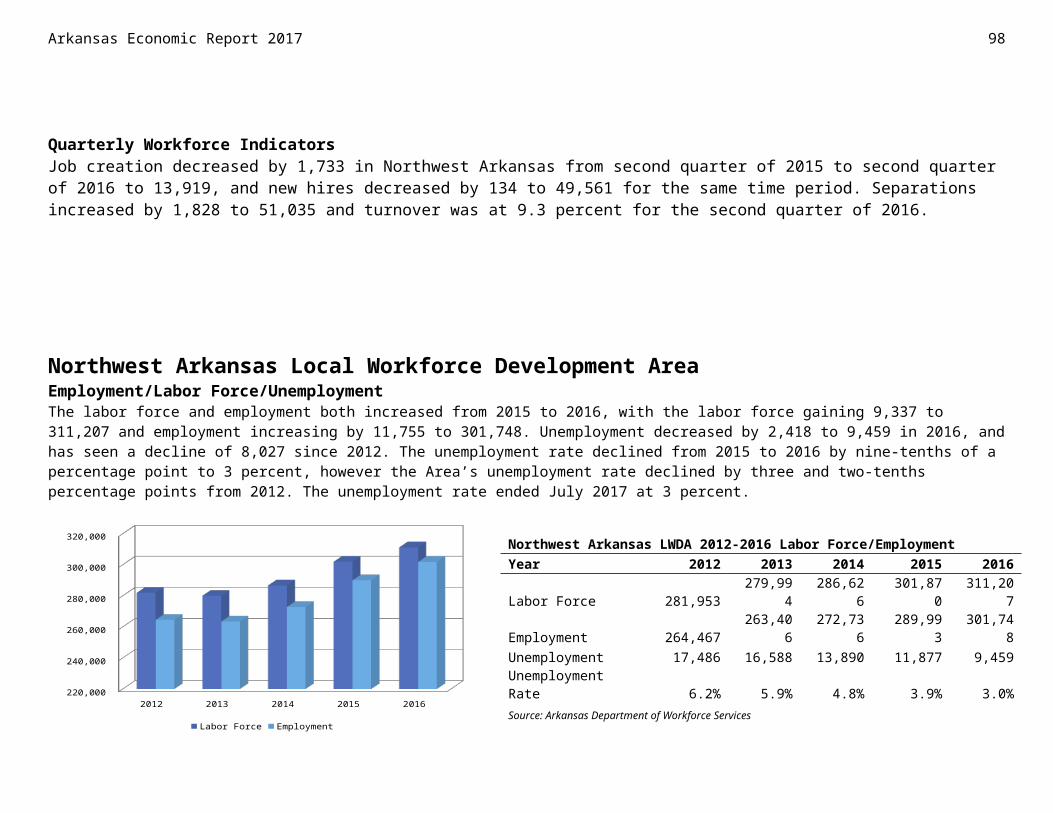
West Central Arkansas Local Workforce Development AreaEmployment/Labor Force/UnemploymentIn 2016, the labor force decreased and employment increased in the LWDA. The labor force decreased by 560 to a total of 132,284, while employment increased 744 to a total of 126,269. The labor force decreased by 4,687 from 2012 to 2016 while employment increased by 125. The unemployment and the unemployment rate both decreased from 2015 to 2016. Unemployment decreased to 6,015 and the unemployment rate decreased by one percentage point to 4.5 percent. The unemployment rate saw a decrease through 2017, but increased to 4.5 percent by July 2017.
2012 2013 2014 2015 2016 115,000
120,000
125,000
130,000
135,000
140,000
Labor Force Employment
Monthly Unemployment Rate, 2017
99Arkansas Economic Report 2017
West Central Arkansas LWDA 2012-2016 Labor Force/EmploymentYear 2012 2013 2014 2015 2016Labor Force 136,971 133,344 131,808 132,844 132,284Employment 126,144 122,867 123,237 125,525 126,269Unemployment 10,827 10,477 8,571 7,319 6,015Unemployment Rate 7.9% 7.9% 6.5% 5.5% 4.5%Source: Arkansas Department of Workforce Services
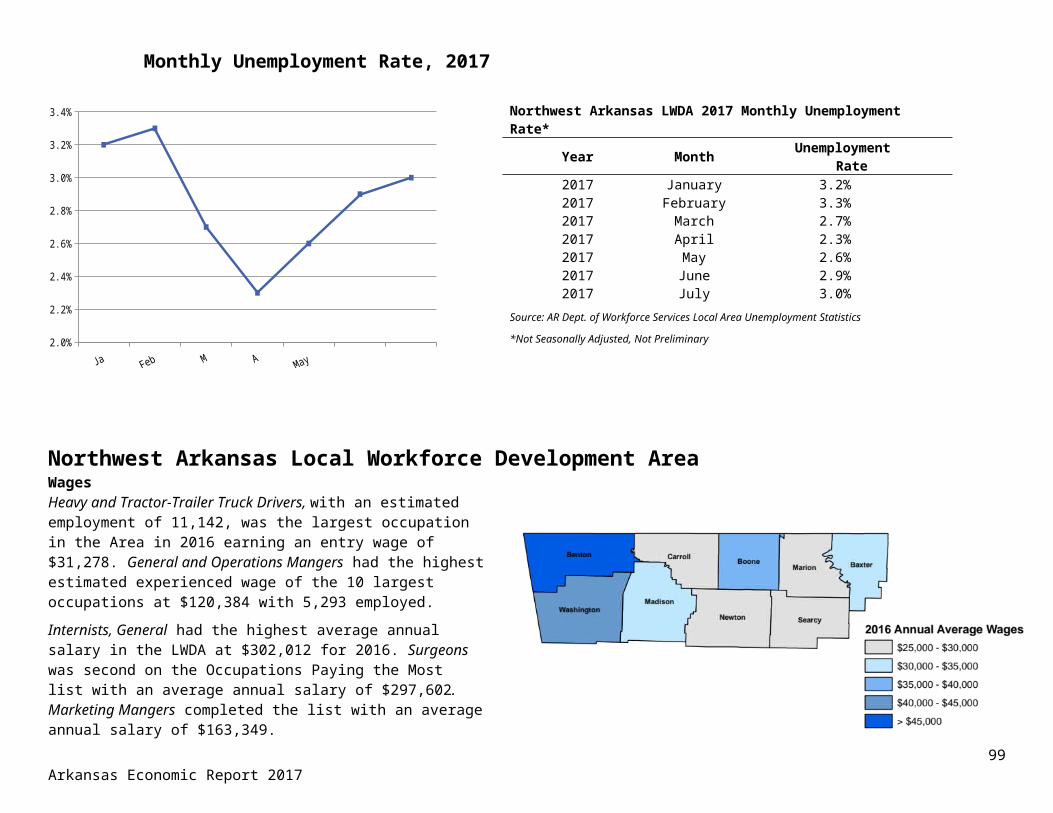
Arkansas Economic Report 2017 100
JanuaryFebruary March April May June July
3.0%
3.2%
3.4%
3.6%
3.8%
4.0%
4.2%
4.4%
4.6%
4.8%
5.0%
West Central Arkansas Local Workforce Development AreaWagesCashiers was the largest occupation in West Central Arkansas in 2016 with an estimated employment of 3,756, earning an entry wage of $18,052. Retail Salespersons was the second largest with an estimated employment of 3,752. General and Operations Managers earned the highest average wage of the 10 largest occupations with $68,207 earned annually.
Surgeons was the highest paying occupation for the Area, earning $292,851 annually. Internists, General was second on the list, earning $244,577. Judges, Magistrate Judges, and Magistrates completed the list, earning $115,852.
The 2016 experienced wage for employers of all sizes was estimated to be $43,647 for the Area. Employers with 50 to 99 employees had an estimated mean wage of $32,954. The estimated entry wage for all size categories of employers was $18,850 for 2016.
Of the 106,317 total number of employees in 2016, employees making $8.50 to $9.99 an hour was the largest group, totaling 23,448. Employees earning $12.00 to $14.99 an hour totaled 15,747. Employees making under $8.50 an hour totaled 9,628.
* Private Sector Wages OnlySource: Arkansas Department of Workforce Services, Quarterly Census of Employment and Wages
West Central Arkansas LWDA 2017 Monthly Unemployment Rate*
Year Month UnemploymentRate
2017 January 4.8%2017 February 4.8%2017 March 3.9%2017 April 3.3%2017 May 3.6%2017 June 4.2%2017 July 4.5%
Source: AR Dept. of Workforce Services Local Area Unemployment Statistics*Not Seasonally Adjusted, Not Preliminary
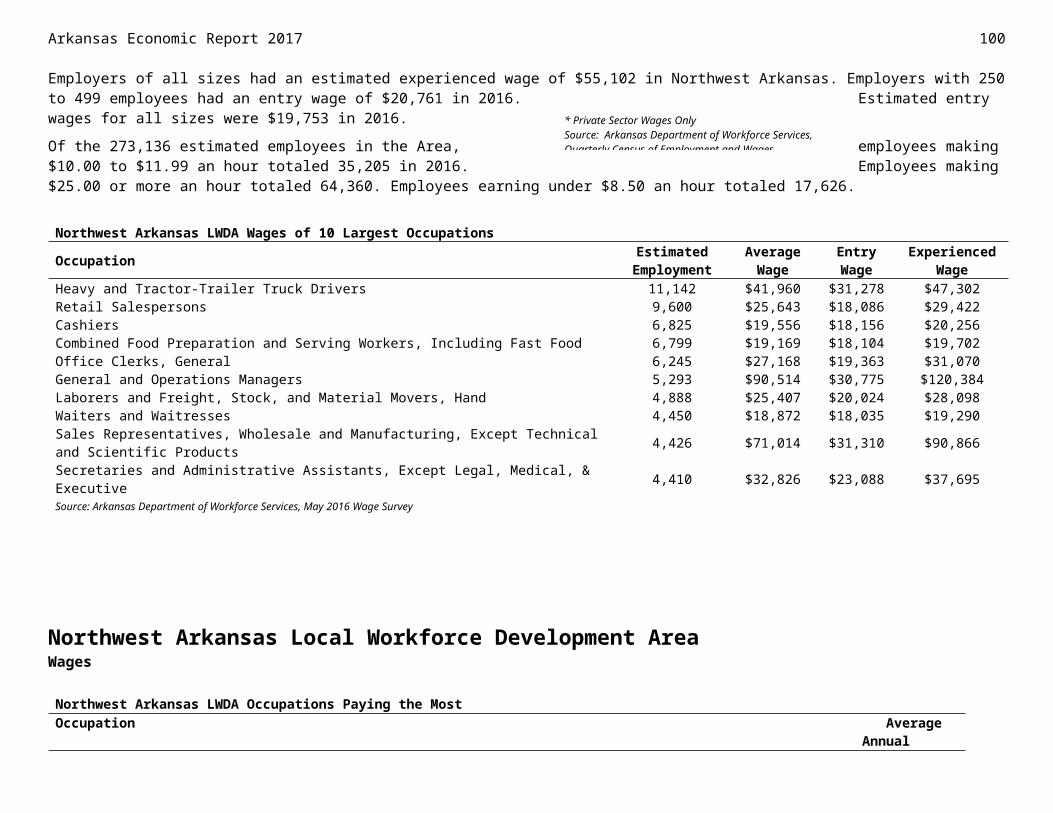
West Central Arkansas LWDA Wages of 10 Largest Occupations
Occupation Estimated Employment
Average Wage
Entry Wage
Experienced Wage
Cashiers 3,756 $19,352 $18,052 $20,002Retail Salespersons 3,752 $24,395 $18,153 $27,516Combined Food Preparation and Serving Workers, Including Fast Food 2,663 $18,370 $18,033 $18,539Office Clerks, General 2,538 $24,758 $18,295 $27,990Heavy and Tractor-Trailer Truck Drivers 2,443 $38,860 $24,288 $46,146Laborers and Freight, Stock, and Material Movers, Hand 2,257 $24,961 $19,888 $27,497Waiters and Waitresses 1,988 $18,546 $18,047 $18,796General and Operations Managers 1,899 $68,207 $23,381 $90,620Customer Service Representatives 1,870 $27,258 $19,094 $31,340Secretaries and Administrative Assistants, Except Legal, Medical, & Executive 1,863 $26,147 $18,908 $29,767Source: Arkansas Department of Workforce Services, May 2016 Wage Survey
West Central Arkansas Local Workforce Development AreaWages
West Central Arkansas LWDA Occupations Paying the Most
Occupation AverageAnnual Salary
Surgeons $292,851Internists, General $244,577Family and General Practitioners $195,252Dentists, General $144,321Architectural and Engineering Managers $122,076Sales Managers $121,661Pharmacists $120,076Software Developers, Applications $119,733Optometrists $116,203Judges, Magistrate Judges, and Magistrates $115,852Source: Arkansas Department of Workforce Services, May 2016 Wage Survey
101Arkansas Economic Report 2017

Arkansas Economic Report 2017 102
West Central Arkansas Local Workforce Development AreaWages
West Central Arkansas Wage Estimates by Employer Size
West Central Arkansas Number of Employees by Hourly Wage Rate
All Sizes0-49 Employees
50-99 Employees
100-249 Employees
250-499 Employees
500+ Employees
$0
$5,000
$10,000
$15,000
$20,000
$25,000
$30,000
$35,000
$40,000
$45,000
$50,000
$55,000Mean Experienced West Central Arkansas LWDA Wage Estimates by Employer Size
Type of Wage Mean Median Entry Experienced
All Sizes $35,381 $26,951$18,850 $43,647
0-49 Employees $33,667 $24,621$18,208 $41,396
50-99 Employees $32,954 $25,301$18,149 $40,356
100-249 Employees $36,195 $30,175$19,544 $44,520
250-499 Employees $37,725 $29,425$19,855 $46,660
500+ Employees $39,448 $31,128$20,447 $48,948
Source: Arkansas Department of Workforce Services, May 2016 Wage Survey
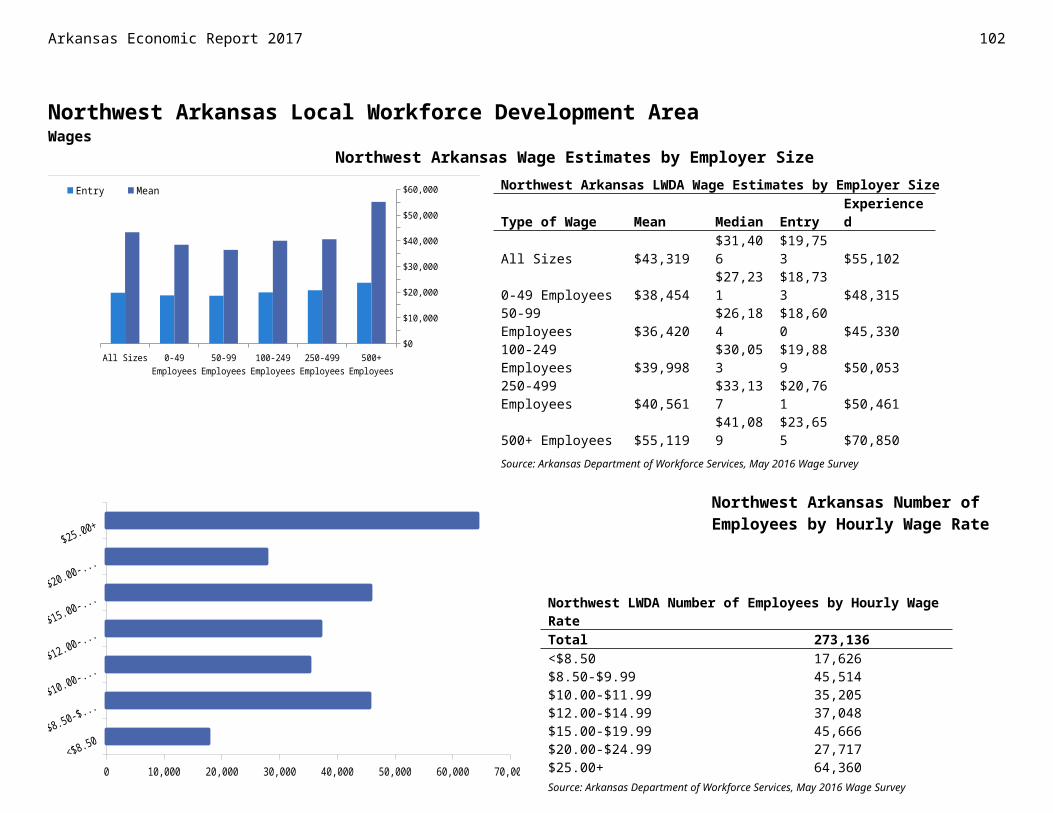
103Arkansas Economic Report 2017
Employees
<$8.50$8.50-$9.99
$10.00-$11.99$12.00-$14.99$15.00-$19.99$20.00-$24.99
$25.00+
0 5,000 10,000 15,000 20,000 25,000
West Central Arkansas LWDA Number of Employees by Hourly Wage RateTotal 106,317<$8.50 9,628$8.50-$9.99 23,448$10.00-$11.99 15,440$12.00-$14.99 15,747$15.00-$19.99 17,039$20.00-$24.99 9,910$25.00+ 16,395Source: Arkansas Department of Workforce Services, May 2016 Wage Survey
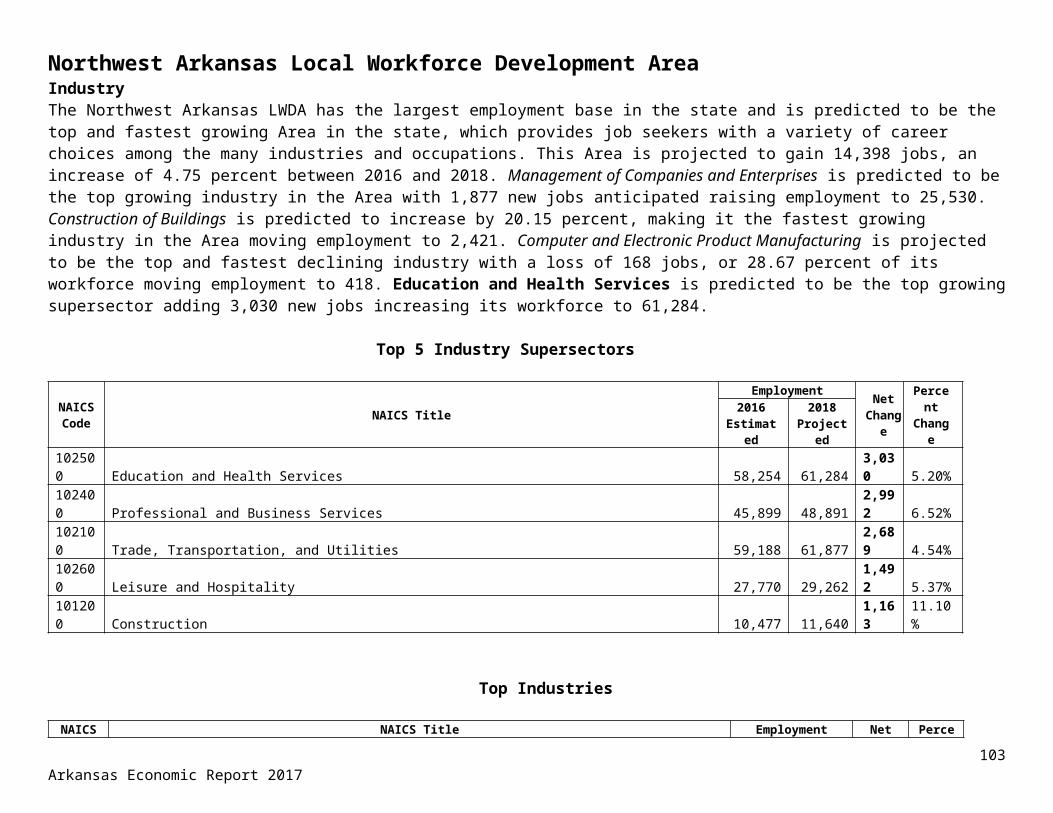
Arkansas Economic Report 2017 104
West Central Arkansas Local Workforce Development AreaIndustryThe West Central Arkansas LWDA is expected to see a growth of 3,323 jobs by the first quarter of 2018. Educational Services is estimated to be the top growing industry adding 539 new jobs between 2016 and 2018 to an employment level of 12,785. Crop Production is projected to be the fastest growing industry increasing employment by 25.35 percent moving employment from 217 in 2016 to 272 in 2018. On the negative side of the economy, Support Activities for Agriculture and Forestry is projected to experience a loss of 108 jobs making it the top declining industry, dropping employment down to 1,177. Wholesale Electronic Markets and Agents and Brokers could see a 47.65 percent decline making it the fastest declining industry in West Central Arkansas going from 149 in 2016 to 78 in 2018. Education and Health Services is predicted to be the top growing supersector adding 1,054 new jobs increasing employment to 29,265.
Top 5 Industry Supersectors
NAICS Code NAICS TitleEmployment Net
ChangePercent Change2016
Estimated2018
Projected102500 Education and Health Services 28,211 29,265 1,054 3.74%102100 Trade, Transportation, and Utilities 21,537 22,284 747 3.47%102600 Leisure and Hospitality 13,029 13,615 586 4.50%101200 Construction 4,407 4,632 225 5.11%102400 Professional and Business Services 7,564 7,734 170 2.25%
Top Industries
NAICS Code NAICS TitleEmployment Net
ChangePercent Change2016
Estimated2018
ProjectedTop 10 Growth
611000 Educational Services 12,246 12,785 539 4.40%722000 Food Services and Drinking Places 9,492 10,008 516 5.44%621000 Ambulatory Health Care Services 5,002 5,257 255 5.10%238000 Specialty Trade Contractors 2,969 3,203 234 7.88%561000 Administrative and Support Services 4,853 5,037 184 3.79%624000 Social Assistance 3,913 4,084 171 4.37%484000 Truck Transportation 2,103 2,271 168 7.99%623000 Nursing and Residential Care Facilities 3,449 3,606 157 4.55%493000 Warehousing and Storage 1,265 1,395 130 10.28%452000 General Merchandise Stores 4,023 4,150 127 3.16%
West Central Arkansas Local Workforce Development Area
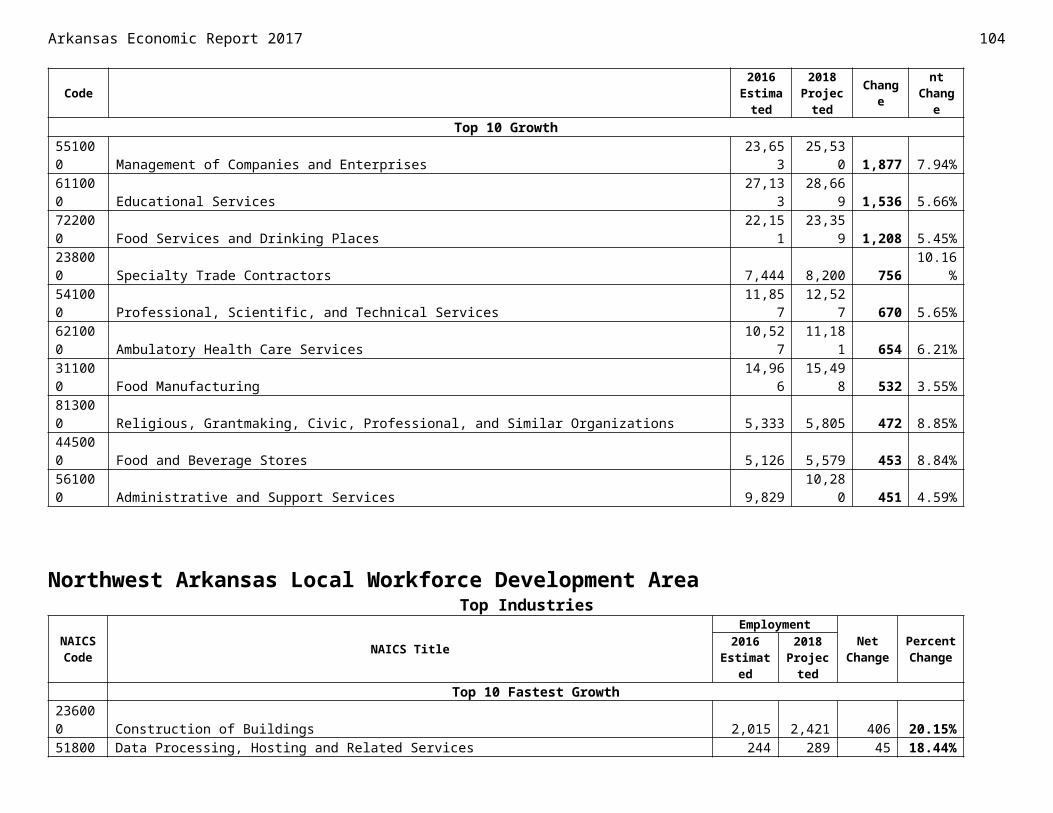
Top Industries
NAICS Code NAICS TitleEmployment Net
ChangePercent Change2016
Estimated2018
ProjectedTop 10 Fastest Growth
111000 Crop Production 217 272 55 25.35%811000 Repair and Maintenance 922 1,035 113 12.26%325000 Chemical Manufacturing 38 42 4 10.53%493000 Warehousing and Storage 1,265 1,395 130 10.28%112000 Animal Production 858 930 72 8.39%484000 Truck Transportation 2,103 2,271 168 7.99%238000 Specialty Trade Contractors 2,969 3,203 234 7.88%324000 Petroleum and Coal Products Manufacturing 92 99 7 7.61%453000 Miscellaneous Store Retailers 705 758 53 7.52%512000 Motion Picture and Sound Recording Industries 93 99 6 6.45%
Top 10 Decline115000 Support Activities for Agriculture and Forestry 1,285 1,177 -108 -8.40%311000 Food Manufacturing 5,742 5,637 -105 -1.83%335000 Electrical Equipment, Appliance, and Component Manufacturing 381 307 -74 -19.42%425000 Wholesale Electronic Markets and Agents and Brokers 149 78 -71 -47.65%622000 Hospitals 3,601 3,533 -68 -1.89%213000 Support Activities for Mining 285 227 -58 -20.35%323000 Printing and Related Support Activities 148 105 -43 -29.05%721000 Accommodation, including Hotels and Motels 1,421 1,388 -33 -2.32%814000 Private Households 213 181 -32 -15.02%332000 Fabricated Metal Product Manufacturing 892 862 -30 -3.36%
Top 10 Fastest Decline425000 Wholesale Electronic Markets and Agents and Brokers 149 78 -71 -47.65%323000 Printing and Related Support Activities 148 105 -43 -29.05%213000 Support Activities for Mining 285 227 -58 -20.35%335000 Electrical Equipment, Appliance, and Component Manufacturing 381 307 -74 -19.42%486000 Pipeline Transportation 42 35 -7 -16.67%814000 Private Households 213 181 -32 -15.02%337000 Furniture and Related Product Manufacturing 118 104 -14 -11.86%515000 Broadcasting (except Internet) 64 58 -6 -9.38%485000 Transit and Ground Passenger Transportation 104 95 -9 -8.65%511000 Publishing Industries (except Internet) 222 203 -19 -8.56%
Source: Arkansas Department of Workforce Services, Projections Suite Software
West Central Arkansas Local Workforce Development AreaOccupations
105Arkansas Economic Report 2017
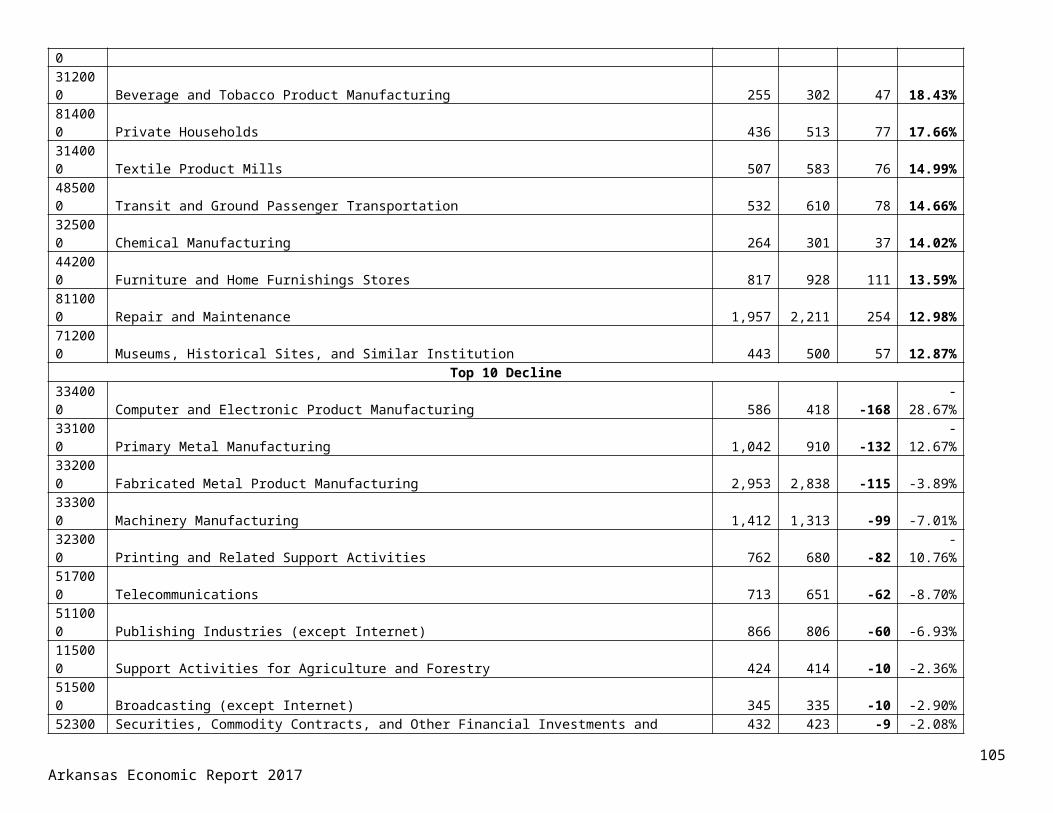
Arkansas Economic Report 2017 106
The Area’s employment is expected to increase by 2.65 percent during the projection period. An estimated 4,823 annual job openings are anticipated in this Area. Growth and expansion is estimated to account for 1,838 of those jobs, while 2,985 would be for replacement. Farmers, Ranchers, and Other Agricultural Managers is estimated to be the top growing occupation with a gain of 188 to an employment level of 7,986. Automotive Body and Related Repairers is expected to increase employment by 12.15 percent making it the fastest growing occupation adding 13 employees to its workforce of 107. Packers and Packagers, Hand is forecast to be the top declining occupation losing 24 jobs and moving employment down to 441. Continuous Mining Machine Operators could see a 29.41 percent reduction in employment dropping its workforce to just 36. Food Preparation and Serving Related Occupations is projected to be the top growing major occupational group with an increase of 527.
Top 5 Major Occupational Groups
SOC Code SOC Title
Employment Growth Annual Openings2016
Estimated2018
Projected Net Percent Growth Replacement Tota
l
35-0000 Food Preparation and Serving Related Occupations 10,759 11,28652
7 4.90% 264 416 680
41-0000 Sales and Related Occupations 12,005 12,37236
7 3.06% 190 422 612
25-0000 Education, Training, and Library Occupations 7,243 7,57733
4 4.61% 167 150 317
43-0000 Office and Administrative Support Occupations 17,193 17,52733
4 1.94% 186 360 546
11-0000 Management Occupations 13,244 13,55030
6 2.31% 158 249 407
Top Occupations
SOC Code SOC Title
Employment Growth Annual Openings2016
Estimated2018
Projected
Net Percent
Growth Replacement Total
Top 10 Growth
11-9013 Farmers, Ranchers, and Other Agricultural Managers 7,798 7,98618
8 2.41% 94 129 223
53-3032 Heavy and Tractor-Trailer Truck Drivers 2,656 2,83217
6 6.63% 88 42 130
41-2031 Retail Salespersons 3,984 4,13515
1 3.79% 76 149 225
35-3021 Combined Food Preparation and Serving Workers, Including Fast Food 2,308 2,44613
8 5.98% 69 90 159
41-2011 Cashiers 3,332 3,44911
7 3.51% 58 169 22743-4051 Customer Service Representatives 2,713 2,803 90 3.32% 45 63 10835-3031 Waiters and Waitresses 1,903 1,990 87 4.57% 44 100 14435-2014 Cooks, Restaurant 1,142 1,224 82 7.18% 41 31 72
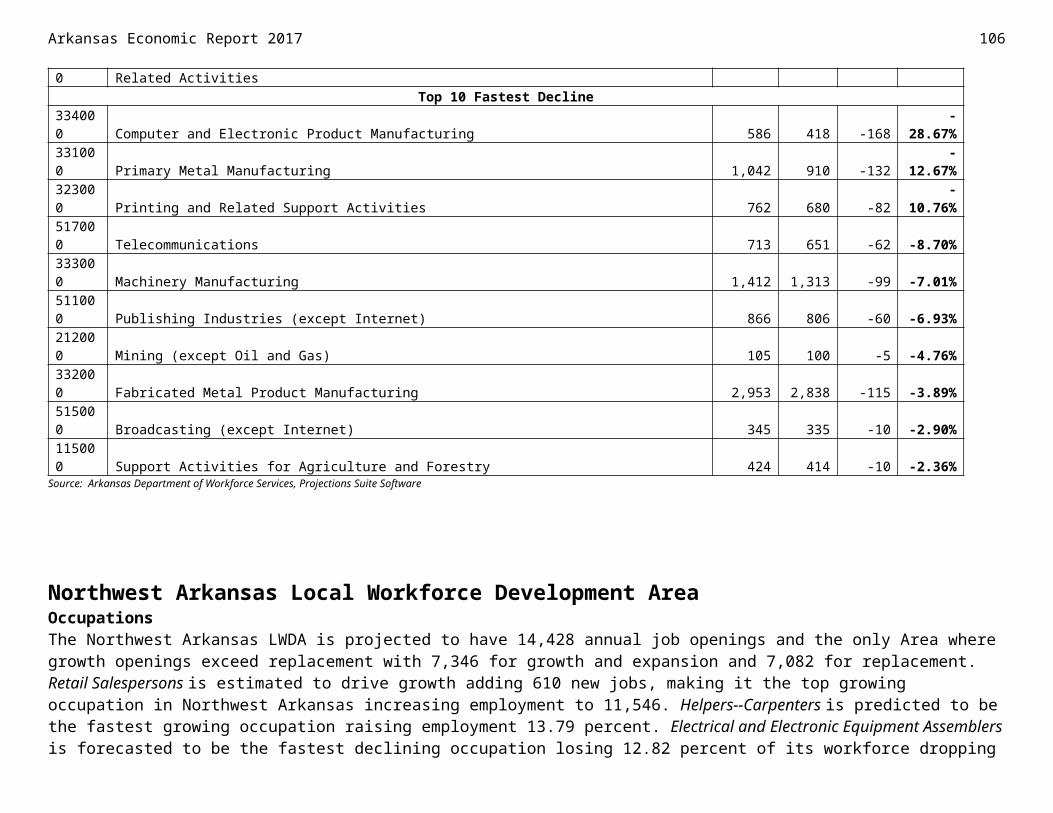
31-1014 Nursing Assistants 1,931 2,005 74 3.83% 37 41 7835-2021 Food Preparation Workers 1,292 1,363 71 5.50% 36 40 76
West Central Arkansas Local Workforce Development AreaTop Occupations
SOC Code SOC Title
Employment Growth Annual Openings2016
Estimated2018
Projected Net Percent Growth Replacement Total
Top 10 Fastest Growth49-3021 Automotive Body and Related Repairers 107 120 13 12.15% 6 2 851-9122 Painters, Transportation Equipment 92 100 8 8.70% 4 2 647-2021 Brickmasons and Blockmasons 146 158 12 8.22% 6 2 849-9098 Helpers--Installation, Maintenance, and Repair Workers 113 122 9 7.96% 4 4 825-1072 Nursing Instructors and Teachers, Postsecondary 76 82 6 7.89% 3 1 449-3041 Farm Equipment Mechanics and Service Technicians 67 72 5 7.46% 2 2 435-2014 Cooks, Restaurant 1,142 1,224 82 7.18% 41 31 7229-1171 Nurse Practitioners 114 122 8 7.02% 4 2 653-7063 Machine Feeders and Offbearers 206 220 14 6.80% 7 4 1153-3032 Heavy and Tractor-Trailer Truck Drivers 2,656 2,832 176 6.63% 88 42 130
Top 10 Decline53-7064 Packers and Packagers, Hand 465 441 -24 -5.16% 0 12 1243-4151 Order Clerks 124 108 -16 -12.90% 0 4 447-5041 Continuous Mining Machine Operators 51 36 -15 -29.41% 0 1 151-3022 Meat, Poultry, and Fish Cutters and Trimmers 1,028 1,013 -15 -1.46% 0 18 1851-6031 Sewing Machine Operators 187 174 -13 -6.95% 0 2 247-5013 Service Unit Operators, Oil, Gas, and Mining 51 42 -9 -17.65% 0 2 253-7032 Excavating and Loading Machine and Dragline Operators 75 67 -8 -10.67% 0 1 147-2073 Operating Engineers and Other Construction Equipment Operators 451 445 -6 -1.33% 0 8 851-4011 Computer-Controlled Machine Tool Operators, Metal and Plastic 140 135 -5 -3.57% 0 4 411-2022 Sales Managers 172 167 -5 -2.91% 0 4 4
Top 10 Fastest Decline47-5041 Continuous Mining Machine Operators 51 36 -15 -29.41% 0 1 147-5013 Service Unit Operators, Oil, Gas, and Mining 51 42 -9 -17.65% 0 2 243-4151 Order Clerks 124 108 -16 -12.90% 0 4 453-7032 Excavating and Loading Machine and Dragline Operators 75 67 -8 -10.67% 0 1 151-6031 Sewing Machine Operators 187 174 -13 -6.95% 0 2 253-7064 Packers and Packagers, Hand 465 441 -24 -5.16% 0 12 1227-1024 Graphic Designers 110 106 -4 -3.64% 0 2 251-4011 Computer-Controlled Machine Tool Operators, Metal and Plastic 140 135 -5 -3.57% 0 4 411-2022 Sales Managers 172 167 -5 -2.91% 0 4 451-2041 Structural Metal Fabricators and Fitters 183 179 -4 -2.19% 0 3 3Source: Arkansas Department of Workforce Services, Projections Suite Software
107Arkansas Economic Report 2017
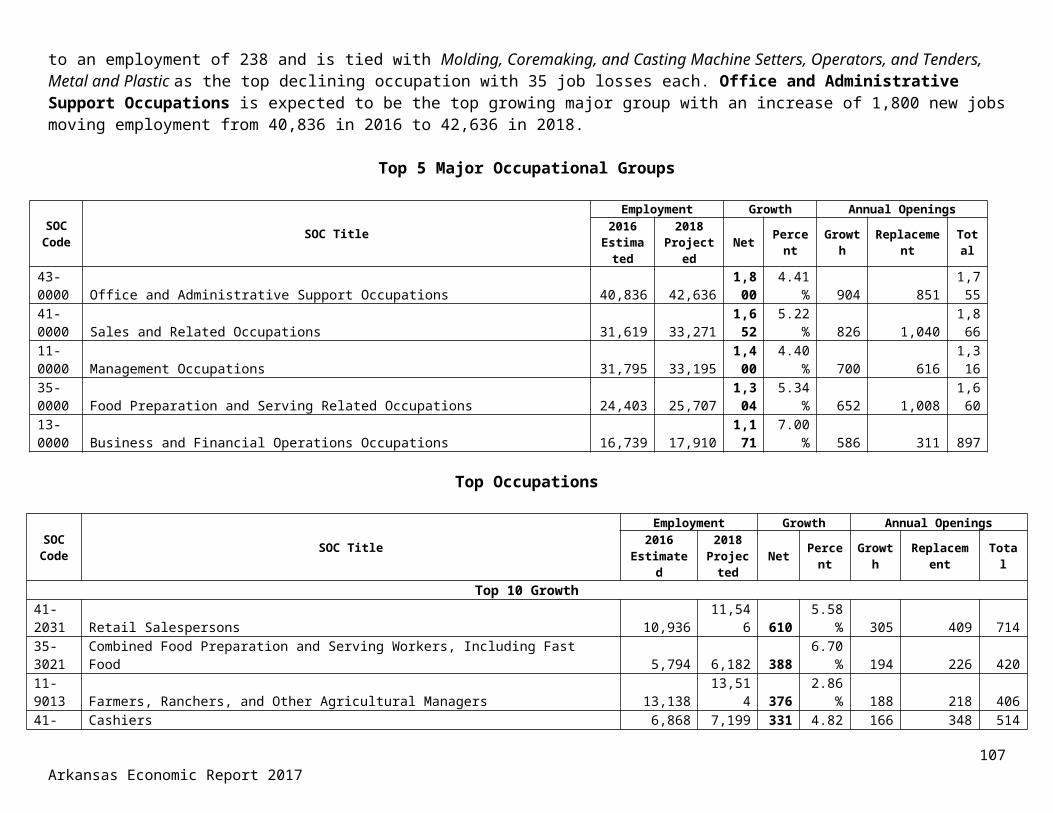
Arkansas Economic Report 2017 108
Western Arkansas Local Workforce Development AreaPopulationThe Western Arkansas Local Workforce Development Area saw an increase in population between 2015 and 2016, increasing by 204 to 259,928. The Western Arkansas LWDA consists of six counties: Crawford, Franklin, Logan, Polk, Scott, and Sebastian; and is bordered to the west by the state of Oklahoma. The Arkansas portion of the Fort Smith Metropolitan Statistical Area is located in the Western Arkansas LWDA.
2012 2013 2014 2015 2016258,500
259,000
259,500
260,000
260,500
261,000
Quarterly Workforce IndicatorsJob creation decreased by 31 in the second quarter of 2016 compared to the same quarter in 2015 declining to 4,586. The number of new hires and separations increased during the same time period with new hires totaling 19,149 and separations totaling 20,611 in the second quarter of 2016, and saw increases over the 2012-2016 period gaining 799 and 716 respectively. The turnover rate was 9.4 percent.
Western Arkansas LWDA Population 2012-20162012 2013 2014 2015 2016
260,759 260,103 259,304 259,724 259,928Source: US Census Bureau
Western Arkansas LWDA Quarterly Workforce Indicators(All Ownerships)QWI Explorer 2012 Q2 2013 Q2 2014 Q2 2015 Q2 2016 Q2Job Creation 4,872 4,580 4,807 4,617 4,586New Hires 18,350 17,139 18,164 18,510 19,149Separations 19,900 19,218 19,475 19,895 20,611Turnover 8.8% 8.4% 8.6% 8.5% 9.4%Source: U.S. Census Bureau, Center for Economic Studies, LEHDJob Creation: Estimated number of jobs gained at firms throughout the quarter.New Hires: Estimated number of workers who started a new job.Separations: Estimated number of workers whose job with a given employer ended in the specified quarter.Turnovers: The rate at which stable jobs begin and end.
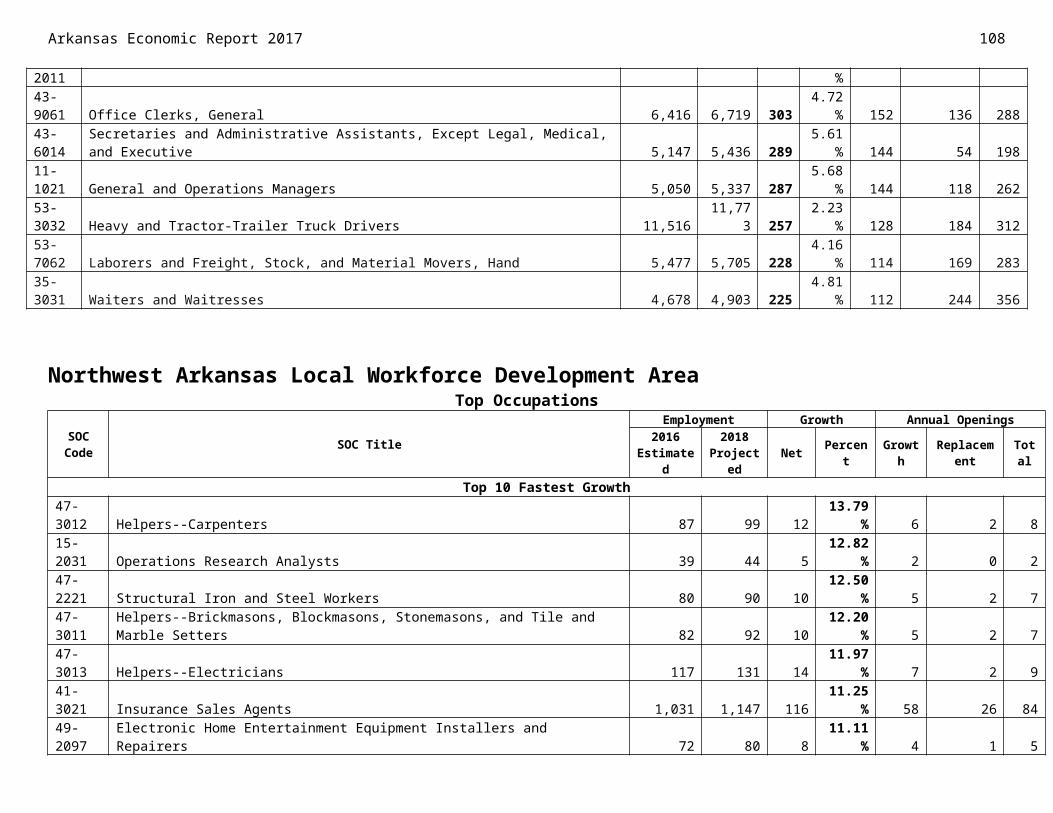
Western Arkansas Local Workforce Development AreaEmployment/Labor Force/UnemploymentThe labor force increased slightly by 42 to 114,007 and employment increased by 1,303 to 109,491 in from 2015 to 2016. Over the 2012-2016 period, the labor force decreased by 3,272 while employment increased by 1,315. Unemployment and the unemployment rate both decreased significantly from 2012 to 2016. Unemployment decreased by 4,587 to 4,516 employed, while the unemployment rate decreased by three and eight-tenths percentage points to 4 percent. The Area’s unemployment rate continued to decline through July 2017, ending at 3.8 percent.
2012 2013 2014 2015 2016 98,000
100,000
102,000
104,000
106,000
108,000
110,000
112,000
114,000
116,000
118,000
Labor Force Employment
Monthly Unemployment Rate, 2017
109Arkansas Economic Report 2017
Western Arkansas LWDA 2012-2016 Labor Force/EmploymentYear 2012 2013 2014 2015 2016Labor Force 117,279 113,694 112,186 113,965 114,007Employment 108,176 105,154 105,628 108,188 109,491Unemployment 9,103 8,540 6,558 5,777 4,516Unemployment Rate 7.8% 7.5% 5.8% 5.1% 4.0%Source: Arkansas Department of Workforce Services
Western Arkansas LWDA 2017 Monthly Unemployment Rate*
Year Month Unemployment Rate
2017 January 3.9%2017 February 4.2%2017 March 3.5%2017 April 3.1%2017 May 3.4%2017 June 3.6%2017 July 3.8%
Source: AR Dept. of Workforce Services Local Area Unemployment Statistics*Not Seasonally Adjusted, Not Preliminary
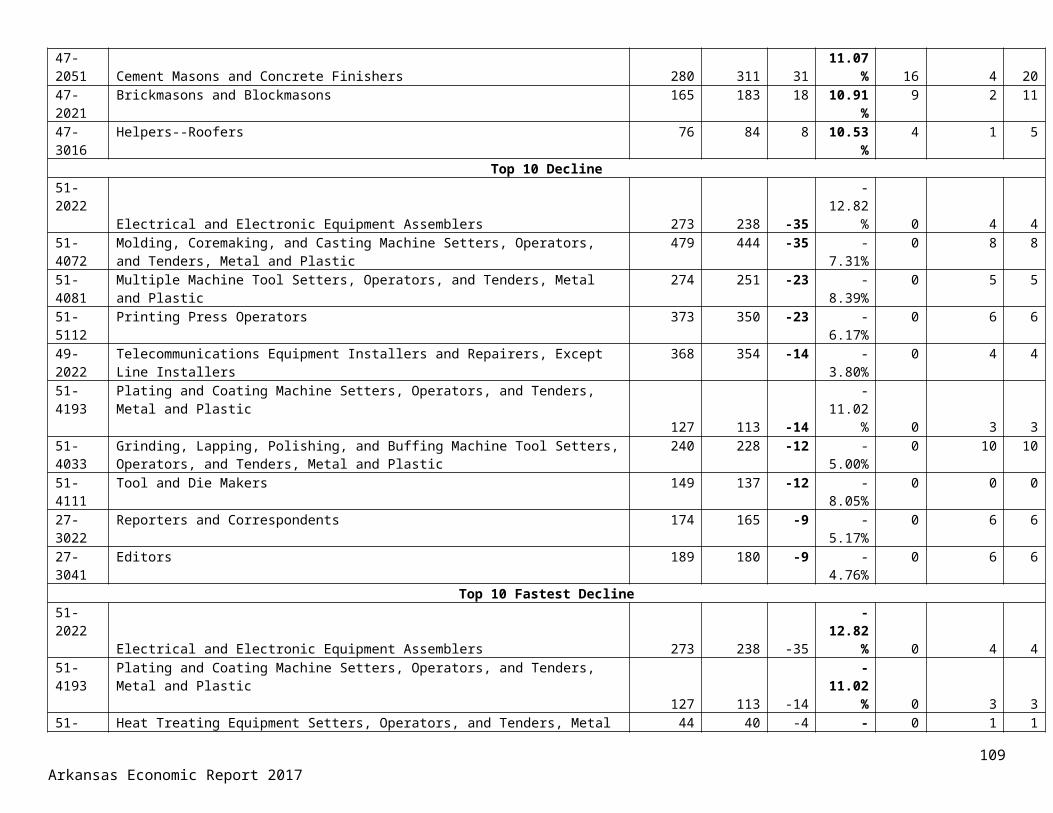
Arkansas Economic Report 2017 110
Western Arkansas Local Workforce Development AreaWagesHeavy and Tractor-Trailer Truck Drivers was the largest occupation in the Area in 2016 with an estimated employment of 4,231, with an experienced wage of $40,479 annually. Registered Nurses, with an estimated employment of 2,202 had the highest entry wage of the 10 largest occupations, earning $42,250 annually.
Surgeons was the highest paid occupation, averaging $283,289 annually. Family and General Practitioners was second, with an average annual wage of $262,641. Marketing Mangers finished the Occupations Paying the Most List at $104,839 annually.
The Area’s mean wage estimate for employers of all sizes was $35,758 in 2016. Employers with 100 to 249 employees had an estimated entry wage of $20,048. Estimated entry wages for all categories of employers in the Area was $19,333 while experienced wages were at $43,970.
Of the 106,307 total number of employees, employees earning $15.00 to $19.99 an hour totaled 17,700. Employees earning $8.50 to $9.99 an hour totaled 20,898 for 2016, the largest group for the Area.
Western Arkansas LWDA Wages of 10 Largest Occupations
Occupation Estimated Employment
Average Wage
Entry Wage
Experienced Wage
Heavy and Tractor-Trailer Truck Drivers 4,231 $36,308 $27,967 $40,479
JanuaryFebruary March April May June July
3.0%
3.2%
3.4%
3.6%
3.8%
4.0%
4.2%
4.4%
* Private Sector Wages OnlySource: Arkansas Department of Workforce Services, Quarterly Census of Employment and Wages
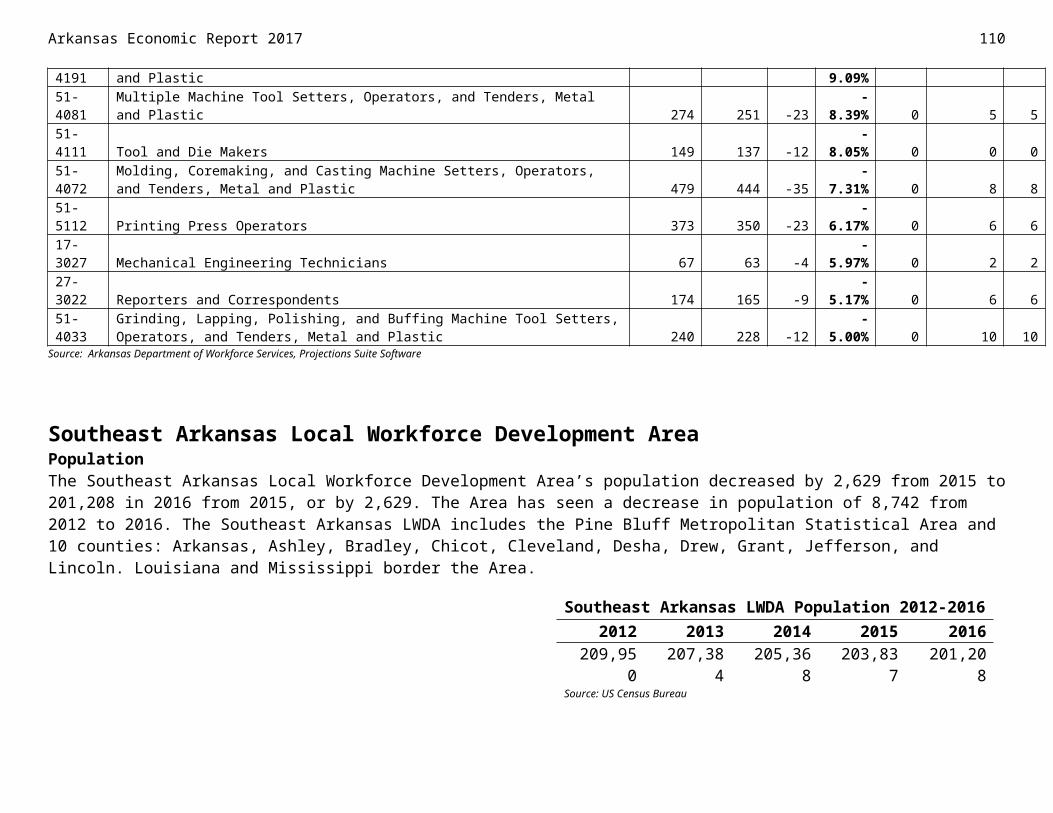
Retail Salespersons 3,340 $23,964 $18,165 $26,863Cashiers 3,325 $19,461 $18,176 $20,104Laborers and Freight, Stock, and Material Movers, Hand 2,980 $24,771 $20,102 $27,105Combined Food Preparation and Serving Workers, Including Fast Food 2,915 $18,392 $18,109 $18,533Office Clerks, General 2,754 $25,654 $18,451 $29,256Helpers-Production Workers 2,705 $21,091 $18,193 $22,540Registered Nurses 2,202 $52,788 $42,250 $58,058Nursing Assistants 1,824 $22,211 $19,183 $23,726Stock Clerks and Order Fillers 1,669 $23,889 $18,221 $26,724Source: Arkansas Department of Workforce Services, May 2016 Wage Survey
Western Arkansas Local Workforce Development AreaWages
Western Arkansas LWDA Occupations Paying the Most
Occupation Average Annual Salary
Surgeons $283,289Family and General Practitioners $262,641Purchasing Managers $158,423Dentists, General $152,215Pharmacists $121,311Judges, Magistrate Judges, and Magistrates $114,055Chief Executives $109,428Optometrists $106,245Architectural and Engineering Managers $104,922Marketing Managers $104,839Source: Arkansas Department of Workforce Services, May 2016 Wage Survey
111Arkansas Economic Report 2017
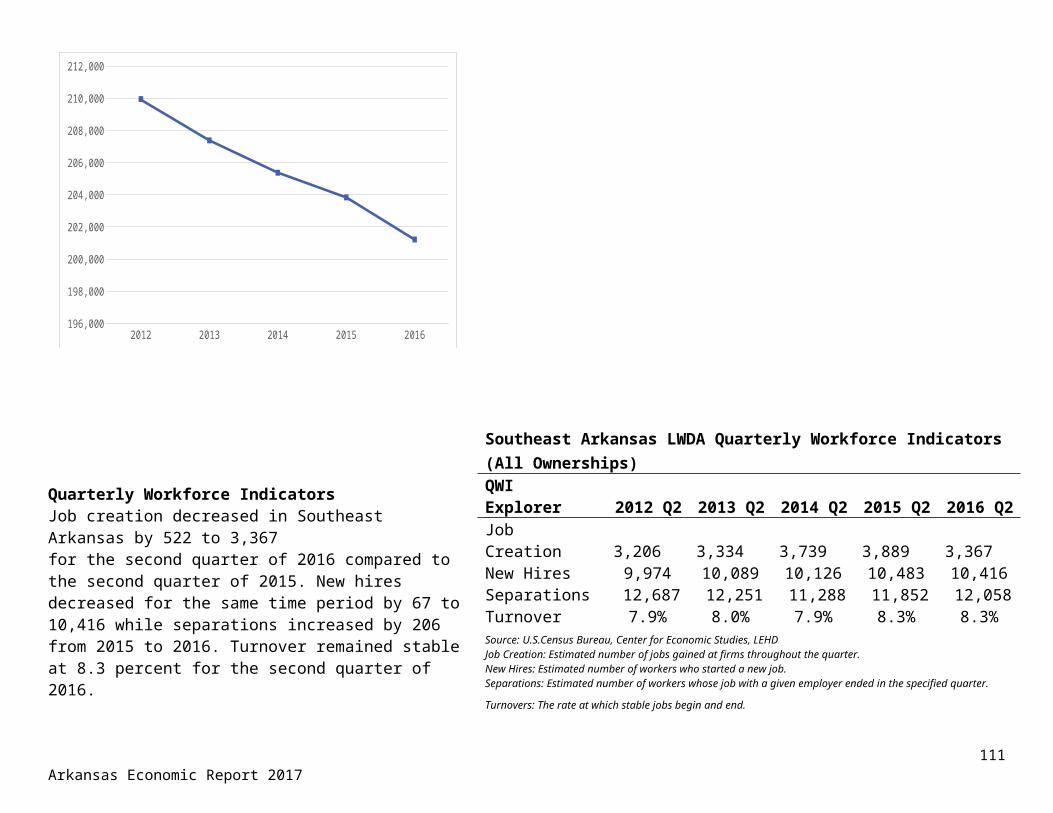
Arkansas Economic Report 2017 112
Western Arkansas Local Workforce Development AreaWages
Western Arkansas Wage Estimates by Employer Size
All Sizes
0-49 Employees
50-99 Employees
100-249 Employees
250-499 Employees
500+ Employees$0
$5,000
$10,000$15,000
$20,000$25,000
$30,000$35,000
$40,000
$45,000Entry Mean Western Arkansas LWDA Wage Estimates by Employer SizeType of Wage Mean Median Entry ExperiencedAll Sizes $35,758 $28,039 $19,333 $43,9700-49 Employees $34,340 $25,724 $18,431 $42,29450-99 Employees $34,277 $25,350 $18,252 $42,290100-249 Employees $38,017 $30,402 $20,048 $47,001250-499 Employees $34,861 $28,545 $19,948 $42,317500+ Employees $38,174 $31,937 $20,741 $46,890Source: Arkansas Department of Workforce Services, May 2016 Wage Survey
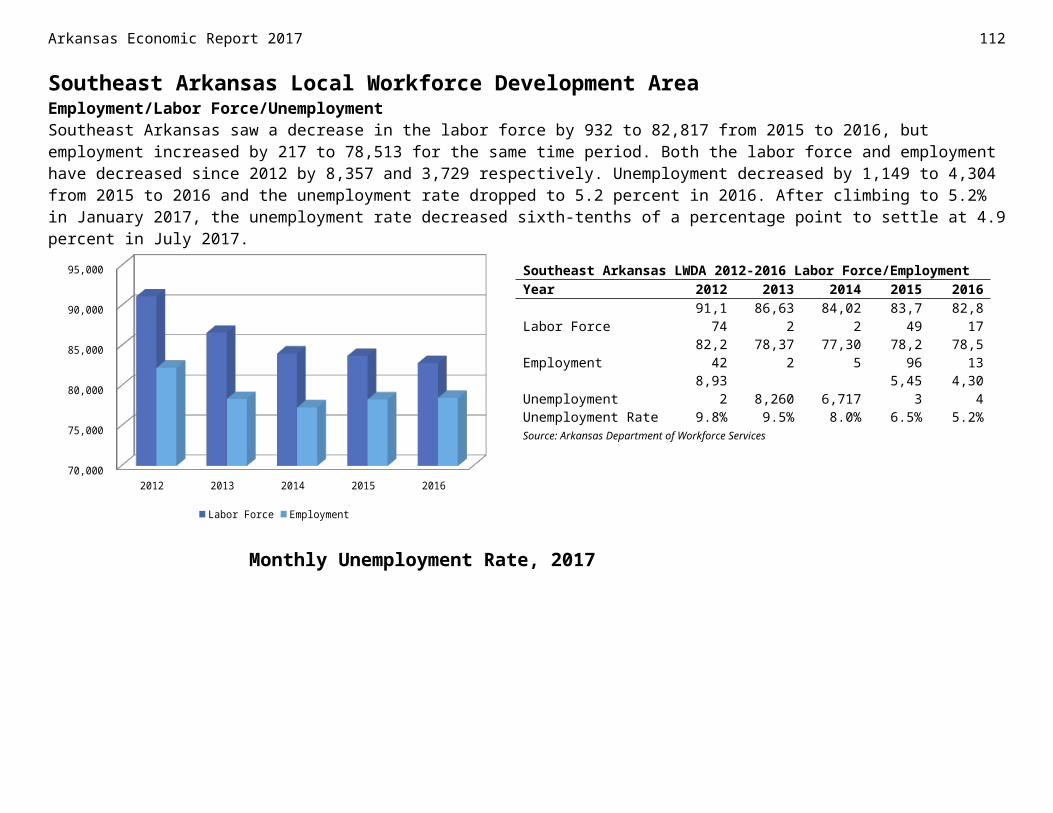
Western Arkansas Number of Employees by Hourly Wage Rate
Western Arkansas Local Workforce Development AreaIndustryThe Western Arkansas LWDA is expected to experience a net gain of 3,201 jobs during the projection period. Educational Services is predicted to be the top growing industry gaining 456 jobs between 2016 and 2018 moving from 8,339 employees in 2016 to 8,795 in 2018. At 29.37 percent, Plastics and Rubber Products Manufacturing is projected to be the fastest growing industry in Western Arkansas adding 89 new jobs to its workforce bringing its employment to 392. Support Activities for Mining is predicted to lose 37.70 percent of its workforce, or 207 jobs, making it the top and fastest declining industry in the Area, moving employment down to 342. Education and Health Services is predicted to be the top growing supersector increasing employment by 979 jobs to employment of 24,307.
Top 5 Industry Supersectors
NAICS Code NAICS TitleEmployment Net
ChangePercentChange2016
Estimated2018
Projected102500 Education and Health Services 23,328 24,307 979 4.20%102100 Trade, Transportation, and Utilities 22,702 23,446 744 3.28%102400 Professional and Business Services 10,585 11,061 476 4.50%102600 Leisure and Hospitality 8,898 9,319 421 4.73%101200 Construction 3,835 4,016 181 4.72%
113Arkansas Economic Report 2017
<$8.50$8.50-$9.99
$10.00-$11.99$12.00-$14.99$15.00-$19.99$20.00-$24.99
$25.00+
0 5,000 10,000 15,000 20,000 25,000
Employees
Western Arkansas LWDA Number of Employees by Hourly Wage RateTotal 106,307<$8.50 7,995$8.50-$9.99 20,898$10.00-$11.99 15,884$12.00-$14.99 16,433$15.00-$19.99 17,700$20.00-$24.99 11,930$25.00+ 15,477Source: Arkansas Department of Workforce Services, May 2016 Wage Survey
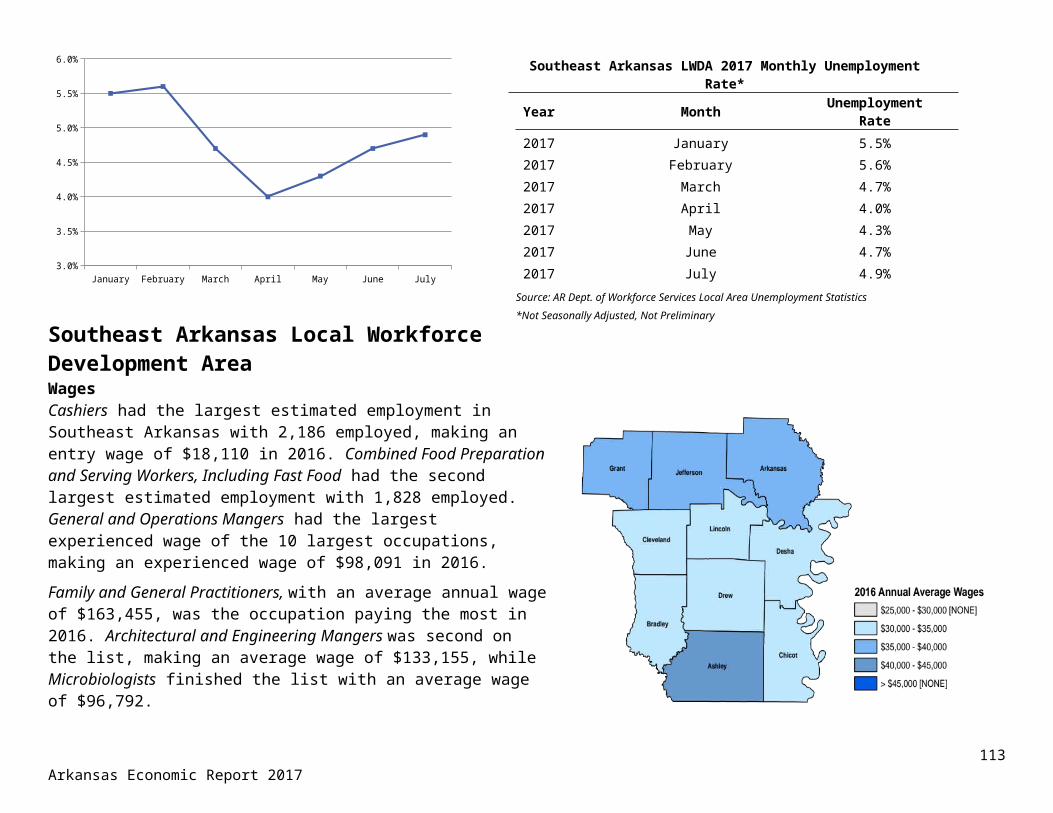
Arkansas Economic Report 2017 114
Top Industries
NAICS Code NAICS TitleEmployment Net
ChangePercent Change2016
Estimated2018
ProjectedTop 10 Growth
611000 Educational Services 8,339 8,795 456 5.47%561000 Administrative and Support Services 5,866 6,276 410 6.99%722000 Food Services and Drinking Places 7,848 8,245 397 5.06%311000 Food Manufacturing 9,023 9,379 356 3.95%621000 Ambulatory Health Care Services 5,122 5,396 274 5.35%484000 Truck Transportation 4,291 4,455 164 3.82%238000 Specialty Trade Contractors 2,461 2,615 154 6.26%622000 Hospitals 4,228 4,354 126 2.98%452000 General Merchandise Stores 3,917 4,037 120 3.06%322000 Paper Manufacturing 1,161 1,277 116 9.99%
Western Arkansas Local Workforce Development AreaTop Industries
NAICS Code NAICS TitleEmployment
Net Change
Percent Change
2016 Estimate
d2018
Projected
Top 10 Fastest Growth326000 Plastics and Rubber Products Manufacturing 303 392 89 29.37%325000 Chemical Manufacturing 124 139 15 12.10%322000 Paper Manufacturing 1,161 1,277 116 9.99%524000 Insurance Carriers and Related Activities 583 636 53 9.09%112000 Animal Production 489 527 38 7.77%561000 Administrative and Support Services 5,866 6,276 410 6.99%517000 Telecommunications 260 277 17 6.54%238000 Specialty Trade Contractors 2,461 2,615 154 6.26%492000 Couriers and Messengers 253 268 15 5.93%611000 Educational Services 8,339 8,795 456 5.47%
Top 10 Decline213000 Support Activities for Mining 549 342 -207 -37.70%332000 Fabricated Metal Product Manufacturing 1,361 1,254 -107 -7.86%337000 Furniture and Related Product Manufacturing 839 744 -95 -11.32%333000 Machinery Manufacturing 1,251 1,165 -86 -6.87%339000 Miscellaneous Manufacturing 176 122 -54 -30.68%
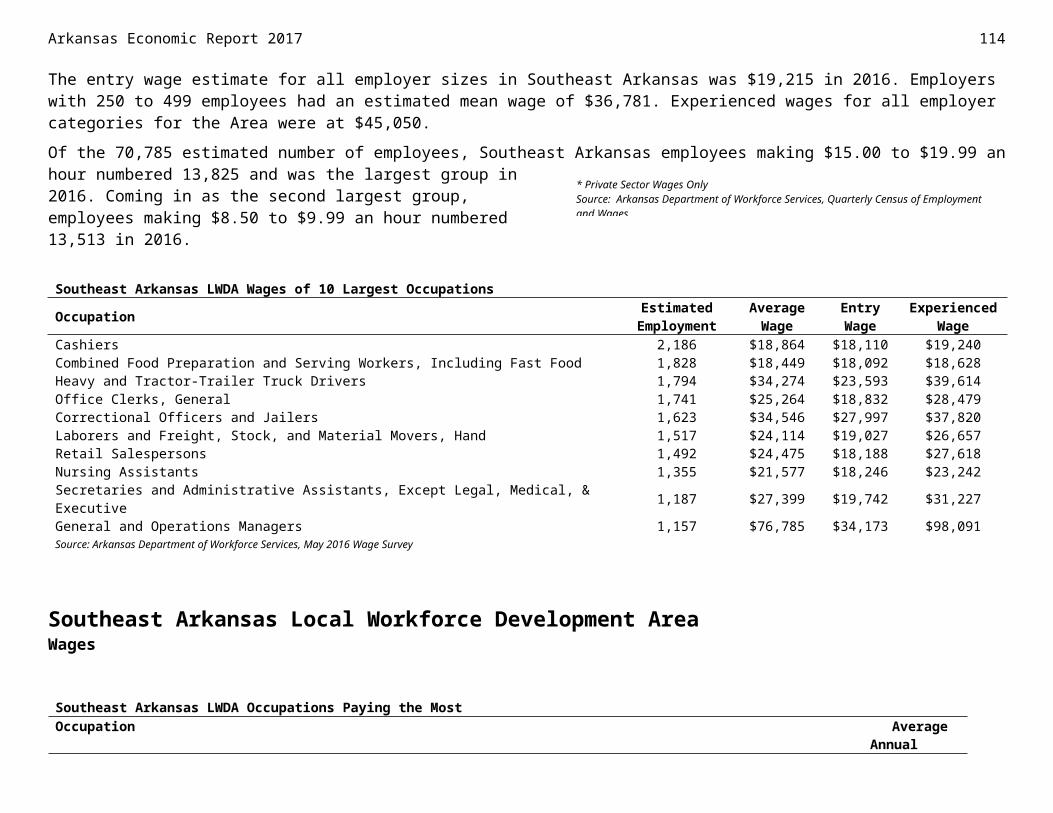
522000 Credit Intermediation and Related Activities 1,627 1,574 -53 -3.26%335000 Electrical Equipment, Appliance, and Component Manufacturing 2,471 2,423 -48 -1.94%532000 Rental and Leasing Services 460 416 -44 -9.57%999100 Federal Government, Excluding Post Office 1,040 1,005 -35 -3.37%323000 Printing and Related Support Activities 515 482 -33 -6.41%
Top 10 Fastest Decline213000 Support Activities for Mining 549 342 -207 -37.70%339000 Miscellaneous Manufacturing 176 122 -54 -30.68%334000 Computer and Electronic Product Manufacturing 73 61 -12 -16.44%337000 Furniture and Related Product Manufacturing 839 744 -95 -11.32%211000 Oil and Gas Extraction 209 187 -22 -10.53%532000 Rental and Leasing Services 460 416 -44 -9.57%315000 Apparel Manufacturing 90 82 -8 -8.89%511000 Publishing Industries (except Internet) 170 155 -15 -8.82%312000 Beverage and Tobacco Product Manufacturing 325 298 -27 -8.31%332000 Fabricated Metal Product Manufacturing 1,361 1,254 -107 -7.86%Source: Arkansas Department of Workforce Services, Projections Suite Software
Western Arkansas Local Workforce Development AreaOccupationsWestern Arkansas LWDA is projected to have a net job gain of 2.69 percent between 2016 and 2018. Around 4,625 annual job openings are expected to be available during the projection period with 2,783 for replacement and 1,842 for growth and expansion. Combined Food Preparation and Serving Workers is estimated to be the top growing occupation with an increase of 176 jobs, going from 2,902 in 2016 to 3,078 in 2018. Paper Goods Machine Setters, Operators, and Tenders is predicted to be the fastest growing occupation with an increase of 10.42 percent raising employment to 106. Service Unit Operators, Oil, Gas, and Mining is anticipated to be the top and fastest declining occupation losing 38 jobs, or 35.85 percent of its workforce, and moving employment below 100 jobs. Transportation and Material Moving Occupations leads the Area as the top growing occupational major group with an estimated 463 new jobs, increasing employment to 12,016.
Top 5 Major Occupational Groups
SOC Code SOC Title
Employment Growth Annual Openings2016
Estimated
2018 Projected Net Percen
tGrowt
hReplacemen
tTota
l
53-0000 Transportation and Material Moving Occupations 11,553 12,016
463 4.01% 236 252 488
35-0000 Food Preparation and Serving Related Occupations 9,091 9,514
423 4.65% 212 366 578
41-0000 Sales and Related Occupations 11,421 11,746
325 2.85% 166 390 556
115Arkansas Economic Report 2017
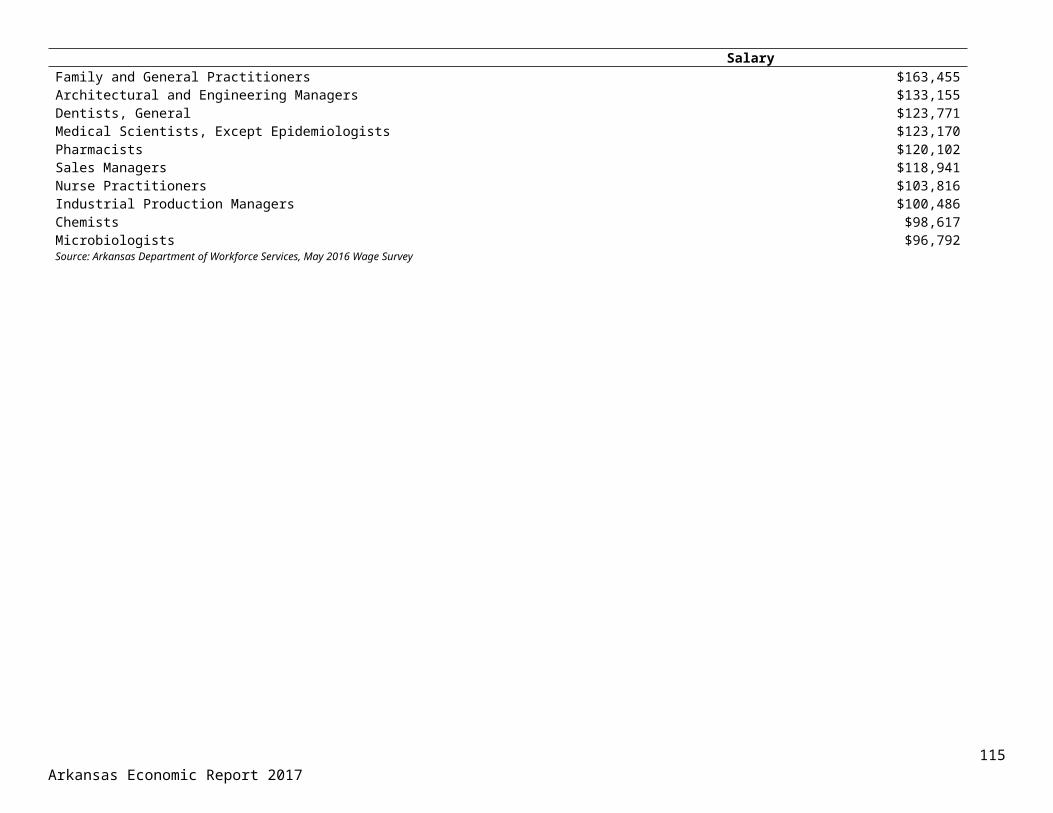
Arkansas Economic Report 2017 116
25-0000 Education, Training, and Library Occupations 5,332 5,627
295 5.53% 148 112 260
29-0000 Healthcare Practitioners and Technical Occupations 6,535 6,804
269 4.12% 136 134 270
Top Occupations
SOC Code SOC Title
Employment Growth Annual Openings2016
Estimated2018
Projected
Net Percent Growth Replacement Total
Top 10 Growth35-3021 Combined Food Preparation and Serving Workers, Including Fast Food 2,902 3,078 176 6.06% 88 113 20153-3032 Heavy and Tractor-Trailer Truck Drivers 4,725 4,885 160 3.39% 80 76 15611-9013 Farmers, Ranchers, and Other Agricultural Managers 5,986 6,128 142 2.37% 71 99 17053-7062 Laborers and Freight, Stock, and Material Movers, Hand 2,765 2,905 140 5.06% 70 86 15641-2031 Retail Salespersons 3,260 3,389 129 3.96% 64 122 18629-1141 Registered Nurses 2,028 2,116 88 4.34% 44 44 8841-2011 Cashiers 3,322 3,408 86 2.59% 43 168 21151-3022 Meat, Poultry, and Fish Cutters and Trimmers 1,826 1,901 75 4.11% 38 33 7137-2011 Janitors and Cleaners, Except Maids and Housekeeping Cleaners 1,400 1,463 63 4.50% 32 25 5735-3031 Waiters and Waitresses 1,504 1,566 62 4.12% 31 78 109
Western Arkansas Local Workforce Development AreaTop Occupations
SOC Code SOC TitleEmployment Growth Annual Openings
2016 Estimated
2018 Projecte
dNet Percent Growth Replacement Total
Top 10 Fastest Growth51-9196 Paper Goods Machine Setters, Operators, and Tenders 96 106 10 10.42% 5 2 741-3021 Insurance Sales Agents 287 314 27 9.41% 14 8 2249-2098 Security and Fire Alarm Systems Installers 87 95 8 9.20% 4 2 651-9032 Cutting and Slicing Machine Setters, Operators, and Tenders 226 246 20 8.85% 10 5 1543-9041 Insurance Claims and Policy Processing Clerks 227 245 18 7.93% 9 6 1549-2094 Electrical and Electronics Repairers, Commercial and Industrial Equipment 120 129 9 7.50% 4 2 629-1123 Physical Therapists 141 151 10 7.09% 5 4 931-2021 Physical Therapist Assistants 72 77 5 6.94% 2 2 449-3093 Tire Repairers and Changers 101 108 7 6.93% 4 4 829-1122 Occupational Therapists 116 124 8 6.90% 4 2 6
Top 10 Decline47-5013 Service Unit Operators, Oil, Gas, and Mining 106 68 -38 -35.85% 0 4 4
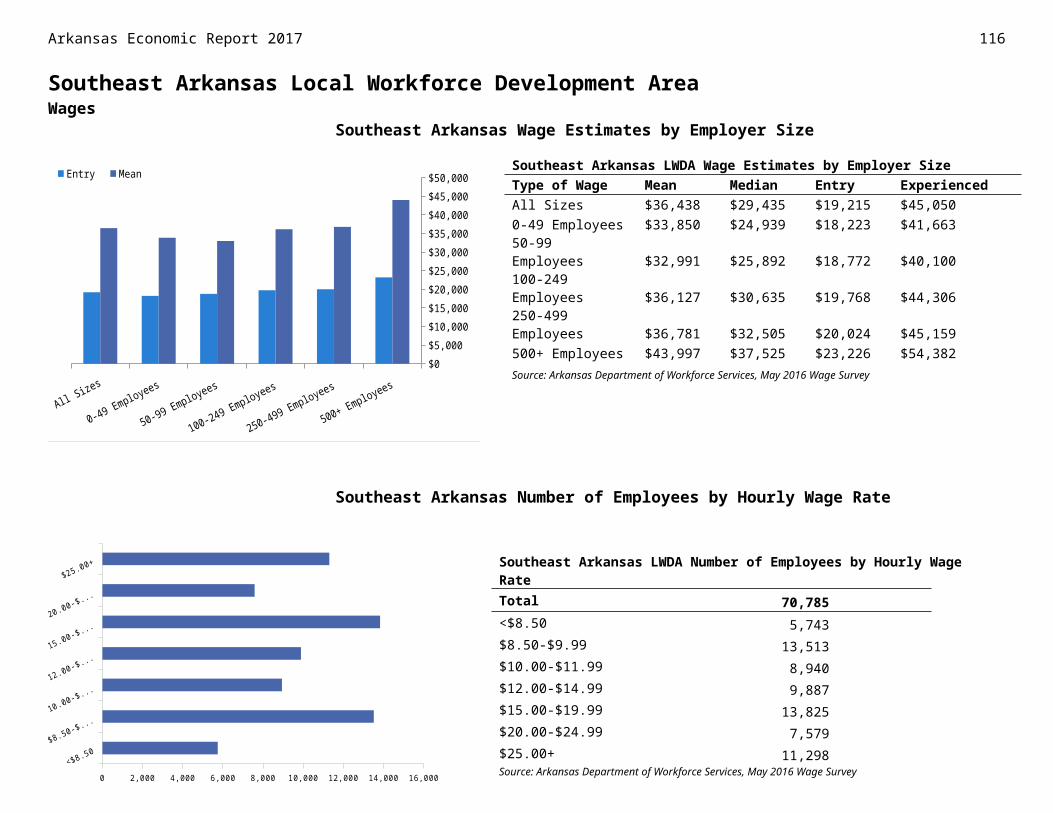
51-2092 Team Assemblers 1,353 1,318 -35 -2.59% 0 29 2943-3071 Tellers 614 586 -28 -4.56% 0 27 2751-7042 Woodworking Machine Setters, Operators, and Tenders, Except Sawing 359 333 -26 -7.24% 0 6 651-4121 Welders, Cutters, Solderers, and Brazers 404 390 -14 -3.47% 0 12 1251-4031 Cutting, Punching, and Press Machine Setters, Operators, and Tenders, Metal and Plastic 314 301 -13 -4.14% 0 4 451-2022 Electrical and Electronic Equipment Assemblers 434 422 -12 -2.76% 0 6 643-3031 Bookkeeping, Accounting, and Auditing Clerks 1,441 1,433 -8 -0.56% 0 14 1451-6063 Textile Knitting and Weaving Machine Setters, Operators, and Tenders 63 55 -8 -12.70% 0 1 151-4122 Welding, Soldering, and Brazing Machine Setters, Operators, and Tenders 66 59 -7 -10.61% 0 2 2
Top 10 Fastest Decline47-5013 Service Unit Operators, Oil, Gas, and Mining 106 68 -38 -35.85% 0 4 451-6063 Textile Knitting and Weaving Machine Setters, Operators, and Tenders 63 55 -8 -12.70% 0 1 151-4122 Welding, Soldering, and Brazing Machine Setters, Operators, and Tenders 66 59 -7 -10.61% 0 2 251-7042 Woodworking Machine Setters, Operators, and Tenders, Except Sawing 359 333 -26 -7.24% 0 6 651-2041 Structural Metal Fabricators and Fitters 140 133 -7 -5.00% 0 2 251-5113 Print Binding and Finishing Workers 100 95 -5 -5.00% 0 2 241-3011 Advertising Sales Agents 107 102 -5 -4.67% 0 3 343-3071 Tellers 614 586 -28 -4.56% 0 27 2717-2141 Mechanical Engineers 117 112 -5 -4.27% 0 4 451-4111 Tool and Die Makers 120 115 -5 -4.17% 0 0 0Source: Arkansas Department of Workforce Services, Projections Suite Software
117Arkansas Economic Report 2017