
Viewshed Analysis and Intersite Visibility of Iron … · Viewshed Analysis and Intersite...
18
Viewshed Analysis and Intersite Visibility of Iron Age Castros in Northern Portugal Jordan Bowers GEO 386G Fall 2014
Transcript of Viewshed Analysis and Intersite Visibility of Iron … · Viewshed Analysis and Intersite...

Viewshed Analysis and Intersite Visibility of Iron Age Castros in Northern Portugal
Jordan Bowers
GEO 386G
Fall 2014

Table of Contents Introduction ......................................................................................................................................1 Data Acquisition and Modification ..................................................................................................2 Digital Elevation Model .......................................................................................................2 Creation of the Geodatabase ................................................................................................2 Study Area Vector Layer .....................................................................................................2 Political Geography of Northern Portugal ...........................................................................3 Hydrogeography of Northern Portugal ................................................................................3 Name and location of Castros ..............................................................................................4 Viewshed Analysis...........................................................................................................................4 Intersite Visibility Analysis .............................................................................................................5 Conclusions ......................................................................................................................................6 Map 1: Castros and Municipalities of Northern Portugal ...............................................................8 Map 2: Viewshed from Cividade de Bagunte .................................................................................9 Map 3: Viewshed and Visible Sites from Cividade de Bagunte ...................................................10 Map 4: High Certainty Intersite Visibility Network of Northern Portugal ...................................11 Map 5: Intersite Visibility Network in Northeastern Portugal......................................................12 Table 1: Castros of Northern Portugal by Number of Sites Visible ..............................................13 Works Cited ...................................................................................................................................16
i

Introduction The Castro Culture is a culture group from Northern Portugal and Galicia that inhabited the region from circa 1000 BCE, at the beginning of the Iron Age, until assimilation into the Roman Empire in the first century CE. The archaeological record is dominated by fortified, hilltop settlements known as castros. Castros are differentiated in size with three different designations: Castro, Cividade, and Citania. Cividade and Citania are reserved for the largest castros, which may cover 25 hectares or more, although these designations are largely up to the interpretation of the excavators. The core area of the Castro Culture was along the Ave River and its tributaries in Northern Portugal, but castros have been excavated from the Douro River to the northern coastline of Galicia. My research in the region is currently over the connection between visibility and power. I look at the role visibility plays at two levels: at the local level, particularly with regards to Cividade de Bagunte, and at the regional level covering the entire area of the Castro Culture. Broader questions I seek to answer are how did a site’s location permit and secure control over the site’s surrounding landscape and how did a dominant site’s geographic position relate to other smaller castros within its viewshed?
My dissertation research draws upon the theoretical approaches of both landscape archaeology and settlement archaeology to create a more accurate understanding of the relationships between humans, sites, and landscapes. To study the patterns of settlement and use of landscape as an entangled system unlocks the realities of past boundaries from modern Western perceptions (Bruck and Goodman, 2003). To consider the concept of boundaries from modern and prehistoric viewpoints it is imperative to study the taskscape, the nonstatic physical and social changes that occur in a landscape over time through human labor, which plays a role in the development of the landscape and one’s interpretations of it (Ingold, 1993). My research focuses on sites as taskscapes and how the inhabitants of each site utilized the landscape. I am attempting to understand the ways in which expressions of power and control affect the way the inhabitants of the site mentally viewed, constructed, and navigated their physical space.
I am applying GIS software as a heuristic tool to understand the processes and conceptions of the landscape as perceived by an individual (cf. Llobera, 1996). Viewshed analysis and intersite visibility analysis were necessary for this project in order to begin answering questions about how visibility plays a role in the expression of power and dominance. In their study of Inca sites, Kosiba and Bauer have shown that political and social configurations can be expressed by the location of sites within the physical landscape, particularly by controlling aspects of visibility (2013). It has been noted that the existence of a visibility network among sites may play a role in how a site and its inhabitants recreate their environment in response to limitations caused by natural features, such as ridges (Christopherson and Guertin, 1996). The visibility network between castros in Portugal has previously been studied (Dinis, 1993), however his study was limited to a dataset if only 25 castros along the Lower Ave River Valley. My study expands on the Dinis’s work and includes another 92 castros. I expect to find in this study that Cividades and Citanias have the largest viewsheds and largest number of sites visible.
1
Data Acquisition and Modification
The data required for this project included:
• Digital Elevation Model for Northern Portugal• Shapefile for the delineation of the study area• Political geography of Northern Portugal, including an outline of the districts and country
and name and locations of municipalities• Hydrogreography of Northern Portugal• Names and locations of castros
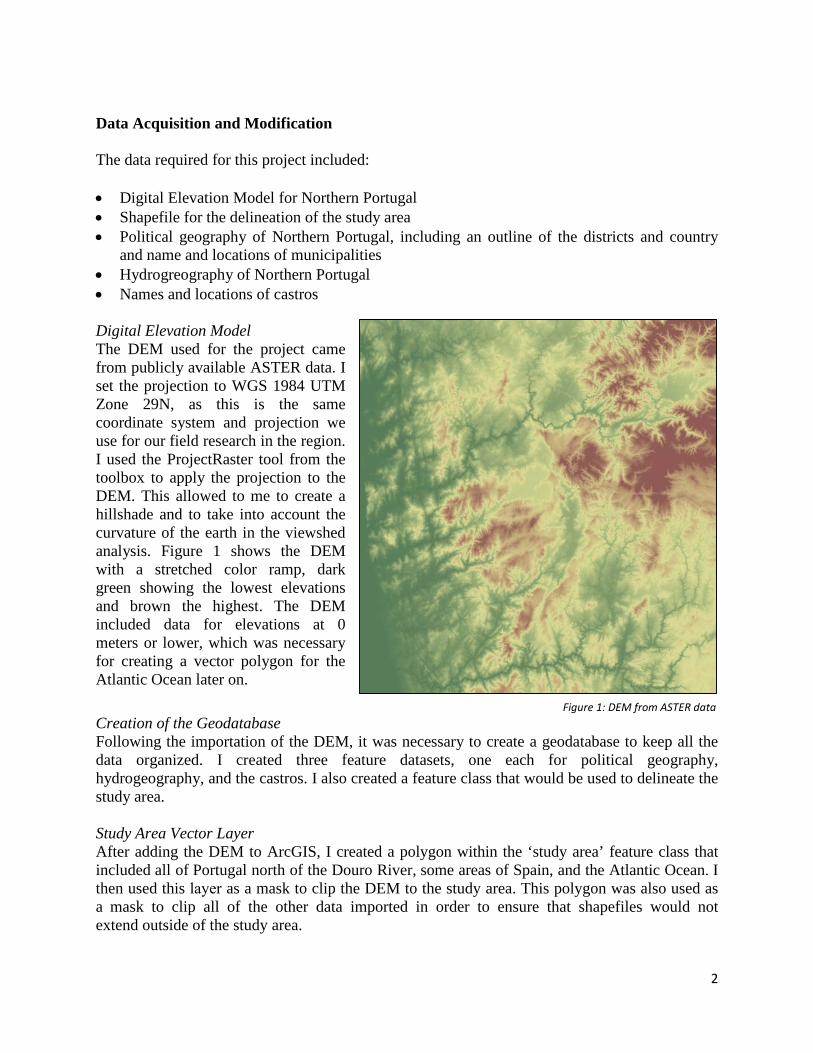
Digital Elevation Model The DEM used for the project came from publicly available ASTER data. I set the projection to WGS 1984 UTM Zone 29N, as this is the same coordinate system and projection we use for our field research in the region. I used the ProjectRaster tool from the toolbox to apply the projection to the DEM. This allowed to me to create a hillshade and to take into account the curvature of the earth in the viewshed analysis. Figure 1 shows the DEM with a stretched color ramp, dark green showing the lowest elevations and brown the highest. The DEM included data for elevations at 0 meters or lower, which was necessary for creating a vector polygon for the Atlantic Ocean later on.
Creation of the Geodatabase Following the importation of the DEM, it was necessary to create a geodatabase to keep all the data organized. I created three feature datasets, one each for political geography, hydrogeography, and the castros. I also created a feature class that would be used to delineate the study area.
Study Area Vector Layer After adding the DEM to ArcGIS, I created a polygon within the ‘study area’ feature class that included all of Portugal north of the Douro River, some areas of Spain, and the Atlantic Ocean. I then used this layer as a mask to clip the DEM to the study area. This polygon was also used as a mask to clip all of the other data imported in order to ensure that shapefiles would not extend outside of the study area.
Figure 1: DEM from ASTER data
2

Political Geography of Northern Portugal For the Political Geography feature class, I imported the administrative regions and country outline downloaded from DIVA-GIS. I found a shapefile for all municipalities in Portugal from MapCruzin.com. I edited this shapefile in order to only show the largest towns within the
districts in Northern Portugal and corrected many errors caused by special characters in the names. Figure 2 shows the modified shapefiles for the political geography of northernPortugal, The thick, gray outline represents the outline of Portugal, the thinner lines are the borders for the districts, and the points are for the municipalities.
Hydrogeography of Northern Portugal From the DEM, I created a raster of the Atlantic from all elevations which were less than or equal to zero, which was then converted into a vector layer. I then edited the Atlantic Ocean vector to clean up some of the irregularities that remained from the DEM, then used the Dissolve tool to further clean up the layer. I then imported shapefiles for the rivers and lakes in Portugal that I downloaded from DIVA-GIS. These shapefiles were overly simplified and when zoomed in did not match up with the valleys in the DEM. I used LandSat imagery to edit these shapefiles to create more accurate lines for the rivers and polygons for the lakes.
Figure 2: Modified shapefiles of the political geography of Northern Portugal
Figure 3: Shapefile showing the Atlantic Ocean and the modified rivers and lakes
3

Name and Locations of Castros To find the longitude and latitude for the castros in Portugal and Galicia, I used two main sources, “Ordenamento do Territorio do Baixo Ave no I Millenio A.C.” by Antonio Pereira Dinis and Megalithic.co.uk. Dinis gives the names and locations for 25 castros along the Lower Ave River Valley, although he does not state which datum he is using for his coordinates. However, when projected using the WGS84 datum, these sites appear to fall in the correct location, so it is probable that this is the datum he used. To get data for other castros within Portugal, Megalthic.co.uk contained names and coordinates for many other sites, however I am unsure of the accuracy of the coordinates given for each site. A spreadsheet (see Table 1, p. X) containing the listing of sites and their coordinates was imported using the ‘Import XY Data’ function and were then added to the feature dataset ‘castros’. The collection of these data allowed me to create a map of castros in Northern Portugal in relation to the political and physical geography of the region (see Map 1, p. 8).
Viewshed Analysis The viewshed analysis tool in ArcToolbox was applied to each site within the study area. This tool identifies all cells visible from a particular point on a projected DEM raster and can even take into account refractivity and earth curvature, which was necessary because the study area was so large. The viewshed analysis results in a binary raster where 0=not visible and 1=visible.
The tool was unable to run for all castros within the study area and return individual results for each site. This made it necessary to create individual point feature classes for every site, after which each site had to be run through viewshed analysis. Figure 4 shows an example of how I used the Viewshed tool for each site. On the attribute table for each site point I added the column ‘OFFSETA’ and entered a value of five meters. This meant that when the viewshed tool was running it would calculate the observer point as being five meters higher than the elevation of the cell. I decided to use an offset value in order to see the viewshed as it would be seen from the top of a wall or watchtower, as opposed to within the actual site where one likely would have not been able to see outside the site. The result was an individual binary raster for each site showing which cells on the DEM were visible or not from the theoretical watchtower.
Figure 4: Example of viewshed tool as applied to each site
4

For each raster, I changed the symbology to only display the cells that are visible and set them to 60% transparency so that overlap of viewsheds would be visible. The overlap is currently not important for my research, but may be beneficial in answering later questions that may come up regarding areas of shared visibility. I then gave each raster a unique color in order to differentiate the visibility for each site. There is some possible overlap in colors, as applying 117 distinct colors is a bit difficult, but showing and hiding the various layers can assist in differentiating viewsheds with similar colors. Figure 5 shows a combination of all viewshed rasters, which gives an overall idea of the total extent of visible areas
from all sites. Map 2 (p. 9) shows the viewshed for only Cividade de Bagunte, including other visible sites. A future goal from this research is to calculate the total area visible from each site, however the DEM will need to be refined before an accurate number can be achieved
Intersite Visibility Analysis From the results of the viewshed analysis, I created a new line feature class for intersite visibility. This layer shows lines between sites that mark the visibility between castros. I categorized the lines into two types based on the certainty of the visibility. The certainty for each line came from the location of sites in conjunction with the viewshed. When testing for visibility, if a site fell within the areas marked as visible in the viewshed raster I marked it as having high certainty. If the site was separated from visible areas, but only by a few cells, I assigned the low certainty attribute to the line.
Map 3 (p. 10) shows the results of the visibility analysis for only Bagunte in combination with the viewshed raster. The results of this analysis for a single site mirrors the results of the viewshed analysis, but only as the viewshed relates to other sites. Combining the lines for intersite visibility for all sites within the study area a clear network of visibility forms (see Map 4, p. 11). The sites in Northwestern Portugal form one grouping with a high level of connectivity, as shown in Map5 (p. 12). This grouping is distinct from the sites in Northeastern Portugal, which show some connectivity, but many of the sites are not visible from each other. It is possible from this analysis to question the validity of classifying the sites in the eastern portion of the study area as being part of the Castro Culture, however it is also necessary to include material culture if a distinction is to be made.
Figure 5: Viewshed for all castros in Northern Portugal
5

Conclusion It is necessary to expand upon this project in the future. There are a number of issues related to the data, particularly from the DEM and castros, that could cause results of the analyses to change. It appears that the DEM includes buildings and foliage in its measurements of elevation. This means that a stand of trees may block a large section of the viewshed now, whereas this may not have been the case during the Iron Age. Additionally, many of these sites are surrounded by tall eucalyptus trees, which would also limit the viewshed from the acropolis of each site. This was the case at Bagunte, where I had to find the highest elevation and move the observer point there in order to get a better result from the viewshed analysis. The issues stemming from the ASTER DEM can be rectified through using other sources of information for elevation, such as topographic maps or LIDAR data. I will also be performing research during upcoming field seasons on pollen and phytoliths dating to the Iron Age. The results of this research should give a better idea of what species of plants, particularly trees, were growing in the region and at what density. The difference between thick forests and open plains can vastly change a viewshed, and thus the visibility network between sites, so it will be necessary to take this into account.
The list of castros and their coordinates may also have caused some errors in the data. Many of these coordinates were collected from the internet and the accuracy of them is unknown. Many of the coordinates were not accurate enough to place a point exactly where the site would be. Rectification of this would require that each site be visited and its coordinates remeasured. It is also possible that the list is incomplete. Dinis’s listing only gives coordinates for castros in the valleys of the Ave and Este Rivers. Additionally, the Megalithic Portal does not appear to have a complete listing of castros for Portugal and it is possible that many outside of the area discussed by Dinis were not included in this analysis. Map 1 highlights this discrepancy, as a clear concentration of sites is evident along the Ave River and only a few appear north toward Spain.
The results of these GIS analyses offer insight into the role that visibility played within the Castro Culture. There must have been a reason for these societies to settle along hilltops. There is little to no evidence for war or battles between the castros, but the geographic position of the settlements in combination with large walls points at the need for the culture to settle in easily defendable areas. The intersite visibility analysis highlights the connection between almost all of the settlements commonly identified with the Castro Culture in Portugal. The vast network would allow information to be exchanged quickly between settlements.
Table 1 lists the castros included in the study area. Columns are included with the number of sites visible from each location, which is then broken down to the number of sites where the certainty of visibility is high and low. The results of this backed up my expected results that Cividades and Citanias would have the greatest number of sites visible. However, there were a few unexpected results. Monte da Falperra was much higher than expected, with 31 total sites visible and also had the greatest number visible with high certainty (22). Equally surprising was the position of Citania de Briteiros. Briteiros is one of the largest and best well documented castros in Portugal, however the number of sites visible from it was much lower than expected. Following with the idea that Citanias and Cividades would have the highest number of sites visible, it is surprising the Citania da Longa had absolutely zero visibility. However, the location
6

of this castro may lend itself to part of a network of Galician castros. It is also possible that Longa was designated as a Citania due to sociopolitical factors when these sites were first excavated. A continuation of this project will be necessary to get at the larger questions regarding visibility, power, and control, but refinement of the data used to draw these inferences must occur in order to improve the accuracy of the results.
7

")
")
")")
")")
")
")")")
")
")")
")
")
")
")
")")
")
")
")
")
")
")
")
")
")")
")
")
")")
")
")
")
")
")
")
")
")
")
")
")
")
")
")")
")
")
")
")
")
")
")
")
")
")
")
")
")
")
")")
")
")
")
")
")
")")
")
") ")
")
")
")
")
")
")
")
")
")
")
")")
")
")
") ")")
")
")
")
") ")
")
")
")
")
")
")
")
")
")
")
")
")
")
")
")
")
")
") ")
")
")
")
")
")
")
")
")
")
")")
")
")
")
")
")
")
")
")
")Xián
Troña
Pintán
Cidade
Torroso
Xironda
AltamiraSan Amaro
Pontellas
Santa Tecla
Maia
Meda
Fafe
Porto
Murça
Trofa
Alijo
Braga
Chaves
Vizela
Amares
Lamego
Sabrosa
Boticas
Espinho
Lousada
ParedesValongo
Valença
Melgaço
Tarouca
ResendeCinfães
Armamar Tabuaço
Valpaços
Penafiel
Gondomar
Amarante
Moncorvo
Barcelos
Penedono
Bragança
Mirandela
Vila Flor
Mogadouro
Esposende
Guimarães
Vila Real
Mesão Frio
Montalegre
Matosinhos
Felgueiras
Vila Verde
Vila do Conde
Ponte de Lima
Ponte da Barca
Mondim de Basto
Ribeira de Pena
Povoa de VarzimAlfandega da Fe
Vieira do Minho
Terras de Bouro
Paredes de Coura
Povoa de Lanhoso
Castelo de Paiva
Viana do Castelo
Torre De Moncorvo
Vila Nova de Gaia
Paços de Ferreira
Arcos de Valdevez
Celorico de Basto
Moimenta da Beira
Marco de Canaveses
Cabeceiras de BastoMacedo de Cavaleiros
Carrazeda de Ansiaes
Vila Nova de Cerveira
São João da Pesqueira
Freixo de Espada a Cinta
BaionaGondomar
Lumbrales
Boi
Ovil
BócaSaia
Longa
Ribas
Cerva
Coroa
Azere
Fiães
ForcaLages
Facho
Loivos
Cabeço
Populo
Roques
VieitoCresto
Ancora
Alvora
Guedes Arados
Máximo
CruitoCasais
LesenhoSabariz
Melgaço
Cendufe
Sanfins
Vicente
GimondeSacóias
Barbudo
SabrosoPicotos
Belinho
Carmona
Romariz
S. Paio
S. JoãoRetorta
Pedrais
Redondo
Ermidas
Penices
Bagunte
Terroso
Nandunfe
Vilanova
Pedrario
Giestosa
Alfarela
São BrásCirigata
Palheiros
São Romão
Cidadelhe
Formigoso
Baldoeiro
BriteirosFerreiros
Crastoeiro
Cossourado
São Julião
Alvarelhos
Torre Alta
Vilarendelo
Cavalhelhos
São Caetano
São Juzenda
Aldeia Nova
Santa Tecla
Coto de OuroSão MartinhoCoto da Pena
Santo Ovidio
São LourençoMonte Castro
Monte Padrão
Eiras Velhas
Monte Mozinho
Monte Castelo
Vale de Aguia
S. Bartolomeu
Santa Marinha
Lama de Ouriço
Alto das Eiras
Tras de Cidades
Santa Margarida
Freixo de Numao
Monte dos PicosPau de Bandeira
Castelo do Neiva
Alto das Valadas
Monte do Castelo
S. Miguel-o-Anjo
Cabeço dos Mouros
Santiago do Monte
Nossa Senhora da PazSr. dos Desamparados
Serra do Muro de Vadoma
Bragança
Vila Real
Braga
Porto
Viseu
Viana do Castelo
GuardaAveiro
Rio Douro
R io Minho
Rio Lima
Rio D o uro
Rio Lima
7°0'0"W
7°0'0"W
7°30'0"W
7°30'0"W
8°0'0"W
8°0'0"W
8°30'0"W
8°30'0"W
9°0'0"W
9°0'0"W42
°0'0"
N
42°0
'0"N
41°3
0'0"N
41°3
0'0"N
41°0
'0"N
41°0
'0"N
Map 1: Castros and Municipalities of Northern Portugal
Spain
Spain
Spain
A t l a n t i cO c e a n
") CastrosMunicipalities
RiversLakes
Country BorderDistrict Border
WGS84 UTM Zone 29N1:750,000 ¹ 0 10 20 30 40 505
Kilometers
8

")
")
")
")
")
")
")
")")")
")
")
")
")
")
")
")
")")
")
")
")
")
")
")
")
")
")")
")
")
")")
")
")
")
")
")
")
")
")
")
")")
")
")
")
")
")
")
")
")
")
")
")
")
")
") ")
")
")
")
")
")
")
")
")")
")
") ")")
")
")
")
") ")
")
")
")
")
")
")
")
")
")
")
")
")
")
")
")Torroso
Boi
BócaSaia Cerva
Coroa
Azere
Forca
Lages
Facho
Loivos
Cabeço
Roques
VieitoCresto
Ancora
Guedes
Máximo
Cruito
Casais
LesenhoSabariz
Cendufe
Sanfins
Barbudo
Vermoim
SabrosoPicotos
Belinho
Carmona
S. Paio
S. JoãoRetorta
Pedrais
Redondo
Ermidas
Penices
Bagunte
Terroso
Nandunfe
Pedrario
Giestosa
Falperra
São Romão
Cidadelhe
Formigoso
Briteiros
ArgifonsoSantogões
Ferreiros
Crastoeiro
São Julião
Alvarelhos
Consolação
Torre Alta
Vasoncelos
Cavalhelhos
Santa Tecla
Coto de OuroSão MartinhoCoto da Pena
Santo Ovidio
São Lourenço
Monte Castro
Monte Padrão
Eiras Velhas
Monte Mozinho
Monte Castelo
S. Bartolomeu
Santa Marinha
Alto das EirasSanta Cristina
Tras de Cidades
Santa Margarida
Monte dos Picos
Castelo do Neiva
Alto das Valadas
Monte do Castelo
S. Miguel-o-Anjo
S. Miguel-o-Anjo
S. Miguel-O-Anjo
Nossa Senhora da Paz
Sr. dos DesamparadosSanta Maria de Galegos
Serra do Muro de Vadoma
Braga
Porto
Vila Real
Viana do Castelo
Viseu
Rio Ave
Rio Douro
Rio Cavado
Ri o Vizela
Rio Lima
Rio Douro
7°30'0"W
7°30'0"W
8°0'0"W
8°0'0"W
8°30'0"W
8°30'0"W
41°3
0'0"N
41°3
0'0"N
WGS84 UTM Zone 29N1:375,000 ¹
0 10 20 305Km
Map 2: Viewshed From Cividade de Bagunte
") Castros Rivers Lakes District Border Visible AreasBagunte
Bagunte
9

")
")
")
")
")
")
")
")")
")
")
")
")
")
")
")
")
")")
")
")
")
")
")
")
")
")
")
")
")
")
")")
")
")
")
")
")
")
")
")
")
")
")
")
")
")
")
")
")
")
")
")
")
")
") ")
")
")
")")
")
")
")")
")
")Torroso
Boi
BócaSaiaForca
Lages
Facho
Roques
Cresto
Máximo
Cruito
Casais
Sabariz
Sanfins
Barbudo
Vermoim
SabrosoPicotos
Belinho
Carmona
S. Paio
S. JoãoRetorta
Pedrais
Redondo
Ermidas
Penices
Bagunte
Terroso
Nandunfe
Falperra
Briteiros
Argifonso
Santogões
Ferreiros
São Julião
Alvarelhos
Consolação
Torre Alta
Vasoncelos
Santa Tecla
Santo Ovidio
São Lourenço
Monte Castro
Monte Padrão
Eiras Velhas
Monte Castelo
S. Bartolomeu
Santa Marinha
Alto das Eiras
Santa Cristina
Tras de Cidades
Santa Margarida
Monte dos Picos
Castelo do Neiva
Alto das Valadas
Monte do Castelo
S. Miguel-o-Anjo
S. Miguel-o-Anjo
S. Miguel-O-Anjo
Alto da Cividade
Nossa Senhora da Paz
Sr. dos Desamparados
Santa Maria de Galegos
Serra do Muro de Vadoma
Braga
Porto
Viana do CasteloVila Real
Rio Ave
Rio Cavado
R io Este
Rio Vizela
8°0'0"W
8°0'0"W
8°30'0"W
8°30'0"W
41°30
'0"N
41°30
'0"N
WGS84 UTM Zone 29N1:325,000
¹ 0 10 205Km
Map 3: Viewshed and Visible Sites from Cividade de Bagunte
") Castros Rivers Lakes District Border Visible Areas High Certainty Low CertainityBagunte
Bagunte
10

")
")
")")
")")
")
")")")
")
")
")
")
")
")
")
")")
")
")
")
")
")
")
")
")
")")
")
")
")")
")
")
")
")
")
")
")
")
")
")")
")
")
")
")
")
")
")
")
")
")
")
")
")
")
") ")
")
")
")
")
")
")
")
")
")
")")
")
")
") ")")
")
")
")
") ")
")
")
")
")
")
")
")
")
")
")
")
")
")
")
")
")
")
")
")
")
")")
")
")
Pintán
Torroso
Santa Tecla
Boi
BócaSaia
Ribas
Cerva
Coroa
Azere
ForcaLages
Facho
Loivos
Cabeço
Populo
Roques
VieitoCresto
Ancora
Alvora
Guedes Arados
Máximo
CruitoCasais
LesenhoSabariz
Cendufe
Sanfins
Barbudo
SabrosoPicotos
Belinho
Carmona
S. Paio
S. JoãoRetorta
Pedrais
Redondo
Penices
Bagunte
Terroso
Nandunfe
Vilanova
Pedrario
Giestosa
Palheiros
São Romão
Cidadelhe
Formigoso
Briteiros
Santogões
Ferreiros
Crastoeiro
Cossourado
São Julião
Alvarelhos
Torre Alta
Vilarendelo
Cavalhelhos
Santa Tecla
Coto de OuroSão Martinho
Coto da Pena
Santo Ovidio
São Lourenço
Monte Castro
Monte Padrão
Eiras Velhas
Monte Mozinho
Monte Castelo
S. Bartolomeu
Santa Marinha
Lama de Ouriço
Alto do Crasto
Alto das Eiras
Tras de Cidades
Santa Margarida
Castelo do Neiva
Alto das Valadas
Monte do Castelo
S. Miguel-o-Anjo
Santiago do Monte
Serra do Muro de Vadoma
Vila RealBraga
Porto
Viana do Castelo
Viseu
Bragança
GuardaRio Douro
R ioMinh
o
Rio Lima
Rio Douro
Rio Lima
8°50'0"W
8°50'0"W
7°20'0"W
7°20'0"W
7°30'0"W
7°30'0"W
7°40'0"W
7°40'0"W
7°50'0"W
7°50'0"W
8°0'0"W
8°0'0"W
8°10'0"W
8°10'0"W
8°20'0"W
8°20'0"W
8°30'0"W
8°30'0"W
8°40'0"W
8°40'0"W
41°50'0"N41°50'0"N
41°40'0"N41°40'0"N
41°30'0"N41°30'0"N
41°20'0"N41°20'0"N
41°10'0"N41°10'0"N
Map 4: High Certainty Intersite Visibility Network of Northern Portugal
WGS84 UTM Zone 29N Scale: 1:550,000
0 10 20 30 405 Km¹District Border Lakes Rivers ") Castros High Certainty of Visibility
11

")
")
")
")
")
")
")
")")
")
")
")
")
")
")
")
")
")")
")
")
")
")
")
")
")
")
")
")
")
")
")")
")
")
")
")
")
")
")
")
")
")
")
")
")
")
")
")
")
")
")
")
")
")
")
")
")
")")
")
Boi
BócaSaiaForca
Lages
Facho
Roques
Máximo
Cruito
Casais
Sabariz
Sanfins
Barbudo
Vermoim
SabrosoPicotos
Belinho
Carmona
S. Paio
S. JoãoRetorta
Pedrais
Redondo
Ermidas
Penices
Bagunte
Terroso
FalperraBriteiros
Argifonso
Santogões
Ferreiros
Alvarelhos
Consolação
Torre Alta
Vasoncelos
Santa Tecla
Santo Ovidio
São Lourenço
Monte Castro
Monte Padrão
Eiras Velhas
S. Bartolomeu
Santa Marinha
Alto do Crasto
Alto das EirasSanta Cristina
Santa Margarida
Monte dos Picos
Castelo do Neiva
Monte do Castelo
S. Miguel-o-Anjo
S. Miguel-o-Anjo
S. Miguel-O-Anjo
Alto da Cividade
Nossa Senhora da Paz
Sr. dos Desamparados
Santa Maria de Galegos
R io Ave
Rio C avado
Rio Es
te
Rio Vizela
8°50'0"W
8°50'0"W
8°10'0"W
8°10'0"W
8°20'0"W
8°20'0"W
8°30'0"W
8°30'0"W
8°40'0"W
8°40'0"W
41°40'0"N 41°40'0"N
41°30'0"N 41°30'0"N
41°20'0"N 41°20'0"N
Map 5: Intersite Visibility Network of Northeastern Portugal
WGS84 UTM Zone 29NScale: 1:250,000
0 10 205 Km¹District Border Lakes Rivers ") Castros High Certainty of Visibility Low Certainty of Visibility
A t l a n t i cO c e a n
12

Table 1: Castros of Northern Portugal by Number of Sites Visible
Site Latitude (DD)
Longitude (DD)
Number of Sites Visible
High Certainty
Low Certainty
Monte da Falperra 41.513889 -8.393333 31 22 9 Cividade de Bagunte 41.385556 -8.654444 24 17 7 Monte da Saia 41.457222 -8.583611 23 13 10 Citania de Sanfins 41.323333 -8.386667 21 17 4 Castro do Facho 41.404444 -8.545833 16 4 12 Castro do Alto das Valadas 41.714142 -8.598734 14 13 1 Castro de S. Miguel-o-Anjo (Ruivães) 41.399722 -8.425000 14 10 4 Castro de Carmona 41.646887 -8.648413 14 7 7 Castro de São Lourenço 41.556111 -8.761667 13 12 1 Castro de Barbudo 41.652677 -8.470149 13 10 3 Castro de Alvarelhos 41.300556 -8.619444 13 9 4 Monte dos Picos 41.568333 -8.332500 13 8 5 Castro de Consolação 41.550278 -8.384444 13 6 7 Castro do Monte Padrão 41.314722 -8.447500 13 6 7 Monte de S. Bartolomeu 41.478056 -8.381667 12 10 2 Cividade de Terroso 41.414167 -8.719722 11 7 4 Castro de Santa Tecla 41.416944 -8.402222 11 6 5 Castro de Lages 41.498333 -8.448056 11 4 7 Alto da Cividade 41.545000 -8.427500 10 9 1 Alto do Crasto 41.554722 -8.365833 10 9 1 Citania de Sabroso 41.512462 -8.341603 10 6 4 Citania de Briteiros 41.527500 -8.316111 10 6 4 Castro Máximo 41.561205 -8.428103 9 8 1 Castro da Serra do Muro de Vadoma 41.199396 -8.390364 9 7 2 Citania de São Julião 41.689418 -8.393889 9 6 3 Eiras Velhas 41.585000 -8.342222 8 7 1 Castro de S. Miguel-o-Anjo (Vermil) 41.460000 -8.383889 7 7 0 Pedrais 41.517778 -8.350278 7 7 0 Monte de Vasoncelos 41.575556 -8.376389 7 5 2 Monte da Forca 41.469444 -8.367778 7 5 2 Monte do Castelo 41.585000 -8.097000 7 5 2 Castro do Sr. dos Desamparados 41.541040 -8.735733 7 4 3 Castro de S. João 41.354167 -8.738333 7 3 4 Castro de Monte Castro 41.584000 -8.633000 6 5 1 Castro de Santa Cristina 41.427222 -8.462222 6 4 2 Pau de Bandeira 41.563611 -8.341667 6 3 3 Santa Maria de Galegos 41.568014 -8.570444 6 3 3
13

Castro da Bóca 41.456111 -8.473333 5 5 0 Castro do Boi 41.322500 -8.675000 5 5 0 Castro de Santa Margarida 41.350000 -8.349000 5 5 0 Monte Redondo 41.649722 -8.441667 5 4 1 Castro das Ermidas 41.461111 -8.522222 5 3 2 Alto das Eiras 41.437778 -8.442222 5 3 2 Castro de Vermoim 41.428333 -8.448611 4 4 0 Castro de Monte Mozinho 41.146389 -8.311111 4 4 0 Castro de Sabariz 41.673653 -8.752824 4 3 1 Castro de Vilanova 41.641441 -7.409367 4 3 1 Cividade De Belinho 41.599936 -8.777198 3 3 0 Outeiro dos Picotos 41.514611 -8.742175 3 3 0 Castro do Vieito 41.730650 -8.807161 3 3 0 Castro de Casais 41.394444 -8.661389 3 2 1 Castro do Cruito 41.431944 -8.469722 3 2 1 Castro de Tras de Cidades 41.711000 -8.633000 3 2 1 Castro do Cresto 41.711000 -8.632000 3 2 1 Monte do Castelo do Neiva 41.614674 -8.786571 3 2 1 Castro de Santiago do Monte 41.675352 -7.461708 3 2 1 Castro de Nandunfe 41.551000 -8.086000 3 2 1 Castro da Retorta 41.359167 -8.722500 3 1 2 Castro do Formigoso 41.787000 -8.649000 3 1 2 Torre Alta 41.355833 -8.475833 3 0 3 Castro de Argifonso 41.391111 -8.656667 2 2 0 Castro de S. Miguel-o-Anjo (Calendário) 41.443056 -8.534444 2 2 0 Castro de São Juzenda 41.603373 -7.156612 2 2 0 Castro de Roques 41.676597 -8.725981 2 2 0 Castro de Lesenho 41.658000 -7.738000 2 2 0 Castro de Fiães 40.988686 -8.519084 2 1 1 Castro de Nossa Senhora da Paz 41.571937 -8.775676 2 1 1 Castro de São Brás 41.654886 -7.121099 2 1 1 Castro da Corôa 41.749000 -8.866000 2 1 1 Castro de Ribas 41.584198 -7.399880 2 1 1 Castro de Ferreiros 41.535833 -8.441667 2 0 2 Castro de S. Paio 41.282778 -8.728889 2 0 2 Castro do Coto de Ouro 41.870887 -8.634000 2 0 2 Castro de Vilarendelo 41.663000 -7.326000 2 0 2 Castro do Guedes 41.110502 -8.568018 1 1 0 Castro de Cendufe 41.813531 -8.487176 1 1 0 Cividade de Ancora 41.786493 -8.854031 1 1 0 Castro de Melgaço 41.086000 -8.278000 1 1 0
14

Castro de Carvalhelhos 41.694000 -7.705000 1 1 0 Castro de Santagões 41.360556 -8.683611 1 0 1 Castro Romariz 40.946185 -8.460331 1 0 1 Castro de Sacóias 41.863127 -6.690234 1 0 1 Castro de Cirigata 41.670252 -6.724291 1 0 1 Castro de São Martinho 41.879000 -8.652000 1 0 1 Cividade do Cossourado 41.915835 -8.637175 1 0 1 Castro do Populo 41.362000 -7.483000 1 0 1 Castro do Pedrario 41.800000 -7.663000 1 0 1 Castro de Palheiros 41.416667 -7.400278 1 0 1 Castro da Lama de Ouriço 41.709000 -7.346000 1 0 1 Castro do Cabeço dos Mouros 40.952000 -8.103000 1 0 1 Muralha das Portas de Montemuro 40.949000 -8.069000 1 0 1 Castro de Santa Marinha de Ferreiró 41.351944 -8.634444 0 0 0 Castro de Penices 41.415556 -8.607222 0 0 0 Castro de Ovil 40.978889 -8.620833 0 0 0 Castro do Monte Valinhas 40.936389 -8.267500 0 0 0 Castro de Santo Ovídio 41.455800 -8.184072 0 0 0 Castro de Gimonde 41.826000 -6.709000 0 0 0 Castro de Aldeia Nova 41.495000 -6.724000 0 0 0 Castro de Vale de Aguia 41.496000 -6.725000 0 0 0 Castro Vicente 41.379000 -6.840000 0 0 0 Castro de Baldoeiro 41.274000 -7.051000 0 0 0 Cabeço de Alfarela 41.199000 -7.051000 0 0 0 Castelo Velho de Freixo de Numao 41.072387 -7.191814 0 0 0 Castro dos Arados 41.098109 -8.277342 0 0 0 Castro do Monte Castelo 41.200405 -8.678481 0 0 0 Castro de Azere 41.865000 -8.405000 0 0 0 Povoado Castrejo de Alvora 41.940862 -8.451105 0 0 0 Coastro do Coto da Pena 41.868000 -8.835000 0 0 0 Castro de São Caetano 42.040556 -8.443611 0 0 0 Castro de Cabeço (Granja) 41.695000 -7.649000 0 0 0 Castro da Giestosa 41.629000 -7.844000 0 0 0 Castro de Loivos 41.626000 -7.510000 0 0 0 Castro de Cidadelhe 41.178611 -7.844444 0 0 0 Castro de Crastoeiro 41.414680 -7.929450 0 0 0 Castro de São Romão 41.983000 -7.588000 0 0 0 Castro da Cerva 41.459626 -7.804879 0 0 0 Citânia da Longa 41.066000 -7.599000 0 0 0
15

Works Cited
Bruck, J. and M. Goodman. (2003) “Introduction: themes for a critical archaeology of prehistoric settlement.” In Making Places in the Prehistoric World: Themes in Settlement Archaeology. Eds. J. Bruck and M.Goodman. 1-19. Routledge.
Christopherson, G and D. Guertin (1996). “Visibility Analysis and Ancient Settlement Strategies in the Region of Tall al-Umayri, Jordan.” University of Arizona. Web. 2 Dec. 2014.
Dinis, A (1993) “Ordenamento do Territorio do Baixo Ave no 1 Milenio A.C.” (Unpublished doctoral dissertation). Faculdade de Letras da Universidade do Porto, Portugal.
Ingold, T. (1993) “The Temporality of the Landscape.” World Archaeology 25: 152-174
Kosiba, S. and A. Bauer (2013) “Mapping the Political Landscape: Toward a GIS Analysis of Environmental and Social Differences.” Journal of Archaeological Method and Theory 20: 61-101
Llobera, D. (1996) “Exploring the topography of mind: GIS, social space and archaeology.” Antiquity 70: 612-622
16


