
· Web viewPoly Vinyl- Chloride comes from a family of prominent scientists. This scientist’s...
39
Forensic Chemistry Summer Camp Curriculum Grand Rapids Community College July 6-10, 2015 and July 13-17, 2015 This material is based upon work supported by the National Science Foundation under Grant Number DUE 1140509. "Any opinions, findings, and conclusions or recommendations expressed in this material are those of the author(s) and do not necessarily reflect the views of the National Science Foundation." Arson Case Number 1140509 Television dramas have created an interest in careers in Forensic Chemistry and arson investigation is one of the most important careers in this field. Forensic chemists may not solve an entire case alone, but as part of a team, they provide critical evidence for investigators that is often used to narrow the possibilities down to a single suspect and to prove the case against this suspect in criminal trials. For our camp, we will imagine that there has recently been a suspected arson crime at a Grand Rapids area college. The college’s chemistry stockroom was found burned and severely damaged. Several employees of the college were known to have had recent arguments with the Stockroom Manager, Fischer Esterification, and it is believed that the motive was to destroy the personal property of Esterification that was stored in the area. Further, the stockroom is in a secure area and it is unlikely that the fire was started by a person without access. The Sheriff’s office is seeking your
Transcript of · Web viewPoly Vinyl- Chloride comes from a family of prominent scientists. This scientist’s...

Forensic Chemistry Summer
Camp CurriculumGrand Rapids Community College
July 6-10, 2015
and
July 13-17, 2015
This material is based upon work supported by the National Science Foundation under
Grant Number DUE 1140509.
"Any opinions, findings, and conclusions or recommendations expressed in this material are those of the author(s) and do not necessarily reflect the views of the National Science Foundation."
Arson Case Number 1140509
Television dramas have created an interest in careers in Forensic Chemistry and arson investigation is one of the most important careers in this field. Forensic chemists may not solve an entire case alone, but as part of a team, they provide critical evidence for investigators that is often used to narrow the possibilities down to a single suspect and to prove the case against this suspect in criminal trials.
For our camp, we will imagine that there has recently been a suspected arson crime at a Grand Rapids area college. The college’s chemistry stockroom was found burned and severely damaged. Several employees of the college were known to have had recent arguments with the Stockroom Manager, Fischer Esterification, and it is believed that the motive was to destroy the personal property of Esterification that was stored in the area. Further, the stockroom is in a secure area and it is unlikely that the fire was started by a person without access. The Sheriff’s office is seeking your team’s help in identifying a suspect. During this week you will be given evidence recovered from the crime scene and several suspect’s automobiles and homes. This evidence will include accelerant soaked wood, DNA, a hand written note, paint chips, soil, and fingerprints. It will be your task to analyze all of the evidence and make a report to the Sheriff’s Office. Remember to keep good records of your work as you may be asked to testify in court.

Suspect Profiles
Suspect 1-Dr. Poly Vinyl-Chloride, Professor of Polymer Chemistry
Poly Vinyl- Chloride comes from a family of prominent scientists. This scientist’s parents were Dr. Radical Initiator and Professor Vinyl Chloride. Dr. Vinyl-Chloride has achieved wide success in the development of materials for construction and healthcare products. While once considered to be hard and brittle, this Professor’s demeanor has become more flexible since marrying Prof. Plasticizer. This Professor had poor stability in heated situations, often decomposing, but has gained stability upon meeting the Department Secretary, Heat Stabilizer. However, Dr. Vinyl-Chloride has been in a long standing disagreement with Fischer Esterification over the merits of step versus chain polymerizations.
Suspect 2-Dr. Dean Stark-Trap, Science Department Chair
Professor Dean Stark-Trap achieved success by continually driving projects to completion. The Professor’s area of specialization is azeotropic distillation methods. Prof. Stark-Trap has the ability to remove unnecessary players and to encourage others to work together to create new products. Recently, Fischer Esterification, and Grant Manager, Ethyl benzene, got into a heated argument about the density of water and had to be separated by Dr. Stark-Trap. Dr. Stark-Trap sided with Ethyl Benzene and said that Fischer Esterification needed to be less stubborn and stop reversing directions.
Suspect 3-Mr. Erlen Meyer, Department Glassblower
Mr. Meyer is an expert Glassblower who came to work at the college after a long career in industry, where he made glass objects for chemical and electronic researchers. His specialty was a type of flask with wide bases and sides that taper upward to a short vertical neck. Mr. Meyer is known to become very heated, but has always been able to avoid spillage or boiling over as he tends to condense his anger. He and the victim, Fischer Esterification, had an altercation over the best type of flask to use when reacting alcohols and carboxylic acids.
Suspect 4-Ms. Ethyl Benzene, Department Grant Manager
Ethyl Benzene long worked in the petrochemical industry before becoming a Grant Manager at the College. Ethyl Benzene is often called aromatic because of the pleasant odor, but some sense an odor much like gasoline. She is known to be highly flammable when principle investigators fail to submit their year-end reports in a timely manner. Recently, Ms. Benzene became heated and blew up when Stockroom Manager, Fischer Esterification said that Ethyl Benzene was denser than water.
Suspect 5-Dr. Ester Saponification, Associate Professor
Dr. Saponification long worked on transforming triglycerides into soap for the personal care industry. This researcher has a caustic personality and that often tears others apart. Dr. Saponification is basically a good researcher and is simply seeking stability in her final reaction products. Dr. Saponification and Fischer Esterification have almost opposite personalities and have opposite outcomes. Fischer simply tries to make esters and Saponification tries to tear them apart. Dr. Saponification is irreversible when her mind is made up.
Soil Analysis by Atomic Absorption Spectroscopy (AAS)
Enclosed is a sample of soil from the site of the recent fire at a Grand Rapids area college. The fire was started in the chemistry lab stockroom and is suspected to be an arson crime. The soil around the stockroom is unique in that after the fire it is heavily contaminated with zinc, iron, and copper. It is believed that this soil might match soil samples recovered from the suspect’s property. Soil was recovered from shoes, home entries and automobile floor mats that belong to the suspects. The soil samples will need to be analyzed to determine if any of the samples recovered from the suspects also have high levels of zinc, iron, and copper in a similar concentration. Your team will also be provided with several soil samples from a site that is not contaminated so that you have a control sample for comparison.
Atomic Absorption Spectroscopy (AAS)
A popular and easy method to analyze samples containing metals is atomic absorption spectroscopy (AAS). It is a good method for this type of analysis because it can detect very low levels of metal contaminants and in many cases can distinguish one element from another even when there are several metals present. This type of analysis is very fast and accurate (1-2% error).
In AAS, the sample, which is dissolved in water, is sprayed into a flame via a nebulizer. When a sample containing metals is heated to 1700-2400°C in this flame, a portion of the atoms are in the gaseous state and some become ionized. The water simply evaporates. Atomic absorption spectroscopy utilizes the fact that atoms or ions in the hot gaseous state are able to absorb light at very narrow, specific and characteristic wavelengths.
The source used to produce the light in this instrument is called a hollow-cathode lamp. The hollow-cathode lamp works because excited argon cations bombard the cathode, which is a piece of metal such as copper, iron or zinc. Some atoms from the metal cathode are vaporized and emit light of the same wavelength that is absorbed by the metal atoms in the flame. Because each element emits and absorbs different wavelengths of light, this technique can differentiate between the elements.
The detector in this instrument measures the amount of light that passes through the sample in the flame. If the sample had a large amount of a metal in it, more of the light emitted by the hollow-cathode tube will be absorbed and less of the light will pass through the sample and into the detector. In a sample with a low concentration of sample, more of the light will pass through the sample. The light that passes through the sample is captured and detected by a photo-multiplier tube.
The photo-multiplier tube basically contains a material that is photosensitive, meaning that when it is struck by light it emits electrons. These electrons create a current that is proportional to the original light intensity and this information is reported as absorbance -A. Absorbance is calculated by the instrument from the following relationship:
A= log (P/P0)
where P0 is the amount of light that enters the sample and P is the amount of light that exits the sample. From the equation, it is apparent that the more light that exits the sample, the smaller the resulting absorbance value.
Beer’s law can be used to relate the absorbance to the concentration of the metal in the sample:
A = ϵbc

Where ϵ is a constant, b is the path length or depth of the sample (10 cm in most AAS methods) and c is the concentration in units such as μg/mL.
If a series of standards with known concentrations is analyzed and absorbance values determined, then this information can be graphed to produce a line called a calibration curve. The calibration curve can then be used to determine the concentration of any sample solution based on the absorbance of that solution, as long as the solution’s absorbance value is within the range of the calibration curve.
Procedure
Part 1- Soil Sample Preparation
Complete the following procedure for each of your team’s soil samples. It is very important to use only ultra-pure DI water for this procedure. This water is in a large, labeled container by the sink. To avoid contamination, remember to rinse all glassware before using it for another part of the procedure.
Solving this crime is a lot of work, so all of the teams will have to work together. Each team will be assigned a soil sample from the fire site, samples recovered from the suspects and soil from uncontaminated sites as shown in the following table. We will then compare data to determine which, if any, suspect may have unintentionally taken soil from arson site. Be sure to carefully label everything as you will be working with multiple samples.
Soil Sample Sample Description TeamsFire site Soils recovered from arson
site1,2,3,4,5
Suspect #1 Soil recovered from shoes 1,2Suspect #2 Soil recovered from car floor
mat2,3
Suspect #3 Soil recovered from home entry
3,4
Suspect #4 Soil recovered from shoes 4,5Suspect #5 Soil recovered from car floor
mat1,5
Blank #1 Uncontaminated site # 1 1,2,3Blank #2 Uncontaminated site # 2 4,5
1. Complete this procedure for each soil sample. Weigh out about 5.0 grams of soil and place it into an Erlenmeyer flask. Record the exact mass in your notebook. Add a mechanical stir bar and 25 mL of extracting solution (0.05 M HCl + 0.05 M H2SO4). Stir using a mechanical stirrer for 15 minutes.
2. Obtain and rinse a 50 mL volumetric flask with a small amount of extracting solution (0.05 M HCl + 0.05 M H2SO4).
3. After stirring for 15 minutes, vacuum filter the solution through a #42 Whatman filter paper into a side armed Erlenmeyer flask. Wash all of the metals off the sand by pouring 5 mL of extracting solution through the sand. Pour the filtrate (liquid solution) into a 50 mL volumetric flask. Use more of the extracting solution to fill the volumetric flask to the line marked on the container. Then place the top on the flask. Place your thumb over the stopper (top) to hold it in place as you invert the flask 15-20 times to thoroughly mix the contents. Always mix volumetric flasks in this way. Pour the solutions into labeled beakers or Erlenmeyer flasks.

Part 2- Standard Preparation
When carrying out this analysis, we will want to know how much of each element is present in the soils. To do this we will prepare standards and develop what is called a calibration curve. A calibration curve will be a plot of the standard concentrations vs. the signal from the instrument. Because the relationship between signal and concentration is proportional, once we measure the signal produced from the unknown soil, we will be able to calculate the original concentration in the soil.
Each group will prepare the following standards that will contain copper, iron and zinc:
Standard Copper (Cu)Concentration
(μg/mL)
Iron (Fe)Concentration
(μg/mL)
Zinc (Zn)Concentration
(μg/mL)#1 0.0 0.0 0.0#2 0.5 0.5 0.5#3 1.0 1.0 1.0#4 2.0 2.0 2.0#5 5.0 5.0 5.0
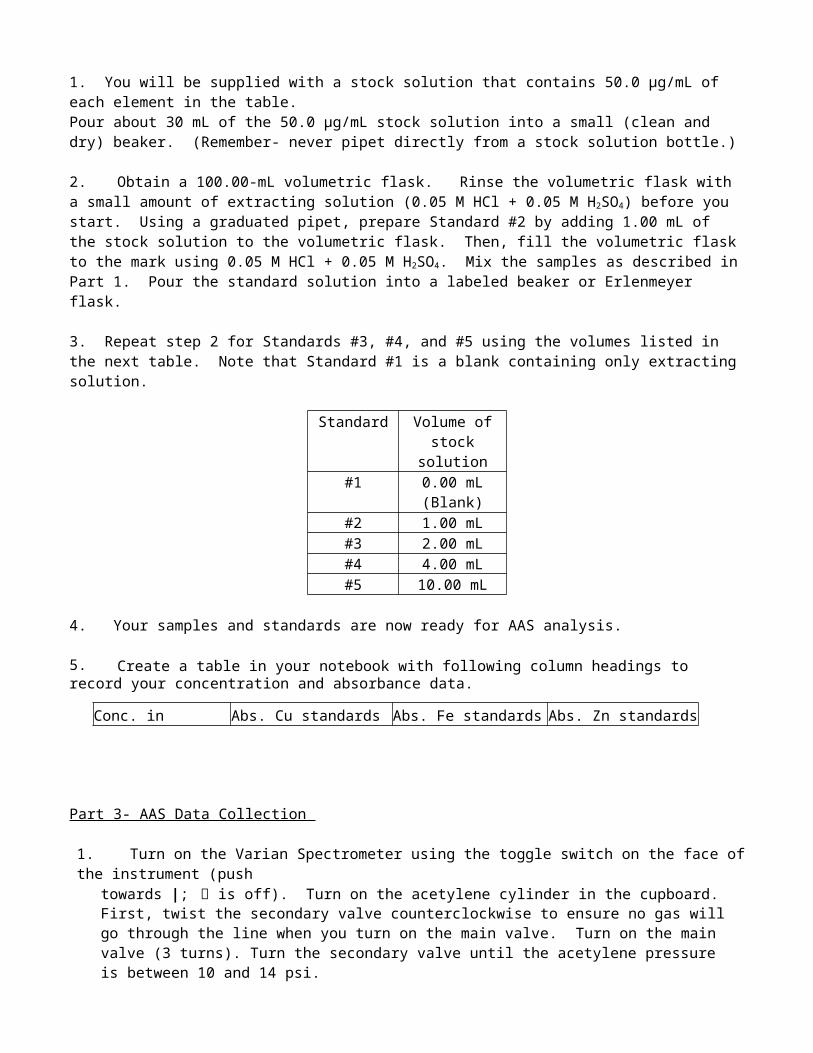
1. You will be supplied with a stock solution that contains 50.0 μg/mL of each element in the table.Pour about 30 mL of the 50.0 µg/mL stock solution into a small (clean and dry) beaker. (Remember- never pipet directly from a stock solution bottle.)
2. Obtain a 100.00-mL volumetric flask. Rinse the volumetric flask with a small amount of extracting solution (0.05 M HCl + 0.05 M H2SO4) before you start. Using a graduated pipet, prepare Standard #2 by adding 1.00 mL of the stock solution to the volumetric flask. Then, fill the volumetric flask to the mark using 0.05 M HCl + 0.05 M H2SO4. Mix the samples as described in Part 1. Pour the standard solution into a labeled beaker or Erlenmeyer flask.
3. Repeat step 2 for Standards #3, #4, and #5 using the volumes listed in the next table. Note that Standard #1 is a blank containing only extracting solution.
Standard Volume of stock solution
#1 0.00 mL (Blank)#2 1.00 mL#3 2.00 mL#4 4.00 mL#5 10.00 mL
4. Your samples and standards are now ready for AAS analysis.
5. Create a table in your notebook with following column headings to record your concentration and absorbance data.
Conc. in (μg/mL) Abs. Cu standards Abs. Fe standards Abs. Zn standards

Part 3- AAS Data Collection
1. Turn on the Varian Spectrometer using the toggle switch on the face of the instrument (pushtowards |; is off). Turn on the acetylene cylinder in the cupboard. First, twist the secondary valve counterclockwise to ensure no gas will go through the line when you turn on the main valve. Turn on the main valve (3 turns). Turn the secondary valve until the acetylene pressure is between 10 and 14 psi.
2. Turn on the air valve on the back wall. Adjust the pressure between 35-55 psi.
3. Select "Cookbook" using the up and down arrows on the keypad and then press "ENTER". Choose the metal group containing your metal and press "ENTER". Select from the list the metal you desire to analyze then press "ENTER". Modify "Instrument Parameters" as needed – set the Instrument Mode to absorbance, set the Active Lamp to 1, set the Active Current to 12, and leave all other parameters as their displayed values.
4. Press "OPTIONS" on the keypad, select "Measurement mode" then press "ENTER" , select "Integration" then press "ENTER". (Selecting "Integration" allows you to take multiple runs per sample). Press "Measurement Params" on the keypad and set the instrument to "Read time = 3" seconds and "Replicates = 3". Leave all other parameters as they are.
5. Press "OPTIMIZE" on the keypad, wait until the next screen, select "HC Lamp" then press "ENTER".Adjust the lamp to optimize the signal (This should be fine unless the lamp was recently replaced. But if necessary, place the business card in the path of the beam and adjust the beam until it strikes the card in the crosshairs).
6. Fill the water trap under the burner with purified DI water and make sure the water runs through the tube to the waste container below the instrument. Next, press the ‘red’ button on the top left and then hold down the ‘black’ button to light the flame (No sample aspiration is necessary to start the flame).
7. Select "Signal" on the screen display. Place the white aspiration tube in the blank sample (Standard #1) and allow the instrument to aspirate. Press the "ALT" then "READ" keys to zero the instrument. Read and record the absorbance value.
8. Aspirate the other standards. The appropriate way to do this is to measure from the least to the most concentrated standard, since this minimizes error due to incomplete flushing of the previous standard from the system. Read and record the absorbance value for each standard solution in the data/observations table below. Before switching to the next solution, w i pe d o w n ward on the aspiration tube with KimWipe paper. This minimizes the chances of getting solid particles into the tube and clogging it.
9. Aspirate the soil sample you would like to analyze and press "READ". Record the absorbance value for each solution.
10. For each d i f ferent metal solution to be analyzed press "LOAD METHOD" on the keypad and then repeat steps 3 - 9.
11. After completing your experiments, aspirate water for 30 seconds, then air for 30 seconds, then press the red button on the front left of the instrument to shut off the flame.
12. Turn off the gases (air and acetylene at the valves) and the instrument.

Part 4- Data Analysis and Reflection
1. Using Excel, create a calibration curve by plotting concentration (x-axis) vs. absorbance (y-axis) for each metal. Use the software to draw a best fit straight line through each set of data points. These are your calibration curves.
2. Use the graph to determine the concentrations of the different metals in the soil samples solutions. Before making comparisons between the different soil samples, you should divide the concentration of the metals by the mass of the soil sample used. Why is this important?
3. Place your answers in the spreadsheet displayed on the screen to compare with other groups. Also fill in the same spreadsheet on the next page.
4. Do either of your team’s suspects have a good match? Compare your data with that of the other teams. Does another team have a good match? Who has the best match?
5. How does the soil from the factory compare to the uncontaminated soil? Is the difference large enough that you can say that a suspect(s) was at the factory site?
6. Write a conclusion about today’s work for your poster. If there is a suspect(s) include the supporting evidence and discuss why you selected this particular person(s) as the suspect(s).
Fire Site ((μg/mL)/g)Metal Team # 1 Team # 2 Team # 3 Team # 4 Team # 5CuFeZn
Suspect Evidence ((μg/mL)/g)Suspect 1 Suspect 2 Suspect 3 Suspect 4 Suspect 5
Team 1 2 2 3 3 4 4 5 1 5CuFeZn
Blank 1 ((μg/mL)/g) Blank 2 ((μg/mL)/g)Team 1 2 3 4 4CuFeZn
AVERAGES ((μg/mL)/g)Fire Site Suspect 1 Suspect 2 Suspect 3 Suspect 4 Suspect 5 Blank 1 Blank 2
CuFeZn
Accelerant Analysis by Gas Chromatography-Mass Spectrometry
We now continue our analysis of evidence from the suspected arson fire at a local college. The Sheriff’s Department has supplied a wood sample that was collected from some wood shelving in the laboratory stockroom. The investigators believe that the wood contains accelerants that were used to start the fire, but they must rule out the possibility that flammable solvents normally found caused the fire. Further, several nearly empty cans of potential accelerants were found in the automobiles and homes of the potential suspects. These accelerants included lighter fluid, camp fuel, paint thinner, gasoline, and paint remover. It is possible that these were used as accelerants, either individually or in combination. The Sheriff’s Office is asking that your team determine the type of accelerant (s) used to start this fire.
Arson and Accelerants
Accelerants are used to quickly spread a fire and combust items such as rags, paper, or wood. Typically arsonists use liquid household chemicals that contain organic compounds, which are often called petrochemicals, as accelerants. Accelerants are mixtures of many organic compounds. The petrochemical accelerant is poured where the arsonist wants to start the fire. The liquid itself does not burn, only a thin layer of vapor composed of light hydrocarbons is ignited. Thus, the liquid accelerant pools in low spots on the floor and is absorbed into wood or carpet. Therefore, traces of the accelerant can often be detected in lightly charred materials and identified after the fire.
In this project you will need to separate and identify organic compounds in the accelerant that did not burn using a method called gas chromatography-mass spectrometry (GC-MS). The GC-MS instrument is an important tool for the forensic chemist as this instrument can both separate mixtures and greatly narrow down the identity of the potential components of the mixture.
GC/MS-Overview
In the technique of GC-MS, the liquid sample is injected into the instrument where it is volatilized (converted into the gas phase) into a mixture of gases that separate by boiling point as they pass through a long GC column. Then, the mass spectrometer fragments the compounds, and separates the fragments based on their mass-to-charge (m/z) ratio. The molecules can be identified by the patterns of the fragments.
Headspace Analysis
Headspace analysis is the analysis of the vapors that are emitted from a sample. The GC is ideally suited for this type of analysis because one of the primary requirements for GC analysis is that the analytes of interest must be volatile. A headspace sample is normally prepared in a sealed, partially filled vial containing the sample. Once the vial is sealed, the volatile components diffuse into the gas phase until the headspace/original sample has reached a state of equilibrium. A sample of the gas from the headspace is injected into the GC using a syringe.
Separation of Volatile Compounds
The column is where sample components are separated. Chromatography requires a mobile phaseand a stationary phase. In gas chromatography, the mobile phase includes an inert gas such as helium, while the stationary phase is a liquid fused to the inner wall of a thin tube of fused silica. This tube is called a column and it is often 25-50 meters long, so it is wrapped in a coil to save space. The flowing mobile phase carries the sample through the column while the stationary or non-moving phase interacts with the sample, slowing its flow. A component of the mixture that interacts strongly with the stationary phase (often due to a higher boiling point)

will take a long time to move through the column. If each component of a mixture interacts to a different degree with the stationary phase, then the components will separate.
The GC Oven
A major component of the GC is a programmable oven that is designed to heat the GC column. The optimum column temperature is dependent upon the boiling point of the sample. As a rule of thumb, a temperature slightly above the average boiling point of the sample components is a good starting point. If a sample has a wide boiling range, then temperature programming can be useful.
Temperature programming is a process where the column temperature is increased (either continuously or in steps) as separation proceeds. This method is useful when the components of the mixture to be separated have a large difference in boiling point. The oven temperature is kept low early in the analysis so that the components with low boiling points can elute (move off of the column), then the temperature is increased to push the components with higher boiling points off the column.
Ionizer
Upon exiting the GC column, the now-separated mixture components enter the mass spectrometer (MS). The MS analyzer requires the mixture components to carry a positive charge, so upon exiting the GC the molecules are bombarded by a high-energy electron beam. When the molecule interacts with the electron beam, an electron in the molecule is knocked loose, thus the molecule now carries a positive charge and is called a radical cation. A charged molecule which remains intact is called a molecular ion (M+.) and has the same molar mass as the original neutral molecule. Knowing the molar mass can be a great help, along with other data, in identifying a compound.
Further, energy transferred by the electron impact leads to instability in a positively charged molecular ion, and can cause that ion to break into smaller pieces (fragments). The fragments occur in a predictable way and the patterns they produce can further aid in identifying a molecule.
Detectors
There are many types of detectors, but most work by producing an electronic signal when struck by a cation. Timing mechanisms, which integrate those signals with the scanning voltages, allow the instrument to report the mass/charge ratio (m/z) of the charged particle or ion that strikes the detector. The mass analyzer sorts the ions according to m/z, and the detector records the abundance of each m/z.
Chromatogram
A chromatogram is the data output of the GC-MS. If the components have separated, then eachpeak on the chromatogram has resulted from a different component of the mixture. The time the component spent in the instrument is plotted on the x-axis while the area of each peak (y-axis) relates to the amount of each substance in the mixture- a larger peak means that there is more of that component in the mixture.

Procedure
First, each team will be analyzing one wood sample from the crime scene prepared for analysis at one of 6 temperatures and GC oven conditions (see the table below-columns 1 and 2). The wood evidence must be analyzed in many ways so that we can determine the optimum conditions for our analysis. After you have collected your GC-MS data from the wood evidence, you will share and discuss your data with other groups. As a group, we will select the conditions believed to work best and we will all use these conditions to analyze the control samples. Then you will prepare a control sample and analyze it by GC-MS. Again, be sure to take good notes for your poster presentation and your report to the Sheriff’s Department.
Team # Wood From Arson Scene Wood Control
1 prep. at 40°C;column temp profile 2
paint remover (PR)
2 prep. at 70°C;column temp profile 2
camp fuel (CF)
3 prep. at 100°Ccolumn temp profile 2
paint thinner (PT)
4 prep. at 70°C;column temp profile 1
lighter fluid (LF)
5 prep. at 100°Ccolumn temp profile 1
gasoline (GS)
Part 1- Arson Wood Sample Preparation
1. Carefully select and cut a small piece (about 1.0 gram) of burned wood from the crime scene sample. Cut the piece of wood into pieces small enough to fit in a small test tube. Place the wood pieces in the test tube using tweezers, and seal the test tube with a rubber septum.
2. Teams 3 and 5 will prepare a hot water bath by placing a 250-mL beaker of DI water on a hot plate and heating the water to 100° C. Clamp the test tube so that it is immersed in the heated water.
3. Teams 1, 2, and 4 will use programmable water baths. It is important to keep the temperature as close to the assigned temperature as possible. Keep the sample in this configuration until it is your team’s turn to use the GC-MS, but no less than 15 minutes.
4. Proceed to Part 2, using the column temperature profile assigned to your team.
Part 2-GC-MS Analysis
1. When it is your team's turn to use the GC-MS, obtain a 250 μL syringe and pump it several times to evacuate all vapors from the syringe. Insert the syringe needle in your warm test tube through the rubber septum (make sure you do not bend the needle--syringes are expensive!!). Take a 150 μL headspace sample of the gas and while holding the syringe with the needle pointing upward, go with your instructor to the instrument room (room 518)

2. Log on to the GC-MS computer: username: GRCC password: sweetbaby
3. Double click on the desktop shortcut icon "Sweet Baby".
4. Methods have been created for you. Sele c t t h e o n e w ith t h e tem p e r at ur e pr o f i le a s s i gn ed to y o u r team (…Prof1 = profile 1 & …Prof2 = profile 2). From the top menu, select "Method” “Load Method” then either "AccelsProf1.M" o r "AccelsProf2.M" "OK". Proceed to step 5.
[This is how the method file AccelsProf_.M was developed: Click on “Method” then “Edit Entire Method”. A dialog box called “Edit Method” will come up.
Select all 3 boxes & click “OK.” When the "Inlet and Injection Parameters" dialog box opens select "GC" for Sample Inlet and
"Manual" for Injection Source then click OK". The “GC Edit Parameters” dialog box will appear next. Click on the various icons and input the
following values:o Inlets: Injector temperature = 250ºCo split ratio 20:1o Columns : Flow 1 mL/mino Ovens:o Profile #1: 50 °C hold for 2 min, then to 80°C at 12 °C/min, then too 150°C at 10 ° C/min and hold for 1 min.o Profile #2: 50 °C hold for 2 min, then to 110° at 60 °C/min, then too 150°C at 10 ° C/min and hold for 1 min.
o Select "Apply" then click "OK" Next 2 dialog boxes, click “OK.” Dialog box “MS SIM/Scan Parameters” opens. Input the following values:
Solvent delay: 0 Minute Click “Scan Parameters” button
o Starting Mass: 35.00amuo End Mass: 350.00amuo Click “Close”o Click “OK.”
Dialog box “Select Reports”o Ensure that NO boxes are selectedo Click "OK"
Type “AccelsProf_.M” in the Method File field (".M" tells the program this is a method file) thenclick “OK.” You are DONE with the method and ready to run it with your sample! ]
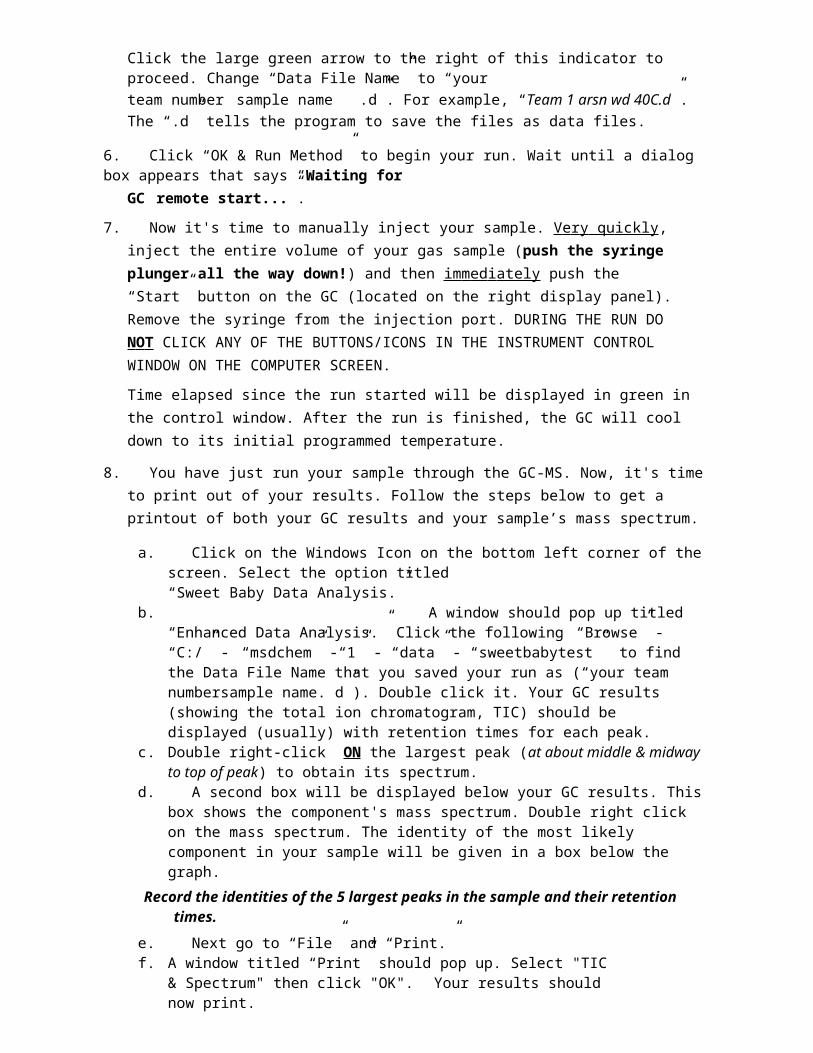
5. If no other sample is being analyzed, the top left hand corner should show a green “Idle" indicator.Click the large green arrow to the right of this indicator to proceed. Change “Data File Name” to “yourteam number sample name .d”. For example, “Team 1 arsn wd 40C.d”. The “.d” tells the program to save the files as data files.
6. Click “OK & Run Method” to begin your run. Wait until a dialog box appears that says “Waiting forGC remote start...”.
7. Now it's time to manually inject your sample. V e r y qu ickly , inject the entire volume of your gas sample (push the syringe plunger all the way down!) and then im m ed i ately push the “Start” button on the GC (located on the right display panel). Remove the syringe from the injection port. DURING THE RUN DO N O T CLICK ANY OF THE BUTTONS/ICONS IN THE INSTRUMENT CONTROL WINDOW ON THE COMPUTER SCREEN.
Time elapsed since the run started will be displayed in green in the control window. After the run is finished, the GC will cool down to its initial programmed temperature.
8. You have just run your sample through the GC-MS. Now, it's time to print out of your results. Follow the steps below to get a printout of both your GC results and your sample’s mass spectrum.
a. Click on the Windows Icon on the bottom left corner of the screen. Select the option titled“Sweet Baby Data Analysis.”
b. A window should pop up titled “Enhanced Data Analysis.” Click the following “Browse” - “C:/” - “msdchem” -“1” - “data” - “sweetbabytest” to find the Data File Name that you saved your run as (“your team numbersample name. d”). Double click it. Your GC results (showing the total ion chromatogram, TIC) should be displayed (usually) with retention times for each peak.
c. Double right-click ON the largest peak (at about middle & midway to top of peak) to obtain its spectrum.
d. A second box will be displayed below your GC results. This box shows the component's mass spectrum. Double right click on the mass spectrum. The identity of the most likely component in your sample will be given in a box below the graph.
Record the identities of the 5 largest peaks in the sample and their retention times.
e. Next go to “File” and “Print.”f. A window titled “Print” should pop up. Select "TIC & Spectrum" then click
"OK". Your results should now print.
9. Close out the “Enhanced Data Analysis” window when you are finished.
10. Label your data with the water bath temperature and GC oven profile. Return to the lab space and share your chromatograms with the other groups.
11. Place all the chromatograms on the bench top next to each other. Review and discuss with your classmates (and instructor) which sample prep. conditions and GC oven-temperature profile give the best results [i.e., best intensity (heights of the peaks) and best peak resolution (separation of peaks]. These are the conditions that you will use to prepare and run your control sample next week. You will determine which accelerant was used in the arson based on comparison to your previously a n a l y z e d arson wood sample.
Part 3- Control Sample Preparation
Your team will now need to prepare a sample of your assigned accelerant that closely matches the sample from the fire scene. You will have wood, the accelerants, a watch glass, a crystallizing dish, a lighter, tweezers, test tubes, stoppers and all of the equipment in the drawers to accomplish this task. You must discuss your team’s procedure with an instructor before you start. Remember all excess accelerants should be disposed of in the waste bottle, not down the drain. DO NOT START ANY FIRES OUTSIDE OF THE HOOD! Keep in mind the temperature and GC-MS conditions determined earlier in this experiment. When you collect you GC-MS data, be sure to note the identity of the five largest peaks.

Part 4- Reflections and Conclusions- Answer the following questions in your notebook and think about what from this analysis should go on your team’s poster.
1. What sample preparation temperature ( 40°C, 70°C, 100°C) did you use to prepare your control samples with the known accelerants, and why?
2. What impact did the sample preparation temperature have on the chromatographic results? Why?
3. Why was it necessary to cover each test tube with a rubber septum?
4. Assume you have a compound with low vapor pressure (meaning it does not evaporate readily) and a compound with high vapor pressure (evaporates readily) in your sample. How would those two compounds behave as you heat them to the same temperature?
5. What part of the crime scene wood sample did you pick to analyze: completely burned or partially burned? Explain why.
6. Why was it important to ignite the control sample before analysis?
7. What GC-MS temperature program (Profile 1 or 2) did you use to analyze your control samples, and why?
8. List 5 compounds that you identified in the wood sample from the arson site you analyzed today. List 5 compounds that you identified in the accelerant that you believe is the same as the accelerant used in this fire and then collect and share data from other groups to complete the table below
Five Most Abundant Chemicals in Common Fire AccelerantsBest Run of Fire Site
Paint Remover (PR)
Camp Fuel (CF)
Lighter Fluid (LF)
Gasoline (GS)
Paint Thinner (PT)
9. Perform an online search for Material Safety Data Sheets (MSDS) to find out what compounds are in the following common accelerants: lighter fluid, camp fuel, paint thinner, gasoline, and paint remover. List in a table the most prevalent compounds (up to five) in each. Are these the same compounds you discovered using the GC-MS?
10. Why do some molecules move through the column faster than others?

11. After consulting with the other groups, which accelerant do you believe started this fire? Why?
12. The Sheriff’s Department supplied you with the following information about several suspects in the case:Suspect # Evidence1 After a search of the suspect’s garage , the following accelerants were found: paint
thinner (unopened), paint remover (1 L bottle, half empty), camp fuel (2 L unopened)2 After a search of the suspect’s garbage , the following accelerants were found: lighter
fluid (1-L bottle, nearly empty), gasoline (5 gallon container, 2.5 L remain), paint thinner (5 gal. nearly empty)
3 After a search of the suspect’s automobile, the following accelerants were found: (gasoline 3 gal. container, nearly empty). After a search of the suspect’s garage , the following accelerants were found: gasoline (5 gallon container, nearly empty)
4 After a search of the suspect’s RV , the following accelerants were found: lighter fluid (1 L nearly empty), camp fuel (5 L -2.5 L remain)
5 After a search of the suspect’s garbage , the following accelerants were found: paint thinner (3L nearly empty), camp fuel (4 L nearly empty), gasoline (1 gallon container, nearly full)
a) After seeing this evidence, what can you conclude about each suspect’s involvement in the arson?
b) Do you have enough evidence to accuse any suspect of this crime?
13. Write a conclusion about today’s work for your poster presentation.

Ink Analysis by Paper Chromatography and Visible Spectroscopy
Enclosed is a hand written note that appears to be a grocery list. This note was found at the scene of the arson crime that your team is investigating. The note is believed to be significant because it was found in the hallway near the stockroom and may have fallen out of the arsonist’s pocket. The Sheriff’s Department would like to know the brand of ink used to write the note as they feel that this evidence could be used to narrow down the suspects. Several pens have been recovered from the suspects’ homes that can be used for comparison.
Ink and Visible Spectroscopy
Inks can be a viscous liquids or pastes that can be used to color the surface of paper. They can be can be very complex and are often composed of multiple pigments or dyes and many other materials that influence properties such as flow, the rate of drying, and appearance when dry. An obvious characteristic of an ink is the colors that are reflected from a surface due to the dyes and pigments that make up the ink. Our eyes see the colors that are reflected from the surface. So in a way, the eye is working as an instrument that detects color. The analysis of color can also be done by a spectrometer that can analyze the light as it passes through a liquid solution.
Our eye detects natural or white light as one color, but it is actually composed of a broad range of radiation wavelengths in the ultraviolet (UV), visible and infrared (IR) portions of the spectrum. As you have probably observed, the individual colors of the visible portion can be separated by passing sunlight through a prism, which separates the colors based on their different wavelengths. Electromagnetic radiation like visible light is often treated as a wave phenomenon and is characterized by wavelength, which is the distance between adjacent peaks and may be measured in units of nanometers. Visible wavelengths range from about 400 to 800 nm. The specific colors associated with each wavelength are listed below.
Color Wavelength (nm)Violet 400-420Indigo 420-440Blue 440-490Green 490-570Yellow 570-585Orange 585-620Red 620-780
In the presence of white light, a colored substance will absorb some of the wavelengths and will allow other wavelengths to reflect or pass through. The colors that are observed are the complimentary to the wavelengths absorbed. This relationship is demonstrated by the color wheel shown below. In the color wheel, complementary colors are diametrically opposite each other. So, when the sample absorbs wavelengths of 420-430 nm the sample appears yellow, and absorption of 500-520 nm light means that the sample will appear red.

Visible spectroscopy is a technique that can be used to investigate colored materials. It is a technique that generates a graph of wavelengths absorbed by a sample in units of nm versus absorbance, which is related to the amount of light absorbed (sample below). This type of analysis can be used to detect subtle differences in colors that cannot be detected with the eye and we will use this technique to analyze the ink in the pens. In this type of instrument, the source is a lamp that produces range wavelengths of visible light. When the molecule absorbs the light, the number of photons reaching the detector is decreased, and this decrease is directly proportional to the concentration of molecules in this portion of the mixture.
Liquid Chromatography
Liquid chromatography can come in many different forms. It can be as simple as using a piece of paper as a stationary phase and an organic solvent as the mobile phase or can be very complex with a fully- automated pumping system that forces a liquid mobile phase though a narrow column that is packed with a solid or liquid-coated solid stationary phase. No matter the configuration, the goal is to separate complex mixtures into their individual components. In this investigation we will use simple paper chromatography to separate the components of the ink from different pens and then conduct further analysis of the inks by visible spectroscopy.
Paper Chromatography
Paper chromatography is a solid-liquid form of chromatography, in which the stationary phase is porous paper. The samples are spotted on one end of the sheet of paper which is then suspended in the mobile phase. The mobile phase is drawn through the paper by capillary action and the molecules move back and forth between the mobile and stationary phase. If the molecule is more attracted to the paper, it moves more slowly up the paper, and if it is more attracted to the mobile phase it moves more quickly up the paper and hence the components separate due to the different migration rates. Different inks and dyes, depending on their molecular structures and interactions with the paper and mobile phase, will adhere to the paper more or less than the other compounds, allowing a quick and efficient separation.

In this part of your investigation, you will be using a paper solid phase and a combination of solvents as the mobile phase. You will need to find the appropriate mobile phase to obtain the best separation of the ink components with the least amount of broadening of the spots. The solvents that will be available to you are: water, acetone, ethanol, ethyl acetate, and hexane. The general directions for paper chromatography follow:
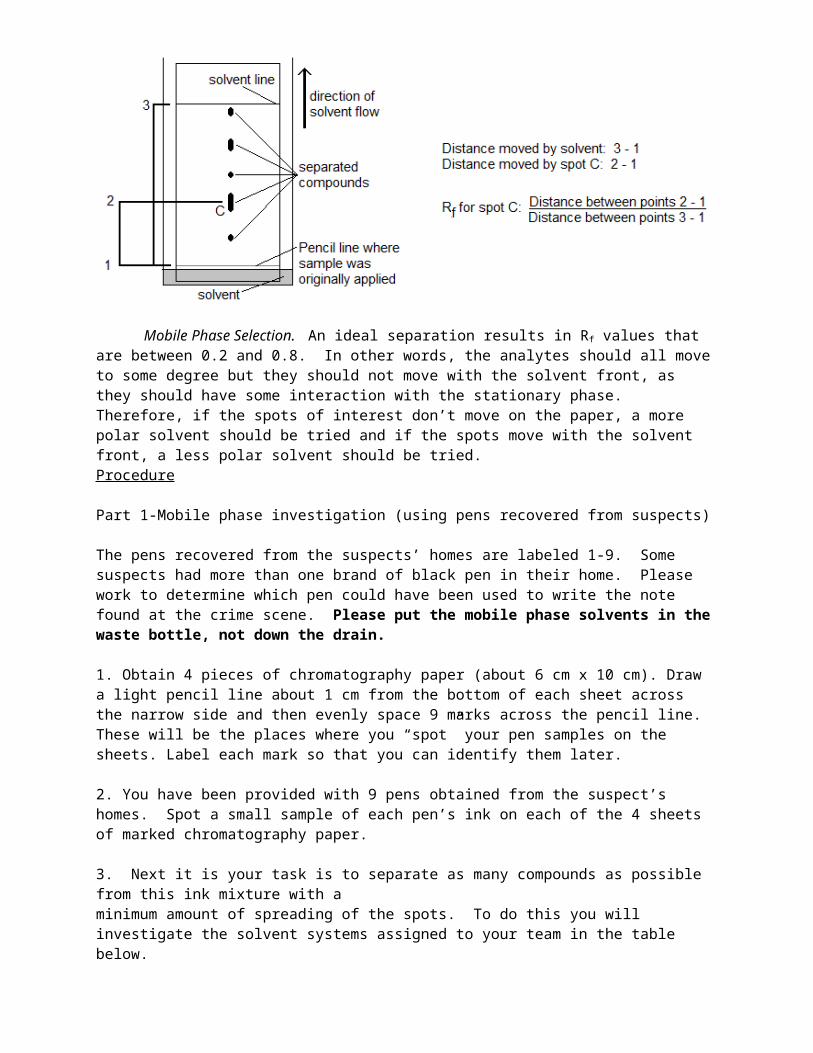
Spotting. In paper chromatography, the samples are applied to the paper using a spotter. The spots must be placed so that they are not covered with solvent when the paper is placed in the developing chamber. The samples (which are dissolved in a volatile solvent) should be spotted on a pencil line that is about 1 cm from the bottom edge of the paper. In order to achieve good resolution after separation, it is important that the spot be less than 2 mm in diameter. Small spots are achieved by briefly touching the capillary tube to the plate. Allow the spot to dry completely, then spot a second and third time, taking care to keep the spot as small as possible.
Plate Development. After the samples have been applied, the chromatography paper is placed sample side down in a developing chamber (usually a beaker or jar with a cover) that contains a shallow layer of solvent (mobile phase) and a piece of filter paper. The filter paper is added to help distribute the solvent to the vapor phase and prevent solvent evaporation as it travels up the plate. The solvent moves up the plate by capillary action. When the solvent is about 0.5 cm from the top of the plate, or when it seems to find a stopping point, remove the paper from the chamber and immediately mark the solvent line with a pencil.
Visualization. In this analysis, the analytes (ink components) are colored and are readily visible on the chromatography paper. UV lamps can also be used to observe paper chromatography spots that are not apparent by normal visual observation.
Rf Calculations. Once the spots have been located, the Rf values should be calculated and reported in your notebook.
Rf = distance traveled by analyte/ distance traveled by solventThe Rf value is a unitless value (so it doesn’t matter if the distance is measured in inches, mm, cm etc.) that is always between the values of 0 and 1. Further, it is characteristic of the analyte in that particular solvent and is used to help identify the components of a mixture.
Mobile Phase Selection. An ideal separation results in Rf values that are between 0.2 and 0.8. In other words, the analytes should all move to some degree but they should not move with the solvent front, as they should have some interaction with the stationary phase. Therefore, if the spots of interest
don’t move on the paper, a more polar solvent should be tried and if the spots move with the solvent front, a less polar solvent should be tried. Procedure
Part 1-Mobile phase investigation (using pens recovered from suspects)
The pens recovered from the suspects’ homes are labeled 1-9. Some suspects had more than one brand of black pen in their home. Please work to determine which pen could have been used to write the note found at the crime scene. Please put the mobile phase solvents in the waste bottle, not down the drain.
1. Obtain 4 pieces of chromatography paper (about 6 cm x 10 cm). Draw a light pencil line about 1 cm from the bottom of each sheet across the narrow side and then evenly space 9 marks across the pencil line. These will be the places where you “spot” your pen samples on the sheets. Label each mark so that you can identify them later.
2. You have been provided with 9 pens obtained from the suspect’s homes. Spot a small sample of each pen’s ink on each of the 4 sheets of marked chromatography paper.
3. Next it is your task is to separate as many compounds as possible from this ink mixture with aminimum amount of spreading of the spots. To do this you will investigate the solvent systems assigned to your team in the table below.
4. For each solvent mixture you are testing (4 per team, see below), add enough mobile phase to the bottom of a beaker so that the solvent is about 0.5 cm in depth (about 10 mL in a 400 mL beaker).
Team 140% Acetone/60% Water40% Ethanol/60% Water
30% Hexane/70% Ethyl Acetate100% Ethyl Acetate
Team 250% Acetone/50% Water50% Ethanol/50% Water
50% Hexane/50% Ethyl Acetate100% Water
Team 360% Acetone/40% Water60% Ethanol/40% Water
60% Hexane/40% Ethyl Acetate100% Acetone
Team 470% Acetone/30% Water70% Ethanol/30% Water
70% Hexane/30% Ethyl Acetate100% Ethanol
Team 580% Acetone/20% Water80% Ethanol/20% Water
80% Hexane/20% Ethyl Acetate100% Hexane
5. Place a spotted chromatography sheet (spotted side at the bottom of the beaker) along the side of each beaker to touch the mobile phase evenly. Use aluminum foil to cover each beaker. Allow the solvents to travel up each sheet until they have traveled approximately 4/5 of the way to the top. Refer to the figure in the discussion to see the setup.
6. Remove the sheets carefully and immediately draw a thin pencil line at the “solvent front” (the line which defines how far the solvent has traveled). Label the very top of the sheets with the solvent mixture used (e.g., “80% Ethanol/20% Water”). Allow the chromatograms to dry completely.
7. The ink components present in the sample should appear as one or more elongated colored spots.Mark the approximate center of each spot with a pencil.
8. Calculate Rf values for each spot according to the directions. Record the Rf values and colors for each spot in your notebook. You might want to draw a sketch of the chromatography paper in your notebook. 9. Turn in your chromatogram that was developed on paper to your instructor so that they can be shared with the group. Look over all of the paper chromatograms from the different teams to determine which gave the best separation of the dyes in the inks. Make notes and sketches in your notebook.
Part 2 –Analysis of ink recovered from the suspected arson scene
Your team will be given a portion of the grocery list found at the crime scene. Please try to determine which of the pens could have been used to write this note.
1. First the ink must be dissolved off of the paper note. The note from the crime scene should be cut into small pieces, placed in a small vial, and soaked in about 1 mL solvent. You may need to try several different solvents. You should dissolve enough ink so that the solution should be visibly colored. Save this solution(s) for later analysis by visible spectroscopy.
2. Complete paper chromatography analysis using the ink from the crime scene note and the pens. Prepare one piece of chromatography paper as described in Part 1. Using a capillary tube, place a small spot of the crime scene ink sample solution on the pencil line. Allow the ink/solvent spot to dry. Repeat this process until the spot is clearly visible. The method is very sensitive, and large spots may lead to inaccurate results. Allow the sheets to dry. Then spot the ink from each of the pens all on the same piece of chromatography paper.
3. Complete the chromatographic separation using the mobile phase that you determined to be the best for the ink pens (based on all of the teams’ results). Calculate and record the R f values and colors for each spot on your worksheet. Which pen or pens is the best match to the ink found at the suspected arson site? Part 3- Analysis of Ink Samples by Visible Spectroscopy
Choose the ink pens that your group believes are the three (or four) best matches to the ink found at the crime scene. Knowing that you need to prepare a dilute colored solution for analysis by visible spectroscopy, think about how you might prepare samples of these inks. You may want to try several different ways to prepare the sample. Discuss your procedure with an instructor before proceeding. The instrument for this analysis is very simple to operate and the directions can be found with the instrument.
Create a table with headers like the one below in your notebook. Complete the table as you carry out your analysis.
Pen # Solvent Color Observed
λmax
(wavelength(s) with greatest absorbance)
Colors Absorbed
Part 4-Observations with UV Lamp- After you have completed the analysis of the inks by UV-Vis analysis, use a UV lamp under long (366 nm) and short (254 nm) wavelengths and look at your chromatographic plates (paper) again. Use these additional observations to finalize your conclusion about the pen that was used to write the note. Why is it important to analyze the inks by a variety of methods?

Part 5-Reflections and Conclusions- Answer the following questions in your notebook and think about what from this analysis should go on your team’s poster.
1. In the ink analysis, how did modifying the composition of the mobile phase impact the chromatograms?
2. Based on paper chromatography and visible spectroscopy data, which ink pen best matched the ink at the crime scene?
3. What information was provided by visible spectroscopy data that was not apparent in the TLC data?
4. The Sheriff’s Department supplied you with the following information about several suspects in the case:
Suspect #
Evidence: Pens Found in Home
1 Pen # 1, 4, 6, 72 Pen # 2, 8, 93 Pen # 2,3, 6, 84 Pen # 1,3,5, 65 Pen # 2,4, 9
Based on the results of your analyses, will the police be able to narrow the list of suspects or arrestsomeone? Why or why not?
5. Based on all of the data that you have collected so far, which suspects are starting to appear guilty of this crime?
Analysis of Crime Scene DNA
The clues found at real life crime scenes aren’t always plainly visible. In fact, often the clues are microscopic. Clues from blood stains or hair can tell a lot about what really happened during a crime including arson. Many crimes today are solved by analyzing these items for DNA (deoxyribonucleic acid). Each person’s DNA has unique features, a microscopic and tell-tale fingerprint that can lead crime scene investigators to the right perpetrator even when there is seemingly no other visible evidence leading to that person.
The Sheriff’s Department has provided your team with several samples of DNA both from the crime scene and from the suspects. Your team will prepare agar gels for electrophoresis, prepare DNA samples from five different suspects plus a sample taken from the scene of the arson crime that your team is investigating, and analyze the five samples for exact matches to the crime scene DNA.
DNA Analysis
One of the most common analytical techniques used by forensic chemists is gel electrophoresis. This technique uses restriction enzymes to first snip up samples of DNA molecules taken from a crime scene into smaller pieces or fragments that are unique to an individual. These samples are then dyed with a special DNA stain and put into wells made in a gel-like substance called agar, and electrical current is passed through them, moving them through the gel. The result is a gel containing several striped bands of color that occur in a pattern specific to that person’s DNA sample, and this pattern can then be compared to a sample of DNA taken directly from the suspect. If the patterns found at the crime scene match the patterns found from that person’s DNA, the crime scene investigators may have their perpetrator.
Restriction Enzymes
Restriction Fragment Length Polymorphism (RFLP) has been used for DNA profiling for many years. A restriction enzyme acts like molecular scissors, making cuts at specific sequences of base pairs that it recognizes. In nature, these enzymes destroy DNA from invading viruses that infect and destroy bacteria. Bacterial restriction enzymes recognize very specific DNA sequences within the virus’ DNA and then cut the DNA at that site, damaging the virus so that it is no longer harmful. Restriction enzymes can be used to cut DNA isolated from any source.
These restriction enzymes are named for the bacteria from which they were isolated. For example, EcoRI was isolated from Escherichia coli. These enzymes work by sitting on a DNA molecule and sliding along the helix until it recognizes specific sequences of base pairs that signal the enzyme to stop sliding. The place is called a restriction site. The enzyme then cuts or chemically separates the DNA molecule at that site and then continues on looking for that same site again. There may be many of these sites in a DNA molecule and they can all be cut and multiple fragments will be produced. If there are two sites, three fragments will be produced.
The length of each fragment will depend upon the location of restriction sites on the DNA molecule. These fragments can be unique to different individuals. DNA that has been cut with restriction enzymes can be separated and observed using a process known as gel electrophoresis.
Agarose Gel Electrophoresis
The term electrophoresis means “to carry with electricity” and agarose gel electrophoresis separates DNA fragments by size. In this process, the DNA fragments that result from cutting with restriction enzymes are loaded into the wells of an agarose gel, which has been placed into a chamber filled with a conductive buffer solution. A direct current is passed between wire electrodes at each end of the

chamber and because DNA fragments are negatively charged, they will migrate toward the positive pole (anode). The agarose gel acts like a sieve through which smaller DNA fragments can move more quickly than larger ones. Therefore in a given time period, smaller DNA fragments will travel farther through the gel than larger ones producing bands that can be made visible through staining.
Reliability of DNA Evidence
Each person has similarities and differences in DNA sequences with other individuals. In humans there are thousands of RFLP loci or DNA segments that can be selected and used for DNA fingerprinting analysis. Depending on demographic factors such as ethnicity or geographic isolation, some segments will show more variation than others. In general, one can assume that any two humans are 99.9% identical in their DNA sequence. Thus, we will differ by only 0.1% or one in 1,000. Therefore, it is necessary to examine areas that differ to create a useful DNA fingerprint.
Some populations have less variation in particular DNA segments than others. This degree of variation affects the odds of more than one individual having the same sequence. If 90% of a given population has the same frequency in its DNA fingerprinting pattern for a certain DNA segment, then the information will be less useful. If the incidence of a DNA pattern for a particular segment in a population is low, then this segment can help distinguish between individuals in that population. Therefore, in analyzing how incriminating the DNA evidence is, one needs to ask the question: “Statistically, how many people in a population have the same pattern as that taken from a crime scene: 1 in 1,000,000? 1 in 10,000? Or, 1 in 10?”
It is also important to remember that DNA evidence can place a person at the scene of the crime, but it often does not prove that the person committed the crime. Other evidence needs to be considered as well.
Procedure
Part 1-Preparing the TAE Buffer Solution
1. Obtain 10 mL of Tris-Acetate EDTA (TAE) buffer solution, x50 concentrate. Caution: The concentrate is basic/alkaline.
2. Dilute the concentrated TAE buffer with 490 mL of DI (deionized) water in a large beaker or Erlenmeyer flask. Mix until the solution is fully dissolved. When you add the TAE to the water, you will see little lines in the solution. These are called Schlieren lines, and they form when a solution isn’t fully mixed. Mix until no more of these lines are visible and set the buffer aside for later. This buffer is now a x1 concentration and a pH of 8.0. Check the pH with pH paper.
Part 2- Preparing the Agar Gels
1. Take 80 mL of TAE x1 concentrate buffer in a 500-mL Erlenmeyer flask. Weigh out 0.8 g of agarose powder and add it to the TAE buffer. Swirl until the agarose is mixed into the buffer solution. Invert a 25 mL Erlenmeyer flask on top of the larger Erlenmeyer flask to serve as a lid. This step will help prevent evaporation. This solution is about 1% agarose.
2. Boil the agarose solution until the agarose gel is fully dissolved. Use a magnetic stir bar to gently mix the solution. Be very careful because this solution can easily boil over.
3. During this time, prepare two gel trays to pour the agarose gel into. Place the rubber feet firmly around each open end of the tray. You will prepare two gels; one will be used to practice sample loading and the other will be used for the actual analysis.

4. Once the agarose solution is boiling and all the gel granules have dissolved, remove the stir bar with a magnetic wand and allow the gel to cool to about 55-60°C before pouring into the gel tray. Caution: the flask may be very hot. Use care when handling hot glassware!
5. Carefully pour enough gel into the trays to reach the top of the black rubber feet. Do not overfill the trays! Obtain two plastic gel combs and place them at one end of each tray, in the notched area. This will create the wells for your DNA samples. You should choose the end of the comb that will give you at least 7 wells.
6. Let the gels solidify for 15-20 minutes, and do not touch the gel until it has solidified. You will know the gel is solidified when it becomes cloudy or opaque rather than clear; that means the agarose has set.
7. Once the gel is fully solidified, carefully remove the combs from the gels by wiggling them free. Once the comb is removed, remove the rubber feet on each tray and gently wiggle or slide the gel free with a finger. With the wells facing up and nearer to you, slice a small wedge off the upper right hand corner of the gel. This action will help you know which way to orient the gels when you visualize them at the end of the experiment.
8. The gels are very fragile and can tear easily. Place the completed gels in a safe location, such as a plastic bag with a little bit of TAE buffer to keep them hydrated, until you are ready to analyze your samples.
Part 3-DNA Sample Preparation
1. Using the constant temperature bath, prepare a 37°C water bath for later use. Place the tube containing restriction enzyme (lyophilized EcoRI/Pstl enzyme mix labeled ENZ) on ice.
2. Practice using the micropipets with water or Fast Blast stain before attempting to use them on experimental solutions.
3. Obtain a set of colored micro centrifuge tubes and label them as follows:
Tube color Label DNA Obtained from:Green CS Crime SceneBlue S1 Suspect #1Orange S2 Suspect #2Violet S3 Suspect #3Pink S4 Suspect #4Yellow S5 Suspect #5
4. Add 10 μL of each DNA sample to the correct tube (be sure to use a clean pipet tip each time). Add 10 μL of chilled, prepared lyophilized EcoRI/Pstl enzyme mix (ENZ) to each sample, cap the sample, and flick the tube with your finger vigorously. The supplied blue foam sample holders can be used to float the samples in the water bath. Place the capped micro-centrifuge tubes in the 37°C water bath, and allow incubation for 45 minutes. This temperature will make the enzymes work faster. Be careful not to let the water bath get too hot as this will damage the enzyme structure.
5. Add 5 µL of loading Dye (LD) to each of the DNA samples. Use a clean pipet tip for each sample.

Part 4: Gel Electrophoresis
1. Fill an electrophoresis chamber with 275 mL of TAE Buffer (x1). Gently place one gel into the electrophoresis chamber, and ensure it touches the bottom of the tray. Ensure that the gel wells are closer to the black, negative terminal so the DNA is carried with the current to the positive pole. If necessary, cover the gel with an additional 20 mL of buffer; the gel must be submerged.
2. You should now practice loading Fast Blast stain into the gel wells before you work with actual samples. IT IS VERY IMPORTANT THAT THE SAMPLES ARE PLACED DEEP INTO THE WELL. After practicing, carefully use a micropipette to load the gel as shown in the next table. The extra gel was prepared for this purpose.
Lane Sample Tube color Amount (μL)
1 S (DNA Standard-provided)
Colorless 10
2 CS Green 203 S1 Blue 204 S2 Orange 205 S3 Violet 206 S4 Pink 207 S5 Yellow 20
3. Once your gel is loaded, carefully place the lid on the electrophoresis chamber and plug in each electrode to the proper side (black to black, red to red), and connect the terminals to the voltage source. Set the voltage output to 100V, and turn it on to electrophorese for 30 minutes. Go on to the next step while you are waiting.
4. Obtain 30 mL of 500x FastBlast DNA stain concentrate, and dilute with 120 mL of DI water. Wear gloves while making and using the dye, as it can stain skin and clothing. This solution is now 100xFastBlast DNA stain.
5. When you have finished the electrophoresis run, turn off the voltage and unplug the terminals. Do not handle the terminals or any part of the circuit with wet hands, or you may get an electrical shock.
6. Carefully remove the gel from the buffer. Wash the chamber by rinsing with DI water. Do not touch any of the internal wires as these are fragile.
7. Place the gel in 120 mL of the 100x FastBlast DNA dye, and let the gel stain for 5-10 minutes with gentle agitation. Carefully remove the gel from the dye and rinse with DI water. Observe the band patterns left by the DNA strands as they moved through the gel.
8. You can use the light box to better visualize your developed gel.

Part 5- Conclusions and Reflections
Answer the following questions in your notebook and think about what from this analysis should go on your team’s poster.
1. Is band spacing or color intensity a more important feature when comparing the gel electrophoresis data of two different samples of DNA? Why?
2. Which suspect sample matched the DNA found at the crime scene? How did you decide which suspect was the best match? How certain are you that this is a good match?
3. Photograph your gels for your notebook.
4. Describe, in general terms, what happened in each section of this laboratory procedure.
5. Write a conclusion about your work with DNA Analysis for your poster.
Analysis of Fingerprints Left at the Crime Scene
The Sheriff’s Department has supplied your teams with several items from the crime scene that may have the suspect’s finger prints. It will now be your job to dust these items for finger prints and compare them to all of the suspects’ fingerprints supplied by the Sheriff’s Department.
Fingerprint Analysis
Forensic scientists have long used fingerprints to identify suspects in criminal investigations. Fingerprint analysis is important because of the unique fingerprints of each individual and because of the stability of fingerprints at the crime scene. Though many types of fingerprints can be found at a crime scene, your team will focus on the type of fingerprints that are called latent prints. Latent fingerprints are created from the sweat and oil on the skin's surface and cannot be seen with the naked eye. In order to see this type of print, additional processing is required. This processing can include dusting with powder and lifting with tape.
Once the prints are collected, the analysis can begin. Analysis includes determining individual and class characteristics for the unknown print. Individual characteristics are those features that are specific to an individual. Class characteristics are the features that narrow the print down to a group of people and include characteristic s called arches, loops, and whorls, which are described below:
Whorls – Whorls present a circular type of ridge flow. Loops- Loops are the most common. This pattern is characterized by ridges that enter on one
side of the print, loop around, and then exit on the same side. Arches -Arches are the least common type of fingerprint feature. This pattern is characterized
by ridges that enter on one side of the print, go up, and exit on the opposite side.
http://www.washington.edu/doit/MathSci/mesa_finger.html
When finger prints are compared, the forensic scientist compares the unknown print side by side with a known print. The unknown print is the print found at the crime scene, and the known print is the print of a possible suspect. First, the class characteristics are compared. If the class characteristics of the two prints are not in agreement, then the first print is automatically eliminated. However, if the class characteristics match, then the print is further evaluated to determine if the fingerprints’ individual characteristics match. It is important to note that there may not be a sufficient quality or quantity of detail in the print to draw a definite conclusion. In these instances, no conclusion can be made and the report should state “inconclusive."
Procedure
The Sheriff’s department has provided you with materials from the crime scene that may have latent prints from the suspect on them. You are also provided with the on file fingerprints of all five suspects that the police obtained. We need to make a conclusive match of the suspect’s fingerprints to the fingerprints that were found at the crime scene.
Because we have limited materials from the crime scene and you must be very careful with the evidence, you should practice this procedure a few times by making and lifting your own fingerprints.
Part 1 – Lifting Fingerprints
1. Put gloves on so that you don’t contaminate the evidence with your own prints.2. Using a very small amount of powder, dust the evidence with the brushed provided. The powder will
cling to the fingerprints and make them visible to the naked eye.3. Brush away as much excess powder as possible. Avoid brushing over the fingerprints more than
necessary so that you don’t damage the evidence.4. Pull a small piece of lifting tape and fold one end to make a tab. Place the tape directly onto the
print that you wish to lift and press down firmly.5. Carefully remove the tape using the tab on the end and then place it on the white card that is
provided. 6. Make sure to label your evidence so it is not confused with your practice prints.7. Once you have collected your print(s), compare them to the prints from the five suspects using a
magnifying glass. Label each suspect as excluded (not a match), match, or inconclusive (you’re not sure).
Part 2-Conclusions and Reflections- Answer the following questions in your notebook and think about what from this analysis should go on your team’s poster.
1. Explain how you analyzed the fingerprint data. Were you able to first narrow down the possibilities and then make a conclusive match?
2. You have collected and analyzed several types of data. Has the perpetrator of this crime emerged? How certain are you? Write a final conclusion for your poster.
3. Are there any other types of data or information you would like to have before drawing a conclusion?
4. Describe the role a Forensic Chemist has in solving crimes. Is this an important role? Why or why not?
ReferencesSkoog, D.A., Holler, F.J. and Crouch, S.R. Principles of Instrumental Analysis, 6th ed. Thomson, Brooks and Cole, 2007.Harris, D.C. Quantitative Chemical Analysis, 8th ed. Freeman: New York, 2010.Flame Atomic Absorption Spectrometry, Analytical Methods, Varian Publication no 85-100009-00, Revised March 1989.Sodeman, D. A., Lillard, S. J. “Who set the fire? Determination of arson accelerants by GC-MS inan instrumental methods course”, Journal of Chemical Education, 78, 9, 2001.http://www.personal.psu.edu/mkm20/111-arson.pdfhttp://www.crimemuseum.org/library/forensics/fingerprints.htmlBiotechnology Explorer Forensic DNA Fingerprinting Kit Instruction Manual Catalog #166-0077EDU, Bio-Rad Laboratories, Inc.


![Vinyl chloride power point[1]](https://static.fdocuments.net/doc/165x107/5565724cd8b42a7b518b4ebd/vinyl-chloride-power-point1-558497ad57a9c.jpg)


