Contents · Web viewLB mean values were derived by assigning a zero to results less than the LOD or...
46
Attachment 1 to Supporting Document 2 Occurrence of and dietary exposure to perfluorooctane sulfonate (PFOS), perfluorooctanoic acid (PFOA) and perfluorohexane sulfonate (PFHxS) reported in the literature
Transcript of Contents · Web viewLB mean values were derived by assigning a zero to results less than the LOD or...

Attachment 1 to Supporting Document 2
Occurrence of and dietary exposure to perfluorooctane sulfonate (PFOS), perfluorooctanoic acid (PFOA) and perfluorohexane sulfonate (PFHxS) reported in the literature

Contents1 Executive Summary...........................................................................................................3
2 Introduction........................................................................................................................4
3 Methods.............................................................................................................................4
4 Results...............................................................................................................................5
4.1 Occurrence of PFOS, PFOA and PFHxS in foods.....................................................5
4.1.1 Europe.................................................................................................................5
4.1.2 Regions other than Europe...............................................................................18
4.1.3 Comparison of occurrence data from other regions with the 24th ATDS...........20
4.1.4 Drinking water...................................................................................................20
4.1.5 Breast milk.........................................................................................................21
4.2 Estimated dietary exposure to PFOS, PFOA, PFHxS..............................................21
5 References......................................................................................................................29
2

1 Executive SummaryA literature review examining the occurrence of and reported estimates of dietary exposure to perfluroalylated substances (PFAS) in various populations was conducted. The number of PFAS chemicals analysed in each study and inconsistent methods of determining dietary exposure to PFAS made direct comparison between studies difficult.
EFSA published a comprehensive review of occurrence and dietary exposure to perfluoroalkylated substances in Europe in 2012 (EFSA 2012) that was an update of a previous 2008 report (EFSA 2008) on PFOS and PFOA, so the literature search focused on more recent publications for Europe and more generally from other regions.
Occurrence data were reported in both the EFSA report and the literature for a number of European counties, with limited data from Canada, Korea, China and Japan, noting different methods of analysis and limits of reporting were applied across different studies. Generally PFOS, PFOA and PFHxS were present in a similar range of foods and at levels of the same order of magnitude. The meat and meat products and fish and other seafood food groups had the highest reported levels of the three chemicals. However, for these two major food groups, reported PFOS levels were of a higher order of magnitude than those for PFOA, which were higher than those for PFHxS. Another exception was for cereals and grain-based products where PFOA tended to be reported at higher levels than PFOS.
Overall, the 24th ATDS indicates levels of PFOS and PFOA in the general food supply are low. The concentration of PFOS reported in the two foods with a positive result, fish fillets and beef sausages, were in the same range as those reported elsewhere.
The mean and high consumer (95th percentile) dietary exposure estimates for PFOS, PFOA and PFHxS reported for Europe and other regions of the world were surprisingly similar across countries for each chemical. An exception were those reported for PFOS and PFOA by Cornelis et al. (2012) for the Belgium population, which are likely to be overestimated due to high LODs applied in the derivation of mean concentration levels (Cornelis et al. 2012).
Discounting the values reported by Cornelis et al. (2012) and noting that estimates were derived in a number of different ways across the studies, reported mean dietary exposure estimates across all studies for PFOS ranged from 0-14 ng/kg bw/day, high dietary exposure (95th percentile) estimates from 0-29 ng/kg bw/day. Reported mean dietary exposure estimates for PFOA ranged from 0-17 ng/kg bw/day, 95th percentile exposure estimates from 0-32 ng/kg bw/day. Reported mean dietary exposure estimates for PFHxS were available for Europe only and ranged from 0-1.22 ng/kg bw/day, 95th percentile exposure estimates from 0-2.25 ng/kg bw/day.
Where information was available, dietary exposure estimates for a range of PFAS for infants and young children were higher than for other age groups in the same population, when expressed per kilogram of bodyweight (EFSA 2012, Domingo et al. 2012, Klenow et al. 2013, Cornelis et al. 2012). This is likely a result of higher food consumption per kilogram bodyweight due to growth and maintenance requirements Estimates of dietary exposure for a range of PFAS were higher for coastal communities in France, including pregnant women,
3

than for the general population, as consumption of fish and other seafood, a major source of PFAS, was reported to be higher in these coastal areas (Yamanda et al. 2014).
This review highlighted that estimated dietary exposure to PFAS based on levels found in foods have generally not been considered to be of concern for the general public, noting that all studies summarised referenced the European Food Safety Authority (EFSA) health based guidance values in the dietary exposure assessment. Reported dietary exposure estimates were all lower than the relevant EFSA TDIs for PFOS (150 ng/kg bw/day) and PFOA (1500 ng/kg bw/day), the health-based guidance values referred to in most of these studies. When evaluated against the TDIs derived by FSANZ for PFOS/PFHxS (20 ng/kg bw/day) and PFOA (160 ng/kg bw/day), virtually all dietary exposure estimates would be lower than these health-based guidance values. This is important because it shows that the FSANZ TDI is reasonable and readily achievable for the general population i.e. suitable for risk management purposes. The exceptions were the conservative upper bound estimate of high dietary exposure to PFOS for toddlers in Europe (EFSA 2012) and the PFOS estimates reported by Cornelius et al. for the Belgium population (Cornelius et al. 2012).
2 IntroductionThis literature review was conducted to assess the reported occurrence levels and estimated dietary exposures to the three most widely researched PFAS: Perfluorooctane sulfanoate (PFOS), Perfluorooctanoate (PFOA) and Perfluorohexane sulfonic acid (PFHxS).
EFSA published a comprehensive review of occurrence and dietary exposure to perfluoroalkylated substances in Europe in 2012 that was an update of a previous 2008 report on PFOS and PFOA (EFSA 2008, EFSA 2012), so the literature search focused on more recent publications for Europe and more generally from other regions.
International studies have shown that most people are exposed to low levels of PFOS and PFOA from the air, indoor dust, food, water, and various consumer products, with diet a major contributor (ATSDR 2015, Cornelis et al. 2012, Vestergren 2012, Tittlemier et al. 2007).
3 MethodsRelevant research concerning dietary exposure to PFAS was identified by searching both EbscoDiscovery and Google Scholar databases for primary research material. Material deemed appropriate for this review was any peer-reviewed journal article published since 2012.
In order to ensure that relevant studies were not missed, the search terms remained broad. These were "perfluoroalkyl" or “perfluorinated” or “PFAS” or “perfluoroalkyl substances” “perfluorinated substances” (within the title), plus "human” or “diet" or "dietary exposure" anywhere in the title or abstract. No language restrictions were employed. Studies were eligible for consideration in this review if there was recorded data related to PFAS and dietary exposure and/or estimated levels of PFAS in foods.
4

Once these articles were identified, the reference lists for each article were reviewed to assess whether any other relevant articles were missed from the search terms but were still within the four year publication period, particularly for European countries.
Due to the variable nature of the literature describing methods of dietary intake/exposure of PFAS, articles that investigated either intake or exposure were included in the literature search, noting comparison between studies was difficult due to varying approaches used and different statistical methods.
In addition to the EFSA 2012 report, 20 additional recent studies were identified that presented PFOS, PFOA and/or PFHxS occurrence data separately for some or all of the major food groups referred to in the EFSA report; of these, 15 studies covered 10 European countries (Belgium, Czech Republic, Finland, France, Greece, Italy, Norway, Spain, Sweden, The Netherlands,) and 5 studies covered 4 other countries (Canada, China, Japan, Korea). Five studies were identified that included additional estimates of dietary exposure to PFOS, PFOA and/or PFHxS for the populations of 7 European countries (Belgium, Czech Republic, France, Italy, Norway, Spain, Sweden) and 3 studies provided limited information on estimates of dietary exposure to PFOS, PFOA and/or PFHxS for the populations of Canada, China and Korea.
4 Results
4.1 Occurrence of PFOS, PFOA and PFHxS in foods
4.1.1 Europe
4.1.1.1 EFSA reports (EFSA 2012)
Results taken from submissions for 13 countries from surveys undertaken from 2006-2012 were included in the EFSA 2012 report. A total of 54,195 analytical results were included in the validated occurrence database for 27 PFAS chemical components, with the majority of data submitted by Germany, France and Norway. The compilers noted that it was not always possible to distinguish random from targeted samples, resulting in a tendency for overestimation of summary concentration levels for some foods and food groups.
For all PFAS a high proportion of non-detects was reported with 16 of the 27 chemicals having some quantified data. Mean occurrence data were reported, with lower bound (LB) and upper bound (UB) values derived. LB mean values were derived by assigning a zero to results less than the LOD or LOQ and the UB by assigning a numerical value equal to the LOD or LOQ to non detect results. Depending on the study approach the numerical values for the LOD or LOQ may have varied with each study and food matrix. Where data was based on composite samples (more than one purchase unit combined and one analysis performed), the means were weighted according to the number of samples per composite.
The results for the three chemicals of interest for this assessment (PFOS, PFOA and PFHxS) are summarised below in Table 1. In the EFSA data set PFOS was the most frequently detected (29%) with PFOS at 9% and PFHxS at 2%. In the EFSA report, major food groups with 100% non-detects are indicated in the occurrence data tables but the assigned mean concentration values are not reported, as these are assigned at the food sub group when used in dietary exposure estimates (see Table 2 for an example for the Meat
5

and meat products and Fish and fish products groups). Overall, approximately 80% of the LOD/LOQ values were <1 µg/kg.
Generally PFOS, PFOA and PFHxS were present in a similar range of foods and at levels of the same order of magnitude. The meat and meat products and fish and other seafood groups had the highest reported levels of the three PFAS chemicals. For these two food groups, reported PFOS levels were higher than those for PFOA, which were higher than PFHxS. As these were the two foods groups where detected results for PFOS were reported in the 24th ATDS (fish fillets <LOR-1.0 µg/kg, sausages < LOR- 0.2 µg/kg), a description of European occurrence data for the sub food groups within these two major food groups is given below in Table 2, with high levels for relevant food sub groups bolded. Where 100% samples were non-detects the UB mean was assigned the LOD for that food.
6

Table 1. Occurrence data for Europe by major food group (EFSA 2012)
Foods Chemical Number of samples* % non-detects# Mean LB concentration(µg/kg)#
Mean UB concentration(µg/kg)#
Grain and grain-based products PFOSPFOAPFHxS
79 79 (778) 75
100 96100
- 0.0002-
- 0.10-
Vegetables and vegetable products PFOSPFOAPFHxS
286 (1163) 285 (1162) 186 (1063)
90 88 98
0.02 0.0039 0.0001
0.12 0.13 0.09
Starchy roots and tubers PFOSPFOAPFHxS
303 (339) 303 (339) 88
99.7 99.7100
0.0035 0.0009-
0.63 0.64-
Legumes, nuts and oilseeds PFOSPFOAPFHxS
20 (157) 20 (157) 20
95 90100
0.0001 0.0031-
0.11 0.15-
Fruit and fruit products PFOSPFOAPFHxS
34 (136) 35 (139) 29 (133)
68 54 79
0.032 0.0111 0.013
0.085 0.062 0.046
Meat and meat products PFOSPFOAPFHxS
3215 (6460)3221 (6494) 683 (3928)
64 86 99
29.5 0.78 0.001
30.0 1.6 0.21
Fish and other seafood PFOSPFOAPFHxS
2534 (4395)2542 (4403)1331 (3192)
63 95 99
1.99 0.082 0.0096
2.4 0.69 0.49
Milk and dairy products PFOSPFOAPFHxS
318 (2449) 319 (2450) 239 (2370)
97 99 99.6
0.0007 0.0018 0.000002
0.11 0.12 0.077
Eggs and egg products PFOSPFOAPFHxS
134 (816) 138 (820) 99 (781)
88 89 99
0.034 0.066 0.0001
0.54 0.58 0.52
Sugar and confectionary PFOSPFOAPFHxS
45 (156) 45 (156) 10
98 91100
0.0035 0.0058-
0.053 0.049-
Animal and vegetable fats & oils PFOSPFOAPFHxS
56 (161) 55 (160) 53 (158)
98 96 98
0.28 0.0021 0.0003
0.56 0.31 0.21
Fruit and vegetable juices PFOSPFOA
1 1
100100
--
--
7

Foods Chemical Number of samples* % non-detects# Mean LB concentration(µg/kg)#
Mean UB concentration(µg/kg)#
PFHxS 1 100 - -Alcoholic beverages PFOS
PFOAPFHxS
6 6 (63) 6 (63)
100 83 83
- 0.0087 0.0048
- 0.013 0.0065
Herbs, spices and condiments PFOSPFOAPFHxS
8 8 8
100100100
---
---
Food for infants & small children PFOSPFOAPFHxS
21 21 10
100100100
---
---
Composite food PFOSPFOAPFHxS
45 45 (381) 38
100 98100
- 0.0004-
- 0.071-
Snacks, desserts & other foods PFOSPFOAPFHxS
46 46 46
100100100
---
---
Drinking water PFOSPFOAPFHxS
372 (456) 367 (451) 300 (384)
89 84 88
0.0005 0.001 0.0007
0.0025 0.0027 0.0021
*Number of reported analyses, total number of samples in brackets when adjusted for number of samples in composites#Means were calculated by weighting the results for pooled samples; where 100% samples were non-detects the LB, UB means were not presented in the EFSA report at the major food group level, but were assigned at the sub food group level.
8

Table 2. Occurrence data for Europe for meat and fish by sub food group (EFSA 2012)
Foods Chemical Number of samples* % non-detects# Mean LB concentration(µg/kg)#
Mean UB concentration(µg/kg)#
Meat and meat products PFOSPFOAPFHxS
3215 (6460)3221 (6494) 683 (3928)
64 86 99
29.5 0.78 0.001
30.0 1.6 0.21
Meat & meat products (unspec) PFOSPFOAPFHxS
15 (15) 15 (15) 15 (15)
100100100
0 0 0
1.0 1.0 1.0
Livestock meat PFOSPFOAPFHxS
232 (1418) 232 (1418) 183 (1369)
91 95 99
0.0086 0.0061 0.0002
0.12 0.13 0.081
Poultry PFOSPFOAPFHxS
150 (735) 150 (735) 136 (721)
97 99100
0.0097 0.0024 0
0.14 0.14 0.12
Game mammals PFOSPFOAPFHxS
569 (569) 572 (572) 26 (26)
71 91 96
0.87 0.4 0.016
1.5 1.2 0.72
Game birds PFOSPFOAPFHxS
9 (9) 9 (9) 1 (1)
100100100
0 0 0
0.38 0.37 0.053
Edible offal, farmed animals PFOSPFOAPFHxS
1261 (1623)1265 (1655) 145 (507)
91 98 99
0.42 0.034 0.0041
1.9 1.4 0.62
Edible offal, game animals PFOSPFOAPFHxS
882 (882) 881 (881) 90 (90)
4 59 99
215 5.4 0.012
215 8.1 2.5
Preserved meat PFOSPFOAPFHxS
39 (518) 39 (518) 36 (515)
95 97100
0.0003 0.0002 0
0.057 0.067 0.055
Sausages PFOSPFOAPFHxS
43 (480) 43 (480) 36 (473)
88100100
0.066 0 0
0.14 0.1 0.061
Pastes, pates & terrines PFOSPFOAPFHxS
15 (211) 15 (211) 15 (211)
100 93100
0 0.0085 0
0.05 0.069 0.041
Fish and other seafood PFOSPFOA
2534 (4395)2542 (4403)
63 95
1.99 0.082
2.4 0.69
9

Foods Chemical Number of samples* % non-detects# Mean LB concentration(µg/kg)#
Mean UB concentration(µg/kg)#
PFHxS 1331 (3192) 99 0.0096 0.49Fish and other seafood (unspec) PFOS
PFOAPFHxS
6 (21) 6 (21) 5 (20)
33 50 80
0.52 0.029 0.013
0.66 0.18 0.16
Fish meat (fillets) PFOSPFOAPFHxS
1982 (2978)1993 (2989) 927 (1923)
67 96 99.9
2.1 0.10 0.00052
2.5 0.64 0.46
Fish offal PFOSPFOAPFHxS
410 (410) 410 (410) 308 (308)
46 99 98
4.9 0.021 0.07
5.5 1.6 0.92
Crustaceans PFOSPFOAPFHxS
78 (302) 73 (297) 43 (267)
32 70 91
1.5 0.15 0.03
1.5 0.30 0.19
Water molluscs PFOSPFOAPFHxS
58 (684) 60 (686) 48 (674)
72 95100
0.031 0.0032 0
0.55 0.54 0.54
*Number of reported analyses, total number of samples in brackets when adjusted for number of samples in composites #Means were calculated by weighting the results for pooled samples; where 100% samples were non-detects, the lower bound (LB) mean was assigned zero and the upper bound (UB) mean the limit of detection for that food matrix.
10

For meat and meat products, there was a high level of non-detects, with some exceptions, for example edible offal of game animals and fish. The high LB and UB values for PFOS for the whole meat and meat products food group were driven by reported levels for game mammals and edible offal, in particular edible offal for game animals, the concentration level of which was two orders of magnitude higher than for any other food sub-group. A separate study of PFOS in animal livers indicated a marked accumulation in animal organs in an order of liver > kidney > muscle (Zafeiraki et al. 2016a). For fish and other seafood, PFOS levels for fish offal were the highest of the five fish and seafood sub groups but of the same order of magnitude as levels for fish fillets and crustacea.
4.1.1.2 Other occurrence data from studies for Europe 2012-2016
A number of studies have been published since the EFSA 2012 report for specific countries in Europe. These are summarised in Table 3, Table 4 and Table 5 below for PFOS, PFOA and PFHxS respectively, noting different studies may have used different methods of analysis and assigned different LOD/LOQs to non-detect samples of the same food. It is unclear if some of these data had also been submitted to EFSA and included in the 2012 review, as data may have been collected several years prior to publication. Publications that reported total PFAS concentrations were not included in the tables below because different numbers of PFAS chemicals were included in total concentrations (Yamanda et al. 2014, D’Hollander et al. 2015), so the data were not comparable.
Generally the additional occurrence data reported for 10 individual European countries from 2012-16 for PFOS, PFOA and PFHxS were with the ranges reported in the EFSA 2012 review. Exceptions were for PFOS concentration levels for foods from Belgium reported by Cornelis et al. (2012), noting that the reported LODs for this study were higher than most other studies (0.17 - 15 µg/kg). In particular, the PFOS level of 174 µg/kg for freshwater fish was higher than that for sea caught (marine) fish level of 12.9 µg/kg and much higher than the mean levels reported by EFSA (mean PFOS concentrations of 2.1- 2.5 µg/kg for fish meat /fillets and 4.9 – 5.5 µg/kg for fish offal, noting these data did not distinguish between marine and freshwater caught fish). The PFOS values reported for Finland for freshwater fish of 1.5 – 39 µg/kg were also higher than those for marine fish of 0.31-7.5 µg/kg (Koponen et al. 2014), but not as high as those reported by Cornelis et al. . High PFOS concentration levels were reported for marine fish caught in Greek coastal waters of 0.82 – 20.37 µg/kg across 7 species; the same items had higher levels of PFOS once fried in oil (<0.49 – 44.69 µg/kg), but similar values when grilled (Vassiliadou et al. 2015).
11

Table 3. Additional occurrence data for PFOS for Europe by major food group (2012-16)
Foods* Country Year Number and type samples** Mean PFOS concentration (µg/kg)# ReferenceGrain and grain-based products Belgium
Sweden
Spain
20122010
2011
3 whole groupNS pastriesNS otherNS bakeryNS other
0.052 0.021 0.022 0.0007< 0.0017
Cornelis et al. 2012Vestergren et al. 2012
Domingo et al. 2012a
Vegetables and vegetable products BelgiumSwedenBelgiumCzech RebItalySpain
201220102011201120112011
36 whole groupNS incl root vegNS whole groupNS whole groupNS whole groupNS whole group
0.60 0.0041 0.0032 0.0007 0.0057 0.1
Cornelis et al. 2012Vestergren et al. 2012Herzke et al. 2013Herzke et al. 2013Herzke et al. 2013Domingo et al. 2012a
Starchy roots and tubers BelgiumSwedenSpain
201220102011
6 whole groupNS potatoesNS whole group
6.18 0.0069 <0.005
Cornelis et al. 2012Vestergren et al. 2012Domingo et al. 2012a
Legumes, nuts and oilseeds Spain 2011 NS whole group 0.0061 Domingo et al. 2012a
Fruit and fruit products BelgiumSwedenSpain
201220102011
11 whole groupNS whole groupNS whole group
0.35 0.0022 <0.005
Cornelis et al. 2012Vestergren et al. 2012Domingo et al. 2012a
Meat and meat products Belgium
SwedenSpainNetherlands
Italy
2012
201020112014
2013
7 pork 5 poultry 7 otherNS whole groupNS whole group 99 liver (horse, pig, cow, sheep chicken)8 whole group
0.17 0.63 0.055 0.025 0.034<0.5 - 4.5
1.43
Cornelis et al. 2012
Vestergren et al. 2012Domingo et al. 2012aZafeiraki et al. 2016a
Guerannti et al. 2013
12

Foods* Country Year Number and type samples** Mean PFOS concentration (µg/kg)# ReferenceFish and other seafood Belgium
SwedenSpainGreece
FranceFinland
Italy
2012
201020112011
20102009
2013
28 marine26 freshwater745 crust & molluscNS whole groupNS whole group28 marine 4 crustacea 8 molluscsNS molluscs253 marine23 freshwater20 farmed16
12.0174 9.86 1.29 2.70.82 - 20.375.15<0.490.04 - 0.20.31 - 7.51.5 - 39<0.37<LOD - 30.2
Cornelis et al. 2012
Vestergren et al. 2012Domingo et al. 2012aVassiliadou et al. 2015
Munschy et al. 2013Koponen et al. 2014
Guerannti et al. 2013Milk and dairy products Belgium
SwedenSpain
Italy^
Italy
201220102011
20112013
9 whole groupNS whole groupNS milkNS other67 cows milk4 milk8 cheese
0.25 0.0056 <0.0069 <0.003 0 - 0.097 0.36 <LOD - 2.88
Cornelis et al. 2012Vestergren et al. 2012Domingo et al. 2012a
Barbarossa et al. 2014Guerannti et al. 2013
Eggs and egg products BelgiumSwedenSpainNetherlandsGreece
20122010201120132013
8--7345
6.86 0.039 <0.0053 3.5##
1.1##
Cornelis et al. 2012Vestergren et al. 2012Domingo et al. 2012aZafeiraki et al. 2016bZafeiraki et al. 2016b
Sugar and confectionary Sweden 2010 - 0.0036 Vestergren et al. 2012
Animal and veg fats & oils BelgiumSwedenSpain
201220102011
2--
0.033 0.013 0.0011
Cornelis et al. 2012Vestergren et al. 2012Domingo et al. 2012a
13

Foods* Country Year Number and type samples** Mean PFOS concentration (µg/kg)# ReferenceAlcoholic beverages Belgium 2012 5 beer 0.013 Cornelis et al. 2012Food for infants & small children Spain^
Italy^France^France^
2012
201320132010/2013
10 breast milk16 infant formula13 dry cereals12 baby food49 breast milk48 breast milk61 breast milk
0.05 0.061 1.321 0.019 0.85 0.079 0.04
Lorenzo et al. 2016
Guerannti et al. 2013Antignac et al. 2013Cariou et al. 2015
Drinking water BelgiumSpain
20122011
430
0.005 0.0018
Cornelis et al. 2012Domingo et al. 2012b
* No additional data for Fruit and vegetable juices, Herbs, spices and condiments, Food for infants & small children, Composite food or Snacks, desserts & other foods.# Numerical value given for LOD/LOQ if quoted in the study (eg <0.1 µg/kg), otherwise given as <LOD/LOQ if value not reported^ Cow milk, breast milk and infant formula data in µg/L.** NS Number of samples not specified## Median concentration
14

Table 4. Additional occurrence data for PFOA for Europe by major food group (2012-16)
Foods Country Year Number and type samples** Mean PFOA concentration (µg/kg)# ReferenceGrain and grain-based products Belgium
Sweden
Spain
20122010
2011
3 whole groupNS pastriesNS otherNS bakeryNS other
0.055 0.018 0.062 <0.11 <0.12
Cornelis et al. 2012Vestergren et al. 2012
Domingo et al. 2012a
Vegetables and vegetable products BelgiumSwedenBelgiumCzech RebItalySpain
201220102011201120112011
36 whole groupNS whole groupNS whole groupNS whole groupNS whole groupNS whole group
0.65 0.022 0.0103 0.0019 0.0025 0.37
Cornelis et al. 2012Vestergren et al. 2012Herzke et al. 2013Herzke et al. 2013Herzke et al. 2013Domingo et al. 2012a
Starchy roots and tubers BelgiumSwedenSpain
201220102011
6 whole groupNS potatoesNS whole group
0.67 0.057 <0.36
Cornelis et al. 2012Vestergren et al. 2012Domingo et al. 2012a
Legumes, nuts and oilseeds Spain 2011 NS whole group <0.26 Domingo et al. 2012aFruit and fruit products Belgium
SwedenSpain
201220102011
11 whole groupNS whole groupNS whole group
0.43 0.015 <0.360
Cornelis et al. 2012Vestergren et al. 2012Domingo et al. 2012a
Meat and meat products Belgium
SwedenSpain
2012
20102011
7 pork 5 poultry 7 otherNS whole group NS whole group
0.055 0.055 0.52 0.012 <0.3
Cornelis et al. 2012
Vestergren et al. 2012Domingo et al. 2012a
Fish and other seafood Belgium
SwedenSpainGreece
Finland
2012
201020112011
2009
27 marine26 freshwater652 crust & molluscsNS whole groupNS whole group28 marine 4 crustacea 8 molluscs253 marine23 freshwater
0.59 0.78 3.34 0.05 2.6 <0.6 <0.6 <0.6<0.39-1.8 <0.23
Cornelis et al. 2012
Vestergren et al. 2012Domingo et al. 2012aVassiliadou et al. 2015
Koponen et al. 2014
15

Foods Country Year Number and type samples** Mean PFOA concentration (µg/kg)# Reference20 farmed <0.37
Milk and dairy products BelgiumSwedenSpain
Italy^
201220102011
2011
9NS whole groupNS milkNS other67 cows milk
0.12 0.029 0.39 0.19 0 - 0.032
Cornelis et al. 2012Vestergren et al. 2012Domingo et al. 2012a
Barbarossa et al. 2014Eggs and egg products Belgium
SwedenSpainNetherlandsGreece
20122010201120132013
8 whole groupNS whole groupNS whole group73 median45 median
0.86 0.039 <0.39 1.1 0.5
Cornelis et al. 2012Vestergren et al. 2012Domingo et al. 2012aZafeiraki et al. 2016bZafeiraki et al. 2016b
Sugar and confectionary Sweden 2010 NS whole group 0.013 Vestergren et al. 2012
Animal and veg fats & oils BelgiumSwedenSpain
201220102011
2 whole groupNS whole groupNS whole group
0.091 <LOQ <0.140
Cornelis et al. 2012Vestergren et al. 2012Domingo et al. 2012a
Alcoholic beverages Belgium 2012 5 beer 0.006 Cornelis et al. 2012Food for infants & small children Spain^
ItalySpain^France^France ^
2012
2013201320132010/2013
10 breast milk16 infant formula13 dry cereals12 baby food49 breast milk40 breast milk48 breast milk61 breast milk
0.177 0.415 0.179 0.216 0.16 0.054 0.075 0.041
Lorenzo et al. 2016
Guerannti et al. 2013Guzmàn et al. 2016Antignac et al. 2013Cariou et al. 2015
Drinking water BelgiumSpain
20122011
430
0.002 0.0024
Cornelis et al. 2012Domingo et al. 2012b
*No additional data for Fruit and vegetable juices, Herbs, spices and condiments, Food for infants & small children, Composite food or Snacks, desserts & other foods.# Numerical value given for LOD/LOQ if quoted in the study (eg <0.1 µg/kg), otherwise given as <LOD/LOQ if value not reported ^ Cow milk, breast milk data in µg/L** NS Number of samples not specified## Median concentration
16

Table 5. Additional occurrence data for PFHxS for Europe by major food group (2012-16)
Foods* Country Year Number and type samples** Mean PFHxSconcentration (µg/kg)#
Reference
Grain and grain-based products Sweden
Spain
2010
2011
NS pastriesNS otherNS bakeryNS other
<LOQ <LOQ <0.0006 <0.0006
Vestergren et al. 2012
Domingo et al. 2012
Vegetables and vegetable products SwedenBelgiumCzech RebItalySpain
20102011201120112011
NS incl root vegNS whole groupNS whole groupNS whole groupNS whole group
0.0012 0.0003 <LOQ <LOQ 0.0045
Vestergren et al. 2012Herzke et al. 2013Herzke et al. 2013Herzke et al. 2013Domingo et al. 2012a
Starchy roots and tubers SwedenSpain
20102011 NS potatoesNS whole group
<LOQ <0.0019
Vestergren et al. 2012Domingo et al. 2012a
Legumes, nuts and oilseeds Spain 2011 NS whole group 0.0013 Domingo et al. 2012aFruit and fruit products Sweden
Spain20102011
NS whole groupNS whole group
<LOQ <0.0019
Vestergren et al. 2012Domingo et al. 2012a
Meat and meat products SwedenSpain
20102011
NS whole groupNS whole group
0.0045 0.0032
Vestergren et al. 2012Domingo et al. 2012a
Fish and other seafood SwedenSpainGreece
201020112011
NS whole groupNS whole group28 marine 4 crustacea 8 molluscs
0.0092 0.045 <0.18 <0.18 <0.18
Vestergren et al. 2012Domingo et al. 2012aVassiliadou et al. 2015
Milk and dairy products SwedenSpain
20102011
NS whole groupNS milkNS other
0.001 <0.0026 <0.0011
Vestergren et al. 2012Domingo et al. 2012a
Eggs and egg products SwedenSpainNetherlandsGreece
2010201120132013
NS whole groupNS whole group73 whole group45 whole group
0.0025 <0.002 1.1##
< 0.5##
Vestergren et al. 2012Domingo et al. 2012aZafeiraki et al. 2016Zafeiraki et al. 2016
Sugar and confectionary Sweden 2010 NS whole group 0.0015 Vestergren et al. 2012
Animal and veg fats & oils Sweden 2010 NS whole group <LOQ Vestergren et al. 2012
17

Foods* Country Year Number and type samples** Mean PFHxSconcentration (µg/kg)#
Reference
Spain 2011 NS whole group <0.0007 Domingo et al. 2012aFood for infants & small children Spain^
France^France^
2012
20132010/2013
10 breast milk16 infant formula13 dry cereals12 baby food48 breast milk61 breast milk
<LOD 0.034 0.265 <LOD 0.05 0.026
Lorenzo et al. 2016
Antignac et al. 2013Cariou et al. 2015
Drinking water Spain 2011 30 0.0004 Domingo et al. 2012b* No additional data for Fruit and vegetable juices, Herbs, spices and condiments, Food for infants & small children, Composite food or Snacks, desserts & other foods, Alcoholic beverages, Drinking water.# Numerical value given for LOD/LOQ if quoted in the study (eg <0.1 µg/kg), otherwise given as <LOD/LOQ if value not reported^ Breast milk data in µg/L** NS Number of samples not specified## Median concentration
18

4.1.2 Regions other than Europe
In one of the first studies to report on PFAS, limited occurrence data were reported from the Canadian Total Diet Study (TDS), where 49 composite samples were analysed for PFAS chemicals (Tittlemier 2007). Just over half of the samples were taken from the 2004 TDS and the rest from archived samples taken from 1992-2001. PFAS chemicals were detected only in four meat samples (beef steak, roast beef, ground beef, luncheon meat), three fish samples (one marine and two freshwater fish), pizza and popcorn out of the 49 foods included in the review.
Four more recent studies were identified giving occurrence data for PFAS in a range of foods for the Asian region; for Korea (Heo et al. 2014) and for China (Wu et al. 2012); on foods for infants, including breast milk (Yukiko et al. 2012) and on breast milk only (Kang et al. 2016). Available data for PFOS, PFPOA and PFHXs are summarised in Table 6 , Table 7 and Table8 below.
Table 6. Occurrence data for PFOS for regions other than Europe by major food group
Foods* Country Year Number and type samples**
Mean PFOSconcentration (µg/kg)#
Reference
Grain and grain-based products
Canada 19981999
NS PizzaNS Popcorn
<1.0 0.98
Tittlemier et al. 2007
Fruit, vegetables and products
Korea 2011 78 fruit and veg <LOD Heo et al. 2014
Meat and meat products
Canada
Korea
2004
2011
NS BeefNS Luncheon meat39 whole group
<0.6 to 2.7 <0.6 0.353 LB
Tittlemier et al. 2007
Heo et al. 2014Fish and other seafood
Canada
China
Korea
200420042009
2011
NS MarineNS FreshwaterNS Fatty fishNS Shellfish99 whole group
2.6 2.00.063-0.4760.008-0.226 0.668 LB
Tittlemier et al. 2007
Wu et al. 2012
Heo et al. 2014Milk and dairy products
Korea 2011 37 whole group <LOD Heo et al. 2014
Composite foods
Korea 2011 90 whole group 0.409 LB Heo et al. 2014
Food for infants & small children
Korea^ 2013 274 breast milk 0.05## Kang et al. 2016
Drinking water Korea^ 2011 34 tap water8 bottled water
0.0026 0.0001
Heo et al. 2014
Beverages Korea^ 2011 21 whole group 0.024 LB Heo et al. 2014Other foods Korea 2011 33 not defined 0.01 LB Heo et al. 2014* No additional data for Starchy roots and tubers, Legume, nuts and oilseeds, Eggs and egg products, Sugar and confectionary, Animal fats and oils, Fruit and vegetable juices, Alcoholic beverages, Herbs, spices and condiments, Snacks, desserts & other foods.# Numerical value given for LOD/LOQ if quoted in the study (eg <0.1 µg/kg), otherwise given as <LOD/LOQ if value not reported, LB Lower bound LOD Limit of detection LOQ Limit of quantification^ Drinking water, beverages and breast milk data in µg/L** NS Number of samples not specified## Median concentration
19

Table 7. Occurrence data for PFOA for regions other than Europe by major food group
Foods* Country Year Number and type samples**
Mean PFOAconcentration (µg/kg)#
Reference
Grain and grain-based products
Canada 19981999
NS PizzaNS Popcorn
<1.0 3.6
Tittlemier et al. 2007
Fruit, vegetables and products
Korea 2011 78 fruit and veg 0.001 LB Heo et al. 2014
Meat and meat products
Canada
Korea
2004
2011
NS BeefNS Luncheon meat39 whole group
<0.4 to 2.6 <0.4<LOD
Tittlemier et al. 2007
Heo et al. 2014Fish and other seafood
Canada
China
Korea
200420042009
2011
NS MarineNS FreshwaterNS Fatty fishNS Shellfish99 whole group
<0.5<0.50.016-0.070.094-1.459 0.07 LB
Tittlemier et al. 2007
Wu et al. 2012
Heo et al. 2014Milk and dairy products
Korea 2011 37 whole group 0.261 LB Heo et al. 2014
Composite foods
Korea 2011 90 whole group 0.003 LB Heo et al. 2014
Food for infants & small children
Korea^Japan^
Korea^China^
201320102010201020082010
274 breast milk30 breast milk5 infant formula30 breast milk30 breast milk5 infant formula
0.072##
0.0935 0.0218 0.0645 0.0516 0.0281
Kang et al. 2016Yukiko et al. 2012
Drinking water Korea^ 2011 34 tap water8 bottled water
0.0129 0.0002
Heo et al. 2014
Beverages Korea^ 2011 21 whole group 0.153 LB Heo et al. 2014Other foods Korea 2011 33 not defined <LOD Heo et al. 2014* No additional data for Starchy roots and tubers, Legume, nuts and oilseeds, Eggs and egg products, Sugar and confectionary, Animal fats and oils, Fruit and vegetable juices, Alcoholic beverages, Herbs, spices and condiments, Snacks, desserts & other foods.# Numerical value given for LOD/LOQ if quoted in the study (eg <0.1 µg/kg), otherwise given as <LOD/LOQ if value not reported, LOD Limit of detection LOQ Limit of quantification^ Drinking water, beverages and breast milk data in µg/L** NS Number of samples not specified## Median concentration
20
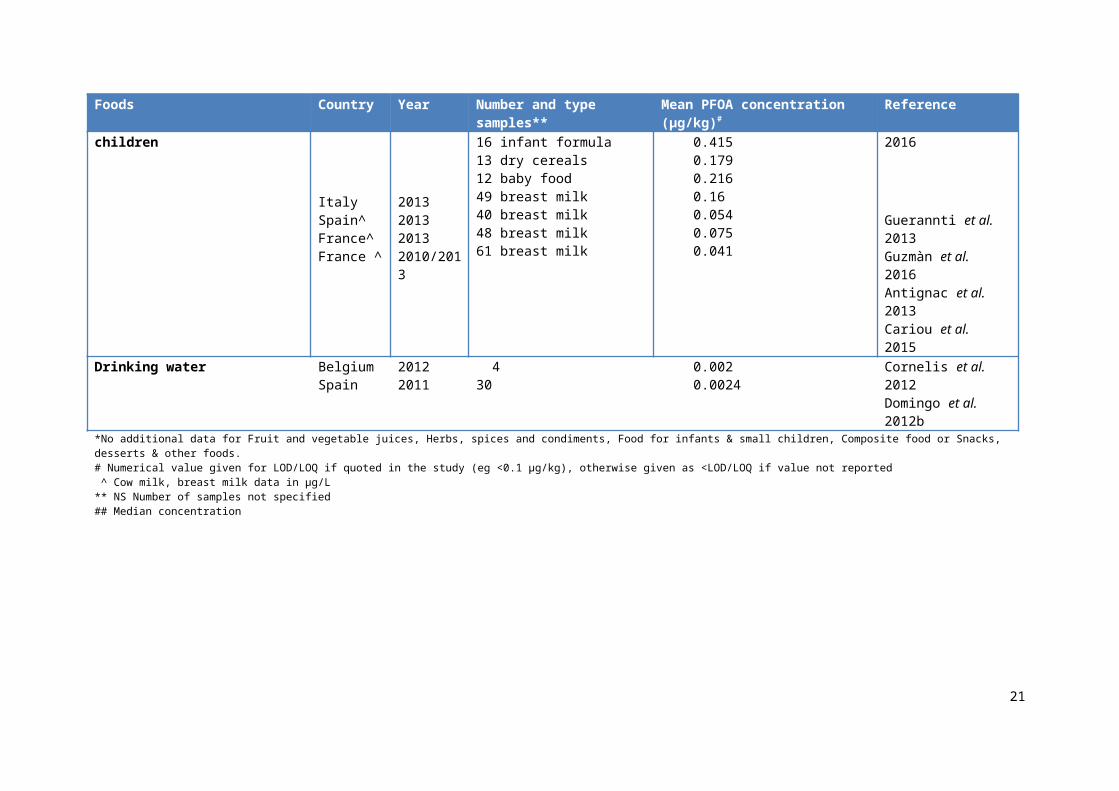
Table 8. Occurrence data for PFHxS for regions other than Europe by major food group
Foods* Country Year Number and type samples**
Mean PFHxSconcentration (µg/kg)#
Reference
Fruit, vegetables and products
Korea 2011 78 fruit and veg <LOD Heo et al. 2014
Meat and meat products
Korea 2011 39 whole group <LOD Heo et al. 2014
Fish and other seafood
Korea 2011 99 whole group 0.012 LB Heo et al. 2014
Milk and dairy products
Korea 2011 37 whole group 0.029 LB Heo et al. 2014
Composite foods
Korea 2011 90 whole group 0.007 LB Heo et al. 2014
Drinking water Korea^ 2011 34 tap water8 bottled water
0.0008 <LOD
Heo et al. 2014
Beverages Korea^ 2011 21 whole group <LOD Heo et al. 2014Other foods Korea 2011 33 not defined 0.028 LB Heo et al. 2014* No additional data for Starchy roots and tubers, Legume, nuts and oilseeds, Eggs and egg products, Sugar and confectionary, Animal fats and oils, Fruit and vegetable juices, Alcoholic beverages, Herbs, spices and condiments, Snacks, desserts & other foods.# Numerical value given for LOD/LOQ if quoted in the study (eg <0.1 µg/kg), otherwise given as <LOD/LOQ if value not reported, LOD Limit of detection LOQ Limit of quantification^ Drinking water, beverages and breast milk data in µg/L** NS Number of samples not specified## Median concentration
4.1.3 Comparison of occurrence data from other regions with the 24th ATDS
The concentration of PFOS reported in fish fillets in the 24th ATDS (<LOD - 1.0 µg/kg) was generally much lower than levels reported in international studies (<LOD - 174 µg/kg), noting freshwater fish concentration levels were generally higher than marine caught fish where reported separately. Although there were no direct comparisons found for beef sausages, PFOS levels reported in sausages in the 24th ATDS (<LOD – 0.2 µg/kg) were higher than those reported for all sausages in Europe (0.066 µg/kg) (EFSA 2012) but lower than the level for ground beef reported in the Canadian study (2.1 µg/kg) (Tittlemier 2007).
4.1.4 Drinking water
A limited number of occurrence data were available for drinking water; for Europe for PFOS from 0.0005 - 0.005 µg/g (EFSA 2012, Cornelis et al. 2012, Domingo et al. 2012b) and for Korea from 0.0001 (bottled water ) to 0.0003 (tap water) µg/L (Heo et al. 2014); for Europe for PFOA from 0.001 - 0.0027 µg/g (EFSA 2012, Cornelis et al. 2012, Domingo et al. 2012b) and for Korea from 0.0002 (bottled water ) to 0.0012 (tap water) µg/L (Heo et al. 2014); for Europe for PFHxS from 0.0007 - 0.0021 (EFSA 2012, Domingo et al. 2012b) and for Korea from <LOD (bottled water) to 0.0008 (tap water) µg/L (Heo et al. 2014).
Few countries have set PFAS in guideline levels for drinking water; in the USA the guideline levels are 0.2 µg/L for PFOS and 0.4 µg/L for PFOA (ATSDR 2015). All PFOS, PFOA and PFHxS levels in drinking water reported in the studies assessed were much lower than these
21

guideline levels. In April 2016 enHealth1 proposed interim guideline levels for drinking water for Australia of 0.5 µg/L for PFOS + PFHxS and 5 µg/L for PFOA, using the EFSA TDIs for PFOS and PFOA as a basis for the calculations (enHealth 2016).
4.1.5 Breast milk
A limited number of occurrence data were available for breast milk for European women in the additional studies ranging from mean concentrations of 0.04 – 0.85 µg/L for PFOS, 0.04 – 0.17 µg/L for PFOA and 0.026 - 0.05 µg/L for PFHxS (Guzmàn et al. 2016, Lorenzo et al. 2016, Guerannti et al. 2013, Antignac et al. 2013, Cariou et al. 2015). In the Asian region breast milk data were available for Korean women with mean values of 0.005 µg/L reported for PFOS (Kang et al. 2016) and 0.06 - 0.07 µg/L for PFOA (Kang et al. 2016, Yukiko et al. 2012); mean values for PFOA in breast milk of Japanese and Chinese women were 0.094 µg/L and 0.052 µg/L respectively (Yukiko et al. 2012).
Unlike other foods, the proportion of detects in breast milk samples was generally high for PFOS ranging from 27-98%, for PFOA ranging from 2-100% and for PFHxS at 15%. More specifically: 60% PFOS and 100% PFOA, reported in Lorenz et al. 2016; 60% for PFOA, Guzman et al. 2016; 27% PFOS and 2% PFOA, Guerrenti et al. 2013; 82% PFOS, 77% PFOA and 15% PFHxS, Cariou et al. 2015; 98% for PFOS and PFOA, Kang et al. 2016; >60% for PFOA Yukiko et al. 2012. This is to be expected as PFAS chemicals accumulate in the human body over time from all food and non-food sources. However, contributing factors to PFAS levels in breast milk will be different for each population, and may depend to some extent on the amount of meat and meat products, fish and seafood, and other foods consumed as well as genetic, economic and environmental factors. This is also the case for blood serum levels, for example, the Jain 2014 study on factors influencing blood serum levels of PFAS chemicals in the US population, the De Felip et al. 2015 study of blood serum levels of PFAS chemicals in Italian women, the Ji et al. 2012 study of blood serum levels in Korean population and the Yukoki et al. 2012 study of blood serum levels in Japanese, Korean and Chinese women. Possible contributing factors to blood serum levels for Australian populations are subject to a separate study and not reported here.
4.2 Estimated dietary exposure to PFOS, PFOA, PFHxS
Many of the publications reporting occurrence data also reported estimated dietary exposures to PFAS for the populations consuming those foods containing PFAS, including PFOS, PFOA and PFHxS. These are summarised for Europe and other regions below in Table 9, Table 10, and Table 11 respectively. Where estimated dietary exposures were reported for total PFAS, these were not included in this report because different numbers of PFAS chemicals were included in the calculations in each study, so the data were not comparable. Where an estimate was not given for the total diet but for dietary exposure from a major food group only this is noted (Wu et al. 2012). Generally, national nutrition survey (NNS) data were used to derive food consumption data and individual body weights for dietary exposure estimates, with the exception of those for Canada (Tittlemeir et al. 2007) and Sweden (Vestergren 2012) where per capita consumption data and a standard bodyweight was used.
1 The Environmental Health Standing Committee (enHealth) is a standing committee of the Australian Health Protection Principal Committee (AHPPC).
22

The EFSA 2008 dietary exposure estimates were known to be overestimates compared to those reported in 2012 due to higher LODs for most foods, lack of information for many countries and conservative assumptions made (EFSA 2008, 2012). In the 2012 report EFSA included only those countries with 2 or more days of food consumption records for each age group, as it was a chronic dietary exposure assessment (EFSA 2012). It is noted in this report that the estimates of dietary exposure to PFHxS were tentative, as there were less data for PFHxs and more uncertainties in the occurrence data set.
The results reported for Belgium by Cornelis et al. in 2012 stand out as being much higher than any other estimated dietary exposures reported for Europe, estimates appear to be mainly driven by higher LODs and the high analytical values for fish and seafood, in particular freshwater fish, reported in their study (Cornelis et al. 2012).
In a 2007 report from the Canadian Total Diet Study, approximately 60% total exposure to perfluorinated carboxylates and PFOS was attributed to food, <1% to water, with the remaining from household items such as treated carpet and upholstery (29%), dust (7%) and air (3%) (Tittlemier et al. 2007).
The mean and high consumer (95th percentile) dietary exposure estimates for PFOS, PFOA and PFHxS reported for Europe and other regions of the world were surprisingly similar across countries for each chemical, with the exception of those reported for PFOS and PFOA by Cornelis et al. (2012) for the Belgium population, which are likely to be overestimated due to high LODs applied in the derivation of mean concentration levels (Cornelis et al. 2012). Discounting the values reported by Cornelis et al. (2012) and noting that estimates were derived in a number of different ways across the studies, reported mean dietary exposure estimates across all studies for PFOS ranged from 0-14 ng/kg bw/day, high dietary exposure (95th percentile) estimates from 0-29 ng/kg bw/day. Reported mean dietary exposure estimates for PFOA ranged from 0-17 ng/kg bw/day, 95th percentile exposure estimates from 0-32 ng/kg bw/day. Reported mean dietary exposure estimates for PFHxS were available for Europe only and ranged from 0-1.22 ng/kg bw/day, 95th percentile exposure estimates from 0-2.25 ng/kg bw/day.
Where information was available, dietary exposure estimates for PFAS for infants and young children were higher than for other age groups in the same population, when expressed per kilogram of bodyweight (EFSA 2012, Domingo et al. 2012, Klenow et al. 2013, Cornelis et al. 2012). This is likely a result of higher food consumption per kilogram bodyweight due to growth and maintenance requirements. Estimates of dietary exposure for PFAS were higher for coastal communities in France, including pregnant women, than for the general population, as consumption of fish and other seafood, a major source of PFAS, was reported to be higher in these coastal areas (Yamanda et al. 2014).
This review highlighted that estimated dietary exposure to PFAS based on levels found in foods have generally not been considered to be of concern for the general public, noting that all studies summarised referenced the EFSA health based guidance values in the dietary exposure assessment. Reported dietary exposure estimates were all lower than the relevant EFSA TDIs for PFOS (150 ng/kg bw/day) and PFOA (1500 ng/kg bw/day), the health-based guidance values referred to in most of these studies. When evaluated against the TDIs derived by FSANZ for PFOS/PFHxS (20 ng/kg bw/day) and PFOA (160 ng/kg bw/day), virtually all dietary exposure estimates would be lower than these health-based guidance values. The exceptions were the conservative upper bound estimate of high dietary exposure
23

to PFOS for toddlers in Europe (EFSA 2012) and the PFOS estimates reported by Cornelius et al. for the Belgium population (Cornelius et al. 2012).
.
24

Table 9. Estimated dietary exposure to PFOS
Country Date Population Mean/median PFOS dietary exposure#
ng/kg bw/day
High (P95)PFOS dietary exposure#
ng/kg bw/day
Reference Comment
EUROPEEurope(data UK, Germany)
2008
All 60 (indicative)1 - 410 - 100 30 - 200
EFSA 2008German Total Diet StudyUK Total Diet Study
Europe(13 countries, ≥2 day records)*
2012
InfantsToddlersOther childrenAdolescentsAdultsElderlyVery elderly
0.29 - 110.58 - 140.59 - 100.32 - 5.30.27 - 5.20.41 - 3.70.40 - 4.1
7.0 - 122.1 - 292.3 - 191.7 - 121.4 - 101.7 - 8.21.5 - 6.7
EFSA 2012 Major contributors were fish and other seafood, fruit and fruit products, meat and meat products across all age groups (LB model)
France 2011
Adult general populationHigh seafood consumersPregnant women (coastal)Pregnant women (other)
0.00 - 0.661.53 - 2.454.05 - 5.250.03 - 0.77
0.00 - 1.154.42 - 6.54.88 - 6.370.08 -1.42
Yamanda et al. 2014
Major contributor was fish and other seafood, esp freshwater fish
Belgium 2012
Children 3- 5 yearsAdults ≥ 21 years
57.124.2
96.640.9
Cornelis et al. 2012
Major contributors were potatoes, fish and other seafood, dairy products, eggs and fruit
Belgium
Czech Rep
Italy
2013
2013
201
Adults 18-64 yearsChildren 3-9 years
Adults 18-64 yearsChildren 3-9 years
Adults 18-64 yearsChildren 3-9 years
0.34 - 0.410.96 - 1.11
0.37 - 0.450.96 - 1.09
0.18 - 0.260.40 - 0.54
1.46 - 1.531.91 - 2.07
1.59 - 1.683.53 - 3.70
0.99 - 1.061.92 - 2.06
Klenow et al. 2013(PERFOOD project)
Major contributors vary with country but include fish and other seafood, fruit and products, meat and products, eggs, vegetables and products
25

Country Date Population Mean/median PFOS dietary exposure#
ng/kg bw/day
High (P95)PFOS dietary exposure#
ng/kg bw/day
Reference Comment
Norway 3
2013
Adults 18-64 yearsChildren 3-9 years
0.09 - 0.150.08 - 0.21
0.34 - 0.400.32 - 0.45
Sweden 2010
All (per capita food consumption data)
0.86 - 1.44 Vestergren et al. 2012
Major contributor was fish and other seafood
Spain 2012
Children 6-9 yearsAdolescents 10-19 yearsAdults 20-65 yearsElderly > 65 years
4.24 - 4.481.57 - 1.651.80 - 2.261.92 - 2.29
Domingo et al. 2012
Regions other than EuropeCanada 200
712-65 years, per capita data
4^PFOS plus perfluorinated carboxylates
Tittlemier et al. 2007
Approximately 44% estimated dietary exposure from PFOS, 28% PFOA, 28% other
China 2012
All (range across 6 provinces), NNS data
0.04 - 0.69 Wu at al 2012 Dietary exposure reported only from consumption of seafood
Korea 2014
Adults, NNS data 0.47 - 3.03 Heo et al. 2014
* Estimated dietary exposure derived for countries with food consumption data for each age group and may not be all 13 countries (eg data for two countries only for infants)# Where range is given, it is from minimum lower bound (LB) to maximum upper bound (UB) estimated dietary exposure across all countries in EU with food consumption data for that age group.^ Applied average bodyweight of 62 kg to total estimated dietary exposure for PFOS and perfluorinated carboxylates (PFOA, PFNA).
26

Table 10. Estimated dietary exposure to PFOA
Country Date Population Mean/median PFOA dietary exposure#
ng/kg bw/day
High (P95)PFOA dietary exposure #
ng/kg bw/day
Reference Comment
EUROPEEurope(data UK, Germany)
2008
All 2 (indicative)1 - 11.61 - 70
6 (indicative) EFSA 2008German Total diet studyUK Total Diet Study
Europe(13 countries, ≥2 day records)*
2012
InfantsToddlersOther childrenAdolescentsAdultsElderlyVery elderly
0.16 - 110.20 - 170.10 - 130.07 - 5.40.08 - 4.30.11 - 4.30.10 - 4.1
0.46 - 150.44 - 320.28 - 200.20 - 100.22 - 7.70.21 - 7.20.19 - 5.9
EFSA 2012 Major contributors were fish and other seafood, fruit and fruit products, eggs and egg products and drinking water across all age groups (LB model)
France 2011
Adult general populationHigh seafood consumersPregnant women (coastal)Pregnant women (other)
0.00 - 0.741.16 - 2.060.10 - 1.520.01 - 0.82
0.00 - 1.53.83 - 5.860.19 - 2.410.01 - 1.53
Yamanda et al. 2014
Major contributor was fish and other seafood, esp freshwater fish
Belgium 2012
Children 3- 5 yearsAdults ≥ 21 years
20.1 6.1
31.5 9.6
Cornelis et al. 2012
Major contributors were fruit, vegetables, potatoes, fish and other seafood
Belgium
Czech Rep
2013
201
Adults 18-64 yearsChildren 3-9 years
Adults 18-64 yearsChildren 3-9 years
0.18 - 0.230.28 - 0.39
0.02 - 0.190.04 - 0.33
0.84 - 0.890.85 - 0.97
0.05 - 0.230.12 - 0.42
Klenow et al. 2013(PERFOOD project)
Major contributors vary with country but include alcoholic beverages (adults), fruit and products, vegetables and products, meat and products
27

Country Date Population Mean/median PFOA dietary exposure#
ng/kg bw/day
High (P95)PFOA dietary exposure #
ng/kg bw/day
Reference Comment
Italy
Norway
3
2013
2013
Adults 18-64 yearsChildren 3-9 years
Adults 18-64 yearsChildren 3-9 years
0.13 - 0.200.25 - 0.38
0.08 - 0.110.15 - 0.20
0.32 - 0.390.55 - 0.69
0.18 - 0.210.34 - 0.39
Sweden 2010
All (per capita food consumption data)
0.35 - 0.69 Vestergren et al. 2012
Major contributors were cereals and products, vegetables and products, dairy products
Spain 2012
Children 6-9 yearsAdolescents 10-19 yearsAdults 20-65 yearsElderly > 65 years
4.73 - 19.00.83 - 5.771.55 - 6.371.10 - 5.50
Domingo et al. 2012
Regions other than EuropeChina 201
2All (range across 6 provinces), NNS data
0.008 - 0.914 Wu at al 1012 Dietary exposure reported only from consumption of seafood
Korea 2014
Adults, NNS data 0.17 - 1.68 Heo et al. 2014
* Estimated dietary exposure derived for countries with food consumption data for each age group and may not be all 13 countries (eg data for two countries only for infants)# Where range is given, it is from minimum lower bound (LB) to maximum upper bound (UB) estimated dietary exposure across all countries in EU with food consumption data for that age group.
28
Table 11. Estimated dietary exposure to PFHxS
Country Date Population Mean/median PFHxS dietary exposure#
ng/kg bw/day
High (P95) PFHxS dietary exposure #
ng/kg bw/day
Reference Comment
EUROPEEurope(13 countries, ≥2 day records)*
2012
Adults 20-65 years 0.05 - 1.22 0.13 - 2.25 EFSA 2012 Limited number of food groups with data, UB estimates conservative due to high % non-detects
France 2011
Adult general populationHigh seafood consumersPregnant women (coastal)Pregnant women (other)
0.00 - 0.380.06 - 0.670.02 - 0.870.00 - 0.51
0.00 - 0.70.27 - 1.720.02 - 1.330.01 - 0.98
Yamanda et al. 2014
Major contributor was fish and other seafood, esp freshwater fish
Belgium
Czech Rep
Italy
Norway
2013
2013
2013
2013
Adults 18-64 yearsChildren 3-9 years
Adults 18-64 yearsChildren 3-9 years
Adults 18-64 yearsChildren 3-9 years
Adults 18-64 yearsChildren 3-9 years
0.09 - 0.110.29 - 0.33
0.001 - 0.060.001 - 0.11
0.02 - 0.090.04 - 0.18
0.007 - 0.040.01 - 0.07
0.40 - 0.420.92 - 0.97
0.002 - 0.070.003 - 0.14
0.07 - 0.150.14 - 0.30
0.03 - 0.060.04 - 0.12
Klenow et al. 2013(PERFOOD project)
Major contributors vary with country but include fruit and products, meat and meat products, eggs
Spain 2012
Children 6-9 yearsAdolescents 10-19 yearsAdults 20-65 yearsElderly > 65 years
0.08 – 0.170.02 – 0.040.02 – 0.060.02 – 0.06
Domingo et al. 2012
* Estimated dietary exposure derived for countries with food consumption data for each age group and may not be all 13 countries (eg data for two countries only for infants)# Where range is given, it is from minimum lower bound (LB) to maximum upper bound (UB) estimated dietary exposure across all countries in EU with food consumption data for that age group.
29

5 ReferencesAntignac J-P, Veyrand B, Kadar H, Marchand P, Oleko A, Le Bizec B, Vandentorren S 2013. Occurrence of perfluorinated alkylated substances in breast milk of French women and relation with socio-demographical and clinical parameters: Results of the ELFE pilot study, Chemosphere; 91: 802-808.
Agency for Toxic Substances and Disease Registry (ATSDR) 2015. Public Health Statement: Perfluoroalkyls, EPA, https://www.atsdr.cdc.gov/phs/phs.asp?id=1115&tid=237 (accessed Jan 2017).
Barbarossa A, Gazzotti T, Zironi T, Serraino A, Pagliuca G 2014. Short communication: Monitoring the presence of perfluoroalkyl substances in Italian cow milk, J Dairy Sci; 97: 3339-3343.
Cariou R, Veyrand B, Yamada A, Berrebi A, Zalko D, Durand S, Pollono C, Marchand P, Leblanc JC, Antignac JP, Bizec BL 2015. Perfluoroalkyl acid (PFAA) levels and profiles in breast milk, maternal and cord serum of French women and their newborns, Environ Int; 84: 71-81.
Cornelis C, D’Hollander W, Roosens L, Covaci A, Smolders R, Van Den Heuvel R, Govarts E, Van Campenhout K, Reynders H, Bervoets L 2012. First assessment of population exposure to perfluorinated compounds in Flanders, Belgium, Chemosphere; 86: 308-314.
D’Hollander W, Herzke D, Huber S, Hajslova J, Pulkrabova J, Brambilla G, De Filippis SP, Bervoets L, de Voogt P 2015. Occurrence of perfluorinated alkylated substances in cereals, salt, sweets and fruit items collected in four European countries, Chemosphere; 129: 179-185.
De Felip E, Abballe A, Albano FL, Battista T, Carraro V, Conversano M, Franchini S, Giambanco L, Iacovella N, Ingelido AM, Maiorana A, Maneschi F, Marra V, Mercurio A, Nale R, Nucci B, Panella V, Pirola F, Porpora MG, Procopio E, Suma N, Valentini S, Valsenti L, Vecchiè V 2015. Current exposure of Italian women of reproductive age to PFOS and PFOA: A human biomonitoring study, Chemosphere; 137: 1-8.
Domingo JL 2012a. Human dietary exposure to perfluoroalkyl substances in Catalonia, Spain. Temporal trend, Food Chem; 135: 1575-1582.
Domingo JL, Ericson-Jogsten I, Perello G, Nadal M, Van Bavel B, Karrman A 2012b. Human exposure to perfluorinated compounds in Catalonia, Spain: Contribution of drinking water and fish and shellfish, J Agric Food Chem; 60: 4408-4415.
Domingo JL 2012. Health risks of dietary exposure to perfluorinated compounds, Environment International; 40: 187-195.
enHealth 2016. enHealth Guidance Statements on per- and poly-fluoroalkyl substances, Commonwaleth Department of Health, Canberra, Australia. http://www.health.gov.au/internet/main/publishing.nsf/content/health-pubhlth-publicat-environ.htm
30

European Food Safety Authority (EFSA) 2008. Perfluorooctanoic acid (PFOA) and their salts, Opinion of the Scientific Panel on Contaminants in the Food Chain, The EFSA Journal; 53:1–131.
European Food Safety Authority (EFSA) 2012. Scientific Report of EFSA Perfluoroalkylated substances in food: occurrence and dietary exposure, The EFSA Journal; 10(6): 2743-2798.
Guerranti C, Perra G, Corsolini S, Focardi SE 2013. Pilot study on levels of perfluorooctane sulfonic acid (PFOS) and perfluorooctanoic acid (PFOA) in selected foodstuffs and human milk from Italy, Food Chem; 140 (1-2): 197-203.
Guzmàn MM, Clementini C, Pérez-Cárceles MD, Rejon SJ, Cascone A, Martellini T, Guerranti C, Cincinelli A 2016. Perfluorinated carboxylic acids in human breast milk from Spain and estimation of infant’s daily intake, Sci Total Environ; 544: 595-600.
Heo J-J, Lee J-W, Kim S-K, Oh J-E 2014. Foodstuff analyses show that seafood and water are major perfluoroalkyl acids (PFAAs) sources to humans in Korea, J Hazard Mater; 279: 402-409.
Herzke D, Huber S, Bervoets L, D’Hollander W, Hajslova J, Pulrabova J, Brambilla G, De Filippis SP, Klenow S, Heinmeyer G, de Voogt P 2013. Perfluorinated alkylated substances in vegetables collected in four European countries; occurrence and human exposure estimations, Environ Sci Pollut Res; 20: 7930-7939.
Jain RB 2014. Contribution of diet and other factors to the levels of selected polyfluorinated compounds: Data from NHANES 2003-2008, Int J Environ Health; 217(1): 52-61.
Ji K, Kim S, Kho Y, Sakong J, Paek D, Choi K 2012. Major perfluoroalkyl acid (PFAA) concentrations and influence of food consumption among the general population of Daegu, Korea, Sci Total Environ; 438: 42-48.
Kang H, Choi K, Lee H-S, Kim D-H, Park N-Y, Kim SS, Kho Y 2016. Elevated levels of short carbon-chain PFCAs in breast milk among Korean women: Current status and potential challenges, Environ Res; 148: 351-359.
Klenow S, Heinemeyer G, Brambilla G, Dellatte E, Herzke D, de Voogt P 2013. Dietary exposure to selected perfluoroalkyl acids (PFAAs) in four European regions, Food Addit Contam Part A Chem Anal Control Expo Risk Assess; 30(12): 2141-2151.
Koponen J, Airaksinen R, Hallikainen A, Vuorinen PJ, Mannio J, Kiviranta H 2014. Perfluoroalkyl acids in various edible Baltic, freshwater, and farmed fish in Finland, Chemosphere; 129: 186-191.
Lorenzo M, Farré M, Blasco C, Onghena M, Pico Y, Barcelo D 2016. Perfluoroalkyl substances in breast milk, infant formula and baby food from Valencian Community (Spain), Environmental Nanotechnology, Monitoring and Management; 6: 108-115.
Munschy C, Marchand P. Venisseau A, Veyrand B, Zendong Z 2013. Levels and trends of the emerging contaminants HBCDs (hexabromocyclododecanes) and PFCs (perfluorinated compounds) in marine shellfish along French coasts, Chemosphere; 91(2): 233-240.
Tittlemier SA, Pepper K, Seymour C, Moisey J, Bronson R, Cao X-L, Dabeka RW 2007. Dietary exposure of Canadians to perfluorinated carboxylates and perfluorooctane sulfonate
31

via consumption of meat, fish, fast foods, and food items prepared in their packaging, Journal of Agricultural and Food Chemistry; 55: 3203–3210.
Vassiliadou I, Costopoulou D, Kalogeropoulos N, Karavoltsos S, Sakellari A, Zafeiraki E, Dassenakis M, Leondiadis L 2015. Levels of perfluorinated compounds in raw and cooked Mediterranean finfish and shellfish, Chemosphere; 127: 117-126.
Vestergren R, Berger U, Glynn A, Cousins IT 2012. Dietary exposure to perfluoroalkyl acids for the Swedish population in 1999, 2005 and 2010, Environ Int; 49: 120-127.
Wu, Y, Wang Y, Li J, Zhao Y, Guo F, Liu J, Cai Z 2012. Perfluorinated compounds in seafood from coastal areas in China, Environ Int; 42: 67-71.
Yamada A, Bemrah N, Veyrand B, Pollono C, Merlo M, Desvignes V, Sirot V, Marchand P, Berrebi A, Cariou R, Antignac JP, Le Bizec B, Leblanc JC (2014). Dietary exposure to perfluoroalkyl acids of specific French adult sub-populations: High seafood consumers, high freshwater fish consumers and pregnant women, Sci Total Environ; 491-492: 170-175.
Yukiko F, Yan J, Harada KH, Hitomi T, Yang H., Wang, P., Koizumi, A. (2012) Levels and profiles of long-chain perfluorinated carboxylic acids in human breast milk and infant formulas in East Asia. Chemosphere; 86(3): 315-21.
Zafeiraki E, Vassiliadou I, Costopoulou D, Leondiadis L, Shaft HA, Hoogenboom RLAP, van Leeuwen SPJ 2016a. Perfluoroalkylated substances edible livers of farm animals including depuration behaviour in young sheep fed with contaminated grass, Chemosphere; 156: 280-285.
Zafeiraki E, Costopoulou D, Vassiliadou I, Leondiadis L, Dassenakis E, Hoogenboom RLAP, van Leeuwen SPJ 2016b. Perfluoroalkylated substances (PFASs) in home and commercially produced chicken eggs from the Netherlands and Greece, Chemosphere; 144: 2106-2112.
32