siteresources.worldbank.orgsiteresources.worldbank.org/INTMNAREGTOPENVIRONMENT/... · Web...
108
THE SOCIAL AND ECONOMIC IMPACTS OF MOBILE SOURCE POLLUTION ON PUBLIC HEALTH IN GREATER BEIRUT, LEBANON 1 PHASE I 1. INTRODUCTION 1.1 Motivation The distribution of pollutants across regions and their effects on economic activity have been the subject of many studies. Research indicates that pollutants impose a wide range of adverse effects on economic activity, directly or indirectly, through variety of channels. Numerous studies confirm the existence of a close association between health, as measured by mortality and morbidity rates, and air pollution. 2 Health problems associated with exposure to pollutants often necessitate expenditures on health care, absence from work, and, in extreme cases, cause permanent disability or death. A review of the literature reveals that approximately four percent of the death rate in the United States can be attributed to air pollution. 3 Pollutants can also have damaging effects on materials and vegetation through influencing deterioration rates of materials and agricultural productivity of land. 4 Finally, pollutants impose aesthetic damages ranging from reduced atmospheric visibility to reduced property values. 5 1 The MedPolicies Initiative would like to thank Lamia Chaamas and Sanaa Sairawan, former METAP National Focal Points for Lebanon, for their support of the case study. Special thanks also goes to Salpie Djoundourian, Iman Nuwayhid, and Farid Chaaban who served as the case study lead analysts and authors of the report for the Lebanese Center for Policy Studies (LCPS), as well as to Rosie Nasser who served as the LCPS project manager during Phase I (1998-1999). 2 See Lave (1972), Lave and Seskin (1970); Liu and Yu (1976); Ostro (1983); Krupnick, Harrington and Ostro (1990); and Wilson and Spengler (1996). 3 See Wilson and Spengler (1996). 4 For a comprehensive review of the literature, see Liu and Yu (1976). 5 For property value studies, see: Anderson and Crocker (1971); Freeman (1974); Nelson (1979); Frankel (1985, 1991); Kohlase (1991); and Greenburg and Hughes (1992). 103
Transcript of siteresources.worldbank.orgsiteresources.worldbank.org/INTMNAREGTOPENVIRONMENT/... · Web...
THE SOCIAL AND ECONOMIC IMPACTS OFMOBILE SOURCE POLLUTION ON PUBLIC HEALTH IN
GREATER BEIRUT, LEBANON1
PHASE I
1. INTRODUCTION
1.1 Motivation
The distribution of pollutants across regions and their effects on economic activity have been the subject of many studies. Research indicates that pollutants impose a wide range of adverse effects on economic activity, directly or indirectly, through variety of channels. Numerous studies confirm the existence of a close association between health, as measured by mortality and morbidity rates, and air pollution.2 Health problems associated with exposure to pollutants often necessitate expenditures on health care, absence from work, and, in extreme cases, cause permanent disability or death. A review of the literature reveals that approximately four percent of the death rate in the United States can be attributed to air pollution.3
Pollutants can also have damaging effects on materials and vegetation through influencing deterioration rates of materials and agricultural productivity of land.4 Finally, pollutants impose aesthetic damages ranging from reduced atmospheric visibility to reduced property values.5
Improvements in environmental quality would mean reducing the magnitude of these adverse effects. Investigation of the quantitative significance of these effects is integral to the formulation and implementation of environmental policies aimed at improving quality of life.
1.2 Objectives of the Study
Considering the growing concern over environmental quality deterioration in Lebanon, the scarcity of resources competing for different social programs, and the possible welfare implications of reduced environmental amenities, this study investigates the effects of air pollution from mobile
1 The MedPolicies Initiative would like to thank Lamia Chaamas and Sanaa Sairawan, former METAP National Focal Points for Lebanon, for their support of the case study. Special thanks also goes to Salpie Djoundourian, Iman Nuwayhid, and Farid Chaaban who served as the case study lead analysts and authors of the report for the Lebanese Center for Policy Studies (LCPS), as well as to Rosie Nasser who served as the LCPS project manager during Phase I (1998-1999).2 See Lave (1972), Lave and Seskin (1970); Liu and Yu (1976); Ostro (1983); Krupnick, Harrington and Ostro (1990); and Wilson and Spengler (1996).3 See Wilson and Spengler (1996).4 For a comprehensive review of the literature, see Liu and Yu (1976).5 For property value studies, see: Anderson and Crocker (1971); Freeman (1974); Nelson (1979); Frankel (1985, 1991); Kohlase (1991); and Greenburg and Hughes (1992).
103

METAP III MEDPOLICIES INITIATIVE
sources on public health in the Greater Beirut Area (GBA). Towards this end, the following research questions are raised:
How serious an economic and social problem is air pollution from mobile sources in Beirut?
What is the impact of air pollution on health? What is the total annual social cost of air pollution on health in Beirut? What are the policy options available for mitigating mobile source
pollution?1.3 Methodology
In order to investigate the effects of air pollution from mobile sources on public health, a three-step multidisciplinary effort is carried:
Step 1: Measurement and modeling of air pollution due to motor vehicles in GBA
Collect data on ambient air quality. Estimate mobile source emission rate and total emissions for:
Particulates (PM10) Carbon monoxide (CO) Nitrogen Oxides (NOx) Hydrocarbons (HC) Lead (Pb)
Estimate the levels of secondary pollutants formed: Ozone
Step 2: Determination of the quantitative relationship between pollutants and public health
Obtain concentration/response functions that link levels of ambient air pollution to health damage.
Step 3: Estimation of the effects of air pollution on public health in Beirut
Gather data on human health. Mortality Morbidity
Assess the magnitude and value of health damages due to existing levels of ambient air quality. Cost of premature death Cost of illness
Estimate the monetary benefits to the society from changes in the level of air pollution. Restoring foregone earnings Reduced cost of illness and treatment
1.4 Choice of Country Case Study Theme Area
104

SOCIAL AND ECONOMIC ASPECTS OF AIR QUALITY
1.4.1 Rationale
Lebanon chose to investigate the economic and social impacts of air pollution from mobile sources on public health in Greater Beirut. Mobile source pollution represents one of the most pressing public health issues facing urban areas in Lebanon. This activity complements several studies funded by the World Bank on the state of the environment in Lebanon.6
Transportation systems, used for moving people and goods, have various socio-economic benefits and significant impacts on the daily life, and in some cases transportation systems are used as living- standard reference index for the degree of development of nations. However, these systems have undesirable impacts on the environment since, in addition to the noise they produce, motor vehicles emit effluents that are involved in a wide variety of chemical, physical, and health impacts on the surroundings.
The transportation sector worldwide has witnessed continuous growth since the turn of the century. In 1950, there were about 53 million cars on the world’s roads; only four decades later, the global car fleet is over 520 million, an almost ten-fold increase. On average, the fleet has grown by about 9.5 million cars per year over this period. It is estimated that up to 37% of total energy consumed is used for transportation purposes and hence its impacts on the environment are being brought to the attention of the public in many countries.
Besides the transportation sector, the power industry, mainly thermal power plants that use fossil fuels, is regarded as a major source of air pollution. Figure 1.1 shows the contribution of the transportation and power sectors to air pollution.
Figure 1.1: Air Pollution Main Sources
6 In fact, one need only be on the road during the peak traffic hours, which are very long in duration, to reach the same conclusion.
105

METAP III MEDPOLICIES INITIATIVE
1.4.2 Background Information
The demand for passenger cars in Lebanon, like in any other community, is affected by many factors including lifestyle, income, labor structure, cost of fuel, and urban development patterns. These parameters have been changing over the past two decades due to the drastic developments, both political and social, that took place in the country. However, confirmed statistics have shown that the size of the transportation sector, particularly personal transport, has been on the increase. As a result, the energy use for transport has been growing and so have the pollution problems caused by the combustion processes inside various types of engines. The increasing demand for fuel for transport in Lebanon is clearly reflected in the statistics on fuel import over the last thirty years as shown in Figure 1.2.
106

SOCIAL AND ECONOMIC ASPECTS OF AIR QUALITY
Figure 1.2: Fuel Imports to Lebanon during the Last Three Decades
In Lebanon, the first car put in use was in 1905, and at the eve of independence in 1943, around 3,400 cars were on roads. This number kept increasing until reaching more than 1,300,000 cars at the end of 1997 according to official figures. Over 50% of the cars operate in the capital city Beirut and its suburbs. This is causing serious traffic and air and noise pollution problems in a densely populated region. Figure 1.3 shows the trend in the number of vehicles operated in the Greater Beirut Area. It should be noted that army vehicles, which account for around 7% of the total number, are not included in these figures.
Figure 1.3: Historical Vehicle Growth in Greater Beirut Area
With an estimated population of around 3.5 million, the car ownership rate in Lebanon is around 0.3 cars/capita which is considerably high in comparison to other countries, even those with higher living standards.
The Lebanese fleet of motor vehicles can be described as being relatively old and poorly maintained. This certainly leads to more emissions of various pollutants than from properly inspected and tuned engines. Other land transport means such as railways are non-existent. Even public transport in urban areas is still in the early stages of rehabilitation.
107

METAP III MEDPOLICIES INITIATIVE
One consequence of this sizeable and poorly- maintained fleet is that most of the urbanized areas in Lebanon have been experiencing serious pollution problems. In fact, available data indicate the potential for significant health problems associated with poor air quality.7
The estimated maximum hourly carbon monoxide concentrations in the vicinity of some main roads during rush hour traffic are likely to approach or exceed WHO guidelines for health.
Total lead emissions from vehicles deposited in the atmosphere may also cause significant health problems.
Over 70% of total NOx emissions are attributed to mobile sources.
Particulate emissions from vehicles are at high enough levels to cause damage to health.
While rush hour traffic contributes most to the general level of pollution in the city, there are several factors to take notice of:
The predominance of passenger cars on the road: A survey of vehicle classification in the GBA, for the period 1991-1996 revealed that about 88% of registered vehicles are passenger cars, 8% are buses and trucks (10 times more trucks than buses), and 4% other types of vehicles such as motorcycles.8
The age distribution of the vehicle fleet: Available data indicate that a significant proportion of the fleet of passenger cars is old. A positively skewed distribution with about 70% of the private car fleet of model 1984 or older.9
Improper maintenance: The car fleet is poorly maintained due to the lack of strict and effective annual checking. This leads to low fuel combustion efficiencies and consequently higher emissions from the exhaust, and higher noise levels.
Vehicle testing system: Although there is a system for vehicle testing which requires that vehicles be serviced and tested each year, this is often done in exchange for cash payments without the owner ever presenting the vehicle for inspection.
The widespread use of leaded gasoline: The leaded gasoline in Lebanon contains high levels of lead ranking among the highest in the world.10
Although unleaded gasoline was introduced in 1993, it represents only 12% of all gasoline consumed.11 The unleaded fuel’s share of
7 The World Bank (1995).8 TEAM International (1996); Dar Al-Handasah (1995).9 Mahmasani (1997).10 The allowable lead content is 0.25 g/liter of leaded gasoline compared to 0.026 g/liter in the United States.11 Mahmasani (1997).
108

SOCIAL AND ECONOMIC ASPECTS OF AIR QUALITY
the market has increased from 8% of the gasoline imported in 1996 to 12% in 1997.
Road network: The conditions of the road network have drastically deteriorated during the war years due to the lack of professional maintenance, illegal encroachment, and lack of technical resources at relevant departments.
Scarcity of parking spaces: Major cities and urbanized regions suffer from the lack of parking lots in commercial as well as residential regions. This is reflected in having cars left along roads sides thus further reducing the already limited area allocated for traffic.
Traffic management: Traffic light signals were completely destroyed in all cities, and especially in Beirut, a matter that led to permanent traffic jams at major intersections. The Government is in the process of re- instating new traffic signals. Meanwhile, the Police Department Traffic brigade that is a part of the Ministry of Interior conducts traffic control.
Tower blocks: Air pollution caused by the transportation sector is excessive in major Lebanese cities than in other countries because tower blocks in which most Lebanese live are situated on both sides of the streets. This leads to high emissions concentration due to the lack of sufficient natural ventilation.
Obviously, many of the problems can be solved via engine modification, fuel switching, gasoline reformulation, and removal of lead from gasoline. There are also great possibilities for using price incentives to help switch from the more polluting to less polluting modes of transport and fuel use.
1.5 Organization of the Report
Chapter 2 of this report presents the types and general effects of pollutants that are emitted from motor vehicles. Chapter 3 presents the sampling processes used to measure the actual levels of pollutants and the models used to estimate the concentration levels of the above listed pollutants. Chapter 4 presents a comprehensive review of the literature pertaining to the relationship between pollutants and public health. The objective of the literature review is to obtain an average concentration/response function that can be used to link the levels of pollution concentration in Beirut to certain health outcomes. Chapter 5 presents estimates of the economic cost of health damages due to pollution from mobile sources. The economic cost includes direct hospitalization costs for treatment from diseases that are provoked by air pollution, cost of absenteeism, and cost of premature death. Chapter 6 presents the full range of policy options available to mitigate mobile source pollution in Lebanon. A discussion of the shortcomings of the study and the agenda for future research in Chapter 7 concludes the report.
2. POLLUTANTS: TYPES AND EFFECTS
109

METAP III MEDPOLICIES INITIATIVE
2.1 Introduction
The complete combustion of fuel inside motor vehicle engines produces mainly carbon dioxide, nitrogen gas, and water. Whereas carbon dioxide contributes to the global warming, the other two products are of minor or no impact on the environment. In practice, however, the combustion is not complete and fuel is partially burnt giving effluents such as hydrocarbons, carbon monoxide, oxides of nitrogen, and carbon in the form of soot. The emission of these gases and particulates from the exhaust into the atmosphere has rather severe impacts on human health and on the environment. The main pollutants emitted or formed from motor vehicles are classified as primary or secondary. The objective of this chapter is to discuss the types and the effects of mobile source pollutants.
2.2 Primary Air Pollutants
The primary pollutants emitted from the transportation sector are particulate matter, oxides of nitrogen, carbon monoxide, carbon dioxide, hydrocarbons, volatile organic compounds, and lead. Most of the following information is extracted from a recent comprehensive review published in 1996.12
Particulate Matter: Particulate matters, or particulates, refer to “a mixture of solid and liquid particles suspended in the air.”13 Particulates emerge from smoke stacks and motor vehicles exhausts and enter the atmosphere in the form of fine solid particles of diameters ranging from 0.002 to 500 m and contain a wide variety of water-soluble and insoluble components.
Typical mass concentrations vary from 10 g/m3 in non-urban areas, to 200 g/m3 in heavily polluted places. Particulates with diameter less than 10 m are of major concern since they are difficult to filter, can penetrate deep into the body, and can settle in the atmosphere so slowly that they become airborne and tend to migrate for long distances before settling into the ground. In 1987, the United States Environmental Protection Agency (USEPA) restricted the National Ambient Air Quality Standards (NAAQS) to the mass concentration of inhalable particles of 10 m aerodynamic diameter or less (PM10). A 24-hour standard was set at 150 g/m3 and an annual 24-hour standard set at 50 g/m3. In 1997, the USEPA revised the 24-hour standard to 65 g/m3.
Studies show that short-term increases in morbidity and mortality following severe air pollution episodes are linked to high concentrations of particles. This is confirmed more recently even with lower concentrations in different countries and cities. Excess deaths, mainly due to respiratory and cardiovascular diseases, are closely associated with levels of particles. This is true using different indicators of particulate pollution: Black Smoke, Total Suspended Particulates (TSP), Coefficient of Haze (COH), particles of 10 m diameter or less (PM10), and particles of 2.5 m diameter or less
12 Bascom et al. (1996a, 1996b).13 Bascom et al., 1996a, p. 28.
110

SOCIAL AND ECONOMIC ASPECTS OF AIR QUALITY
(PM2.5). Particle exposure is associated with increased hospitalization for respiratory illnesses and with other aspects of respiratory morbidity (emergency room visits, respiratory symptoms severe enough to restrict activity, cough, acute changes in pulmonary function tests (PFT), asthma, and increased use of medications). Chronic respiratory health effects, such as chronic obstructive pulmonary disease (COPD), also increase with increases in PM10.
Soot, one kind of particulates, is made of unburned hydrocarbons and carbon and these apparently have no direct impact on health. However, when combined with nitrogen oxides in the presence of sunlight, they are transformed into photochemical smog.
The specific biologic mechanisms for increases in mortality and morbidity are not clear. Toxic effects of particulates may be determined by the physical and chemical nature of the particle itself, and by the physics of its deposition and distribution in the respiratory tract.
Oxides of Nitrogen: Oxygen reacts with nitrogen under high temperature combustion to produce different nitrogen oxides, mainly nitrous oxide (NO) that is transformed into nitrogen dioxide (NO2). NO2 is a brown color gas obtained from the oxidation of NO. It attacks the hemoglobin that carry O2
to the blood. It causes material corrosion and may react with hydrocarbons in the presence of sunlight to produce photochemical smog. Typical emission rate is 2.5 g/km and this value increases with increasing speed. NO2 is highly reactive and it is the precursor to the formation of ozone (O3). However, unlike O3, NO2 exposure at near-ambient levels (< 2 ppm) does not cause a significant influx of poly-morphonuclear cells (PMN) into the airways and alveoli, i.e., it causes less lung inflammation. Nitrogen dioxide has an oxidative capability and interacts with the lower bronchial airways. However, the evidence for its effect on pulmonary function tests (PFT) and airway reactivity is not very strong.
A few studies report a decrement in PFT after exposure to low concentrations of NO2 during exercise but not at rest. Asthmatics and subjects with COPD are more susceptible than normal individuals, especially the former. Decreased immunity and preponderance to infections is reported in a few animal, but not clinical, studies.
As for respiratory illnesses, one study reports more of them in a residential area with high exposure to NO2. However, no exposure gradient response is detected. Another study shows increased bronchitis among children living for 2 or 3 years in intermediate and high exposure areas, but illnesses can not be attributed unequivocally to NO2. Residence in homes with gas stoves are shown in one study to be associated with an increase in the frequency of respiratory symptoms and of respiratory illnesses in children of 2 or less years of age, but a prospective study that compares the respiratory health of people who own gas versus electric stoves reports no consistent trends.
111

METAP III MEDPOLICIES INITIATIVE
The Harvard Six Cities study reports a monotonic increase in respiratory symptoms (shortness of breath with wheezes, chronic wheezes, cough, phlegm, and bronchitis) with increase in NO2, but other studies report less striking findings.
Carbon Monoxide: Carbon monoxide (CO) is the most abundant of all pollutants emitted from the transportation sector. It is a colorless, odorless, and tasteless, but a very poisonous gas that results from the incomplete combustion of carbon-containing fuels. Up to 75% of CO emissions to the atmosphere comes from motor vehicles. CO is regarded as localized pollutant that has high concentrations in areas of heavy traffic and closed spaces such as underground parking areas and tunnels. Typical emission rates for CO are in the range of 35 g/km for an average size motor vehicle, and are found to decrease with increasing engine speed.
CO has a high affinity for oxygen carrying ferrous heme proteins (Hemoglobin (Hgb) and Myoglobin (Mygb)). CO impact on human health can be briefed as follows: oxygen, when inhaled, reacts with hemoglobin, the gas-transporting pigment of the red cells, to produce oxyhemoglobin (HbO2), which is then carried and distributed for cell respiration. The regenerated hemoglobin is used for more O2 transport. Carbon monoxide is quickly absorbed by these hemoglobins to produce carboxyhemoglobin (COHb), a more stable compound, thus reducing its oxygen-carrying capacity. CO exposure is evaluated in terms of the resulting COHb. The current National Ambient Air Quality Standard (NAAQS) in the United States is 9 ppm averaged over an 8 hour period and 35 ppm over 1 hour. Equilibrium with the 9 ppm 8-h NAAQS would not cause COHb levels to exceed 2% in normal non-smokers.
Patients with ischemic cardiovascular diseases (CVD) are particularly sensitive to CO. This is expected to be associated with increased angina, decreased time to onset of angina, impaired exercise capacity, cardiac arrhythmia, and myocardial infarction. Response is heterogeneous and not consistent across all studies.
Although occupational exposure to CO has been associated with small but statistically significant changes in Forced Expiratory Volume at one second (FEV1) and Forced Vital Capacity (FVC), the same has not been true for urban exposures. Perception and motor skills are affected with acute exposure (COHb > 5%). Finally, low birth weight and increased fetal and neonatal mortality are associated with exposure to CO as shown in maternal cigarette smoking studies. Fewer studies investigate the impact of CO on morbidity or mortality of newborns.
Carbon Dioxide: Carbon dioxide (CO2) is mainly produced from burning fossil fuels and from deforestation. On its own, it is not toxic and has no damaging effect on vegetation. Yet, when accumulated in high concentrations in the atmosphere it causes the greenhouse effect, a phenomenon that refers to the increase in the temperature of the earth, the most discussed of the long-term effects of air pollution.
112

SOCIAL AND ECONOMIC ASPECTS OF AIR QUALITY
Hydrocarbons: The five most abundant of hydrocarbons (HC) in urban air are isopentane, n-butane, toluene propane and ethane. Each of these compounds has unburned gasoline as their primary source. In the presence of sunlight, hydrocarbons react with ozone, nitrogen oxides, and other components of polluted air to form compounds that are hazardous to plants, animals, and humans. A significant portion of HCs released to the atmosphere is released from mobile sources, with light-duty motor vehicles accounting for approximately 75% of such emissions. HC emissions from motor vehicles result from both evaporative losses and incomplete combustion. Typical HC emissions rate is in the range of 5 g/km, this rate decreases with increasing engine speed. HCs are not emitted only from the exhaust, but also are released from the carburetor and from the pressure relief valve of the fuel tank. HCs cause eye irritation experienced in photochemical smog.
Volatile Organic Compounds: Volatile organic compounds, commonly known as VOCs, are synthetic liquids and even solids that contain organic carbon and hydrogen in addition to other elements such as oxygen, nitrogen, and sulfur. Their volatility is due to their instant evaporation when exposed to air at room temperature. Their emission sources are various static and mobile combustion processes as well as other sources such as spray paints, solvents, and others. Their presence in the atmosphere contributes to the formation of photochemical oxidants like ozone and smog. VOCs are widely used in liquid fuels such as propane, jet fuel, and benzene. Up to 35% of VOC emissions from motor vehicles are due to the evaporation from fuel tank, carburetor, and crankcase.
Lead: Lead is one of the most toxic metals even in low concentrations in the atmosphere or inside the human body. The main source of lead found in air is the transportation sector since tetraethyl lead ((C2H5)4Pb) is used in most gasoline types as an antiknock agent. Leaded fuel especially in urban areas contributes by about 80% of lead artificial emissions. Lead concentration in exhaust emissions is lower while driving along highways than those emitted from driving in urban areas. Lead emission rates also depend on the type, size, and operating conditions of the engine and the fuel. Catalytic converters, used to convert effluents into less damaging compounds, are quickly rendered inoperable with leaded fuels, so essentially all new cars are set to run on unleaded fuel.
When inhaled, lead is absorbed in the blood stream and transported to all parts of the body. Although significant amounts of lead may be found in the blood and soft tissues, it tends to accumulate in the bones, where it is immobilized. The first noticeable physiological effects of lead exposure appear to occur at blood levels of 10 g/dl blood. The occupational blood level standard is 30 g/dl.
The toxic effects of lead have been widely studied. Very high blood lead levels (above 70 g/dl) have been associated with encephalopathy, coma, and death. At lower concentrations, other neurological deficits, including foot and wrist drop, and anemia are identified. Low blood lead
113

METAP III MEDPOLICIES INITIATIVE
concentration is mostly associated with non-specific symptoms, such as headache, nausea, lethargy, and nervousness;14 hence, unless volunteered, it is rarely suspected by general practitioners.15 Fortunately, critical and fatal lead poisoning cases among children and adults are gradually being eliminated in most countries. However, recent studies have reported a real effect of lead on children’s cognitive abilities, even at low blood levels (>10 g/dl). School performance and intelligent quotients (IQ) are reported to be lower in children exposed to lead than in those less exposed.
Needleman et al. (1979) were among the first to document a significantly lower intelligence score among children with high lead levels compared to those with low lead levels (102.1 vs. 106.6 on the full-scale IQ). This was further confirmed in a prospective study that showed that the IQ score dropped 4.4 to 5.3 points when the average blood lead concentration increased from 10 g/dl to 30 g/dl.16 In another prospective study, deficits in intellectual and academic performance at age 10 years were associated with slightly elevated blood lead levels at the age of 2.17 Similar neuropsychological effects among adults forced health agencies to reconsider the problem.18 Consequently, the Center for Disease Control and Prevention (CDC) in the United States has recommended, since October 1991, a blood lead level of not more than 10 g/dl among children of 1 to 6 years of age;19 a significant drop from 25 g/dl a decade ago.
Leaded gasoline is reported as the main source of environmental pollution with lead. For example, the mean blood lead concentration of the general population was around 14-15 g/dl in the mid-seventies in the United States. After the prohibition of leaded gasoline, the mean blood lead concentration level gradually dropped to much less than 10 g/dl.20
2.3 Secondary Air Pollutants
Primary pollutants in the atmosphere can undergo further chemical or physical reactions to produce secondary pollutants that may have different properties. The mostly recognized secondary pollutants are:
Photochemical Smog: Photochemical smog is produced from the chemical reaction between nitrogen oxides and hydrocarbons in the presence of sunlight. At ground levels, ozone (O3) is the most abundant of all photochemical smog which results from the downward diffusion of stratospheric ozone and from a chain of reactions that are initiated by the dissociation of nitrogen dioxide in the presence of sunlight.
The current NAAQS in the United States recommends that the concentration of ozone should not exceed 0.12 ppm averaged over 1 hour
14 Keogh (1992).15 Balestra (1991).16 Baghurst et al (1992).17 Grandjean (1990).18 Grandjean (1990), Grandjean, Lyngbye, and Henson (1991), Ehle and Mckee (1990).19 CDC (1991).20 Brody et al. (1994), Pirkle et al. (1994).
114

SOCIAL AND ECONOMIC ASPECTS OF AIR QUALITY
for more than 3 times in 3 years. Ozone is believed to be a potent oxidant that reacts with a variety of extracellular and intracellular biomolecules. It acts by producing free radicals or toxic intermediate products and mostly at the bronchoalveolar junction and alveolar macrophages.
The health effects of ozone on individuals is heterogeneous, differing between individuals and within the same individual under different situations. It is a lung irritant and exposure to it is associated with several respiratory effects that include cough and substernal chest pain, decrease in PFT such as FEV1 and FVC, substantial airway injury, and pulmonary edema. These findings are observed in animals and among humans of different ages both under controlled environment (controlled exposure) and in population studies. An increase in acute respiratory hospital admissions is associated with the increase in ozone concentration.
Although the evidence in humans is not strong, exposure to ozone, even at low levels, is suspected to be associated with altered macrophage function (decreased immunity) and consequently an increase in the frequency of respiratory illnesses.
The literature is still controversial regarding the genotoxic effects of ozone.
115

METAP III MEDPOLICIES INITIATIVE
Acid Rain: Acid rain is formed when sulfur dioxide (SO2) reacts with O2
and water in the atmosphere to produce sulfuric acid in diluted form. This reaction is very slow and therefore the formation of acid can take place at distant locations from the source, it can be speeded up by the presence of moisture and humidity in the atmosphere where more active oxidizing agents such as ozone and hydrogen peroxide (H2O2) are found. It is unlikely, however, that it will be an issue in Lebanon since the soils are mostly of alkaline nature and have sufficient capacity to absorb acidic components.
Acid Fog: Acid fog results from the combination of sulfuric acid, from the acid rain, with water vapor near the ground. The produced acid vapors then begin to condense around small particles of fog thus picking up more water vapor from the surrounding humid air and turning it into acid fog. When fog evaporates due to sunlight only drops of pure sulfuric acid H2SO4
are left behind. Acid fog could be 100 times as acidic as acid rain.
Table 2.1 shows a list of major air pollutants emitted from the transportation sector, their sources, and impacts.
Table 2.1: Sources and Impacts of Air PollutantsPOLLUTANT CAUSE EFFECTS
Particulates, PM10
(Fumes, dust, etc.)fuel combustion - damage to respiratory system
- damage to vegetation- corrosion
Carbon monoxide (CO)
Incomplete fuel combustion - blocks oxygen transport to body tissues. (HBO2 ® COHb)
Carbon dioxide (CO2) complete fuel combustion - green house effect, and global warming
Nitrogen oxides (NOx) combination of N2 and O2 during combustion processes.
- eye and lung irritation- forms acid rain
Ozone (O3) reaction of NOx with HC in the presence of sunlight
- respiratory irritation- eye and nose irritation
HC and VOC liquid and unburned fuels - eye and respiratory irritation- photochemical smog
Lead (Pb) lead-containing fuel - severe toxic effect on human bodies- lower IQ in children
3. AIR POLLUTION DUE TO MOBILE SOURCES IN BEIRUT: MONITORING AND SAMPLING
3.1 Introduction
Air pollution monitoring and sampling provide information about the state of the environment such as ambient air quality, effectiveness of various mitigation measures, or effects of accidents. To conduct air quality control it is necessary to provide one of various monitoring processes that, though of wide varieties and sensitivities, can be classified into two main groups:
1. Continuous techniques for monitoring, which usually involve automatic unmanned operations and are usually very expensive. Such techniques are yet to be implemented in Lebanon; and
116

SOCIAL AND ECONOMIC ASPECTS OF AIR QUALITY
2. Non-continuous techniques for sampling, which usually have lower capital and running costs and are conducted by collecting samples over a standardized period of time under different climatic conditions. Sampling in Lebanon has been limited so far to efforts made by academics.21
21 Chaaban and Ayoub (1996).
117

METAP III MEDPOLICIES INITIATIVE
The monitoring and sampling processes usually involve preparing a sizeable database and processing these data using computer facilities so as to achieve the objectives of the process. For the monitoring and sampling processes to be efficient and accurate the following guidelines are set:
1. Objectives of the study should be clearly and explicitly defined since different objectives, such as surveillance, trend detection, causes and effects, require different sampling processes.
2. The duration and location of the monitoring as well as sampling process should be defined in accordance with the pre-set objectives.
3. Sufficient information about the site should be gathered before starting the sampling process. This may involve weather conditions and wind regimes, site history, and description of the physical environment including data obtained from previous studies.
4. Determination of the sought statistical data plots and summaries to be obtained and consequently to ensure the availability of personnel and computer facilities that would collect and process these data. To be able to compare the results to those obtained by other organizations they should be standardized using established Boyle’s and Charles laws.
5. Process evaluation should be carried out to assess whether the objectives of the study have been met and also to assess the uncertainty and to identify any gaps in knowledge.
The objective of this chapter is to estimate the concentration levels of those pollutants most directly associated with the transport sector. In the absence of air quality monitoring stations to measure the actual ambient air quality, alternative measurements and modeling processes are conducted to estimate pollution levels in major streets of GBA.
3.2 Sampling Results
3.2.1 Particulate Emissions
The dry climate in Lebanon, especially during the hot summer days, results in naturally high dust levels in the atmosphere. Moreover, high concentrations of man-made particulate emissions, from construction projects, in the city of Beirut are also recorded. Movements of motor vehicles on dusty roads and major on-going construction projects contribute as well to the overall particulate levels found in the atmosphere. Similar levels would be found in other major cities and this is mainly attributed to the transportation sector and to some industrial complexes.
A sampling process was conducted at Bliss Street next to the American University of Beirut (AUB) in which particulates levels were recorded over a prolonged period of time and at different atmospheric conditions.
118

SOCIAL AND ECONOMIC ASPECTS OF AIR QUALITY
Sampling was conducted using a high-volume sampler that consists of a blower/motor unit and is designed for continuous 24 hours a day sampling. A sample of the results obtained is presented in Figure 3.1 below. Impacts of road works on Bliss Street are clearly indicated in the figures where high concentration levels, of around 440 g/m3 were obtained during the period in which these works were carried out.
These measurements serve to give a general indication of particulates in streets with traffic capacities three or four times higher than that of Bliss Street. Assuming linear relationship, more congested regions would have particulates concentration levels in excess of 200 g/m3, a dangerously high figure by all standards.
119

METAP III MEDPOLICIES INITIATIVE
Figure 3.1: Particulate Concentration Levels on Bliss Street
3.2.2 Urban Ozone Concentration
A sampling process was conducted to obtain indications of ozone levels in regions with different traffic conditions. For the city of Beirut, the results obtained using simple ozone badges gave some indicated high ozone concentrations particularly during hot summer days, as shown in the results of Figure 3.2.
The contribution of the transportation sector in Beirut to the formation of excessive levels of ozone are clearly indicated in the results obtained on May 11 and 12 1997. On May 11, the Sunday church service was held by the Pope during his visit to Lebanon. On that day, a temporary transportation system was set to carry almost half a million people from the outskirts of Beirut to the Port region where the service was held. Majority of those who did not attend the service stayed at home and followed it on television. As a result, traffic in Beirut was minimal and so was the ozone level recorded on that day. The next day, with traffic getting back to normal, the levels recorded were almost threefold that of the previous day.
According to World Health Organization (WHO) guidelines, ozone concentration levels of 200-300 g/m3 are regarded as moderate, whereas levels between 400-500 g/m3 are described as unhealthy. Levels that exceed 600 g/m3 usually require first alert stage precautions in which some school may be closed, and higher levels may prompt higher alert stages that differ from one country to another.
3.3 Modeling Results
Application of established mathematical models for air pollution estimation is a widely spread approach used in the absence of monitoring technologies as a mean for predicting pollution levels due to specified traffic volumes. These models are also used at the planning stage to examine the impact of
120

SOCIAL AND ECONOMIC ASPECTS OF AIR QUALITY
various mitigation measures. The data of the traffic in different streets of Beirut are taken from a study conducted by TEAM International in 1996.22
22 In this study, a comprehensive database was set on traffic volumes in most major streets in Greater Beirut area. Annex A shows number of cars passing, in both directions, on streets with different traffic capacities. The peak intervals in one of these streets are indicated in Annex A.
121

METAP III MEDPOLICIES INITIATIVE
Figure3.2: Ozone Concentration in Beirut
122
Urban Ozone Concentration
Date23/8/9712/5/9711/5/9724/4/9718/4/977/7/9731/10/9610/8/968/8/96
good
moderate
unhealthy
1st stage alert
700
600
500
400
300
200
100
0
1-hr average(2)
(9)
(8)
(7)
(6)
(5)
(4)
(3)
(1)
Hot summer dayHot summer day in typical villageAfter three days of rainAfter ten days without rainHot day (ADHA holiday)Strong smog in BeirutSunday Pope’s visitMonday-Business as usual (day after) Hot summer day
g/m3
SOCIAL AND ECONOMIC ASPECTS OF AIR QUALITY
Modeling of traffic emissions is a complex multi-variable task since the combustion process depends on many variables such as engine’s type, size, and state. It also relies on the driving mode and type of fuel in addition to other parameters.
The modeling processes for line and area sources implemented in this study takes into considerations the following variables:
1. The road capacity, i.e., the width of the road or highway, which determines the approximate maximum number of rows formed by cars during peak hours;
2. The operation of the motor vehicles, or driving mode, which determines the corresponding exhaust emission levels;
3. The wind direction and speed;4. The atmospheric condition, which is used to determine the adequate
stability classes (A, B, C, D, E, or F); and5. The distance of the recipient from the road or highway.
3.3.1 Line Source Model
The Gaussian line source model is adopted to estimate concentration levels of various pollutants. The computation is based on the following assumptions that serve as input data: an overcast day (class D), distance from the street is 100 m, wind is always perpendicular to the street and set at 5 m/s as an average. Tables 3.1-3.3 show a sample of the results for major streets of GBA.
Table 3.1: Estimated NOx Concentration (g/m3)*
Location Direction AM Peak PM PeakVerdun North 23.8 19.5
South 12.3 14.8Hamra Street West 18.9 19.8Bliss Street West 18.1 20.3Ouzaii North 24.1 21.6Autostrade Antelias North 61.5 70.3
South 79.3 62.6Autostrade Jal El-Dib
North 86.4 100.6
South 98.5 72*NAAQS limit is 100 g/m3 (annual average)
Table 3.2: Estimated HC Concentration (g/m3)*
Location Direction AM Peak PM PeakVerdun North 71.2 58.5
South 37 44.3Hamra Street West 56.6 59.5Bliss Street West 54.3 60.8Ouzaii North 72.1 64.9Autostrade Antelias North 184.2 210.6
South 237.5 187.5Autostrade Jal El-Dib
North 258.7 301
South 294.9 230.6*NAAQS limit is 160 g/m3
Table 3.3: Estimated Lead Concentration (g/m3)*
Location Direction AM Peak PM PeakVerdun North 2.7 2.6
123

METAP III MEDPOLICIES INITIATIVE
South 1.7 2Hamra Street West 2.5 2.6Bliss Street West 2.4 2.7Ouzaii North 3.2 2.8Autostrade Antelias North 8.1 9.3
South 10.5 8.3Autostrade Jal El-Dib
North 11.4 13.3
South 13 10.2*NAAQS limit is 1.5 g/m3 (quarterly average)3.3.2 Area Source Model
The average number of motor vehicles driving daily in Beirut, of 5x4 km2
area, is 400,000 vehicles with average daily trips of 10 km/hr inside Beirut. Computation is conducted using the ‘box model’ for different wind speeds with a mixing height of 100 m, and for a period of one hour. The estimated concentration levels for different pollutants are shown in Figures 3.3-3.6 below.
It should be noted that the levels estimated represent an hourly peak traffic condition, i.e., the worst case scenario. Averaging these levels would take into consideration the following conditions:
1. The daily average, since traffic volumes vary with day hours.2. The day- night average.3. The week average that accounts for the significant drops in traffic
volume in Beirut during the weekend.4. The season average that accounts for the drop during the summer.
Taking all these conditions into consideration, the average traffic volume and consequently emissions would drop to around 40% of the estimated values.
Figure 3.3: Estimated CO Concentration Levels in Beirut
124

SOCIAL AND ECONOMIC ASPECTS OF AIR QUALITY
Figure 3.4: Estimated NOx Concentration Levels in Beirut
Figure 3.5: Estimated HC Concentration Levels in BeirutFigure 3.6: Estimated Lead Concentration Levels in Beirut
A micro scale area source model is used to estimate the level of pollutants on and in the immediate vicinity of Dora Street (one of the most congested streets in Beirut). Around 12,000 cars/hour cross Dora along a length of 1200 m and a width of 12 m at a speed of 10 km/hr. The results obtained for different wind speeds are shown in Figures 3.7-3.9.
Figure 3.7: Estimated CO Levels in Dora
125

METAP III MEDPOLICIES INITIATIVE
126

SOCIAL AND ECONOMIC ASPECTS OF AIR QUALITY
Figure 3.8: Estimated NOx Levels in Dora
Figure 3.9: Estimated Lead Levels in Dora
3.3.3 Emission Quantitative EstimationIn addition to the above modeling, quantitative emission estimation process is conducted using an approach similar to that of the Harvard work.23 In this process, the total emissions in tons/day are calculated from the total number of cars, the average daily trip, and the emission rate of various pollutants at different vehicle speeds. A sample of the results is shown in Figures 3.10-3.12.Figure 3.10: Estimated Daily Petrol NOx Emissions in Beirut
23 Heitzmann (1997).
127

METAP III MEDPOLICIES INITIATIVE
Figure 3.11: Estimated Daily Petrol CO Emissions in Beirut
Figure 3.12: Estimated Daily Petrol HC Emissions in Beirut
3.4 Summary
The sampling results for particulates indicate dangerously high levels in the study area (Bliss Street). Although actual measurements for particulates are not available for other areas in Beirut, the study assumes that the average concentration of particulates in the city is 200 g/m3. Experts in the field actually believe that this is a conservative value for the city as a whole.
Ozone concentration is around 400 g/m3 in Beirut. According to WHO guidelines, ozone concentration levels between 400 and 500 g/m3 are described as unhealthy.
The modeling results for NO2, CO and Pb yield average concentrations higher than the international standards. Table 3.4 presents a summary of the estimated levels of air pollutants in the city of Beirut due to vehicular emissions and compares them to NAAQS limits. Note that the quality of these estimates is directly related to the quality of the available
128

SOCIAL AND ECONOMIC ASPECTS OF AIR QUALITY
information. Given the scarcity of information concerning actual readings, the reported values can be considered at best “rough” estimates of pollutant concentrations in Beirut. These estimated average concentration levels are used as the basis for quantifying the health impact.
129

METAP III MEDPOLICIES INITIATIVE
Table 3.4: Estimated Levels of Pollutants in Beirut and the NAAQS Limits Beirut Levels NAAQS Limits
Particulates 200 g/m3 50 g/m3 (annual avg.)
Ozone 400 g/m3 235 g/m3 (1-hour avg.)
Nitrogen dioxide 12-100 g/m3 (line model) 100 g/m3 (annual avg.)
1000 g/m3 (box model)
Carbon monoxide 30 mg/m3 (box model) 10 mg/m3 (8-hour avg.)
Lead 1.7-13.3 g/m3 (line model) 1.5 g/m3 (quarterly avg.) 14 g/m3 (box model)
4. ADVERSE HEALTH IMPACTS OF AIR POLLUTION: A REVIEW OF THE LITERATURE
4.1 Introduction
There is no consensus on what is meant by adverse health effects of air pollution. These could range from nuisance and aesthetic disturbances (including pungent odor and dirt) to severe health outcomes such as premature mortality and disability. The level of concern (cut-off point) is not a straightforward or simple scientific decision; it is rather an arduous societal decision that addresses the social, economical, technological, and political price for the risk deemed “accepted.” The American Thoracic Society (ATS), for example, suggests guidelines for what constitutes an adverse respiratory health effect. ATS defines adverse respiratory health effects as “medically significant physiological or pathological changes generally evidenced by one or more of the following: 1) interference with the normal activity of the affected person or persons, 2) episodic respiratory illness, 3) incapacitating illness, 4) permanent respiratory injury, and/or 5) progressive respiratory dysfunction.”24 The same source also lists the following health outcomes in order of severity:
Increased mortality Increased incidence of cancer Increased frequency of symptomatic asthmatic attacks Increased exacerbation of disease in persons with chronic
cardiopulmonary or other diseases (reflected as less coping/ increased hospitalization/ increased emergency visits/ increased medications/ decreased pulmonary function)
Reduction in Forced Expiratory Volume at 1 second (FEV1) and Forced Vital Capacity (FVC) associated with clinical symptoms
Increased prevalence of wheezing in the chest Increased prevalence or incidence of chest tightness Increased prevalence or incidence of cough/phlegm production
requiring medical attention
24 American Thoracic Society (1985), p. 666.
130

SOCIAL AND ECONOMIC ASPECTS OF AIR QUALITY
Increased incidence of acute upper respiratory tract infections that interfere with normal activity
Acute upper respiratory tract infections that do not interfere with normal activity
Eye, nose, and throat irritation that may interfere with normal activity Odors
131

METAP III MEDPOLICIES INITIATIVE
Keeping the above list in mind, this chapter will limit itself to the more severe outcomes (mortality, respiratory and cardiovascular diseases, and hospital and emergency room admissions). The review will focus more on respiratory health effects.
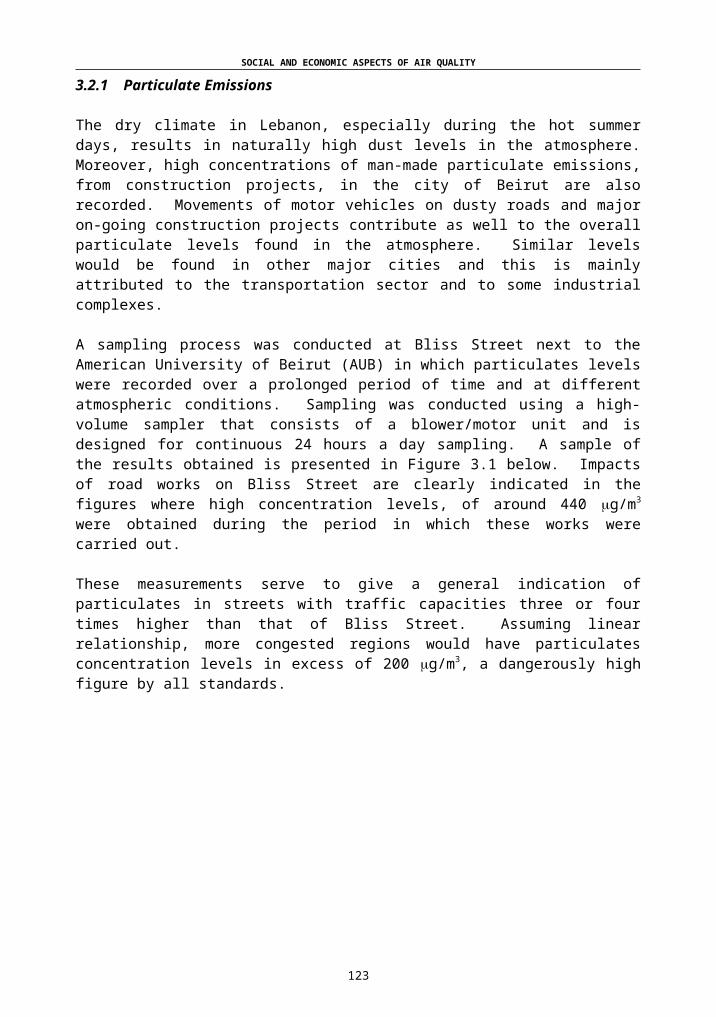
4.2 Impact of Air Pollution on Mortality and Morbidity
Epidemiological studies of the health impact of air pollution in general or selected air pollutants have a very similar methodology. In essence, the researchers would identify the level of air pollution in different geographical areas (cities, counties) or in a specific geographical area over time and attempt to link it to an identified health outcome. Indicators for air pollution included the above air pollutants singly or in combination.25
As for health outcomes, these ranged from reported symptoms to absence from school to measured PFTs to emergency visits to hospital admissions to mortality. Most studies focused on respiratory diseases as a cause of mortality or morbidity followed by cardiovascular diseases. Recent studies developed complex statistical analyses to deal with the daily variations of both exposure and outcome indicators and to adjust for other confounders, especially weather elements.
4.2.1 Mortality
Ostro (1993) reviewed studies up to that date to examine the association between particulate matter and mortality. He limited his review to properly designed and analyzed studies that adjusted for other pollutants and weather variables. He reported a consistent finding across different studies linking particulate matter to mortality. The mean increase in mortality for an increase of 10 g/m3 in PM10 was reported as 0.96% with a range that varied between 0.31% and 1.49%. A dose-response relationship between PM10 concentration and mortality was noted.
Dockery et al. (1993) conducted a prospective follow-up study of the mortality status of more than 8,000 adults (white subjects, 25-74 years of age) for 14-16 years starting in 1974. The association between mortality experience and exposure to air pollutants (TSP, SO2, O3, suspended sulfates) was investigated after adjusting for personal characteristics and habits. A positive association between the two was observed. A clear dose-response relationship was also detected. The mortality risk gradually increased from the least polluted to the most polluted areas. Mortality risk increased 26% (95% confidence interval (CI) 8-47%) between the least polluted (e.g., 11 g/m3 of fine particles) and the most polluted (e.g., 29.6 g/m3 of fine particles) areas. Air pollution was positively associated with death from lung cancer and cardiopulmonary diseases.
Schwartz (1993) examined the association between inhalable air particles (PM10) and daily deaths of the residents of the Birmingham, Alabama,
25 Lead was excluded from the list of the pollutants because it is not linked to hospital admissions or mortality, but to mental function and IQ, which is difficult to assess in this study.
132

SOCIAL AND ECONOMIC ASPECTS OF AIR QUALITY
metropolitan area. A monotonic relation was detected between 24-hour average PM10 level and daily mortality with no evidence for a threshold down to concentration of 20 g/m3. The risk of dying increased by 11% (2-20%) for a 100 g/m3 increase in PM10.
Schwartz (1994a) contrasted the death experiences on the 5% of the days with the highest particulate air pollution (average 141 g/m3) and the 5% of the days with the lowest particulate air pollution (47 g/m3) during the years 1973-1980 in Philadelphia. The risk of death increased by 8% on the high pollution days. It was highest for COPD with a 25% increase and pneumonia with a 13% increase. These associations were more evident for the elderly group.
Schwartz (1994b) conducted a meta-analysis of about 12 studies that investigated the association between air particulate levels and daily mortality. Airborne particle concentration was a significant risk factor for elevated mortality; the risk of mortality increases by 6% (5-7%) for a 100 g/m3 increase in TSP concentration. Weather conditions, which differed between the areas of the different studies, did not affect the relationship.
Pope et al. (1995) followed more than 500,000 adults (> 30 years old) men and women living in 151 U.S. metropolitan areas between 1982 and 1989 to identify their living status. The mean concentration for 1980 of sulfates and the median concentration for 1979-1983 of particulate matter were used as indicators of exposure to air pollution. Mortality risk was adjusted for age, race, smoking, occupation, education, alcohol intake, and body mass index. Regression coefficients for mortality rates were 10.5 (standard error (SE) 1.3) deaths per year per 100,000 persons per g/m3 of sulfate and 8.0 (SE 1.4) deaths per year per 100,000 persons per g/m3 of fine particulate pollution. A difference of 15-17% between mortality risks in the most as compared to the least polluted areas was detected.
Borja-Aburto et al. (1997) examined the association between air pollution (Ozone, TSP, PM10, SO2, CO; with emphasis on ozone exposure) and daily mortality in Mexico City for the 3-year period of 1990-1992. For a 100 ppb increase in daily maximum 1-hour ozone exposure, total mortality increased by 2.4% (1.1-3.9%), respiratory mortality by 2.3% (0-6.7%) and cardiovascular mortality by 3.6% (0.6-6.6%). When adjusted for TSP, the association between ozone and total mortality and respiratory mortality disappeared, while that for ozone and cardiovascular mortality was reduced to 2.4% (-0.4-9.6%) for cardiovascular mortality. Only TSP had a noteworthy independent effect, with excess mortality increasing 5.8% (3.3-8.3%) per 100 g/m3.
Kelsall et al. (1997) examined the association between TSP and mortality in Philadelphia, after adjusting for other air pollutants (SO2, NO2, CO, O3) and weather conditions for the period 1974-1988. The means of current and previous days’ levels of TSP, SO2, and O3 had statistically significant effects on total mortality. An excess of 1.04% in mortality (-0.03-2.10%) was detected for an increase of 34.5 g/m3 of TSP, 1.08% excess in mortality
133

METAP III MEDPOLICIES INITIATIVE
(0.14-2.02%) for an increase of 12.9 ppb of SO2, and a 1.95% excess in mortality (0.71-3.19%) for an increase of 20.2 ppb in ozone level.
Choi et al. (1997) examined the link between lung cancer mortality in different regions of Japan (grouped into 3 blocks) and air pollution (NO2, SO2, motor vehicle emissions) between 1970 and 1990. In two blocks, an association was observed between adjusted death rate from lung cancer and levels of NO2 and motor vehicle density, but only among females. However, the regional differences in the age-adjusted lung cancer death rates were best explained by nitrogen dioxide and temperature. A 20-30% increase was detected especially for the combined effect of temperature and nitrogen dioxide.
4.2.2 Morbidity
4.2.2.1 Hospitalization
Bates and Sizto (1987) investigated the association between air pollution and hospital admissions in Southern Ontario for the years 1974 to 1980. Air pollution data (O3, SO2, NO2, COH, and SO4) were collected from 17 air sampling stations, while hospital data were collected from 79 acute care hospitals. In a multiple regression analysis, up to 12% of the variance in respiratory admissions in the summer was accounted for by the SO4, O3, and temperature variables. When high-ozone days were compared to low-ozone days, it was noted that hospital admissions increased approximately 7% on the former days.Pope (1989) reported his observations in Utah Valley with respect to hospital admissions for respiratory illnesses and PM10 levels. TSP (including PM10) and CO were monitored. The county experienced improvements with respect to carbon monoxide pollution in 1980s. The same is not true for particulates where the pollution levels remained constant between 1979 and 1985. The average annual geometric mean from 1979-85 for TSP at one station was 65 g/m3. The 24-hr TSP standard of 260 g/m3 was exceeded as many as 10-18 times per year. The primary source of fine particulate pollution as measured by PM10 was a steel mill. When in operation it emits 82% of all industrial sources of PM10. Health data were collected from 1985 to 1988. There was considerable variability in PM10 levels in the county over the study period. When the 24-hour PM10
standard of 150 g/m3 occurred, the number of admissions for children (0-17 years of age) was nearly triple the number of admissions for months with no exceedances. In adults, admissions were approximately 44% higher during the months when exceedances occurred. During months when the arithmetic mean PM10 levels were equal to or greater than 50 g/m3, children admissions were nearly double than when the average PM10
levels less than 50 g/m3. Adult admissions increased by approximately 46%. Total monthly admissions increased by 0.119 (SE 0.11) for each 1 g/m3 in PM10 mean and by 0.339 (SE 0.11) for each 1 g/m3 increase in lagged PM10 mean, mostly affecting children.
134

SOCIAL AND ECONOMIC ASPECTS OF AIR QUALITY
Pope (1991) repeated the same study after expanding the area and extending the study period. Again they observed that average hospital admissions for bronchitis and asthma were substantially higher when the steel mill was open than when it was closed. Monthly admissions increased between 0.0308 (SE 0.043) and 0.1890 (SE 0.28) for each 1 g/m3 increase in mean PM10 and between -0.0116 (SE 0.035) and 0.8047 (SE 0.28) for each 1 g/m3 increase in lagged mean PM10.
Ponka (1991) investigated the correlation between hospital admissions for asthma and ambient levels of different air pollutants, in addition to meteorological measures over a 3 year period (1987-1989) in the city of Helsinki. An average of 3.84 cases of asthma were admitted to hospital per day. The ambient air concentrations of all pollutants were much below the national standard. Asthma admissions were significantly correlated with ambient air concentration of NO2, NO, SO2, CO, O3, and TSP. After adjusting for other pollutants and weather conditions, it was found that NO and O3 were most strongly associated with asthma problems. The mean daily number of admissions for asthma was also shown to increase in the high as compared to the low pollution days. For example, the number of daily admissions was 3.64 on days with mean TSP concentration of 42.3 g/m3 as compared to 4.28 admissions on high pollution days with mean TSP concentration of 93.1 g/m3. The number of daily admissions were 3.63 on days with a mean NO2 concentration of 28.1 g/m3 as compared to 4.59 on days with mean NO2 concentration of 45.8 g/m3.
Burnett et al. (1994) investigated the association between relatively low ambient levels of ozone and sulfates in Southern Ontario and hospital admissions for respiratory diseases. Daily ozone and sulfate levels were obtained from 22 sites and 3 monitoring networks, respectively. Hospital admissions for respiratory diseases were extracted for the period of 1983 to 1988 from data on 168 acute care hospitals. Both ozone and sulfates values recorded on the same day and up to 3 days prior to the date of admission were positively associated with hospital admission rates. When the combined effect of ozone and sulfate was considered, adjusting for temperature, the following was detected: a change of 5.3 g/m3 in the daily average sulfate level in ambient air was associated with a 1.4% change in respiratory admissions, whereas a change of 50 ppb in the daily 1-hr maximum ozone level, lagged 0 to 3 days, was associated with a 4.5% change in respiratory admissions. In this study, asthma accounted for 39% of respiratory admissions, COPD for 25%, and infections for 36%. A near linear gradient between exposure and response with no apparent threshold was shown.Thurston et al. (1994) examined the respective roles of particulate matter acidity and mass in hospital admissions for respiratory diseases in Toronto, Ontario. Daily hospital admissions data for July and August of 1986, 1987, and 1988 were obtained from 22 acute care hospitals. Data on aerosol acidity, sulfate ions, hourly ozone, nitrogen dioxide, sulfur dioxide, and daily 24-hr average measurements of particulate matter were also collected. A high correlation was noted between the different pollution variables. For both total respiratory admissions and asthma admissions,
135

METAP III MEDPOLICIES INITIATIVE
the same day ozone level consistently had the highest degree of statistical significance. Total daily hospital admissions increased by 0.036 (± 0.023) to 0.051 (± 0.021) for each increase of 1 ppb in the ozone level. The increase of total asthma admissions was 0.025 (± 0.017) to 0.029 (± 0.013) admissions per day per 1 ppb of ozone. H+ was the only particulate pollution indicator that remained significant when adjusted for ozone and temperature. For the temperature, ozone, and H+ simultaneous models, the resulting mean effect estimate of summertime acid haze pollution was 24% of total respiratory admissions (21 ± 9% for ozone, 3 ± 2% for H+) and 21% of asthma admissions (18 ± 8% for ozone, 3 ± 2% for H+). The ozone association existed even for concentrations below the 120 ppb standard. The association was weaker at concentrations lower than 80 ppb.
Delfino et al. (1994) examined the relationship of daily urgent hospital admission for respiratory illnesses to ambient levels of air pollution for five “May through October” and five “July through August” periods of 1984 to 1988 in the Montreal metropolitan area. Data were collected from 31 acute care hospitals. Pollution elements included ozone, PM10, and SO4. All recorded data were quite below the current permissible standards. Correlation between PM10 three days prior to the admission day and asthma admissions in the May-October periods was significantly positive. For the July-August periods, all respiratory admissions and 8-hr maximum O3 four days prior to the admission were significantly positively correlated. The final regression models revealed that asthma hospital admissions increased by 2.5% over the mean admission level when continuous-scaled PM10 increased by around 1 standard deviation (12 g/m3) 3 days prior to the day of admission. Respiratory non-asthma admissions increased by 9.6% over the mean admission level when SO4 was at or above its ninetieth percentile (8.2 g/m3) 4 days prior to the admission day.
Schwartz (1994c) examined the association between inhalable particles and ozone and hospital admissions for respiratory illness in the elderly (>=65 years) in Detroit, Michigan. Both of PM10 (concurrent day’s air pollution) and ozone (previous day’s air pollution) were significantly associated with hospital admissions for pneumonia. The risk of hospital admissions for pneumonia increased by 1.2% (0.4-1.9%) for every 10 g/m3
increase in PM10 and 2.6% (1.3-4.0%) for every 5 ppb increase in ozone. There was no evidence for a threshold in the quasi-linear dose-response relationship for PM10. The association was less linear for the ozone with little increase in risk below 24-h average of about 25 ppb. Both air pollutants (PM10 and ozone) were also significantly associated with COPD admissions. The risk was higher than for pneumonia: 2.0% (0.4-3.2%) for every 10 g/m3 of PM10 and 2.8% (0.7-4.9%) for every 5 ppb of ozone.
Schwartz (1994d) duplicated the same research protocol in Minneapolis-St. Paul, Minnesota. The findings were similar. Hospital admissions for pneumonia increased 17% (2-33%) for every 100 g/m3 increase in PM10
and 15% (0-36%) for every 50 ppb increase in ozone. As for COPD, hospital admissions increased by 57% (20-106%) for an increase of 100 g/m3 of PM10 but was not associated with an increase in ozone level.
136

SOCIAL AND ECONOMIC ASPECTS OF AIR QUALITY
Schwatrz (1995) examined the association between short-term fluctuations in air pollution (SO2, O3, and PM10) and hospital admissions of the elderly for respiratory disease in two cities (New Haven, Connecticut and Tacoma, Washington). Hospital admissions increased by 6% (0-13%) in New Haven and 10% (3-17%) in Tacoma for a 50 g/m3 increase in PM10. The effects of ozone and SO2 were in the same ranges, and both independent of the PM10
effect but not of each other.
Burnett et al. (1997) examined the association between ozone and hospitalization for respiratory diseases in 16 Canadian cities with diverse climatic, demographic, and environmental profiles. The risk of admission to hospital for respiratory diseases increased by 4.2% (1.2-7.3%) in the spring, 5.0% (2.6-7.4%) in the summer, and 2.8% (0-5.9%) in the fall for a 30 ppb increase in the daily high hour ozone concentration recorded 1 day before admission. Little evidence existed for an ozone effect in the winter. This was true for those younger and older than 65 years of age. Similarly, little evidence of an association between nitrogen dioxide or sulfur oxide and respiratory hospitalizations was observed after adjustment for other elements. However, particulate matter and carbon monoxide were positively associated with respiratory hospitalizations.
Sunyer et al. (1997) examined the association between air pollution (SO2, NOx, O3, and black smoke) and emergency and hospital asthma admissions in four European cities (Barcelona, Helsinki, London, Paris) for the period 1986-1992. For subjects aged 15-64 years, asthma admissions increased by 3.8% (0.8-6.8%) for a 50 g/m3 increase in cumulative NO2
concentration. An increase in asthma admission was detected in association with black smoke (3%) and ozone (3.5%), but the increase was not statistically significant. No increase was seen in association with SO2. However, for subjects under age 15, asthma admissions were associated with SO2 (7.5% increase), black smoke (4.6% increase), and NO2 (3.7% increase) for a 50 g/m3 increase in each. No such relationship was detected for ozone. The increases in asthma admissions were not additive; i.e., they were interdependent.
4.2.2.2 Emergency Visits
Cody et al. (1992) investigated the relationship between ambient ozone levels and emergency visits for asthma in 9 hospitals in New Jersey. Multiple regression analysis showed that temperature and ambient ozone level explained 13% to 15% of the variability in emergency visits for asthma; ozone alone explained less than 7%.
Sunyer et al. (1993) assessed the association between the daily number of emergency room admissions for COPD and daily levels of sulfur dioxide and black smoke in the air of Barcelona during the period of 1985-1989. After adjustment for other factors, an increase of 25 g/m3 in sulfur dioxide produced a change of approximately 6 percent in the number of COPD emergencies during winter and a change of 9% during summer.
137

METAP III MEDPOLICIES INITIATIVE
Particulate pollution (black smoke) showed a similar association in winter but one of lesser magnitude in summer.
Schwartz et al. (1993) examined the association between hospital emergency room visits for asthma and PM10 concentrations in eight hospitals in the Seattle metropolitan area. A strong trend (dose-related increase) was evident by quartiles of PM10 concentration. The risk for emergency asthma increased by 3.7% (1.2-6.4%) for a 10 g/m3 increase in PM10 (4-day average).
Deflino et al. (1997) examined the effects of several air pollutants on emergency room visits for respiratory illnesses in Montreal, Quebec from June to September in 1992 and 1993. For 1993, all pollutants were positively associated with respiratory visits for patients over 64 years of age. An increase of 36 ppb to the mean level of 1-hour maximum O3 was associated with a 21% increase over the mean number of daily ER visits (95% CI 8-34%). The effects of particulates were smaller, with mean increases of 16% (4-28%), 12% (2-21%) and 6% (1-12%) for PM10, PM2.5, and SO4, respectively. It is worth mentioning that both ozone and PM10
levels were well below the NAAQS.
138

SOCIAL AND ECONOMIC ASPECTS OF AIR QUALITY
4.2.2.3 General Complaints
Schwartz et al (1991) investigated the association between short-term exposure to air pollution (SO2, TSP, NO2) and acute respiratory illness among children. Children with croup symptoms and obstructive bronchitis were identified through hospitals and pediatricians for a period of two years. It was found that an increase in TSP levels from 10 g/m3 to 70 g/m3 was associated with a 27% increase in cases of croup. A similar increase in NO2 levels was associated with a 28% increase in cases. Air pollution level was not associated with cases of obstructive bronchitis.
Braun-Fahrlander et al. (1992) investigated whether moderate term (six weeks) exposure to NO2, SO2, and TSP was associated with an increased incidence and duration of respiratory symptoms in preschool children less than five years old. A random sample of 625 Swiss children were chosen between November 1985 and November 1986 from four locations in Switzerland. The families of the children were interviewed then asked to complete a diary form listing all respiratory complaints (day cough, night cough, sore throat, runny nose, fever, earache, breathing difficulty) over a period of six weeks. Both TSP and outdoor NO2 were associated with the duration of any symptom. TSP was associated with the incidence of coughing episodes but less so with upper respiratory symptoms.
Braun-Fahrlander et al. (1997) examined the association between long-term exposure to air pollutants (SO2, NO2, O3, PM10) and respiratory health among 4,470 Swiss schoolchildren (6-14 years old) in 10 communities for the years 1992-93. The strongest relationship was observed between PM10
where children in the most polluted community (33 g/m3) reported chronic cough three times more than the least polluted community (10 g/m3) [odds ratio 3.07; 95% CI 1.62-5.81]. The adjusted odds ratio was 2.88 [95% CI 1.69-4.89] and 2.17 [95% CI 1.21-4.89] for nocturnal dry cough and bronchitis, respectively. A weaker association was observed for the other air pollutants and the distinction of each pollutant’s effect separately was difficult to achieve.
4.3 Summary
Tables 4.1 and 4.2 summarize the main effects of the different air pollutants on mortality and morbidity as reported by epidemiological studies. Since exposure to single air pollutants cannot be controlled and its individual effects cannot be discerned, such studies need to adjust for other types of air pollutants and all potential confounders that could affect exposure or outcome. Hence, the differences reported reflect differences in methodologies, measurements of air pollutants, measurements of health outcomes, and quality of data collected or analyzed among these epidemiological studies. This could over or underestimate the impact of air pollution on health outcomes. Moreover, most studies have focused on single health indices and have “very rarely discuss(ed) the interrelationships between health indices or examine(d) their own finding
139

METAP III MEDPOLICIES INITIATIVE
in relation to other related indices.”26 Bates argued that when increased mortality to air pollution is reported, this means that other health indices such as hospital admissions, emergency visits, and physician visits have also increased.
26 Bates, 1992.
140

SOCIAL AND ECONOMIC ASPECTS OF AIR QUALITY
Table 4.1: Health Impacts of Selected Air PollutantsAIR POLLUTANT Ref. # HEALTH IMPACT
PARTICULATES (PM10)
MORTALITYIncrease of 10 g/m3
region 1 (29.6 g/m3) vs. region 2 (11 g/m3)
increase of 100 g/m3
high (avg. 147 g/m3) vs. low (47 g/m3)
increase of 1 g/m3 (fine particulates)
MORBIDITY>= 150 g/m3 vs. < 150 g/m3
>= 50 g/m3 vs. < 50 g/m3
increase of 1 g/m3
increase of 1 g/m3
increase of 12 g/m3
increase of 10 g/m3
increase of 100 g/m3
increase of 50 g/m3
increase of 10 g/m3
33 g/m3 vs. 10 g/m3
46
24
54
56
51
50
50
50
52
22
58
59
60
55
12
increase of 0.96 (0.31-1.49)% in mortality
increase of 11% in mortality
increase of 26 (8-47)% in risk of mortality
increase of 8% in mortality(highest for COPD & pneumonia)
increase of 8 deaths per year per 100,000 persons
admissions of children tripledadmissions of adults increase by 44%
admissions of children doubledadmissions of adults increase by 46%
total monthly admissions increase 0.119-0.339
total monthly admissions increase 0.02-0.80
increase of 2.5% in overall admissions
increase of 1.2 (0.4-1.9)% in admissions for pneumoniaincrease of 2.0 (0.4-3.2)% in admissions for COPD
increase of 17 (2-33)% in admissions for pneumoniaincrease of 57 (20-106)% in admissions for COPD
increase of 6 (0-13)% in hospital admissions in region 1increase of 10 (3-17)% in hospital admissions in region 2
increase of 3.7 (1.2-6.4)% in emergency cases of asthma
reporting chronic cough triplesreporting nocturnal dry cough doublesreporting bronchitis doubles
PARTICULATES (Black smoke)
MORBIDITYincrease of 50 g/m3
increase of 25 g/m3
62
61
increase of 3% in admissions for asthma (>14 yrs.)increase of 4.6% in admissions for asthma (<14 yrs.)
141

METAP III MEDPOLICIES INITIATIVE
increase of 6% in emergency cases of asthma during the winter
PARTICULATES (TSP)
MORTALITYincrease of 100 g/m3 (meta-analysis)
increase of 100 g/m3
increase of 34.5 g/m3
increase from 10 to 70 g/m3
57
10
34
53
increase of 6 (5-7)% in mortality
increase of 5.8 (3.3-8.3)% in mortality
increase of 1.04 (-0.03-2.1)% in mortality
increase of 27% in cases of croup
142

SOCIAL AND ECONOMIC ASPECTS OF AIR QUALITY
Table 4.1: Health Impacts of Selected Air Pollutants (continued)AIR POLLUTANT Ref. # HEALTH IMPACT
OZONE [1 ppb = 2 g/m3]
MORTALITYincrease of 100 ppb
increase of 20.2 ppb
MORBIDITYincrease of 50 ppb
increase of 1 ppb
increase of 5 ppb
increase of 50 ppb
increase of 50 g/m3
increase of 30 ppb
increase of 50 g/m3
increase of 36 ppb
10
34
14
66
58
59
60
15
62
23
increase of 2.4% in total mortality
increase of 1.95% (0.71-3.17%) in mortality
increase of 4.5% in admissions for respiratory
increase of 0.036-0.051 in total daily hospital admissions
increase of 2.6 (1.3-4)% in admissions for pneumoniaincrease of 2.8 (0.7-4.9)% in admissions for COPD
increase of 15 (0-36)% in hospital admissions for pneumonia
increase of 6-10% in hospital admissions
increase of 2.8-5% in admissions for respiratory(3 seasons)
increase of 3.5% in admissions for asthma
increase of 21% (8-34%) in daily ER visits
NITROGEN DIOXIDE (NO2)[1 ppb = 1,91 g/m3]
MORBIDITYincrease of 50 g/m3
increase from 10 to 60 g/m3
62
53
increase of 28% in cases of croup
increase of 3.8 (0.8-6.8)% in admissions for asthma
SULFUR DIOXIDE (SO2)[1 ppb = 2.66 g/m3]
MORTALITYIncrease of 12.9 ppb
MORBIDITY
Increase of 50 g/m3
increase of 50 g/m3
increase of 25 g/m3
34
60
62
61
increase of 1.08 (0.14-2.02)% in mortality
increase of 6-10% in hospital admissions
increase of 7.5% in admissions for asthma (children)
increase of 6-9% in emergency cases of COPD
143

METAP III MEDPOLICIES INITIATIVE
144

SOCIAL AND ECONOMIC ASPECTS OF AIR QUALITY
Table 4.2: Summary Ranges of Health ImpactsAIR POLLUTANT HEALTH IMPACT
PARTICULATES (PM10)
increase of 10 g/m3
MORTALITYrange of increase 0.31-5.5%
MORBIDITYgeneral hospital admissionsrange of increase 1.2-4.4%
respiratory hospital admissionsrange of increase 0.4-10.6%
PARTICULATES (Black smoke)
increase of 10 g/m3
MORBIDITY
respiratory (asthma) hospital admissionsrange of increase 0.6-1.0%
PARTICULATES (TSP)
increase of 10 g/m3
MORTALITY
increase in 0.3-0.8% in mortalityOZONE [1 ppb = 2 g/m3]
increase of 5 ppb (10 g/m3)
MORTALITYincrease of 0.12-1.0% in total mortality
MORBIDITYGeneral hospital admissionsrange of increase 0.18-0.45%
respiratory hospital admissionsrange of increase 0.5-4.9 %
NITROGEN DIOXIDE (NO2)[1 ppb = 1.91 g/m3]
increase of 50 g/m3
MORBIDITYincrease of 3.8 (0.8-6.8)% in admissions for asthma
SULFUR DIOXIDE (SO2)[1 ppb = 2.66 g/m3]
increase of 10 g/m3
MORTALITYincrease of 0.4-0.7% in mortality
MORBIDITYgeneral hospital admissionsrange of increase 1.2-2.0%
5. ECONOMIC IMPACTS OF AIR POLLUTION ON HEALTH IN BEIRUT
5.1 Introduction
The literature reviewed in the previous section reveals a significant association between health and air pollution. Consequently, any improvement in air quality is associated with improvement in health. However, improvement in air quality can only be brought about by expending resources for pollution control and abatement programs. The question that naturally arises is how much resource need be expended to design economically optimal and politically feasible pollution control programs. Economic theory suggests that a pollution control policy is optimal if the marginal benefits due to abatement are matched by the marginal expenditures incurred to implement the control.
145

METAP III MEDPOLICIES INITIATIVE
Benefit valuation is essential for comparing physical effects with each other and with costs. Values are usually measured in terms of how much of one-asset individuals are willing to sacrifice in order to obtain another. Information about the number of lives saved and illnesses prevented is desirable for efficient resource allocation among competing uses, such as allocation of resources for air quality management programs versus other investment opportunities. Knowledge of the economic cost or monetary value of mortality and morbidity effects would give the society a better perspective on the choices involved. Many would oppose this kind of quantification on the grounds that it dehumanizes life, which is supposed to have an infinite value. In practice, however, society places values on human life and illnesses as reflected by the choices made in day to day safety and health decisions.
The objective of this section is to quantify the impacts of air pollution on health in Beirut. In order to estimate damages associated with air pollution, the analysis addresses the effects of air pollution on human health through mortality and morbidity effects. Health impacts are expressed in both physical (numbers or counts) and monetary (dollar values) terms for statistical lives lost to premature death, hospital admissions, chronic disease cases, emergency room admissions, and days of restricted activity due to hospitalization for various diseases. The estimates will be based on the information presented in the previous two sections as well as primary information compiled from various surveys on morbidity, mortality, and cost of treatment for the various diseases under consideration.
The following section presents the concentration-response relationship used in the analysis. Section 5.3 presents the estimated physical and economic cost of health impacts of air pollutants.
5.2 Concentration Response Relationship
The review of the literature on the impact of air pollution on mortality and morbidity yields a wide range of health response values. For the purposes of this study, we concentrate on the impact of particulates on health since many studies indicate that particulates may be the most serious pollutants in urban areas. Moreover, it is well recognized that particulates represent a convenient index for all major damaging pollutants. To minimize over-inflation or duplication of numbers, the PM10 is used as an overall indicator of air pollution especially that this has been suggested by more than one expert. Hence, excess mortality and morbidity is computed for each g/m3
increase in the air concentration of PM10.27 Consequently, estimates are more conservative and avoid double counting of cases that could be caused by concurrent exposure to more than one air pollutant.
Assumptions employed in the current study are the following:
27 In fact, non-accidental death rates tend to rise and fall with daily levels of particulates, but not with other pollutants; Walsh (1993), p 111.
146

SOCIAL AND ECONOMIC ASPECTS OF AIR QUALITY
1. Reviewed studies are of similar quality and need not be weighted for difference in methodology or sample size.
2. A no-threshold semi-linear dose-response relationship governs the relationship between air pollution and health outcome or indices. Hence, a measured change in the concentration of an air pollutant is linearly associated with the change in a health outcome or index.
3. Estimates of mortality and morbidity could be generalized to all of Beirut and Lebanon.
4. Estimates of air pollution could be generalized to all of Beirut and Lebanon.
5. The Lebanese population does not differ from the populations studied in different regions in the world; i.e., no difference in susceptibility or exposure to other interfering factors.
6. The health care practice in Lebanon is similar to that of other populations; i.e., criteria for reporting of symptoms, visiting emergency rooms, or being admitted for management.
Based on the above assumptions, the average concentration response values used in the study are summarized in Table 5.1.
147

METAP III MEDPOLICIES INITIATIVE
Table 5.1: Concentration-Response Values Used in AnalysisIncrease of 10 g/m3 in particulates is associated with: Increase of 1% in total mortality Increase of 2% in total hospital admissions Increase of 2% in hospital respiratory and
cardiovascular admissions Increase of 2% in emergency visits for respiratory
diseases
5.3 Estimates of Excess Mortality and Morbidity Damages due to Air Pollution
In this section, the economic costs of mortality and morbidity are estimated based on the information summarized in Table 5.1. For each constant increase in the air concentration of a specific pollutant, the number of excess total deaths, total hospital admissions, hospital admissions for respiratory and cardiovascular diseases, and emergency visits is calculated. The physical damages are then transformed into estimates of economic costs.
Since Lebanon lacks population-based vital and disease registries, data on mortality and morbidity in Beirut had to be estimated.
5.3.1 Estimated Mortality
The estimated crude mortality rate in Lebanon stands at 8.2 deaths per thousand individuals per year. This estimated rate is extracted from three surveys: 1) a national household survey conducted by the Ministry of Social Affairs in 1996; 2) a national survey conducted by the Directorate of Statistics in 1996; and 3) a follow-up survey conducted by the Faculty of Health Sciences at AUB in 1992-93.28
Assuming that the Lebanese population totals about 3.5 million individuals of whom 1 million are living in Beirut, then the estimated number of deaths per year is 28,700 persons in all of Lebanon and 8,200 persons in Beirut.
Table 5.2 presents the distribution of death in Lebanese households by age and sex.
Table 5.2: Distribution of Death in Lebanese Households (%) Sex\Age 0-9 10-19 20-39 40-59 60-69 70 + Unknow
nMale ( 59.36)
5.54 2.67 9.60 18.31 21.35 37.48 5.07
Female (40.64)
6.50 2.91 4.00 13.30 17.18 51.13 5.00
Total (100.00)
5.93 2.77 7.31 16.27 19.66 43.03 5.03
Source: Compiled from the Population and Housing Survey 1996, Ministry of Social Affairs, Beirut, Lebanon.
28 The adjusted mortality rate is estimated by Prem Saxena, and conveyed to the authors by personal communication.
148

SOCIAL AND ECONOMIC ASPECTS OF AIR QUALITY
5.3.1.1 Estimated Excess Mortality
In this study, excess mortality refers to the increase in deaths resulting from increased contamination in the air. Table 5.1 indicates that an increase of 10 g/m3 in particulates is associated with an increase of 1% in mortality rate. Consequently, the estimated excess number of deaths due to a 10 g/m3 increase in particulates is approximately 80 individuals in Beirut per year.
If a 1% increase in mortality rate (80 deaths) is associated with a 10 g/m3
increase in particulates, then an estimated concentration of 200 g/m3 of particulates (Table 3.4) due to vehicular emissions in the city of Beirut account for an estimated 1,600 excess deaths per year.29,30
Any policy measure that reduces the level of particulates from 200 g/m3 to 190 g/m3 could thus potentially save 80 lives per year. Assuming that the above death distribution in Table 5.2 holds for the Beirut area, and assuming that the same distribution also holds for deaths resulting from pollution, then the number of lives saved from reductions in the level of particulates can be estimated by age and sex. Table 5.3 presents the estimated distribution of saved lives.
Table 5.3: Number of Lives Saved from a g/m3 Reduction in Particulates Sex\Age
0-9 10-19 20-39 40-59 60-69 70 + Unknown
Total
Male 3 1 5 9 10 18 2 48Female 2 1 1 4 6 16 2 32Total 5 2 6 13 16 34 4 80
5.3.1.2 Estimated Mortality Costs
Reductions in particulate levels potentially save lives or reduce the risk of premature death. If 20 g/m3 reduction in particulates potentially saves 160 lives, then the question is how much would society be willing to pay to achieve such an outcome.
Premature mortality affects an individual’s probability of being accessible to future earning opportunities and other non-market leisure activities. One of the more controversial techniques in estimating mortality costs involves equating the value of human life to current monetary value of future productivity lost due to premature mortality. The estimated cost to the society is the product of the number of deaths and the discounted value of an individual’s lifetime productivity, with age and sex taken into account. Such an approach is criticized on the grounds that it fails to value people who choose not to join the labor market or retired people and does not
29 Keeping in mind that the concentration levels are expected conservative values based on the actual minimum measures on Bliss Street.30 We are able to make the statement assuming a linear no threshold relationship.
149

METAP III MEDPOLICIES INITIATIVE
account for the value of non-market leisure activities including personal feelings.
A less controversial approach to valuing human life is based on the concept of the “Value of a Statistical Life” (VOSL). VOSL is usually used to value the monetary benefits of reducing mortality risks. When assessing the benefits of risk reduction using VOSL, what matters is the risk bearing individual’s own willingness to pay for a reduction in the probability of death. For public choices, what matters is the society’s overall willingness to pay for the risk reduction.31 VOSL estimates are usually much higher than an individual’s lifetime earnings.
Several techniques, such as surveys, contingent valuation, and labor market behavior, are used to infer a value for individual’s willingness to pay for a reduction in risk of mortality or injury. Notable among these techniques is observing “compensating wage differentials” in risky occupations. Firms are willing to pay workers higher wages for jobs that pose higher risks. Alternatively, workers demand higher compensations to accept more risky occupations. Therefore, the employment choices individuals make carry with them an implicit valuation of life.
Since Lebanon lacks micro-level information concerning individual workers and their risk-taking behavior at this time, it is quite impossible to empirically estimate the VOSL for the Lebanese worker. The empirical literature on labor market studies is used to infer an implicit value of life. Viscussi (1993) conducts an excellent review of the VOSL estimates. Using 24 principal labor market studies of the implicit value of life, Viscussi reports values between US$600,000 to US$16 million per life, with the majority of the values in the US$3 million to US$7 million range.
The VOSL reflects to a large extent income and wage levels in the country of study. Most of the studies are conducted for the United States and hence need to be adjusted for the income differentials between Lebanon and the United States.
Considering the lowest possible value of life estimate of US$600,000 per person in the United States, and adjusting it for the income differentials between the two countries, the result would be a very conservative Lebanese VOSL of US$59,155 per person.32
The VOSL of US$59,155 is used in the analysis as an estimate of average excess mortality cost.33 Note that the VOSL varies with income, age, sex, education and/or occupation. However, the study assumes that all 31 “What we are purchasing with our tax dollars is not the certainty of survival. Rather, it is the incremental reduction in the probability of an adverse outcome that might otherwise have affected some random member of our community. What is at stake is consequently statistical lives, not certain lives.” (Viscussi, 1992, p. 19).32 Per capita GNP in Lebanon is US$2,660, while in the United States it is US$26,980 according to the World Bank’s World Development Report 1997.33 Viscussi (1993) suggests US$800,000 as a value of life estimate for workers in high risk jobs and workers in countries outside the United States. Our choice of US$600,000 can be viewed as being overly conservative.
150

SOCIAL AND ECONOMIC ASPECTS OF AIR QUALITY
individuals are valued the same. Note also that a VOSL of US$59,000 is higher than the amount a judge would offer as a compensation for victims of accidents in Lebanon. The average compensation to the families of victims ranges from US$20,000 to US$50,000 depending on various socio-economic factors.
5.3.2 Estimated Morbidity
A comprehensive estimate of morbidity damages is usually comprised of two parts: direct and indirect costs of illness. The direct costs include expenditures for prevention, detection, treatment, rehabilitation, research, and capital investment in medical facilities. The indirect costs, on the other hand, include the loss of output to the economy because of disability and the imputed costs such as opportunities foregone.
The social cost of morbidity in this study is estimated using the total outlays for hospitalization from illnesses that are aggravated by air pollutants and the lost earnings resulting from absenteeism due to hospitalization. Again, the methodology used is subject to the available information. It is wise to note that the cost estimates presented are in no way comprehensive, but are suggestive of the order of magnitude of the effects. Only hospitalized patients are considered in the study and all the conclusions are reached using a sampling process. Estimates are provided on number of hospital admissions and average cost of hospitalization, admissions due to respiratory and cardiovascular ailments and cost of treatment, and emergency room visits and cost per visit in Beirut hospitals. Estimates are also provided for the value of restricted activity days.
5.3.2.1 Total Hospital Admissions
The Ministry of Public Health (MOPH) was contacted to inquire about the number of hospital admissions in Lebanon by age and diagnosis and the average number of days of hospitalization by diagnosis. Unfortunately, most of this information was not available. The MOPH could only provide an estimate of the total number of hospital admissions in Lebanon in the private and public sector with no further breakdown. Hospitals in Lebanon are not required to report detailed discharge summaries to the MOPH.The estimated number of total hospital admissions in Lebanon is 455,000 patients per year. No breakdown by age, sex, or diagnosis is available. It is estimated that about one third of these cases, 150,000 cases, are admitted to hospitals located in Beirut.
To obtain an estimate of hospitalization costs, several hospitals and insurance companies were contacted. The response of the medical community being slow, the study reports estimates obtained from the insurance companies.
The average daily cost of hospitalization, for all diseases, is estimated at US$495.29 +/- $3.81 at the 95% confidence level. The average duration of
151

METAP III MEDPOLICIES INITIATIVE
hospitalization is estimated at 3.32 days +/- 0.0376 days, again at the 95% confidence level.34
The average duration of hospitalization is also an estimate of the average restricted activity days for the individual. The total restricted activity days from all diseases in Beirut is conservatively estimated at 498,000 (150,000 x 3.32) days.
Knowledge of the age, sex and main economic activity of the patient allows one to estimate the total economic loss resulting from being confined to the hospital bed. If the patient is employed, then he or she is not a productive member of the society while hospitalized. Output is lost to the society due to absenteeism. A measure of this loss can be estimated by observing the value of the individual’s productivity. A good measure of one’s productivity is one’s wage rate. If the patient is unemployed, such as a housewife, there is still economic loss associated with hospitalization. Some suggest that the value of the services provided by a housewife can be approximated by the wage of a domestic help. If the patient is a child, then school days are lost; in addition, an adult, who either takes a leave from work or not attend to household duties, usually keeps company of the child while hospitalized. A similar argument is suggested if the patient is an elderly individual.
Since no breakdown by age, sex and profession is available on hospital admissions, the study assumes that the value of a restricted activity day is equivalent to the daily wage of the average income earner. The estimated average annual income for the individual, residing and working in Beirut, is approximately US$9,000 (13,527,000LL @ 1,500LL/US$).35 Accordingly, the average daily wage is estimated at approximately US$34.00 assuming 22 working days per month.
The total value of restricted activity days in Beirut due to hospitalization from all diseases is approximately US$16,932,000 (498,000 days x US$34).
5.3.2.2 Admissions for Respiratory and Cardiovascular Diseases
To estimate the proportion of patients admitted to hospitals in Beirut for respiratory and cardiovascular diseases, three major hospitals were contacted: AUB-Medical Center, Makassed General Hospital, and Saint Georges Greek-Orthodox Hospital.36 Hospitals were requested to provide the following information: the total number of admissions over the last three years, and the total number of admissions and hospital stay for selected diagnosis, with a breakdown by age and sex, if available. The diseases most affected by pollutants include: ischemic heart diseases, 34 The estimated interval is based on the mean bill of approximately 49,000 cases of hospital admissions for various diseases. The source of the information is the portfolio held by MEDNET (a Lebanese health insurance company). The estimated figures are not far off from those reported elsewhere. For instance, An-Nahar newspaper reported that the daily cost of hospitalization is approximately 850,000LL (the equivalent of US$560).35 Central Directorate of Statistics (1998).36 These hospitals were selected for the following reasons: ease of accessibility, being referral centers with big patient loads, and, most importantly, having a well-structured medical records department.
152

SOCIAL AND ECONOMIC ASPECTS OF AIR QUALITY
diseases of pulmonary circulation, acute upper and lower respiratory tract infections, all types of pneumonia, and chronic obstructive pulmonary diseases and allied conditions. A list of diseases with their International Classification of Diseases (ICD)-9 codes was supplied to each hospital. Annex B presents the list of diseases in their priority order.
The information provided by the AUB-Medical Center and Makassed General Hospital form the basis for the analysis.37 Table 5.4 presents a summary of the retrieved information.
Table 5.4: Total Hospital Admissions and Admissions for Selected DiseasesAUB-Medical
CenterMakassed General
HospitalTotal number of admissions in 1996 19,000 9,485Total number of respiratory & cardiac admissions in 1996
3,040 (16%) 1,253 (13.2%)
Distribution of diseases: Chronic obstructive pulmonary diseases
& allied conditions (ICD9: 490-496) All pneumonias (ICD9: 480-486) Acute respiratory conditions (ICD9:
464-466) Ischemic heart disease & diseases of
pulmonary circulation (ICD9: 410-417)
378409
(not available)
2253
17754268
466
The proportion of respiratory and cardiovascular admissions in Beirut is estimated at approximately 15% of total hospital admissions in 1996. This is equivalent to 20,000 admissions per year. Respiratory diseases (ICD9: 490-496, 480-486, 464-466) represent around 37% of total respiratory and cardiovascular admissions. Cardiovascular diseases (ICD9: 410-411) make up the balance with 63%.
Table 5.5 presents the estimated average cost of hospitalization for the respiratory and cardiovascular admissions. The figures are calculated as the product of average daily cost of treatment and the average duration of stay for patients entering the hospital with a specific diagnosis of one of the illnesses listed in Annex B. The procedure used to arrive at an aggregate average figure ignores several important details (such as the class and type of provider) due to difficulties in obtaining such information. The hospitals and the insurance companies were asked to look at samples of discharge forms (the final bill) for the given diagnosis code and calculate the average bill amount. For example, the question we posed to the medical community was the following: if the diagnosis code is 491 (chronic bronchitis), how much does it cost, on average, to treat the case. Given the imperfect nature of the available information, grand averages are calculated for the range of the ICD9 codes specified. Unfortunately, we are unable to attach margins of error to the estimated values. The positive note is that the values are based on a sample of 4,000 and more discharge forms so that the law of large numbers holds.
37 St. Georges Orthodox Hospital just started to use the ICD codes, hence it was difficult to extract the required information.
153

Table 5.5: Average Cost of Hospitalization for Selected DiseasesICD9 Codes Average Duration
of Stay (days) Average Daily Cost(US$)
Total Cost per Stay
(US$)490-496 6.6 261.35 1,724.91480-486 10 207.19 2,071.90464-466 4.5 198.3 892.35410-417 5.8 460.87 2,673.05
5.3.2.3 Emergency Room Visits
The total number of emergency room visits per day is extracted from a project conducted by senior medical students at AUB under Dr. Iman Nuwayhid’s supervision in 1993. In this project, the students reported the number of emergency room visits in the city of Beirut in 1992. They visited the directors of 14 hospitals with active emergency services in administrative Beirut. The emergency room logbooks were manually reviewed in a few of these hospitals to count the number of visits per month; in others, an estimate of daily or monthly visits was provided by the hospital director or the emergency room supervisor.
The estimated emergency room visits in administrative Beirut is between 140,000 to 150,000 cases per year. No breakdown by age, sex, or diagnosis is available.
The average cost of emergency room visit is estimated at US$76.04 based on a sample of 33,600 visits for the period January 1, 1996 to July 31, 1998.38
5.3.2.4 Estimated Excess Morbidity
In this study, excess morbidity refers to the increase in total hospital admissions, admissions for cardiovascular, and respiratory conditions and emergency room visits due to increased contamination in the air. Table 5.1 indicates that an increase of 10 g/m3 in particulates is associated with an average increase of 2% in all three indices.
Consequently, the annual increase in total hospital admissions is estimated at 3,000 patients.
Of the estimated 3,000 excess admissions, 400 are estimated as admissions for respiratory and cardiovascular ailments.
Assuming that the annual emergency room visits are 140,000, the annual increase in these visits is estimated at 2,800 cases.39
5.3.3 Social Cost of Air Pollution in Beirut
38 Source: MedNet Portfolio.39 Note that emergency room visits are not broken down by diagnosis. Therefore, the estimated increase of 2,800 emergency room visits for respiratory diseases may be an overestimated value.
154
Based on the information provided in Table 5.1 and the estimated mortality and morbidity values for Beirut, the annual impact of air pollution as measured by 10 g/m3 concentration of particulates is:
80 excess deaths per year; 3000 hospital admissions, 400 of which represent respiratory and
cardiac conditions; 2,800 emergency room visits; and 14,160 restricted activity days.
The total cost of each 10 g/m3 increase in particulates is estimated at US$10,657,811. Of these, pure medical costs represent approximately US$5.4 million. Table 5.6 presents a breakdown of the estimated annual social cost of air pollution in Beirut.
Consequently, if the level of particulates were reduced by 100 g/m3 to reach the international standard, then the estimated annual savings would be US$106,578,110. The number of lives saved would be 800 a year. Total number of hospital admissions would be reduced by 30,000 a year, respiratory and cardiac admissions would be reduced by 4,000 a year, and emergency visits by 28,000 visits a year.
The estimated social cost of air pollution on health in Beirut presents a conservative minimum figure since only hospitalization expenses were considered. A comprehensive estimate would include the cost of both inpatient and outpatient treatment costs.
Table 5.6: Estimated Annual Social Cost of 10 g/m3 of Particulates in Beirut
Number of personsor cases
Social cost per person(US$)
Total Social Cost(US$)
Premature Mortality 80 $59,155 $4,732,400
Total Hospital Admissions excluding Respiratory and Cardiac Cases
2,600 $1,644.23($495.25/day x
3.32days)
$4,275,343.30
Total Respiratory and Cardiac AdmissionsICD9 Codes: 490-496 480-486 464-466 410-417
400
52 (12.93% of 400)89 (22.15% of 400)
6 (1.6% of 400)253 (63.33% of 400)
$1,724.91$2,071.90$892.35
$2,673.05
$89,695.32$184,399.10$5,354.10
$676,280.64
Emergency Room Visits
2,800 $76.04 $212,912
Restricted Activity Days
14,159.6 days[(2,600 x 3.32) +
2,800 +(52 x 6.6) + (89 x 10)
+
$34.00 $481,426.40
155

METAP III MEDPOLICIES INITIATIVE
(6 x 4.5) + (253 x 5.8)]
Total $10,657,811
6. POLICY OPTIONS FOR ADDRESSING MOBILE SOURCE POLLUTION IN LEBANON
6.1 Mitigation Measures: The State of Knowledge
Over the last two decades a great deal has been learned about reducing emissions from vehicles. Strategies now exist that would lead to lower emissions (technology) and that would reduce actual driving (economic incentives). Many of these strategies offer win-win situations that not only lower pollution, but also bring about substantial economic benefits.
There are several options for mitigating air pollution from mobile sources that Lebanon can implement with relative ease. Most of these options have been proposed and presented to the Lebanese Ministry of Environment. The purpose of compiling them in the current study is simply a matter of presenting a complete document that reflects the state of knowledge and identifies the future needs to assess the feasibility of these options in light with their implications on the health and safety of the Lebanese public.
6.2 Policy Options
The available policy options can be categorized as technical, managerial, financial/pricing, and educational. Note that many of the available options are complementary in nature and a comprehensive plan would have to include many of these policies.
6.2.1 Technical Policy Options
Setting emission standards for new vehicles: Article 35(1) of the Draft Code of Environment of 1998 (yet to be approved by the Parliament) requires establishing national air quality standards.40
This Article is general enough to include emission standards for new vehicles. The standards can be borrowed from automobile manufacturing countries such as the United States, Japan, or the European Union. Since Lebanon does not manufacture automobiles, the only requirement here is to impose import restrictions on vehicles that fail to meet the established emission standards. Lebanon can mandate that vehicles being imported into the country receive a certificate from the country of their origin certifying that they meet the emission standards. In which case, no testing burden is placed on the government.41
Setting and implementing air quality standards: Establish and implement the national air quality standards required by Article 35(1) of the Draft Code of Environment.
40 Annex C presents the respective Article from “The Draft Code of Environment.”41 Walsh (1993).
156

SOCIAL AND ECONOMIC ASPECTS OF AIR QUALITY
Requiring emission control devices: Technological approaches to achieve the desired emission standards may include fitting new vehicles with emission control devices such as catalytic converters or particulate traps or requiring such devices to be retrofitted to existing vehicles. Catalytic converters oxidize HC, CO, and NOx in the exhaust system of the vehicle to render less damaging compounds such as water, nitrogen, and CO2.
Since all vehicles in Lebanon are imported, a restriction on imports of vehicles without three-way catalytic converters (TWC) is relatively easy. Retrofitting of a TWC costs around US$600/vehicle (and is subject to technical difficulties), whereas the cost of the unit in a new vehicle is around US$400-500.42 According to Mahmasani (1997), most new vehicles imported to Lebanon from major car manufacturers are already equipped with converters. The government can require that all new vehicles sold and registered in the country be equipped with TWC. Such a measure can be initiated immediately and is very easy to implement.
Improving road conditions: This is one policy option that Lebanon has embraced. Maintenance of existing roads and construction of new roads, bridges and tunnels are on the way. Once completed, the intensity of traffic jams is expected to decrease.
Improving fuel quality: The major trend worldwide is the gradual replacement of lead in gasoline, both to reduce lead emissions and to facilitate the use of pollution control technologies such as TWC. Fuel reformation by reducing its volatility, increasing oxygen content, reducing aromatics and increasing the use of detergent additives can substantially improve the environmental impacts of gasoline.
The current specifications for leaded fuel in Lebanon allows a maximum tetraethyl lead (TEL) content of 0.15 ml/l in 98 octane fuel (0.40 ml/l in 92 octane). Unleaded 95 octane fuel has a typical lead content of 0.017 ml/l of fuel. This limit (set by the Ministry of Petroleum on importers) translates into an allowable lead content of 0.25 g/l of leaded gasoline (0.66 g/l for 92 octane). The allowable lead content is considered relatively high compared to the United States (0.026 g/l) and Western Europe (0.15 g/l) (Mahmasani, 1997). There are two possible complementary options that Lebanon can use:
1. Reducing the lead content in leaded gasoline: Mahmasani proposes a phase-down program that will reduce the share of leaded fuels (98 octane) to no more than 20% of total consumption within a period of five years.
2. Switching to, or promoting the use of, unleaded gasoline: Standard motor petrol is the prime cause of increasing lead concentration in the atmosphere. In urban areas leaded fuel is
42 However, successful introduction of TWC vehicles requires widely available supplies of unleaded fuel.
157

METAP III MEDPOLICIES INITIATIVE
responsible for up to 65% of the atmospheric concentrations. In the decade following the widespread use of unleaded fuel, the United States recorded an 89% reduction in the airborne lead levels.
The consumption of unleaded fuel is increasing in Lebanon, but remains a small fraction of the total. In 1997, the unleaded fuel’s share in the market was 12% of total fuel consumption. Gas stations frequently run out of unleaded gasoline, basically because of storage problems. Wider introduction of unleaded gasoline requires that stations invest in new/separate tanks for storage. Gas station owners are unlikely to invest unless there is sufficient demand for unleaded fuel.
Alternative fuels: The possibility of substituting cleaner burning fuels for conventional fuel is drawing increased attention. “Alternative fuels include methanol (made from natural gas, coal or biomass); ethanol (made from grain); vegetable oils; compressed natural gas mainly composed of methane; liquefied petroleum gas composed of propane, butane, electricity, and hydrogen; synthetic liquid fuels derived from hydrogenation of coal; and reformulated gasoline and diesel, including oxygenated blends.”43
Lebanese government has been considering the desirability of allowing the import of diesel powered passenger cars with special engines (currently banned) because of their advantage over gasoline-powered vehicles in terms of fuel economy. Diesel engines produce significantly smaller amounts of several pollutants. It is important to note that while diesel engines do not produce any lead, they emit fine particulates.44 The government needs to carefully consider the impacts of such a policy before adopting it.
6.2.2 Management Policy Options
Providing and promoting public transport: The single most valuable program in a comprehensive pollution control plan is a viable and efficient public transport system. Public and private buses, mini-buses, and taxis are available in most areas. However, their number and service hours fall short of satisfying the needs of the commuting public.
Phasing out the “taxi-service”: While the taxi/service system represents a common mode of public transportation, which allows for serving up to five clients along a set route at one time, the taxis cause traffic jams and hazards along the way and move people away from using buses.
43 Walsh (1993), p. 124.44 Mahmasani, 1997.
158

SOCIAL AND ECONOMIC ASPECTS OF AIR QUALITY
Rehabilitating the existing inspection and maintenance program: Vehicle performance significantly affects emissions. Minor malfunctions in the emission control system of a vehicle can increase emissions significantly. Major malfunctions can cause emissions to skyrocket. The old and poorly maintained vehicles that characterize the Lebanese vehicle fleet cause the majority of vehicle-related pollution problems. Effective inspection and maintenance (I/M) programs can identify the problem sources and assure their repair.
A well run I/M program is capable of very significant reductions in emissions. Some studies report emissions reductions in the order of 25% of HC and CO and about 10% of NOx. Lebanon has a vehicle inspection program that requires vehicles to be tested and serviced each year. However, this is often not done since proof of inspection is secured through cash payments (usually at banks) without the owner ever presenting the vehicle for inspection.45
Rehabilitation of the I/M program can be a good pollution-control starting point for Lebanon. Even those vehicles that do not have pollution control devices can benefit from improved maintenance. Rehabilitation of the program must be done in a way to encourage better maintenance of the vehicle. Licenses can be issued to eligible private test/inspection centers to carry out the program. The World Bank proposes that incentives be given to become licensed centers (such as grants for retooling) and harsh penalties for abuse of their license.46
Traffic management: Traffic management measures, such as rehabilitation of traffic light signals and parking restrictions in inner cities, can help reduce traffic congestion and pollution.
The Lebanese government is currently in the process of reinstating new traffic signals, in addition to huge capital investments for road expansions. Both measures are expected to reduce traffic in the long run. Meanwhile, the Police Department Traffic Brigade conducts traffic control in the city. Since the manpower of the Traffic Brigade is not enough, assistance to direct the flow of traffic is obtained from the army, scouts, or other public/civil defense agencies. An alternative short run solution for traffic control would be to arrange traffic flow by changing the direction of roads during heavy traffic times.
Unrestricted parking encourages the use of private vehicles and exacerbates congestion. Parking restrictions in the inner city can prove to be very useful in traffic management. There are several instruments that can be used to restrict/discourage parking in urban areas such as: issuing parking permits for residents, but not commuters; linking permits to occupancy rates; and making permit
45 Just recently, the Government legitimized this reality by establishing a new system for inspection fee payments. Car owners now make the payments at their local banks.46 World Bank (1995).
159

METAP III MEDPOLICIES INITIATIVE
cost a function of occupancy rates. In order to discourage the use of single occupant vehicles, the government could make the cost of payment higher for them or secure fewer spaces for such vehicles. Outright prohibition of parking in certain areas can also help to reduce traffic.47
Reduced workweek: Reducing workweek from 6 to 5 days can also be considered as an alternative traffic management option.
Land use planning: Development plans should include open spaces and green parks as essential parts of projects. The distribution of tower blocks should also be planned such that pollution is not trapped between high-rise buildings.
6.2.3 Pricing Policy Options
Incentives to renew the automobile fleet: Policies that encourage turnover of the fleet or early scrappage of older vehicles have the promise of significant emission reductions. The age distribution of the vehicle fleet in Lebanon is positively skewed with about 70% of the private car fleet of model 1984 or older. In order to encourage ownership of new, more efficient cars, renew the automobile fleet, and reduce pollution several options can be considered:
Lowering import duties on cars equipped with emission control devices. This may be a feasible option since there are no technical constraints for implementation and public support for such a policy option is expected to be very strong. The only concern here is the economic feasibility of such a measure.
Reducing registration fees on certain types of vehicles. For instance, Singapore has special registration fees on what is called “Weekend Cars” (cars operating during off-peak hours, i.e., between 7 pm and 7 am, after 3 pm on Saturdays, and all day on Sundays and public holidays).
Offering an old car scrappage program. This program pays a bounty to owners of older vehicles who turn their vehicles in to be scrapped, thus removing the vehicle’s emissions from the road over what would have been its remaining life-time. California uses this option and considers it as one of the most politically attractive policies that encourage fleet turnover. The program is voluntary and appears to politicians and the public to be low-cost, especially when tax revenues are not used to finance them. Most scrap programs in California so far have been privately financed, usually by companies seeking emissions offsets or relief from other regulations. This option may be feasible if private interests can be identified to fund the program.
47 The mayor of Beirut initiated a new policy that prohibits cars from parking on the sides of the roads. Individuals failing to comply with the regulation are penalized.
160
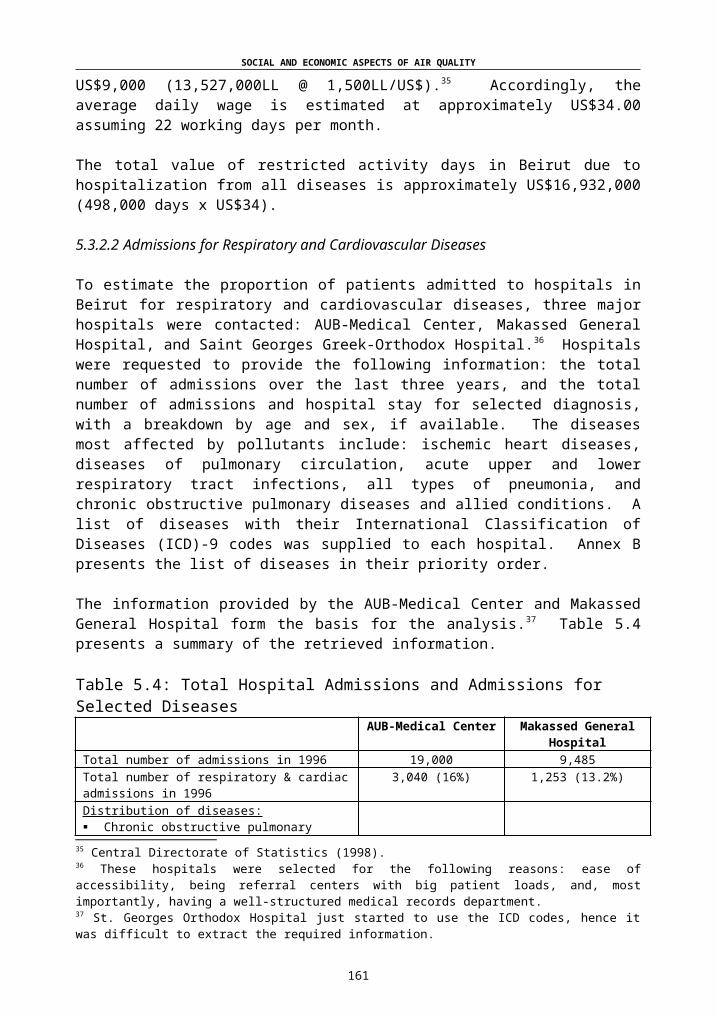
SOCIAL AND ECONOMIC ASPECTS OF AIR QUALITY
Increase taxes on gasoline with preferential treatment for unleaded gasoline: The Ministry of Petroleum regulates the price of gasoline in Lebanon. Currently, the pump price of 98 octane leaded gasoline (super) is the same as that of unleaded and higher than that of regular (92 octane) gasoline. The pump price is determined by the import price of gasoline (which is determined in the international markets) plus the taxes and fees imposed by the government. In most OECD countries, unleaded fuel is priced slightly lower than leaded fuel (tax accounts for 60-66% of pump price compared to 70-75% for leaded fuel) to provide an incentive to use the former.48
In Lebanon, taxes and fees account for around 41% of the pump price of gasoline, up from 24% in 1994. Any attempt to increase the tax rate further is faced with great opposition on the grounds that it is regressive in nature and that the poor bear a disproportionate burden. However, one can argue that the distribution of benefits from reductions in air pollution is also regressive in nature and is pro-poor.
A gasoline tax can be viewed as a penalty for polluting the air or payment for using the air based on the “Polluter Pay Principle.” Higher taxes on gasoline could encourage more efficient vehicle use, promote investment in fuel-efficient cars, and encourage use of public transportation among other things.49 Earmarking the gasoline tax revenues for pollution mitigation efforts, including public transportation, can give the policy some political support.
Road pricing: An annual fee (lump sum tax) for the use of public roads and highways, based on vehicle engine size can be instituted to discourage ownership of large, fuel inefficient, engine vehicles.
Driving Taxes: An annual driving tax, based on distance traveled, could be imposed to discourage driving and promote the use of public transport and carpooling.
Reduced public transport fares: Although a popular policy instrument, public transport rates are already relatively low in Lebanon. In fact, one can buy a bus ticket that can be used as many times as one needs during the day. Cab rates are also regulated.
Transportation allowance: If and when public transport becomes widely available, the government may want to consider substituting monetary transportation allowances with coupons or bus tickets.
6.2.4 Educational Policy Options
Public education programs: Informing the public about the economic and health impacts of pollution are imperative in soliciting positive
48 The World Bank (1995).49 Fuel consumption in older cars is about 11% higher than in newer vehicles.
161
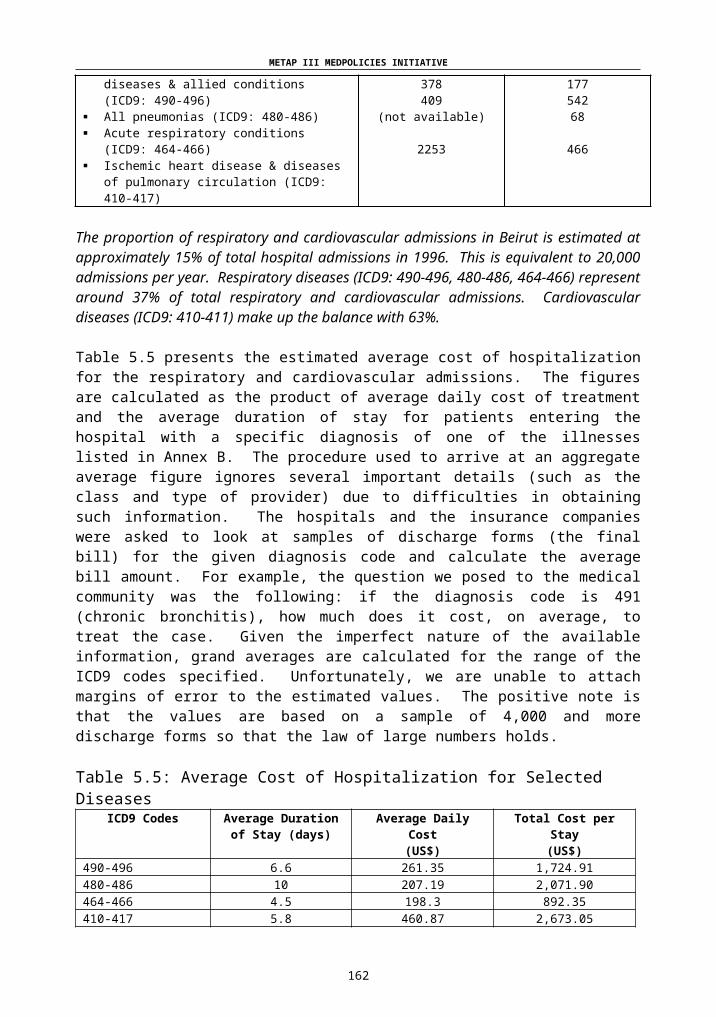
METAP III MEDPOLICIES INITIATIVE
responses to any policy measure. Public awareness campaigns are needed to educate and inform people that, for instance, unleaded gasoline may be used with all automobiles. There are many little things that drivers can do (if informed) to reduce emissions. Following is a list of activities that a well-informed, environmentally conscious driver can voluntarily do:
Carpooling Using public transport Getting rid of excess weight in the car while driving Turning off the engine during traffic congestion Driving less (combine errands into one trip) Walking Biking Telecommuting (work at home).
Introducing such concerns through advertising campaigns (TV, radio, etc.) and in educational programs at all levels will greatly help manage the pollution problem.
Promoting scientific research: Encouraging air quality monitoring and research on the economic and health effects of these pollutants will advance efforts to reduce air pollution. Investment in air quality monitoring stations is a first step towards a better understanding of the state of the environment. Without proper information on ambient air quality, the scientific community will be handicapped in their efforts to quantify the relationship between health and pollution, as evidenced by the problems encountered in this study.
6.3 Concluding Remarks
The main objective of a motor vehicle pollution control program is to reduce emissions to the degree necessary to achieve healthy air quality and to do so at the least possible cost. Achievement of this goal requires a comprehensive strategy encompassing emission standards for new vehicles, cleaner fuels, vehicle maintenance programs, traffic and vehicle demand management and constraints. It is not enough to tighten up standards so that cars emit less pollutants; cars must be made expensive to use rather than to own, whether through taxation, road-pricing or parking fees.
The above options need to be evaluated systematically in terms of technical, cultural, institutional, and economic feasibility to identify the combination that would yield the optimal reduction in emissions for Lebanon.7. CONCLUSION
7.1 Shortcomings of the Study
162
SOCIAL AND ECONOMIC ASPECTS OF AIR QUALITY
This study presents the first attempt to quantify the health impacts of air pollution in Lebanon. The process that allows for such quantification of effects starts with the characterization of emissions, emission transport, and atmospheric concentrations of pollutants, and proceeds with measurements of exposure paths and health effects. At the beginning of this study, it was soon realized that there is no data that allows for the comprehensive estimation of health effects. Lack of data, therefore, presents a real challenge and is the source of the main shortcomings of the study at all stages of analysis.
The absence of air quality monitoring stations represents the first challenge. Without actual measurements of ambient concentration of pollutants, the analysis is already handicapped. The study uses an average concentration of particulates of 200 g/m3 for the city of Beirut based on sampling results from Bliss Street (the only location in the city for which actual readings are available). Congestion and particulate emissions on Bliss Street are probably not representative of the pollution levels across the city. However, they are suggestive of the order of magnitude.
It must be noted that pollution levels vary within the city of Beirut from one street to the next depending on the traffic conditions. They also vary over time. Therefore, aggregating all variation into a point estimate creates a representation problem.
Obviously, the study has several other limitations. Notable among them is the presumption that the relationship between pollution concentration and health outcomes in Beirut is the same as that found in the literature reviewed in the study. There are reasons to believe that this relationship may be different given the characteristics of the Lebanese population. Many factors contribute to the possible differences, among them the smoking, eating and exercising habits of the population, as well as, the preventive measures taken to avoid exposure to pollutants. Unfortunately, none of the studies in the literature review deals with communities that are socially or economically similar to the Lebanese community.
While the study focuses on mobile sources of pollution, there are several other sources such as industrial point sources, power generators, solid waste burning and fires that also contribute to some concentration levels of particulates.
Many factors other than air pollution could also be contributing to excess mortality and excess morbidity. Without properly controlling for the impact of air pollution and other socio-economic factors, it would be difficult to ascertain that the sole cause is air pollution.
The level of aggregation that accompanies the estimation of treatment cost for various diseases represents another shortcoming of the study. The estimated figures may be sensitive to the type of provider, the class of service, the treatment mode, the attending physician, and the hospital.
163

METAP III MEDPOLICIES INITIATIVE
All things considered, in the absence of actual detailed data, our estimates can be thought of at best as rough estimates that provide orders of magnitude regarding costs and impacts.
Future research should employ, if possible, more detailed information on morbidity and mortality rates to limit the biases created by the sampling processes used.
7.2 Agenda for Future Research
The current study raised four research questions and attempted to answer them as scientifically as possible considering the constraints and difficulties discussed throughout the study. A fifth question that could have been asked and should be asked is the following:
What are the economic benefits and costs of the policy options available for mitigating mobile source pollution?
The study could not address this question due to resource constraints, but any future effort in estimating economic impacts of air pollution must tackle this issue.
In addition, any future effort must consider the distributive impact of any proposed policy option on Lebanese society to determine who benefits and who loses from the proposed policy options.
164

SOCIAL AND ECONOMIC ASPECTS OF AIR QUALITY
ANNEX ATABLES
Table 1: Hourly Traffic Flow Rates in Some Streets of BeirutLocation Direction AM Peak Hour PM Peak HourVerdun North 1482 (7:30 – 8:30) 1217 (17:45 –
18:45)South 769 (7:00 - 8:00) 922 (15:45 – 16:45)
Hamra Street West 1177 (11:00 – 12:00) 1238 (18:00 – 19:00)
Bliss Street West 1130 (6:30 – 730) 1266 (18:00 – 19:00)
Ouzaii North 1501 (8:00 – 9:00) 1346 (16:15 – 17:15)
Autostrade Antelias
North 3834 (11:00 – 12:00) 4382 (16:30 – 17:30)
South 4943 (7:00 – 8:00) 3901 (16:15 – 17:15)
Autostrade Jal El Dib
North 5384 (11:00 – 12:00) 6267 (16:00 – 17:00)
South 6137 (6:15 – 7:15) 4800 (16:00 – 17:00)
165

METAP III MEDPOLICIES INITIATIVE
ANNEX BLIST OF DISEASES BY PRIORITY AND ICD-9 CODES
Priority IICD-9 Codes 490-496 Chronic Obstructive Pulmonary Diseases & allied conditions
490 Bronchitis (acute/chronic not specified)491 Chronic Bronchitis492 Emphysema493 Asthma494 Bronchiectasis496 Chronic airway obstruction, not elsewhere
classified
Priority IIICD-9 Codes 480-486 All pneumonias
480 Viral481 Pneumococcal482 Other bacterial483 Other specified organisms484 Infectious diseases classified elsewhere485 Bronchopneumonia486 Pneumonia, not specified
Priority IIIICD-9 Codes 464-466
464 Acute laryngitis and tracheitis465 Acute upper respiratory infections of multiple or
unspecified site466 Acute bronchitis and bronchiolitis
ICD-9 Codes 410-414 Ischemic heart disease410 Acute myocardial infarction411 Other acute and subacute forms412 Old myocardial infarction413 Angina pectoris414 Other forms of chronic ischemic heart disease
ICD-9 Codes 415-417 Diseases of pulmonary circulation415 Acute corpulmonale416 Chronic pulmonary heart disease417 Other diseases of pulmonary circulation
166
SOCIAL AND ECONOMIC ASPECTS OF AIR QUALITY
ANNEX C
REPUBLIC OF LEBANONMINISTRY OF ENVIRONMENT
DRAFT LAW FOR THE PROTECTION OF THE ENVIRONMENT
Article 5: Within the context of the protection of the environment and the management of natural resources, each person, physical or moral, public or private should abide by the following principals:
(1) The principal of precaution according to which incertitude, based on the present scientific and technical knowledge should not delay the adoption of effective and proportional measures aiming at preventing a risk of grave and irreversible harm to the environment at a financially and economically acceptable cost;
(2) The principal of preventive and corrective action, with priority to the source, for all the harm inflicted on the environment using the best available techniques at a reasonable economic cost;
(3) The principal of the “polluter pays,” according to which the polluter should cover the costs of preventive and corrective measures, reduction of pollution, and rehabilitation;
(4) The principal of preservation of biological diversity according to which each activity should avoid having a harmful effect on the various components of the biological diversity;
(5) The principal of non-degradation of natural resources according to which each activity should avoid causing irreversible harm to the natural resources such as water air, soil;
(6) The principal of participation according to which:
(One) each citizen should have access to the information related to the environment within the context of the rules and regulations in effect;
(Two) each citizen or moral person, public or private should strive to safeguard the environment and to contribute to its protection and to denounce all the risks susceptible to harm the environment;
167
METAP III MEDPOLICIES INITIATIVE
(Three) Public or private persons should, in all their activities conform to the same restrictions as far as the protection of the environment is concerned; and
(Four) Each decision, which has a direct or indirect impact, immediate or future, on the environment, should be taken after consultation with the sectors or the parties concerned with the activity or, after a public debate when the activity has a general impact.
168

SOCIAL AND ECONOMIC ASPECTS OF AIR QUALITY
(7) The principal of cooperation according to which public authorities, associations, and citizens compete to protect the environment at all possible levels;
(8) The principal of primacy of customary norm in rural milieu according to which each time an identified local custom is found to be more efficient for the protection of the environment than the written rule, it prevails over the latter;
(9) The principal of integrated control of the environment which aims at preventing pollution resulting from the activities which figure on a list set by the decree referring to Article 18 of the present law. The principal of the integrated control of pollution defines the measures which prevent, or when this is not possible, reduce pollution in the air, soils and water caused by the activities mentioned below, in the hope of reaching a high level of protection of the environment as a whole and to avoid the transfer of a source of pollution from a receptive milieu to another;
(10) The principal of resorting to economic and financial incentives as instruments of control and regulation to eliminate or destroy all sources of pollution and promote a sustainable development policy; and
(11) The principal of using the studies which carry an environmental impact as a tool of planning and management to combat, reduce or minimize all sources of pollution and degradation of natural resources.
Article 17: A decree issued by the Council of Ministers based on the proposition of the Minister of the Environment defines the composition, functions, and prerogatives of the Control Service, the coordination, supervision, follow-up and required qualifications of the controllers and the modalities of exercising their functions.
Article 18: (1) In order to have an integrated control of pollution, the norms and national standards of emission, in addition to the modalities of granting the necessary permits, and the control of their application, is fixed by a decree issued by the Council of Ministers, based on the proposition of the minister in charge of the environment, after consultation with the ministers, administrations and other concerned institutions.
(2) The minister in charge of the environment can, in this respect, rely on any national or international expert to define these norms and national standards, which will be periodically revised taking into consideration scientific and technological progress and the evolution of the norms
169
METAP III MEDPOLICIES INITIATIVE
recognized at an international standard.
(3) The minister in charge of the environment can, in collaboration with the Minister of Finance, undertake any study related to the prices and taxes which fight the usage of pollutants, in order to improve the quality of the products and limit any pressure on natural resources and the spreading of pollution, in conformity with the principals of Article 5 of the present law.
Article 19: (1) A mechanism of evaluating polluting activities is established in order to promote constant improvements of the state of the environment. This mechanism includes, among other things, the implementation among classified establishments, enterprises and other institutions which carry out polluting activities, of environmental management programs for their sites, and means of self supervision and/or environmental audit in order to have an objective and periodic evaluation of the efficiency of the measures of fighting or reducing pollution in addition to informing the public of the results of these measures with regard to the environment;
(2) A decree issued by the Council of Ministers on the proposition of the minister in charge of the environment defines the functioning modalities of the evaluation mechanism of polluting activities and the control measures applied.
Title V: Protection of Environmental Milieu
Chapter I: Protection of the Atmosphere and struggle Against Bad Odors
Article 35: (1) National norms and standards of emission are set to protect the quality of the air in conformity with the provisions of Article 18 of the present law. Nobody is allowed to emit polluting substances in the atmosphere unless it complies with the present law, the texts used for its application and the applied norms and standards.
(2) Any change in the quality of the atmosphere and in its various characteristics susceptible to harm public health, properties and environment in general, and every emission of odors which by nature or by concentration are offensive to the population are forbidden.
Article 36: Any building, industrial, commercial, touristic or handicrafts establishment, any vehicle, or any other movable owned, exploited or possessed by a physical or moral person is built, exploited or used in conformity with the provisions of Article
170

SOCIAL AND ECONOMIC ASPECTS OF AIR QUALITY
35 of the present law.
Article 37: Every person or institution responsible for the emission of polluting substances in the air, breaking the provisions of Article 35 of the present law can be subjected to a warning by the concerned local authorities who will inform the minister in charge of the environment and the concerned ministry. In case this warning doesn’t have any impact within the given time limit, and in the event of an emergency, the minister in charge of the environment can after consultation with the concerned ministry, order the suspension of the activity or the functioning of the installation in question or take the necessary measures against the concerned person or involved institution or recover the expenses from the latter.
Article 38: In order to protect the atmosphere from the pollution and to prevent any further damage to the ozone layer, the minister in charge of the environment, and after consulting with the concerned sectors, takes the necessary measures aiming at:
(1) Forbidding and when it is economically impossible reducing the consumption and emission of substances which harm the ozone layer and contribute to the development of the green house effect which figure on the lists annexed to the internationals conventions ratified by Lebanon;
(2) Developing non-polluting alternative sources of energy and;
(3) Preserving the function of the forests in the absorption of greenhouse effect gas and favor the creation of protected areas for this purpose.
Article 39: The decree mentioned in Article 18 of the present law determines, among other things, the modalities of controlling the application of Articles 35 and 38 of the present law, including the equipment of vehicles, the construction of movable objects and the consumption of fuel and fuel oils, in addition to the cases and conditions in which, because of emergency, the minister in charge of environment takes, with the support of the concerned local authorities, all the necessary executable measures to stop any activity polluting the atmosphere.
171
METAP III MEDPOLICIES INITIATIVE
REFERENCES
American Thoracic Society (ATS). “Guidelines as to What Constitutes an Adverse Respiratory Health Effect, with Special Reference to Epidemiologic Studies of Air Pollution.” Am Rev Respir Dis. 1985, 131, pp. 666-68.
Anderson, Robert J., and Crocker, Thomas D. “Air Pollution and Residential Property Values.” Urban Studies, 1971, Vol. 8, pp. 171-80.
An-Nahar Newspaper. 14 April 1998.
Baghurst, P. A., McMichael, A. L., Wigg, N. R., et al. “Environmental Exposure to Lead and Children’s Intelligence at the Age of Seven Years: The Port Pirie Cohort Study.” New England Journal of Medicine, 1992, 327, pp. 1279-84.
Balestra, D. J. “Adult Chronic Lead Intoxication: A Clinical Review.” Arch Intern Med, 1991, 151, pp. 1718-20.
Bascom, R., Bromberg, P. A., and Costa, D. A. et al. “Health Effects of Outdoor Air Pollution: Part 1.” Am J Respir Crit Care Med. 1996, 153, pp. 3-50.
Bascom, R., Bromberg, P. A., Costa, D. A. et al. “Health Effects of Outdoor Air Pollution: Part 2.” Am J Respir Crit Care Med. 1996, 153, pp. 477-98.
Bates, D. V. and Sizto, R. “Air Pollution and Hospital Admissions in Southern Ontario: The Acid Summer Haze Effect.” Environmental Research, 1987, 43, pp. 317-31.
Bates, D. V. “Health Indices of the Adverse Effects of Air Pollution: The Question of Coherence,” Environmental Research, 1992, 59, pp. 336-49.
Borja-Aburto, V. H., Loomis, D. P., Bangdiwala, S. I., Shy, C. M., Rascon-Pacheco,R. A. “Ozone, Suspended Particulates, and Daily Mortality in Mexico City.” American Journal of Epidemology, 1997, 145, pp. 258-68.
Braun-Fahrlander, C., Ackermann-Liebrich, U., Schwartz, J., Gnehm, H. P., Rutishauser, M., and Wanner, H. U. “Air Pollution and Respiratory Symptoms in Preschool Children.” American Review of Respiratory Diseases, 1992, 145, pp. 42-47.
Braun-Fahrlander, C., Vuille, J. C., Sennhauser, F. H., et al. “Respiratory Health and Long-term Exposure to Air Pollutants in Swiss Schoolchildren.” Am J Respir Crit Care, 1997, 155, pp. 1042-49.
172
SOCIAL AND ECONOMIC ASPECTS OF AIR QUALITY
Brody, D. J., Pirkle, J. L., Kramer, R. A., et al. “Blood Lead Levels in the US Population. Phase I of the Third National Health and Nutrition Examination Survey (NHANES III, 1988 to 1991).” JAMA, 1994, 272, pp. 277-83.
Burnett, R. T., Dales, R. E., Raizenne, M. E., et al. “Effects of Low Ambient Levels of Ozone and Sulfates on the Frequency of Respiratory Admissions to Ontario Hospitals.” Environmental Research, 1994, 65, pp. 172-94.
Burnett, R. T., Brook, J. R., Yung, W. T., et al. “Association Between Ozone and Hospitalization for Respiratory Diseases in 16 Canadian Cities.” Environmental Research, 1997, 72, pp. 24-31.
Center for Disease Control. Preventing Lead Poisoning in Young Children. Atlanta: Centers for Disease Control, 1991.
Central Directorate of Statistics. Statistical Studies: Household Living Conditions in 1997. Beirut: Republic of Lebanon, February 1998, Number 9.
Chaaban, Farid B., and Ayoub, G. M. Data Base for Air and Noise Pollution in Lebanon, Final Report. Beirut: National Council for Scientific Research, June 1996.
Choi, K., Inoue, S., and Shinozaki, R. “Air Pollution, Temperature, and Regional Differences in Lung Cancer Mortality in Japan.” Archives of Environmental Health, 1997, 52(3), pp. 160-68.
Cody, R. P., Weisel, C. P., Birnbaum, G., and Lioy, P. J. “The Effect of Ozone Associated with Summertime Photochemical Smog on the Frequency of Asthma Visits to Hospital Emergency Departments.” Environmental Research, 1992, 58, pp. 184-94.
Dar Al-Handasah. Maintenance & Rehabilitation of Lebanon Road Network. Beirut, 1995.
Delfino, R. J., Becklake, M. R., and Hanley, J. A. “The Relationship of Urgent Hospital Admissions for Respiratory Illnesses to Photochemical Air Pollution Levels in Montreal.” Environmental Research, 1994, 67, pp. 1-19.
Delfino, R. J., Murphy-Moulton, A. M., Burnett, R. T., et al. “Effects of Air Pollution on Emergency Room Visits for Respiratory Illness in Montreal, Quebec.” Am J Respir Crit Care Med., 1997, 155, pp. 568-76.
Dockery, D. W., Pope, III C. A., Xu, X., Spengler, J. D., Ware, J. H., Fay, M. E., Ferris, Jr., B. G., and Speizer, F. E. “An Association Between Air
173

METAP III MEDPOLICIES INITIATIVE
Pollution and Mortality in Six US Cities.” New England Journal of Medicine, 1993, 329, pp. 1753-59.
Ehle, A. L. and Mckee, D. C. “Neuropsychological Effect on Lead in Occupationally Exposed Workers: A Critical Review.” Critical Reviews in Toxicology, 1990, 20, pp. 237-55.
Frankel Marvin. “Amenity Changes, Property Values, and Hedonic Prices in a Closed City.” Journal of Environmental Economics and Management, 1985, Vol. 12, pp. 117-31.
Frankel Marvin. “Aircraft Noise and Residential Property Values: Result of a Survey Study.” The Appraisal Journal, January 1991, Vol. 59, Number 1, pp. 96-110.
Freeman, A. Myrick III. “On Estimating Air Pollution Control Benefits from Land Value Studies.” Journal of Environmental Economics and Management, 1974, Vol. 1, pp. 74-83.
Ghaddar, N. Weather Summary for the Year 1997. Faculty of Engineering, American University of Beirut, 1997.
Grandjean, P. “Widening Perspective of Lead Toxicity. A Review of Health Effects of Lead Exposure in Adults.” Environmental Research, 1990, 17, pp. 303-21.
Grandjean, P., Lyngbye, T., and Hansen, O. N. “Lessons from a Danish Study on Neuropsychological Impairment Related to Lead Exposure.” Environmental Health Perspectives, 1991, 94, pp. 111-15.
Greenburg, M. and Hughes, J. “The Impact of Hazardous Waste Superfund Sites on the Value of Houses Sold in New Jersey.” The Annals of Regional Science, Spring 1992, 26, pp. 147-53.
Heitzmann, M. C. Risk-based Multi-objective Optimization for the Control of Mobile Source Air Pollution: A Framework Methodology for Analyzing Risk Transfer among Exposure, Emissions, and Economic Costs. Ph.D. Thesis, Cambridge: Harvard University, May 1997.
Kelsall, J. E., Samet, J. M., Zeger, S. L., and Xu, J. “Air Pollution and Mortality in Philadelphia, 1974-1988.” American Journal of Epidemiology, 1997, 146(9), pp. 750-62.
Keogh, J. P. “Lead,” in Hazardous Materials Toxicology: Clinical Principles of Environmental Health, eds. J.B. Sullivan and G.R. Krieger. Baltimore: Wilkins and Wilkins, 1992, pp. 834-44.
Kohlase, Janet E. “The Impact of Toxic Waste Sites on Housing Values.” Journal of Urban Economics, 1991, 30, pp. 1-26.
174

SOCIAL AND ECONOMIC ASPECTS OF AIR QUALITY
Krupnick, Alan J., Harrington, Winston, and Ostro, Bart. “Ambient Ozone and Acute Health Effects: Evidence from Daily Data.” Journal of Environmental Economics and Management, 1990, 18, pp. 1-18.
Lave, Lester B. and Seskin, Eugene P. “Air Pollution and Human Health.” Science, 21 August 1970, Vol. 169, pp. 723-33.
Lave, Lester B. “Air Pollution Damages: Some Difficulties in Estimating the Value of Abatement,” in Environmental Quality Analysis, eds. Allen Kneese and Blair T. Bower. Baltimore, MD: John Hopkins University Press, 1972.
Liu, Ben-chieh and Yu, Eden Siu-hung. Air Pollution Damage Functions and Regional Damage Estimates. Westport, CT: Technomic Publishing Co., 1976.
Mahmasani, Hani. Automotive Fuel Strategies for Clean Air in Lebanon: Lead Phasing Out and Diesel Fuel Policy. Sector Implementation Unit-3, September 1997.
MedNet Portfolio. Unpublished Data, 1998.
Ministry of Social Affairs. Population and Housing Survey. Beirut, Lebanon, 1996.
Needleman, H. L., Gunnoe, C. E., Leviton, A., et al. “Deficits in Psychological and Classroom Performance of Children with Elevated Blood Levels.” New England Journal of Medicine, 1979, 300, p. 689.
Nelson, Jon P. “Airport Noise, Location Rent, and the Market for Residential Amenities.” Journal of Environmental Economics and Management, 1979, 6, pp. 320-31.
Ostro, Bart D. “The Effects of Air Pollution on Work Loss and Morbidity.” Journal of Environmental Economics and Management, 1983, 10, pp. 371-82.
Ostro, B. “The Association of Air Pollution and Mortality: Examining the Case for Inference.” Archives of Environmental Health, 1993, 48, pp. 336-42.
Pirkle, J. L., Brody, D. J., Gunter, E. W., et al. “The Decline in Blood Lead Levels in the United States: The National Health and Nutrition Examination Surveys (NHANES).” JAMA, 1994, 272, pp. 284-91.
Ponka, A. “Asthma and Low Level Air Pollution in Helsinki.” Archives of Environmental Health, 1991, 46, pp. 262-70.
Pope, C. A. “Respiratory Disease Associated with Community Air Pollution and a Steel Mill, Utah Valley.” AJPH, 1989, 79(5), pp. 623-28.
175

METAP III MEDPOLICIES INITIATIVE
Pope III, C.A, Thun, M. J., Namboodiri, M. M., Dockery, D. W., Evans, J. S., Speizer, F. E., and Heath, Jr. C. “Particulate Air Pollution as a Predictor of Mortality in a Prospective Study of US Adults.” American Journal of Respiratory and Critical Care Medicine, 1995, 151, pp. 669-74.
Pope, C. A. “Respiratory Hospital Admissions Associated with PM10
Pollution in Utah, Salt Lake, and Cache Valleys.” Archives of Environmental Health, 1991, 46(2), pp. 90-97.
Schwartz, J., Spix, C., Wichmann, H. E., and Malin, E. “Air Pollution and Acute Respiratory Illness in Five German Communities.” Environmental Research, 1991, 56, pp. 1-14.
Schwartz, J. “Air Pollution and Daily Mortality in Birmingham, Alabama.” American Journal of Epidemiology, 1993, 137, pp. 1136-47.
Schwartz, J., Slater, D., Larson, T. V., et al. “Particulate Air Pollution and Hospital Emergency Room Visits for Asthma in Seattle.” Am Rev Respir Dis, 1993, 147, pp. 826-31.
Schwartz, J. “What are People Dying of on High Air Pollution Days? Environmental Research, 1994(a), 64, pp. 26-35.
Schwartz, J. “Air Pollution and Daily Mortality: A Review and Meta Analysis.” Environmental Research, 1994(b), 64, pp. 36-52.
Schwartz, J. “Air Pollution and Hospital Admissions for the Elderly in Detroit, Michigan,” Am J Respir Crit Care Med., 1994 (c), 150, pp. 648-55.
Schwartz, J. “PM10, Ozone, and Hospital Admissions for the Elderly in Minneapolis-St. Paul, Minnesota.” Archives of Environmental Health, 1994 (d), 49(5), pp. 366-74.
Schwartz, J. “Short Term Fluctuations in Air Pollution and Hospital Admissions of the Elderly for Respiratory Disease.” Thorax, 1995, 50, pp. 531-38.
Sunyer, J., Saez, M., Murillo, C., et al. “Air Pollution and Emergency Room Admissions for Chronic Obstructive Pulmonary Disease: A 5-year Study.” American Journal of Epidemiology, 1993, 137(7), pp. 701-705.
Sunyer, J., Spix, C., Quenel, P., et al. “Urban Air Pollution and Emergency Admissions for Asthma in Four European Cities: the APHEA Project.” Thorax, 1997, 52, pp. 760-65.
176

SOCIAL AND ECONOMIC ASPECTS OF AIR QUALITY
TEAM International. Greater Beirut Area Transportation Plan. Report No. 4, Beirut, 1996.
The World Bank, Environmental Resource Fund. Environmental Assessment. ERM Report, 1995.
The World Bank. World Development Report 1997: The State in a Changing World. Oxford University Press, 1997.
Thurston, G. D., Ito, K., Hayes, C. G., et al. “Respiratory Hospital Admissions and Summertime Haze Air Pollution in Toronto, Ontario: Consideration of the Role of Acid Aerosols.” Environmental Research, 1994, 65, pp. 271-90.
Viscussi, Kip W. Fatal Tradeoffs: Public & Private Responsibilities for Risk. Oxford University Press, 1992.
Viscussi, Kip W. “The Value of Risks to Life and Health.” American Economic Review, December 1993, Vol. XXXI, Number 4, pp. 1912-46.
Walsh, Michael. “Theme Paper 2: Motor Vehicle Pollution Control in China: an Urban Challenge.” 1993, pp.105-51.
Wilson and Spengler, eds. Particles in Our Air: Concentrations and Health Effects. Harvard University Press, 1996.
177

METAP III MEDPOLICIES INITIATIVE
178

THE SOCIAL AND ECONOMIC IMPACTS OFMOBILE SOURCE POLLUTION ON PUBLIC HEALTH IN
GREATER BEIRUT, LEBANON:CAPACITY BUILDING AND IDENTIFICATION OF
RECOMMENDATIONS50
AIR QUALITY EXTENSION PROJECT FOR LEBANONPHASE II
1. BACKGROUND
In cooperation with the Ministry of the Environment and with financial support from METAP and the Harvard Institute for International Development (HIID), the Lebanese Center for Policy Studies (LCPS) undertook a five-month project on air-quality policy making. This activity represents Phase II of MedPolicies Initiative activities on air quality in Lebanon. Phase I of the Initiative was implemented under the sponsorship of the LCPS, and focused on the health effects and economic cost of mobile air pollution in the Greater Beirut area. In this context, the LCPS undertook a study and prepared a report entitled, Economic and Social Impact of Mobile Source Pollution on Public Health in Greater Beirut Area. The study investigated the concentration levels of various air pollutants and their effects on public health as well as calculated the total annual cost of air pollution on health in Beirut. It has been revealed that the concentration of such pollutants as Nitrogen Dioxide, Carbon Monoxide, and lead are higher than international standards, and thus could have a direct effect on the health of citizens. The study concludes with a set of technical, managerial, financial, and educational policy options and recommendations for decreasing mobile source pollution.
2. PROJECT OBJECTIVES AND IMPLEMENTATION
In this context, Phase II of the Initiative has built upon the findings of the first phase study with the objective of preparing the ground for needed policy reforms to improve air quality in Lebanon. The aim was to institutionalize air quality policy-making, provide recommendations, and update legislation related to the improvement of air quality.
To achieve those goals, the LCPS invited and engaged a selected group of public officials from the ministries of environment, transport, economy, health, interior, and a number of experts (see Annex A) to participate in four training and discussion sessions. The first two sessions concentrated
50 The MedPolicies Initiative would like to thank Sanaa Sairawan, former METAP National Focal Points for Lebanon, and Naji Kodeih of the Lebanese Ministry of Environment, for their support of the case study extension project. Special thanks also goes to Farid Chaaban who served as the project’s lead analyst and training session trainer and moderator for the Lebanese Center for Policy Studies (LCPS), as well as to Rosie Nasser who served as the LCPS project manager and coordinator of the training program during Phase II (1999-2000).
179

METAP III MEDPOLICIES INITIATIVE
on training the participants by providing them with information on the major concepts and definitions of air toxic emissions, the major sources of air pollution in Lebanon, the social and economic impacts of air-quality, and strategies for mitigation as implemented in developed countries. The last two sessions focused on the formulation of policy recommendations, the factors and the measures needed for the establishment of air quality standards, and the revision and updating of Decree n6603, related to diesel emission standards for buses, and the revision and updating of air quality standards specified in Decision n52/1 (See Annex B) as requested by the Ministry of Environment.
180

SOCIAL AND ECONOMIC ASPECTS OF AIR QUALITY
3. PROJECT RESULTS
The four sessions proved to be beneficial for various reasons. Besides the creation of a network of concerned individuals from different ministries, the sessions provided a forum where the problems of air pollution were discussed from the financial, economic, social, and public health perspectives. The interactive sessions also increased the group’s understanding of the social and economic impacts of air quality, as well as the level of threat of air pollution to public health and social and economic welfare in Lebanon.
Furthermore, the facts, figures and data provided during the sessions enabled some members of the discussion groups to better contribute to policy discussions on air quality issues underway in Parliament. Indeed, data and findings presented to the group was shared with Members of Parliament to help indicate the seriousness and danger of the situation.
Participants of the discussion group agreed that there is a need to reduce car emissions to improve air quality in Beirut. It was also agreed that achievement of this goal requires:
A Comprehensive strategy encompassing emission standards for new vehicles;
Procurement of cleaner fuels; Vehicle maintenance programs; and Efficient traffic and vehicle management.
The above measures need to be evaluated systematically in terms of technical, cultural, institutional, and economic feasibility to identify the combination of policies that would yield the optimal reduction in emissions for Lebanon.
4. RECOMMENDATIONS
Besides revising and updating Decree n6603 and Decision n52/1, the participants agreed upon the following recommendations that aim at reducing air pollution.
4.1 Direct Policy Choices
4.1.1 Setting Emission Standards for New Vehicles
This policy could be based on Article 35(1) of the Draft Code of Environment. The Article is general enough to include emission standards for new vehicles. The standards can be borrowed from automobile manufacturing countries such as the United States, Japan, or the European Union. Since Lebanon does not manufacture automobiles, the only requirement here would be to impose import restrictions on vehicles that fail to meet the established emission standards. Lebanon can mandate that vehicles being imported into the country provide a certificate from their
181

METAP III MEDPOLICIES INITIATIVE
country of origin asserting that they meet the emission standards. In which case, no testing burden would be placed on the government.
4.1.2 Setting and Implementing Air Quality Standards
Establish and implement the national air quality standards required by Article 35(1) of the Draft Code of Environment and as mentioned in Annex 14 of Decision n52/1 with a few improvements like setting the limit of lead emission to 1.25 μg/m3. Attention should be paid to issuing standards that will limit the amount of gases released from different kinds of vehicles by taking into consideration the law of importing used cars.
182

SOCIAL AND ECONOMIC ASPECTS OF AIR QUALITY
4.1.3 Requiring Emission Control Devices
Technological approaches to achieving the desired emission standards may include fitting new vehicles with emission control devices such as catalytic converters or particulate traps or requiring such devices to be retrofitted to existing vehicles. The government can require that all new vehicles sold and registered in the country be equipped with three-way catalytic converters (TWC). Such a measure can be initiated immediately and is very easy to implement. Also the installment of TWC for used cars should be requirement.
4.1.4 Improving Road Conditions
This is one policy option that Lebanon has already embraced. Maintenance of existing roads and construction of new roads, bridges and tunnels are being implemented. Once completed, the intensity of traffic jams is expected to decrease. Moreover, improving road conditions will eventually lead to an increase in the use of cars in the long run, therefore it is important to prepare alternative strategies to insure the reduction of pollution on the long run.
4.1.5 Improving Fuel Quality
The transport sector is considered in Lebanon and worldwide as the main source of lead present in the atmosphere. The major trend worldwide is the gradual replacement of lead in gasoline, both to reduce lead emissions and to facilitate the use of pollution control technologies such as TWC.
There are several strategies that could be adopted by the Lebanese government: to achieve this goal, namely:
Reducing the Lead Content in Leaded Gasoline: According to Lebanese reports (Ministry of Petroleum), the present percentage of lead in fuel (Octane 92) is 0.25 g/liter. This percentage could be reduced to 0.15g/liter, which would be in accordance with European standards.
Gradually Reducing the Use of Leaded Fuel until 2002: In 1999, the unleaded fuel’s share in the market was 13% of total fuel consumption in Lebanon. This is a modest amount considering that many countries have already phased out the usage of leaded fuel. The suggested timeframe, which extends until 2002, would result in a 20% decrease in the use of leaded fuel from total fuel consumption, and the complete stoppage of leaded fuel consumption three years thereafter, or until 2005. For this to happen, the Ministry of Petroleum needs to gradually decrease the import of leaded fuel according to the suggested time schedule and increase the import of unleaded fuel. This would allow the consumption of unleaded fuel to reach 80% by 2002 and 100% by 2005.
183

METAP III MEDPOLICIES INITIATIVE
The strategy that includes both an immediate decrease in the amount of lead in fuel to 0.15g/liter, and the gradual increase in the use of unleaded fuel represents a feasible and realistic solution. Moreover, it would significantly improve air quality, public health and the environment.
Using Price Incentives: To insure the successfulness of the strategy, there is a need to adopt some price incentives to encourage the use of unleaded fuel. People could be encouraged to use unleaded fuel by selling it at a lower price than leaded fuel. This is currently being done in a haphazard way with the difference in price between leaded and unleaded fuel as low as 100 Lebanese pounds, which does not provide sufficient incentive to switch from leaded to unleaded fuel.
Developing an Awareness Program: It is important for the Ministry of the Environment to organize a public awareness program on the advantages of using unleaded fuel and the application of catalytic converters. The program should stress the relationship between the use of unleaded fuel and the betterment of the environment and public health, and should also stress the lower cost of car maintenance if unleaded fuel is used. Reports have revealed that the saved money for car maintenance amounts to 1 cent/liter. The private sector could play a major role in developing such an awareness program.
Making Obligatory the Use of Catalytic Converters with Unleaded Fuel: In parallel to the shift of using unleaded fuel, the installation of catalytic converters is a must as it reduces the emission of other polluting gases. However, it is not advisable to install converters for cars running on leaded fuel as the content of lead causes rapid decay to parts of the converter and leads to a decline in its efficiency in a short period of time.
4.1.6 Alternative Fuels
The possibility of substituting cleaner burning fuels for conventional fuel is drawing increased attention. Alternative fuels include methanol (made from natural gas, coal or biomass) and ethanol (made from grain). The Lebanese Government in 1995 allowed the import of diesel-powered passenger cars with special engines because of their advantage over gasoline-powered vehicles in terms of fuel economy. Diesel engines produce significantly smaller amounts of several pollutants. However, it is important to note that while diesel engines do not produce any lead emissions, they do emit fine particulates that are hazardous to public health. The best strategy to reduce the emission of such particulates is the installation of a special filter that can be replaced on a yearly basis or after a certain amount of mileage. Additionally, the quality of diesel used for such vehicles should be regularly monitored.
184

SOCIAL AND ECONOMIC ASPECTS OF AIR QUALITY
In Egypt, for example, the specialized authorities undertook a significant step in reducing the level of air pollution by introducing natural gas as a substitute car fuel. Since the project started in 1996, the number of vehicles functioning on natural gas has reached 30,000 cars, ranking Egypt as the seventh country in the world in terms of cars functioning on natural gas. The economic return of transforming one’s care into a natural gas-powered vehicle or purchasing such a car is that the price of natural gas is approximately half that of fuel. In terms of environmental benefits, the pollutants emitted from cars functioning on natural gas are significantly less hazardous than those emitted by fuel-powered vehicles. Taxi operators have been among the most proactive in switching to natural gas-powered vehicles. It also important to note that more than 90% of cars in Cairo operate on unleaded fuel.
4.2 Supportive Policy Choices
4.2.1 Providing and Promoting Public Transport
The single most valuable program in a comprehensive pollution control plan is a viable and efficient public transport system. Public and private buses, mini-buses, and taxis are available in most areas. However, their number and service hours fall short of satisfying the needs of the commuting public. For this reason, the public should be encouraged to use public transportation by improving the sector’s organization and improving its efficiency.
4.2.2 Rehabilitating the existing inspection and maintenance program
Vehicle performance significantly affects emissions. Minor malfunctions in the emission control system of a vehicle can significantly increase emissions. Major malfunctions can cause emissions to skyrocket. The old and poorly maintained vehicles that constitute most of the current Lebanese vehicle fleet, is the cause of large pollution problems. Effective inspection and maintenance programs could identify problem sources and assure their repair. Lebanon has in principal a vehicle inspection program that requires that vehicles be tested and serviced each year. However, in the last decade this has become simply an additional tax on cars without the owner ever presenting the vehicle for inspection.
Rehabilitation of the inspection and maintenance program can be a good pollution-control starting point for Lebanon. Even those vehicles that do not have pollution control devices can benefit from improved maintenance. Reinstatement of the program must be done in a way to encourage better maintenance of the vehicle. Licenses can be issued to eligible private test/inspection centers to carry out the required inspection. The World Bank has proposed that incentives be given to licensed centers (such as grants for retooling) and that harsh penalties be imposed for abuse of their license. As a first step, the existing inspection centers could start by inspecting all vehicles that run on diesel fuel.
185

METAP III MEDPOLICIES INITIATIVE
4.2.3 Improving Traffic Management
Traffic management measures, such as rehabilitation of traffic light signals and parking restrictions in inner cities, can help reduce traffic congestion and pollution. The Lebanese Government is currently reinstating new traffic signals, in addition to making large capital investments in road expansions. Since the personnel of the Traffic Brigade is not currently sufficient, assistance to direct the flow of traffic could be obtained from the army, scouts, or other public/civil defense agencies. An alternative short run solution for traffic control would be to arrange traffic flow by changing the direction of roads at heavy traffic times.
Unrestricted parking encourages the use of private vehicles and exacerbates congestion. Parking restrictions in the inner city can prove to be very useful in traffic management. There are several instruments that can be used to restrict/discourage parking in urban areas such as issuing parking permits for residents but not commuters; linking permits to occupancy rates; making permit cost a function of occupancy rates. In order to discourage single occupant vehicles make the cost of permit higher for them or secure fewer spaces for such vehicles. Outright prohibition of parking in certain areas can also help reduce traffic.
4.3 Cost of Policy Choices
4.3.1 Incentives to Renew the Automobile Fleet
Policies that encourage turnover of the fleet could lead to significant emission reductions. The age distribution of the vehicle fleet in Lebanon shows that about 70% of the private car fleet consist of 1984 models or older. To encourage ownership of new, more efficient, cars, renew the automobile fleet and reduce pollution, several options can be considered such as lowering import duties on cars equipped with emission control devices (e.g., TWC) by:
Reducing registration fees on these types of vehicles; and/or
Offering an old car program bonus program for owners of older vehicles who turn in their vehicles to be scrapped; this would remove the vehicle’s emissions from the road over what would have been its remaining lifetime.
186

SOCIAL AND ECONOMIC ASPECTS OF AIR QUALITY
4.3.2 Consumption Fees
Additional charges could be imposed on imported cars (US$400 for every additional 1 km used above the average) according to their consumption level. This might lead to a reduction in the use of big cars that require a large amount of fuel.
4.3.3 Reduced Public Transport Fares
Public transport rates are relatively low in Lebanon. However more can be done to encourage the use of public transportation, such as encouraging the purchase of all-day/flat fee bus tickets that are already available in Beirut.
4.3.4 Transportation Allowance
If and when public transport becomes widely available, the Government may want to consider substituting the monetary transportation allowance issued to employees with coupons or bus tickets.
4.4 Guidance Policy Options
4.4.1 Supportive Public Education Program
Informing the public about the economic and health impacts of air pollution would very much help the adoption and effective implementation of any policy measure. Public awareness campaigns could also guide citizens on voluntary measures that can help to protect the environment. These include:
Using public transport more often; Getting rid of excess weight in the car while driving; Turning off the engine during traffic congestion; Combining different purposes into one trip; Walking or using other transport means for short distances; Refrain from heating up the car before driving; and Working at home when possible.
In Lebanon, public awareness campaigns to decrease the use of cars are starting to take shape. For example, a group of concerned staff and students at the University of Balamand recently initiated a national campaign against the over use of cars in the country. With the slogan “Cars Are a Risk to Lebanon: Avoid” (CARLA), the campaign aims to increase public awareness about the serious risks associated with the over-dependence of our society on automobiles, as well as to create a forum for exchanging ideas about environmental issues. The campaign is supported by the Ministry of Environment, the United Nations Development Programme and the World Bank through the Mediterranean Environmental Technical Assistance Program (METAP), as well as other non-governmental organizations.
187

METAP III MEDPOLICIES INITIATIVE
Below is a table that specifies short-, medium- and long-term measures for reducing air pollution in Lebanon. The training program completed as part of the Phase II activity also resulted in an air quality policy-making handbook (written in Arabic and English) that was distributed to Lebanese decision-makers and program participants. The handbook is available from the Lebanese Center for Policy Studies upon request.
188

SOCIAL AND ECONOMIC ASPECTS OF AIR QUALITY
Table 1: Short-, Medium-, and Long-Term Measure for Reducing Air Pollution in Lebanon
Market - Based
Regulatory Economic
R & D
Measures
Technology
New
car
taxe
s U
S$40
0/1/
100k
m
Roa
d ta
xes
Fine
s
Fuel
eco
nom
y st
anda
rds
Alte
rnat
ive
fuel
m
anda
te
Tech
nica
l che
ck
up
Acce
ss
rest
rict
ion
Ince
ntiv
es
(sub
sidi
es)
Tax
wai
ver
Educ
atio
n
R &
D
Vehicle designDesign
specifications on
imported vehicles
2 2
Specifications on
imported vehicles
2 2
Vehicle downsizing 2
Speed manageme
nt1 1 3
Increase load factor 1 2 1 2
Public transport 1 1 1
Alternative fuels 2 3 3 1
Leakage in AC 2 2
Catalysts 1 1
Unleaded
1(0.1
5g/l)
1 1
Settlement changes 3
Fleet condition 1
189

METAP III MEDPOLICIES INITIATIVE
Infrastructure 1 3
1. Short-term2. Medium-term3. Long-term
190

SOCIAL AND ECONOMIC ASPECTS OF AIR QUALITY
ANNEX ALIST OF TRAINING SESSION PARTICIPANTS AND OBSERVERS
Training Session Participants
NAME TITLE/ INSTITUTIONColonel Adel Abou Daher Commander of Traffic Department
Ministry of InteriorAli Birro Head of Technical Office
Ministry of Economy and TradeRita Daher Technical Expert
Ministry of Economy and TradeElias Choueri Advisor to the Minister
Ministry of TransportMounir Abou Ghanem Advisor
Parliamentary Committee for the Environment;Advisor to the Former Minister of Environment
Naji Kodeih Industrial Chemistry Toxicology SpecialistMinistry of Environment
Samih Wehbeh Technological Hazards Prevention DepartmentMinistry of the Environment
Oussama Jadayel Faculty of EngineeringBalamand University
Mohamad Hadi Baaj Professor of Transport EngineeringAmerican University of Beirut
Sessions Trainer and ModeratorFarid Chaaban, Professor, Faculty of Engineering, American University of
Beirut
Training Session Observers
NAMES TITLE/INSTITUTIONCarol Chouchani Cherfane Regional Coordinator, MedPolicies
InitiativeHarvard Institute for International Development
Salim Nasr General DirectorThe Lebanese Center for Policy Studies
Rosie Nasser Project ManagerThe Lebanese Center for Policy Studies
191

METAP III MEDPOLICIES INITIATIVE
ANNEX BTRAINING SESSION AGENDAS
Four training and discussion sessions were held at LCPS premises for project participants. The sessions were held on May 23rd, May 30th, June 22nd, and July 11th.
Session I: Air Pollution: Definitions, Sources and Effects (Part 1)
3:00 - 4:00 Air pollution; Major Concepts of Air Toxic Emissions Definitions: Air pollutant, Tropospheric and Stratospheric Layers Primary and Secondary Sources of: Air Pollution
4:00 - 4:15 Coffee Break4:15 - 5:15 Types, Sources and Health Risks of Pollutants
Local Impacts of Carbon Monoxide, Ozone, Lead, and Particulates Global Impacts: Carbon Dioxide and the Greenhouse Effect, Ozone Layer
Depletion, Acid Rain5:15 - 6:15 Discussion
Session II: Air Pollution: Definitions, Sources and Effects (Part 2)
4:00 - 5:00 The Status of Air Pollution in Lebanon Major Sources of Air Pollution: Power Plants, Transport, and Major
Heavy Industries Data available on current air quality. Data from Sampling and Monitoring, Pollution Estimates Using
Established Models, GIS data5:00 - 5:15 Coffee Break5:15 - 6:15 Social and Economic Impacts of Air Pollution in Beirut
A Presentation of the Research Results from Phase I, based on the study entitled, “The Economic and Social Impacts of Mobile Source Pollution on Public Health in Greater Beirut Area”
6:15 - 7:15 Discussion
Session III: Laws and Measures to Decrease Air Pollution
4:00 - 5:00 Lebanon’s Commitment to International Agreements Concerning Air Pollution Mitigation
Lebanese Commitments to Ozone Layer Depletion and Greenhouse Gases.
Accomplished Measures and Tasks5:00 - 5:15 Coffee Break5:15 - 6:30 Current National and International Air Quality Legislation and Laws
Factors, Steps and Measures Needed for the Establishment of Air Quality Standards (Ambient Air Quality: New Source Performance Standards, NSPS)
Implemented Strategies for the Mitigation of Mobile Air Pollution in Developed Countries
Revision of Laws Related to Car Emissions6:30 - 7:30 Discussion
Session IV: Revision and Updating Laws Related to Ambient Air Quality
192

SOCIAL AND ECONOMIC ASPECTS OF AIR QUALITY
4:00 - 5:00 Revision and Development of Laws Related to Car Emissions Decree n6603 – Defining the Conditions for the Use of Buses and Trucks
which Run on Diesel, ways to monitor them, and the Accepted Standard of Fume and Diesel Emissions
Decision n52/1 – The Limits of Air Pollutants, and Air Quality Standards5:00 - 5:15 Coffee Break5:15 - 7:00 Updating the Decrees and the Decisions
Suggestions and Legislation Amendments Discussion
193