tjamesiv.files.wordpress.com · Web view2018/01/09 · Introduction to Optimization Calculus |...
9
NAME DATE BAND INTRODUCTION TO OPTIMIZATION CALCULUS | PACKER COLLEGIATE INSTITUTE Challenge #1 Draw the rectangle you came up with in Desmos. (The equation of the line was x + 5 y=10.) Width: Height: Area: Challenge #2 Draw the rectangle you came up with in Desmos. (The equation of the parabola was y=16−x 2 .) 1 / 9
Transcript of tjamesiv.files.wordpress.com · Web view2018/01/09 · Introduction to Optimization Calculus |...

NAME DATE BAND
INTRODUCTION TO OPTIMIZATIONCALCULUS | PACKER COLLEGIATE INSTITUTE
Challenge #1
Draw the rectangle you came up with in Desmos. (The equation of the line was x+5 y=10.)
Width: Height: Area:
Challenge #2
Draw the rectangle you came up with in Desmos. (The equation of the parabola was y=16−x2.)
1 / 7

Width: Height: Area:
2 / 7

Challenge #3
Draw the isosceles triangle you came up with in Desmos. (The equation of the parabola was y=9−x2.)
Width: Height: Area:
Challenge #4
Draw the isosceles trapezoid you came up with in Desmos. (The equation of the parabola was y=4−x2.)
3 / 7

Width: Height: Area:
4 / 7
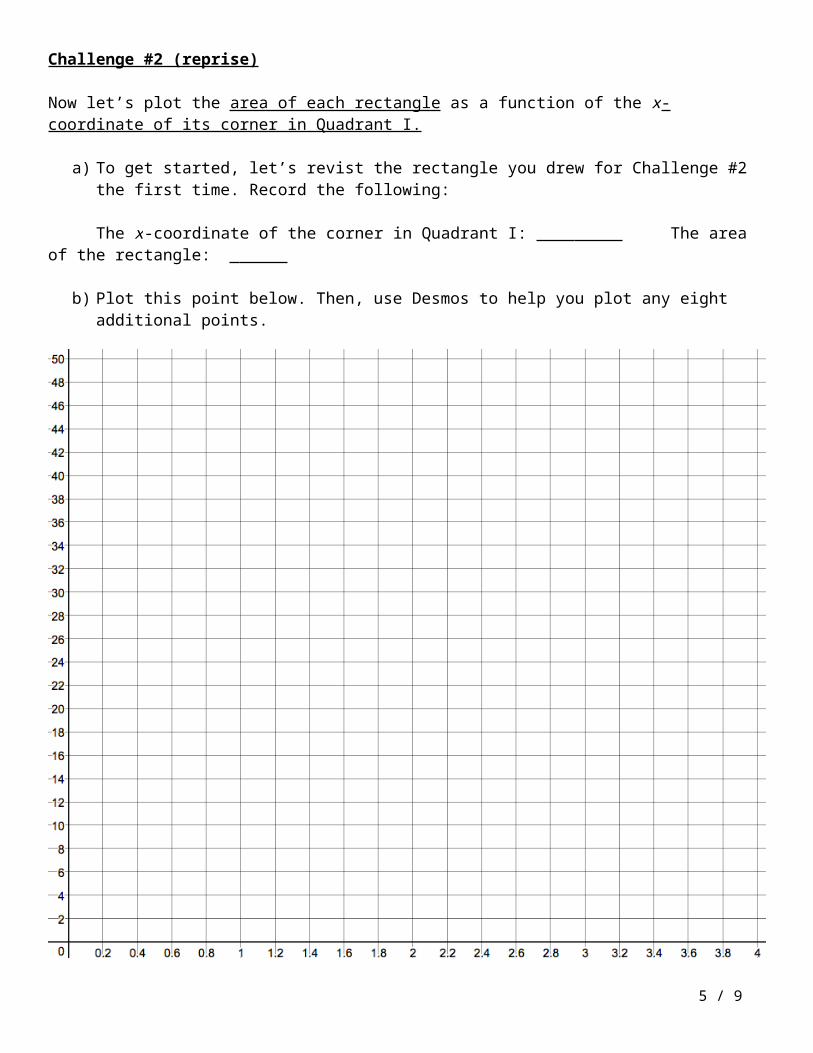
Challenge #2 (reprise)
Now let’s plot the area of each rectangle as a function of the x-coordinate of its corner in Quadrant I.
a) To get started, let’s revist the rectangle you drew for Challenge #2 the first time. Record the following:
The x-coordinate of the corner in Quadrant I: The area of the rectangle:
b) Plot this point below. Then, use Desmos to help you plot any eight additional points.
5 / 7
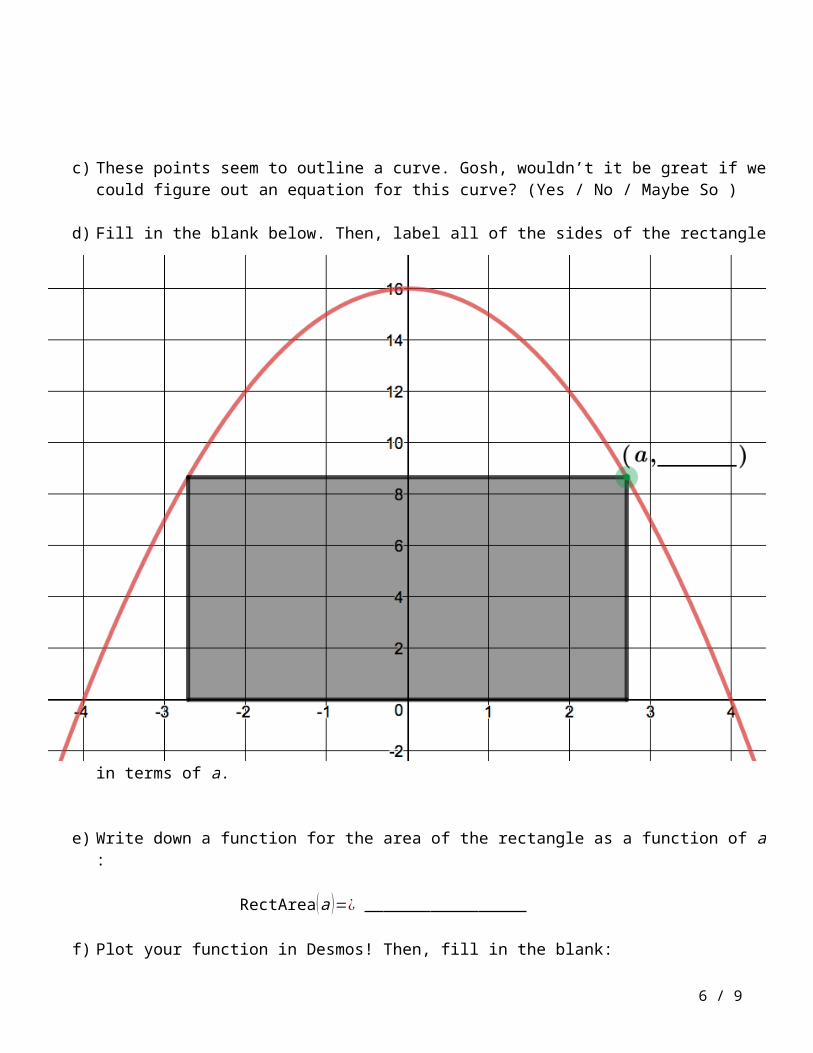
c) These points seem to outline a curve. Gosh, wouldn’t it be great if we could figure out an equation for this curve? (Yes / No / Maybe So )
d) Fill in the blank below. Then, label all of the sides of the rectangle in terms of a.
e) Write down a function for the area of the rectangle as a function of a:
RectArea(a )=¿
f) Plot your function in Desmos! Then, fill in the blank:
The maximum possible area was approximately , and this occurred when a was approximately .
g) Sketch the best rectangle below, labeling its width, height, and area:
6 / 7

Calculus to the rescue!
Our next question is this—how could we have determined the dimensions of this rectangle without Desmos?
a) Remind me—if f (x) has a maximum (a peak) at a certain x-value—like x=a, for example—what must be the value of f ' (a)?
b) Determine RectArea’(x).
c) Let’s figure out what our candidate points are by setting RectArea’( x )=0 and solving for x.
d) Finally, determine the best rectangle’s exact dimensions and area.
7 / 7