View of Trends and Technology NYSE: NPTN
36
View of Trends and Technology NYSE: NPTN May 2020
Transcript of View of Trends and Technology NYSE: NPTN
View of Trends and Technology
NYSE: NPTN
May 2020

2
Forward Looking Statements and Other Important Cautions
This presentation includes statements that qualify as forward-looking statements under the Private Securities Litigation Reform Act of 1995. These forward-looking statements include statements aboutthe following topics: future financial results, the Company’s market position and industry trends.
Forward-looking statements are subject to certain risks and uncertainties that could cause the actual results to differ materially. These forward-looking statements include statements about the followingtopics: future financial results, demand for the Company’s high-speed products, and the Company’s market position. Forward-looking statements are subject to certain risks and uncertainties that couldcause the actual results to differ materially. Those risks and uncertainties include, but are not limited to, such factors as: the Company’s reliance on a small number of customers for a substantial portionof its revenues; market growth in China and other key countries; possible reduction in or volatility of customer orders or delays in shipments of products to customers; timing of customer drawdowns ofvendor-managed inventory; potential governmental trade actions; possible disruptions in the supply chain or in demand for the Company’s products due to industry developments; the ability of theCompany's vendors and subcontractors to supply or manufacture the Company's products in a timely manner; ability of the Company to meet customer demand; volatility in utilization of manufacturingoperations and manufacturing costs; reductions in the Company’s rate of new design wins, and/or the rate at which design wins go into production, and the rate of customer acceptance of new productintroductions; potential pricing pressure that may arise from changing supply or demand conditions in the industry; the impact of any previous or future acquisitions or divestitures of assets and relatedproduct lines; challenges involving integration of acquired businesses and utilization of acquired technology; the discontinuance or end of life of certain other products; market adoption, revenue growthand margins of acquired products; changes in demand for the Company's products; the impact of competitive products and pricing and alternative technological advances; the accuracy of estimatesused to prepare the Company's financial statements and forecasts; the timely and successful development and market acceptance of new products and upgrades to existing products; the difficulty ofpredicting future cash needs; the nature of other investment opportunities available to the Company from time to time; the Company’s operating cash flow; changes in economic and industry projections;a decline in general conditions in the telecommunications equipment industry or the world economy generally; and the effects of seasonality.
For further discussion of these risks and uncertainties, please refer to the documents the Company files with the SEC from time to time, including the Company's Annual Report on Form 10-K for theyear ended December 31, 2019 and the Company’s Quarterly Report of Form 10-Q for the three months ended March 31, 2020. All forward-looking statements are made as of the date of thispresentation, and the Company disclaims any duty to update such statements.
You may obtain these documents for free by visiting EDGAR on the SEC website at www.sec.gov.
Non-GAAP and Adjusted EBITDA Measures vs. GAAP Financial Measures
The Company’s non-GAAP and adjusted EBITDA measures exclude certain GAAP financial measures. A reconciliation of the Non-GAAP and Adjusted EBITDA financial measures to the most directlycomparable GAAP financial measures is provided in the financial schedules portion of its press release issued on February 27, 2020 and available in the Investor Relations section of the NeoPhotonicswebsite. Non-GAAP financial measures differ from GAAP measures with the same captions and may differ from non-GAAP financial measures with the same or similar captions that are used by othercompanies. As such, these non-GAAP measures should be considered as a supplement to, and not as a substitute for, or superior to, financial measures calculated in accordance with GAAP.
The Company uses these non-GAAP financial measures to analyze its operating performance and future prospects, develop internal budgets and financial goals, and to facilitate period-to-periodcomparisons. NeoPhotonics believes that these non-GAAP financial measures reflect an additional way of viewing aspects of its operations that, when viewed with its GAAP results, provide a morecomplete understanding of factors and trends affecting its business.
3
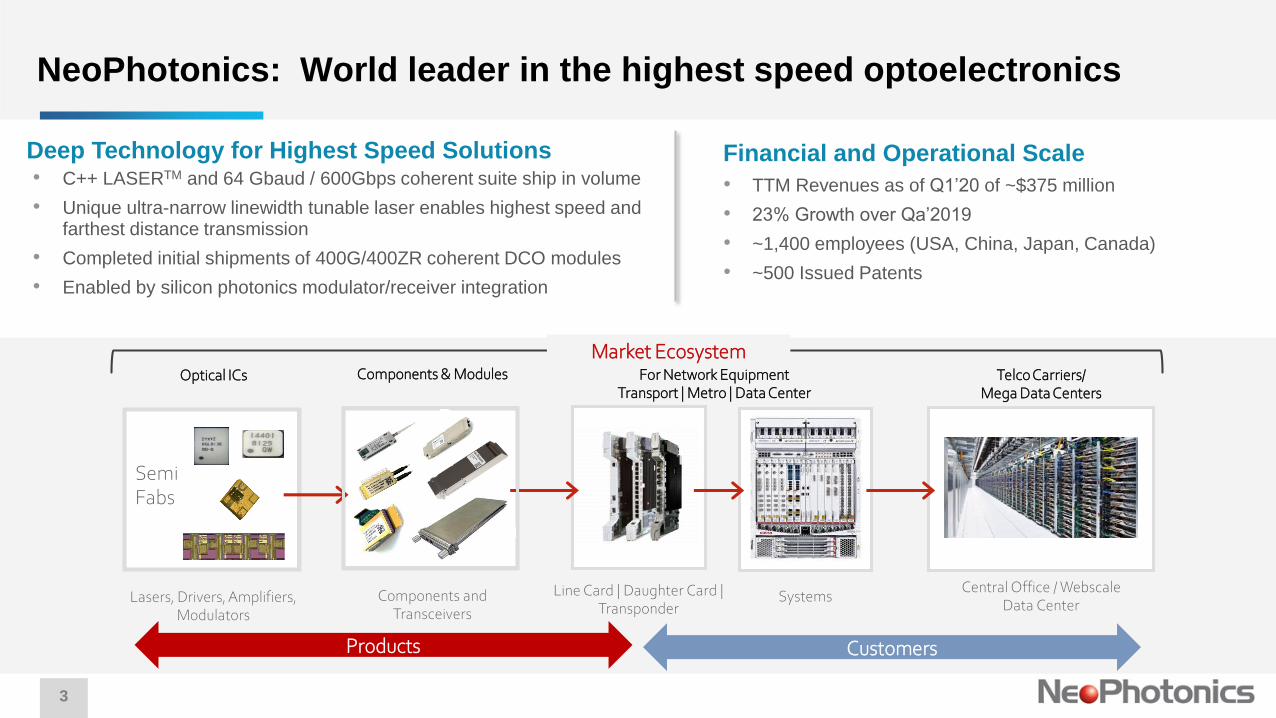
NeoPhotonics: World leader in the highest speed optoelectronics
Financial and Operational Scale
• TTM Revenues as of Q1’20 of ~$375 million
• 23% Growth over Qa’2019
• ~1,400 employees (USA, China, Japan, Canada)
• ~500 Issued Patents
Deep Technology for Highest Speed Solutions• C++ LASERTM and 64 Gbaud / 600Gbps coherent suite ship in volume
• Unique ultra-narrow linewidth tunable laser enables highest speed and farthest distance transmission
• Completed initial shipments of 400G/400ZR coherent DCO modules
• Enabled by silicon photonics modulator/receiver integration
For Network Equipment Transport | Metro | Data Center
SystemsLine Card | Daughter Card | Transponder
Telco Carriers/Mega Data Centers
Central Office / WebscaleData Center
Components & Modules
Market Ecosystem
Components and Transceivers
Optical ICs
Lasers, Drivers, Amplifiers, Modulators
SemiFabs
Products Customers

4
$375M
TTM Revenues(Q1’FY20)
27% CAGR in High Speed Products with
Expanding Margins(100G+ 2012-19)
~1,400 Employees(USA, China, Japan, Canada)
~500
Issued Patents
FIBER OPTIC COMMUNICATIONS: THE HIGHEST SPEED LEADER
• A Decade of Delivering the Highest Speed Over Distance In the Industry
• Technology Development Teamwork: Unique Corporate Culture
• The Outer Limits of Complex Optical Materials Technology
• Currently Shipping Products that Deliver 32 Terabits per second On One Fiber
• Technology and Manufacturing: Seamless Organic Team
• Deep Reservoir of Knowhow Captured in Trade Secrets

5
Coherent Optics has Broad Applications
NPTN is Sampling Coherent Optics Solutions in Medical, Industrial and Automotive Markets
Coherent Telecom / DCI (25% CAGR)2019: $2.9B2023: $6.2B
Optics for 5G (72% CAGR)2019: $0.4B2023: $3.0B
Cloud Data Centers (20% CAGR) 2019: $3.1B2023: $6.0B
Coherent Medical Imaging2024: $1.8B
Coherent LIDAR for Autonomous Vehicles
2023: $1.2B
Coherent Industrial Metrology2023: $13B
Source: Various third-party industry reports and company estimates
Co
here
nt
Co
mm
Co
here
nt
Sen
sin
g

6
Deep Culture of Innovation and Technology Refinement
Results of a Decade of Engineering Innovation
Corporate Engineering Culture
• Continuity with Stable Technical Leadership
and Insight for 15 Years
• Key Acquisitions Since 2010; Each a Holder of
Incremental Strategic Technology for Coherent
• Multi-National Teams in Close Collaboration
• Relentless Consistency of Focus over Years
• Steady Manufacturing Technology and
Process Capability Improvement
• Deep Reservoir of Sophisticated Knowhow
Across Operations, from Fab to Final Test
• Abundance of Trade Secrets
• Industry’s Purest Light Tunable Lasers
• Highest Baud Rate Receivers and Modulators
• Most Reliable and Complete Advanced Hybrid Integration Technologies
• Optimized Materials Platforms
• Most Advanced High Density Modulation Schemes
• Delivering the Industry's Highest Speed Over Distance and Highest Capacity

7
Industry Leadership in Coherent Products At Each Speed NodeO
rga
nic
2008-2010
• 40G Coherent
Comixer
• 40G DQPSK Rcvr
• 40G ICR
2012-2014
• 100G ICT
• Gen 1 Modulator
• 200G Type 2 ICR
2014-2016
• Ultra NLW µITLA
• 400G µICR
• 100G CFP-DCO
• 100G TIA
2016-2018
• 600G µICR
• 600G µMOD (CDM)
• 600G COSA
• 100G EML (PAM4)
2018-2020
• 400G SiPho COSA
• 400G CFP2-DCO
• 400G OSFP
• 400G QSFP-DD
• 800G µICR, µMOD
Acq
uis
itio
ns
2013: Lapis Semi
• 100G Optical ICs
• InP and GaAs
• EML, Driver, PD
2015: Emcore TL
• Ultra Narrow Line
Width for >200G
2011: Santur
• 100G Modules
• InP, Tunables
Key Acquisitions Have Each Held Incremental Strategic Technology for Coherent Optics
2020201820162014201220102008
800G
Coherent
400ZR / ZR+
600G
Component
Coherent Suite
400G
Ultra-Narrow
Linewidth Laser
100/200G
Tunable
Laser
100G
Coherent
Receiver
40G
Coherent
Mixer
2010-2012
• 100G ICR
• 200G Type 2 ICR

What Is Changing?

9
Accelerating Growth of Demand for Bandwidth & Cloud Services
• Carriers and ICPs face bandwidth overload
• Infrastructure for Cloud services accelerating
• Pluggable transceiver modules for IP over DWDM is disruptive to traditional chassis-based
systems and proprietary protocols
• Networks become more flexible, lower cost and much more scalable
• DSPs are increasingly interoperable
• Module solutions expected to gain share of ports in 400ZR domain
Current Inflection from Telecommuting & On-line Entertainment
Market power may now shift from network equipment to pluggable modules and
components. High performance optics as the new differentiator.

10
New Bandwidth Solutions are Demanded by Carriers and ICPs in the Quarters Ahead
Imminent Surge in Investment in Bandwidth
Country or
State
Traffic
Change
DL Speed
Change
USA CA ↑47% ↑1%
USA NY/NJ ↑45% ↓6%
USA MI ↑38% ↓16%
UK ↑79% ↓30%
France ↑38% ↓14%
Japan ↑32% ↑10%
Italy ↑109% ↓14%
Spain ↑39% ↓8%
Global internet traffic has seen stepwise growth with people working remotely
Cloudflare: San Francisco Bay Area Traffic Changes during Pandemic
Source: Fastly.com

11
Insatiable Demand for The Highest Data Rates
Total Data Growth*(per month)
Driven by Cloud, Big Data, 5G, Artificial Intelligence, Internet of Things (IoT) and Machine Learning … and now remote working
44 Exabytes
2012
122 Exabytes
2017
396Exabytes
2022
* Cisco Visual Networking Index:
Our Highest Speed Over Distance Solutions Enable ICPs and Carriers to Deliver Bandwidth

12
High Speed Optical Ports As A Measure of SuccessTwo Ports Per Channel (or Wavelength)
OPTICAL PORT(2020 Market: 620K ports*)
• NeoPhotonics’ tunable lasers have narrowest line width and lowest phase noise (ultra pure color)
• High performance receivers decode phase and polarization
• Advanced modulators code signals that use large constellation modulation schemes
* Company Estimate:
Coherent Optical Ports Are the Metric of Our Business
COHERENT TRANSCEIVER / OPTICAL PORT(2020 Market: 620K ports*)
Electronics
Digital signal processor converts analog signals to digital
DSP
Electronics
Digital signal processor converts analog signals to digital
DSP
Control
electronics
The Optics
Sold integrated, in modules, or as components
RECEIVETRANSMIT
LaserModulator
Signal Out Signal In
Receiver

13
High Speed Market Growth – Cost per Bit Declines
Source: Company estimates
High Speed Coherent Is Technology of Choice
Rapid 100G+ Market Growth
Coherent Ports Are Growing – Even Faster Growth At Higher Data Rates
0
200
400
600
800
1000
1200
1400
2014 2015 2016 2017 2018 2019 2020 2021 2022 2023
100G 200G 400G+ 400ZR
+30%
CAGR
CO
HE
RE
NT
PO
RT
S S
HIP
PE
D
Total Ports in 2020 forecast is 620K
400ZR+CFP2-DCO
400ZR &400ZR+ OSFP
400ZRQSFP-DD

Maximizing Capacity in
IP over DWDM Networks

15
NeoPhotonics’ Sustainable Competitive Advantage: Our Laser
Silicon
OUR DESIGN
• A formidable competitor in
silicon
• Requires our high power
lasers
• Leading hybrid integration
• Superior laser design
• Low phase noise
• Narrow line width
No Need for Distorting Amplification
OUR INTEGRATIONLaser
We leverage ultra-pure light tunable lasers and optical integration to deliver highest speed over distance
New, competitive nano- and C++ LASERTM products target high capacity applications
• Low phase noise

16
Two Methods to Increase Capacity in Fiber / Transmission Distance
1. Increase the capacity in each channel (per wavelength)
– A. Increase baud rate (i.e., symbol rate)
increase transmission distance for the same net data rate
Example: Ciena WL5 (95Gbaud) for 400G long-haul
– B. Increase (higher) modulation order (i.e., denser constellation)
Increase spectral efficiency
Example: 400ZR DCI links uses 16QAM modulations; 600G DCI links uses 64QAM modulations.
2. Expand the available optical spectrum
– Add new spectrum by extending the C-band to “C++ BandTM” or to C-band and L-band
Using Coherent Systems, capacity is expanded by:
Wider Spectrum
Higher order modulation
High baud (symbol) rate

17
(1A) Increase capacity in each channel by increased baud (symbol) rate
Increased baud rate (i.e. symbol rate) allows a lower modulation for give data rate
CoherentTX
CoherentRXTransmission fiber
with chromatic dispersion
TunableLaser (local
oscillator)
Laser phasefluctuation
Above issue is a well-known transmission impairment in coherent metro and long-haul systems.
Laser phase noise performance is critical for receive signals (even more than transmit).
Objective is clear, consistent pulses.
With a long pulse, fluctuating laser phase
noise causes DSP processing errors.
The more stable (lower) phase noise gives
better system performance.
After a transmission in fiber, the transmitted pulse is broadened as shown below:
High baud (symbol) rate

18
Maximizing capacity of fiber by increasing bits per symbol, or modulation order, in addition to increasing (symbol) baud rate
(1B) Increase capacity in each channel by higher modulation order
• High order modulation is efficient – it increases data rates on a signal.
• With higher phase noise from the laser, there are more phase rotations in high order modulation Coherent Systems
Cannot differentiate constellation points (each
point represents a data symbol)
Higher Symbol Error Rate
16-QAM 64-QAM
LaserPhaseNoiseHigh
LaserPhaseNoiseLow
Higher order modulation

19
(2) More Capacity Over the Same Fiber: Expanded Spectrum
Maximize speed in every channel – and increase the capacity of each channel Speed per Channel
~60 - 100Channels
(wavelengths or colors per fiber)
1Fiber
10G
100G
200G
400G
600G
800G
1.2T
Expanded spectrum
Expanded spectrum
Expanding the spectrum to C++
spectrum increases number of
channels or Increases capacity of
each channel. Capacity increases
from 4.0 ~ 4.8 THz to 6.0 ~ 6.5 THz.
Wider Spectrum
Increasing capacity per channel
leverages spectrum + wavelength
capacity to reduce cost per bit

20
C++ LASERTM and ModuleIllustration of Capacity Benefits: More “Pipes” or “Bigger Pipes”
FEATURESWider bandwidth = more pipes (THz)Broader channel spacing = bigger pipes (GHz) C++ LaserTM enables more, bigger pipes
BENEFITSAllows data center or carrier to better leverage fiber plant investment Maximize capacity in existing cable / terminal equipment investment C++ TransceiversTM allow higher capacity per fiber
SP
EC
TR
UM
1524nm 1572nm
Expanded C++TM Band6.0-6.5 THz
…
C-Band4 THz Width
1530nm 1562nm
…
1530nm 1568nm
…
Extended C-Band4.8 THz Width
CA
PA
CIT
Y
DATA
50GHz channel spacing
50 GHz bandwidth “pipes” are standard for 100/200Gbpsbut restrict data flow at 400Gbps
DATA
75GHz or 100GHz channel spacing
More data flows at 400 Gbps requiring a “bigger pipe” (75 GHz or 100 GHz)

21
COHERENT
IP over DWDM reduces cost per bit; Laser Technology Is Essential
Coherent100G+ Networks
Creates detectable,
error-free signal, each color
(wavelength) transmitted must be
much purer than for lower speeds
The New
On/Off Keying10G WDM Networks
Signal muddied /
impaired at higher speeds
The Old
The Best in Coherent Optics Technology
Low phase noise
High symbol rate
Higher order modulation
Wider Spectrum
NeoPhotonics High Capacity Solutions for Speed Over Distance

Achieving the Highest Speeds

23
Speed Over Distance: Huge Opportunity for ZR and ZR+
Near Term
Suburb or campus
Urban data center
OPEN LINE
SYSTEM
ROUTER COMPACT
MOD
400ZRSRSR
ROUTERCOMPACT
MOD
400ZR SR SR
Future
Urban data center
Suburb or campus
ROUTER ROUTER
OPEN LINE
SYSTEM
400ZR 400ZR
Can extend to 800ZR
SR = short reach transceiver
IP over DWDM will be displacing DWDM proprietary boxes with disaggregated 400ZR interconnections
ZR Architecture offers significant potential for cost savings and flexibility, including in Metro and Regional telcos with ZR+ reach.
NeoPhotonics is sampling or shipping all three 400ZR modules
400ZR & 800G OSFP
400ZR QSFP-DD
400ZR CFP2-DCO

24
NeoPhotonics: Well Positioned for Accelerating Growth
• 400G/600G & Beyond Major Wave globally
• DCI and Metro markets surging
• Strength in 100G/200G in China market
• 5G Rollout to 50 Cities in China
• Launch of 400ZR in 2020 with Ramp in 2021
MARKET DRIVERS
2020 2021 2022 2023
TOTAL ADDRESSABLE MARKETCoherent Module / Linecard Market
100/200G
400G+$3.2B
$3.6B$4.3B
$5.4B
Positioned to Gain Share in Growing Markets
OUR POSITION
High performance components
enabling highest
PERFORMANCE modules
New Drivers Moves Leading
CUSTOMERS to Our Solutions
Pervasive in Next Gen Coherent
ECOSYSTEM
NeoPhotonics Tunable Lasers Drive Inter-Data Center Today;
Will Drive Connectivity with 400ZR Tomorrow
Major Growth in Served MarketSource: Company estimates

FINANCIAL VIEW
Beth Eby, CFO
May 2020

26
NeoPhotonics: Turnaround Complete(Non GAAP, $M)
0%
5%
10%
15%
20%
25%
30%
35%
0
100
200
300
400
Q1'18 TTM Q1'19 TTM Q1'20 TTM
Revenue & Gross Margin %
Revenue Non-GAAP GM%
-20%
-15%
-10%
-5%
0%
5%
10%
-40
-30
-20
-10
0
10
20
30
Q1'18 TTM Q1'19 TTM Q1'20 TTM
Operating Profit
non-GAAP OpInc $ non-GAAP OpInc %
NOTES:
Trailing 12 Months includes Q1 of the named year through Q2 of the previous year.
Q1’20 Non-GAAP Operating Profit excludes stock-based compensation expense of
$2.5M and acquisition related intangibles amortization of $0.2M
2019 Non GAAP Operating Profit excludes (to be consistent) $12.5M Stock
Compensation Expense, $3.6M EOL Inventory Write-downs; $2.3M Accelerated
Depreciation (Client Module) ($0.9M); (Gain) on Sale of Assets; $0.9M Amortization
of Intangibles; $0.4M Asset Sale Related Costs (Neo Russia sale); $0.3M
Restructuring (from 2018 restructuring)
/
Our focus on gross margin and cash over the last three years has positioned us well for the next inflection point.
0
20
40
60
80
100
120
Q1'18 Q1'19 Q1'20
Cash and Debt
Cash, Restricted Cash & Short Term Investments Total Debt (LT, ST and Notes)
$Mil
$Mil
$Mil

27
• Non GAAP Earnings per share of $0.17/share as all
metrics exceeded our Outlook, on outstanding execution.
• Revenue up 23% year-over-year, with strong demand in
China. Huawei demand for non-EAR products grew to
52% of and China grew to 60% of revenue.
• Non-GAAP gross margin at 31% on slightly higher than
expected factory utilization.
• Operating expenses were unusually low, on an expected
R&D license credit and Covid-19 related lack of spending
that will push to future quarters.
• FX drove good news of $1.3M.
Q1’20 Financial Summary
Note:
Q1’20 Non-GAAP EPS excludes stock-based compensation expense of $2.5M, amortization of $0.2M and small non-GAAP tax and other adjustments
0%
5%
10%
15%
20%
25%
30%
35%
0
30
60
90
120
Q3'17Q4'17Q1'18Q2'18Q3'18Q4'18Q1'19Q2'19Q3'19Q4'19Q1'20Q2'20MidEst
Revenue & Gross Margin
Revenue Gross Margin %
$Mil

28
Q1’20 P&L Performance (Non-GAAP)
(% of Revenue) Q1’19 Q2’19 Q3’19 Q4’19 Q1’20Target
Model
Revenue $ $79.4M $81.7M $92.4M $103.4M $97.4M 100%
Product Margin % 27% 32% 34% 37% 36%
Mfg. Inefficiencies (4)% (5)% (4)% (4)% (4)%
Other COGS (1)% (1)% (1)% (2)% (1)%
Gross Margin % 22% 26% 29% 31% 31% 35%
R&D 17% 16% 14% 14% 11%
S&M 5% 4% 4% 3% 3%
G&A 8% 7% 7% 6% 6%
TOTAL OPEX 30% 27% 24% 24% 21% 25%
Operating Margin (8)% (1)% 5% 7% 10% 10%
EBITDA (1)% 8% 15% 12% 18% 15%
Note:
Q1’20 Non-GAAP EPS excludes stock-based compensation expense of $2.5M, amortization of $0.2M of acquisition related intangibles and
small non-GAAP tax and other adjustments
29
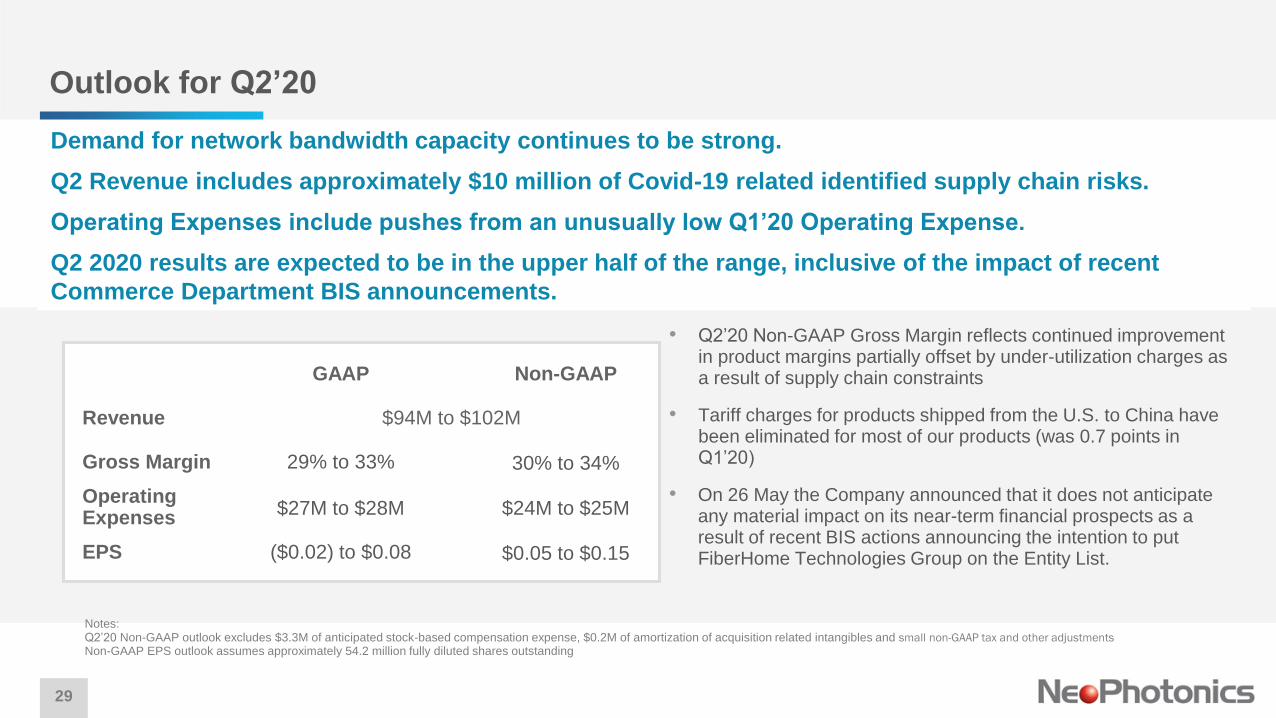
Outlook for Q2’20
• Q2’20 Non-GAAP Gross Margin reflects continued improvement in product margins partially offset by under-utilization charges as a result of supply chain constraints
• Tariff charges for products shipped from the U.S. to China have been eliminated for most of our products (was 0.7 points in Q1’20)
• On 26 May the Company announced that it does not anticipate any material impact on its near-term financial prospects as a result of recent BIS actions announcing the intention to put FiberHome Technologies Group on the Entity List.
Notes: Q2’20 Non-GAAP outlook excludes $3.3M of anticipated stock-based compensation expense, $0.2M of amortization of acquisition related intangibles and small non-GAAP tax and other adjustments
Non-GAAP EPS outlook assumes approximately 54.2 million fully diluted shares outstanding
GAAP Non-GAAP
Revenue $94M to $102M
Gross Margin 29% to 33% 30% to 34%
Operating Expenses
$27M to $28M $24M to $25M
EPS ($0.02) to $0.08 $0.05 to $0.15
Demand for network bandwidth capacity continues to be strong.
Q2 Revenue includes approximately $10 million of Covid-19 related identified supply chain risks.
Operating Expenses include pushes from an unusually low Q1’20 Operating Expense.
Q2 2020 results are expected to be in the upper half of the range, inclusive of the impact of recent
Commerce Department BIS announcements.

30
Our Priorities Are Clear
Markets
• Expanding customer base serving ICPs with DCI solutions, as well as telecom NEMs and their supply chain partners
Products
• Clear leadership in high speed optical components, coherent lasers and leveraging integration
• Product suite for highest performance and speed (Indium Phosphide) and cost benefit (Active Silicon platform)
• A profitable, growth solutions business path serving fast growing 400G modules
Operating financial performance
• Maximizing revenue and gross margin for every unit of production capacity
• Gain market share with feature and performance differentiation
• Insource key components for cost and time to market
• Continue to rationalize excess capacity and infrastructure
We are pursuing a path to deliver increased revenue growth and consistent higher profitability

See also:
www.neophotonics.com/blog/
and
ir.neophotonics.com
Reference

32
Serving Customers From a Global Footprint
Headcount by Geography
North America ~270
China (~400 contract) ~1,200
Japan ~260
ROW ~15
Total (~800 IDL) ~1,730
Comprehensive Vertical Integration for Multi-Material Hybrid Integration of Optical Solutions
San Jose, CA,
USA• PLC Fab• Corporate HQ
& Manufacturing
Fremont, CA,
USA • InP Fab• Lasers, arrays
Hachioji, Japan• All Functions• InP/GaAs Fab
Dongguan,
China• Volume
Manufacturing Site
Shenzhen, China
• All Functions• Volume
Manufacturing Site
CM: Thailand• Volume
Manufacturing Site
CM: Taiwan • Volume
Manufacturing Site
CM: Japan• Volume
Manufacturing Site
Ottawa, Canada• R&D Site
Wuhan, China• R&D Site

33
Q1’20 P&L Performance (Non-GAAP)
($ Millions) Q1’19 Q2’19 Q3’19 Q4’19 Q1’20
Revenue $ $79.4 $81.7 $92.4 $103.4 $97.4
Product Margin $ 21.5 26.3 31.8 38.0 34.8
Mfg. Inefficiencies (2.7) (4.4) (3.5) (4.6) (4.2)
Other COGS (1.0) (1.0) (1.5) (1.5) (0.2)
Gross Margin $ 17.8 20.9 26.8 31.9 30.4
R&D 13.8 13.0 12.9 14.7 11.1
S&M 3.9 3.0 3.2 3.5 3.1
G&A 6.6 6.1 6.2 6.2 6.1
TOTAL OPEX 24.2 22.1 22.3 24.3 20.3
Operating Margin ($6.5) ($1.2) $4.4 $7.6 $10.1
Adj. EBITDA ($0.8) $6.8 $14.2 $12.5 $17.8
Q1’20 GAAP Financial Measures to Non-GAAP
Reconciliation
GAAP Net Income $6.3M
Stock-based compensation expense 2.5
Amortization 0.2
Income tax effect of Non-GAAP
Adjustment & others $0.1
Non-GAAP Net Income $9.1M

34
Q1’20 P&L Performance (GAAP)
($ Millions) Q1’19 Q2’19 Q3’19 Q4’19 Q1’20
Revenue $ $79.4 $81.7 $92.4 $103.4 $97.4
Product Margin $ 21.5 26.3 31.8 38.0 34.8
Mfg. Inefficiencies (1.4) (4.4) (3.5) (4.6) (4.2)
Period Costs (2.4) (1.0) (1.5) (1.5) (0.2)
Other Charges (2.0) (5.2) (0.6) (0.7) (0.7)
Gross Margin $ 15.7 15.7 26.2 31.2 29.7
R&D 14.7 13.8 13.7 15.5 11.9
S&M 4.6 3.6 3.8 4.0 3.6
G&A 7.8 7.2 7.4 7.4 6.8
Other
Charges0.6 (0.7) - - -
TOTAL OPEX 27.7 23.9 24.9 26.9 22.3
Operating Margin $(11.9) $(8.2) $1.3 $4.3 $7.4

35
Q1’20 Balance Sheet
($ Millions) Q1’19 Q2’19 Q3’19 Q4’19 Q1’20
Cash & Equivalents $79 $74 $80 $89 $109
Working Capital 111 108 114 122 133
Total Assets $344 $319 $325 $335 $342
Total Debt 56 48 48 42 41
Total Liabilities 192 171 175 174 173
Shareholders’ Equity 153 148 150 160 169

36
End of File