View From 10,000 Feet? Well, Let’s Just Talk Ag Prices!!! (Kevin Bernhardt UW-Extension and Center...
45
View From 10,000 Feet? View From 10,000 Feet? Well, Let’s Just Talk Ag Prices!!! Well, Let’s Just Talk Ag Prices!!! (Kevin Bernhardt (Kevin Bernhardt UW-Extension and Center for Dairy Profitability) UW-Extension and Center for Dairy Profitability) October 2008 October 2008
-
Upload
eugenia-reeves -
Category
Documents
-
view
217 -
download
4
Transcript of View From 10,000 Feet? Well, Let’s Just Talk Ag Prices!!! (Kevin Bernhardt UW-Extension and Center...

View From 10,000 Feet?View From 10,000 Feet?
Well, Let’s Just Talk Ag Prices!!!Well, Let’s Just Talk Ag Prices!!!
(Kevin Bernhardt(Kevin BernhardtUW-Extension and Center for Dairy Profitability)UW-Extension and Center for Dairy Profitability)
October 2008October 2008

Farm & Risk Management Team
© 2008
Half Hour to Solve the Future of Ag Prices!• July 2008• October 2008• The Future with respect to Prices• The Future with respect to Farm
Management and Marketing
2
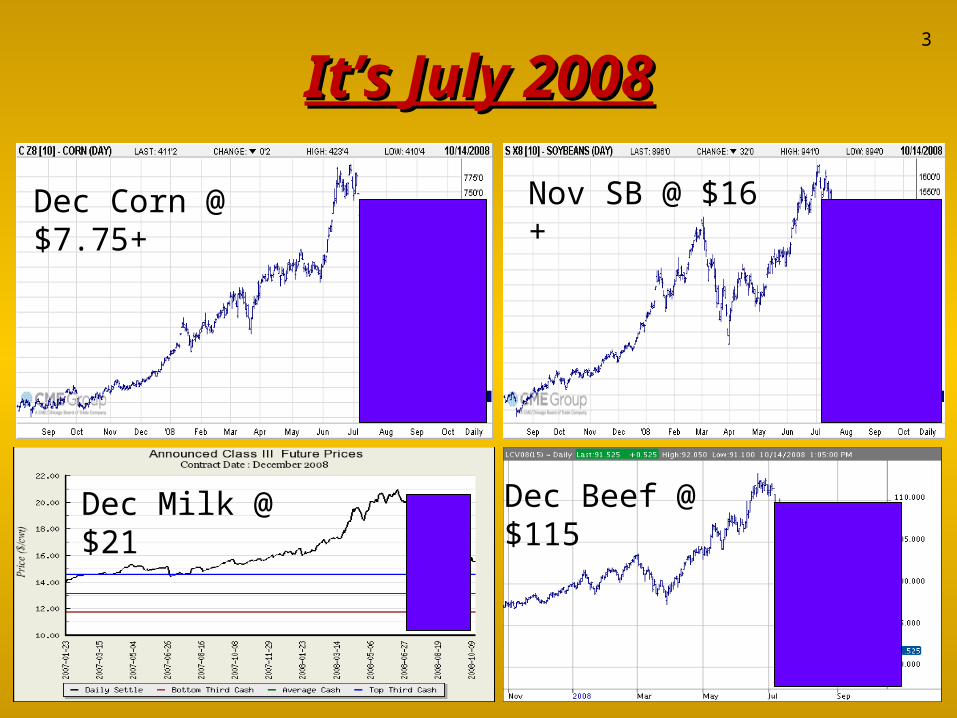
It’s July 2008It’s July 20083
Dec Corn @ $7.75+ Nov SB @ $16 +
Dec Milk @ $21 Dec Beef @ $115
Farm & Risk Management Team
© 2008
4
0
0.5
1
1.5
2
2.5
3
3.5
1860 1880 1900 1920 1940 1960 1980 2000
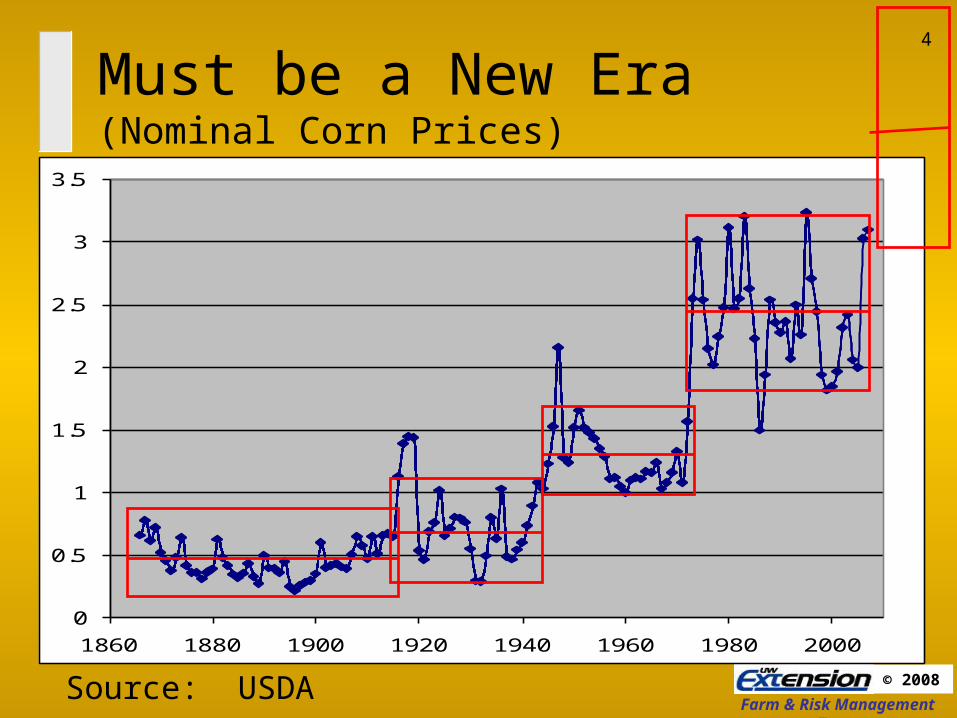
Must be a New Era(Nominal Corn Prices)
Source: USDA
Farm & Risk Management Team
© 2008
Prices – A Perfect Storm

Farm & Risk Management Team
© 2008
Supply
• Growth Rate in Productivity slowed– R & D funding down– Non-farm uses for land– Constraints on factors of production (water)– Climate Change??
Impact on Price

Farm & Risk Management Team
© 2008
World Wheat and Course Grain Ending Stocks
050
100150200250300350400450500
197
9/80
198
2/83
198
5/86
198
8/89
199
1/92
199
4/95
199
7/98
200
0/01
200
3/04
200
6/07
Ending Stocks

Farm & Risk Management Team
© 2008
Supply
• Weather Shocks– 2006
Russia and Ukraine Australia South Africa
– 2007 SE Europe Russia and Ukraine Turkey, Australia, Argentina, etc.
Impact on Price
Historically, two successive years of
lower global production occurs about once per
decade.
Farm & Risk Management Team
© 2008
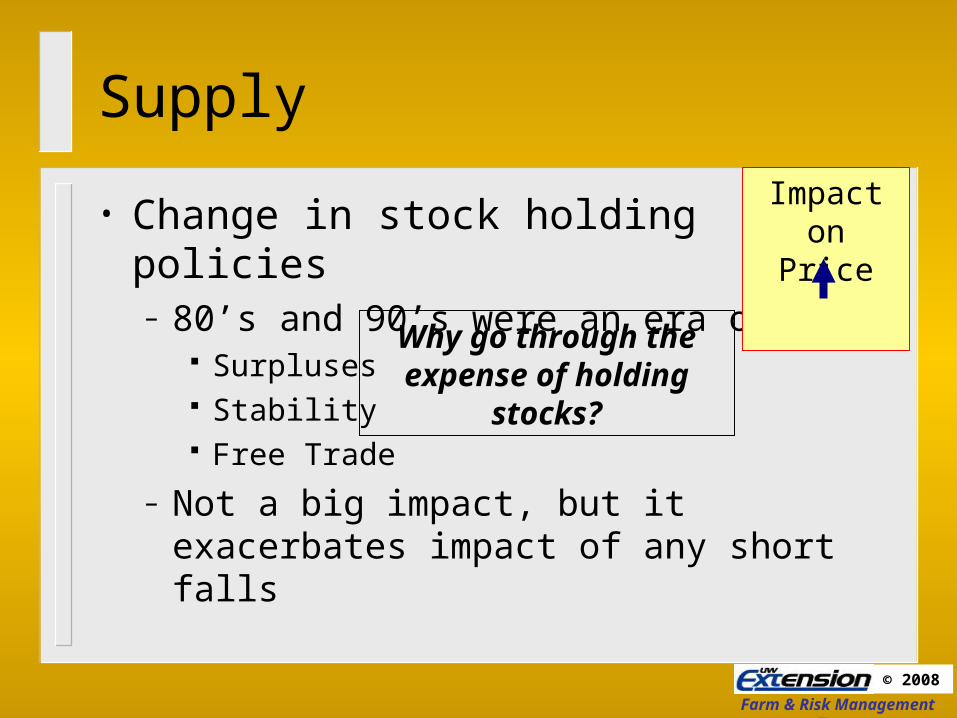
Supply
• Change in stock holding policies– 80’s and 90’s were an era of:
Surpluses Stability Free Trade
– Not a big impact, but it exacerbates impact of any short falls
Why go through the expense of holding stocks?
Impact on Price
Farm & Risk Management Team
© 2008
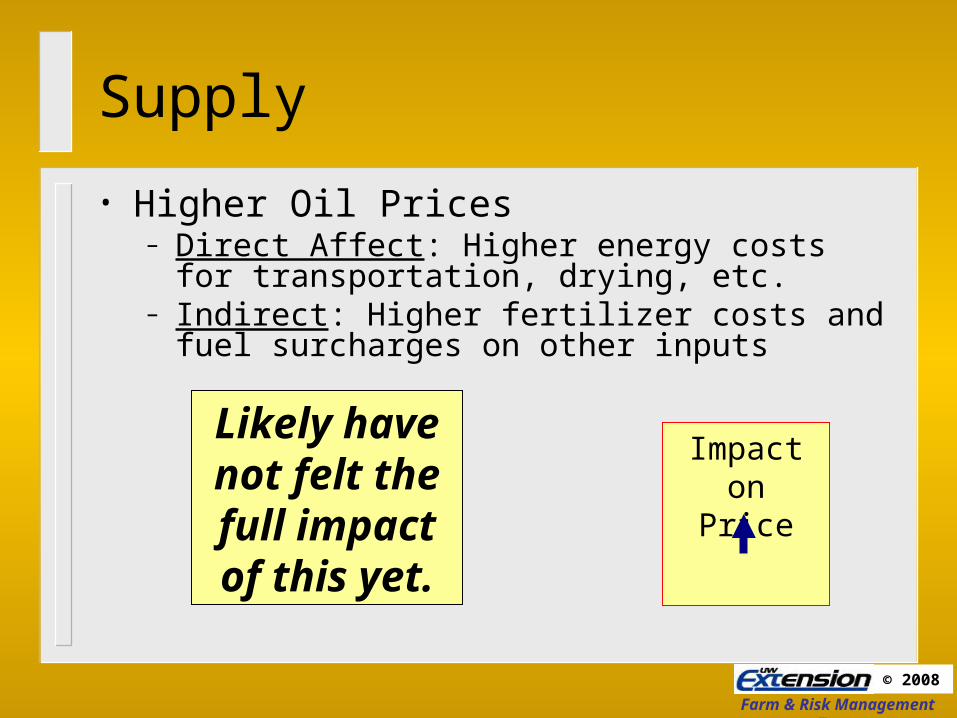
Supply
• Higher Oil Prices– Direct Affect: Higher energy costs
for transportation, drying, etc.– Indirect: Higher fertilizer costs and
fuel surcharges on other inputs
Impact on Price
Likely have not felt the
full impact of this yet.

Farm & Risk Management Team
© 2008
Demand
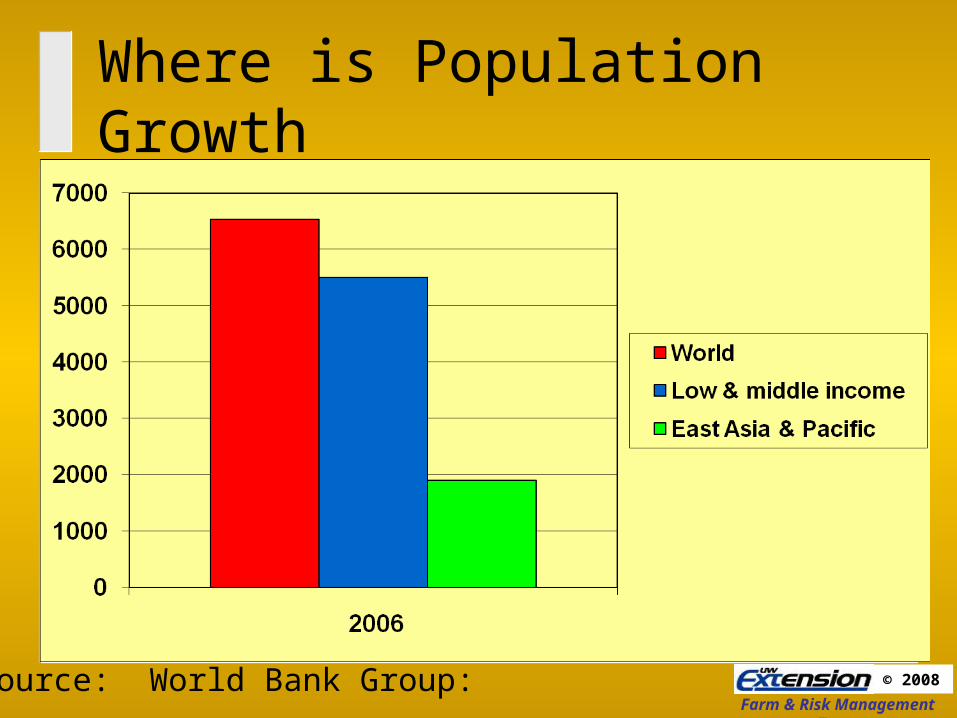
• Population– Growth rate is slowing, but in absolute number
of mouths to feed the world is growing at about 75 million per year
That’s ¼ of US population per year That’s almost 1 billion more people in next 12 years
Farm & Risk Management Team
© 2008
Where is Population Growth
Source: World Bank Group:

Farm & Risk Management Team
© 2008
Where’s the Population
Pop. (bil) % of World Rank
World 6.667
China 1.330 19.9 1
India 1.148 17.2 2
Indonesia .238 3.6 6
Bangladesh .154 2.3 9
Nigeria .138 2.1 11
EU .491 7.4 4
U.S. .303 4.5 5
45.1
Source: U.S. Bureau of Census

Farm & Risk Management Team
© 2008
Demand
• Income– Growing at a faster rate– Growing especially in middle income countries
and in Asia
Farm & Risk Management Team
© 2008
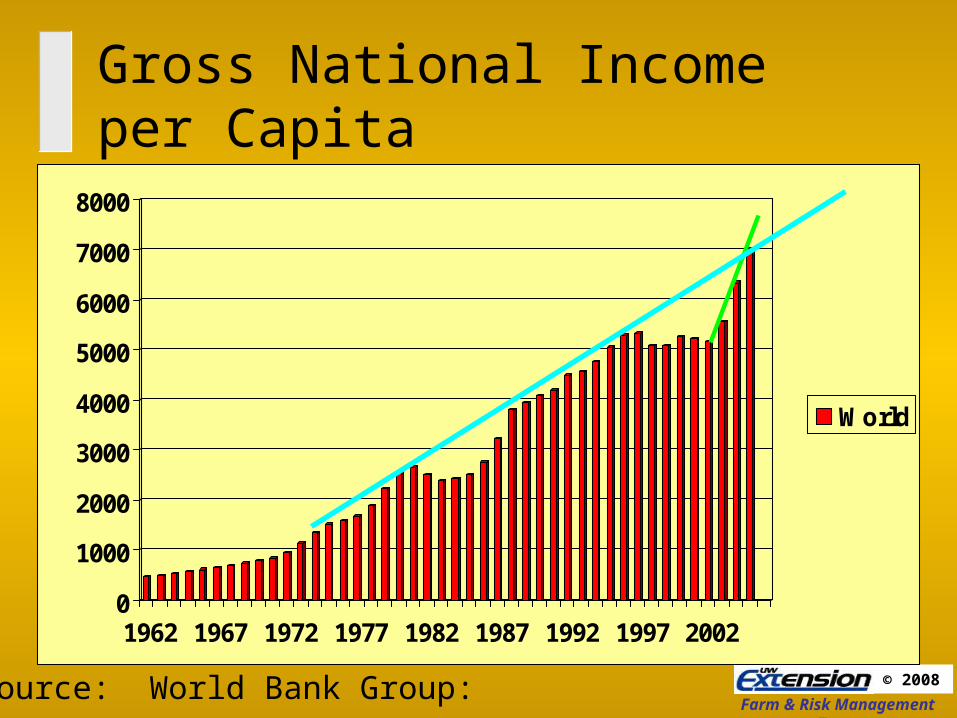
Gross National Income per Capita
0
1000
2000
3000
4000
5000
6000
7000
8000
1962 1967 1972 1977 1982 1987 1992 1997 2002
World
Source: World Bank Group:
Farm & Risk Management Team
© 2008
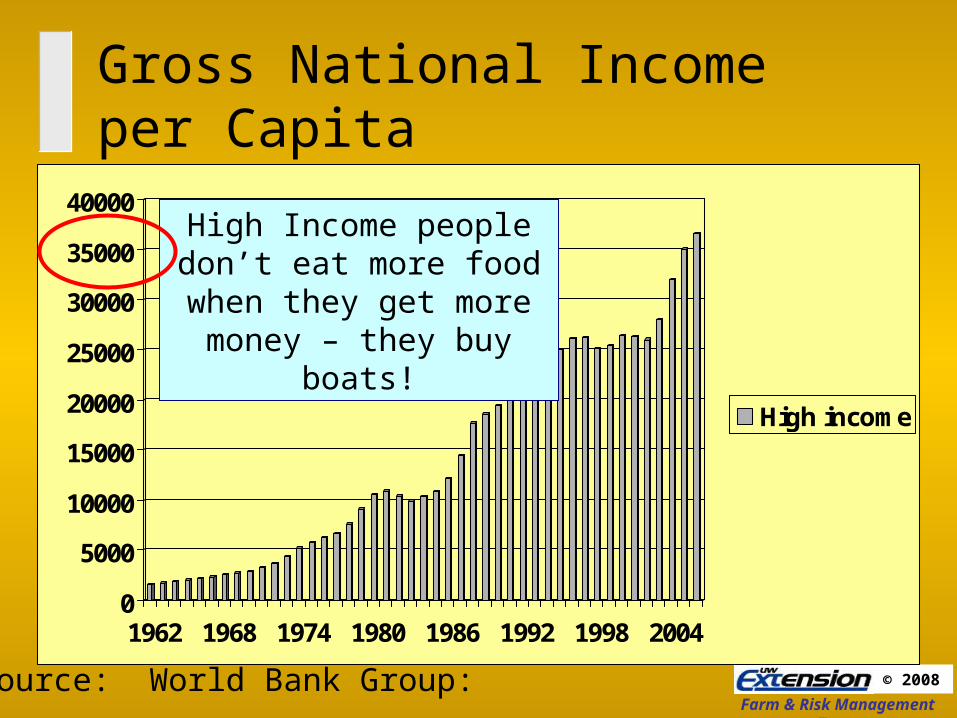
Gross National Income per Capita
0
5000
10000
15000
20000
25000
30000
35000
40000
1962 1968 1974 1980 1986 1992 1998 2004
High income
High Income people don’t eat more food when they get
more money – they buy boats!
Source: World Bank Group:
Farm & Risk Management Team
© 2008
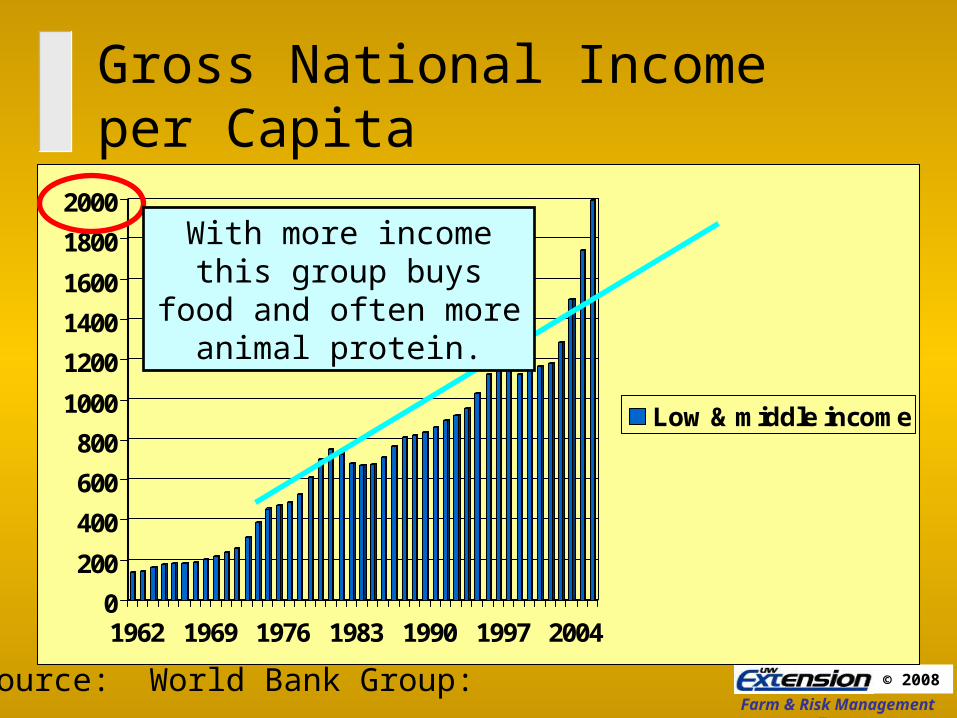
Gross National Income per Capita
0
200
400
600
800
1000
1200
1400
1600
1800
2000
1962 1969 1976 1983 1990 1997 2004
Low & middle income
With more income this group buys food and often
more animal protein.
Source: World Bank Group:
Farm & Risk Management Team
© 2008
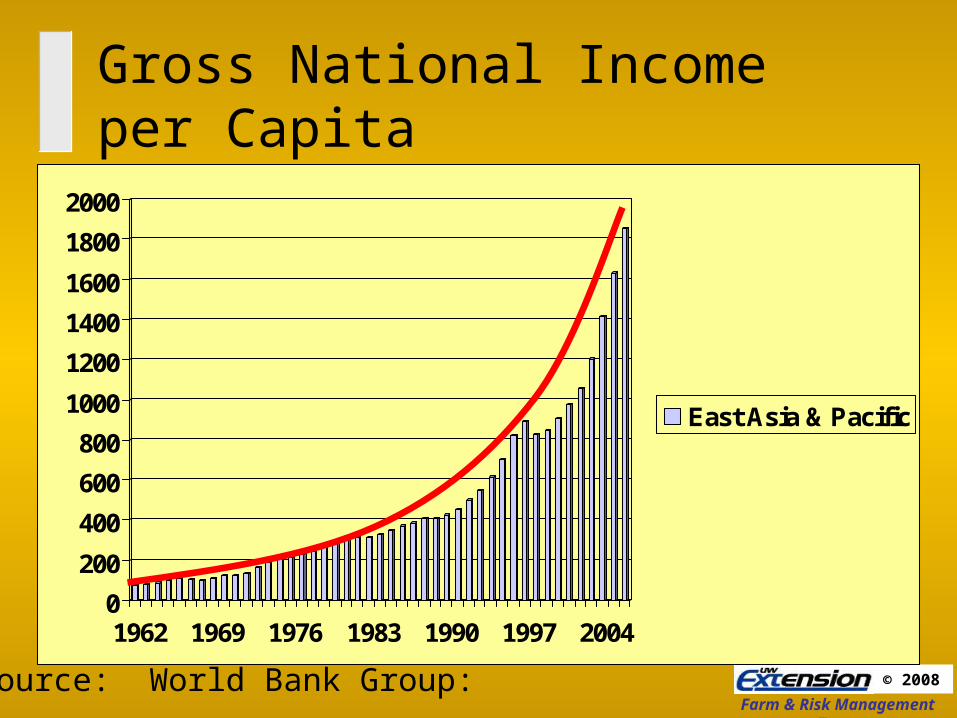
Gross National Income per Capita
0
200
400
600
800
1000
1200
1400
1600
1800
2000
1962 1969 1976 1983 1990 1997 2004
East Asia & Pacific
Source: World Bank Group:

Farm & Risk Management Team
© 2008
19
Demand, U.S. $ Index
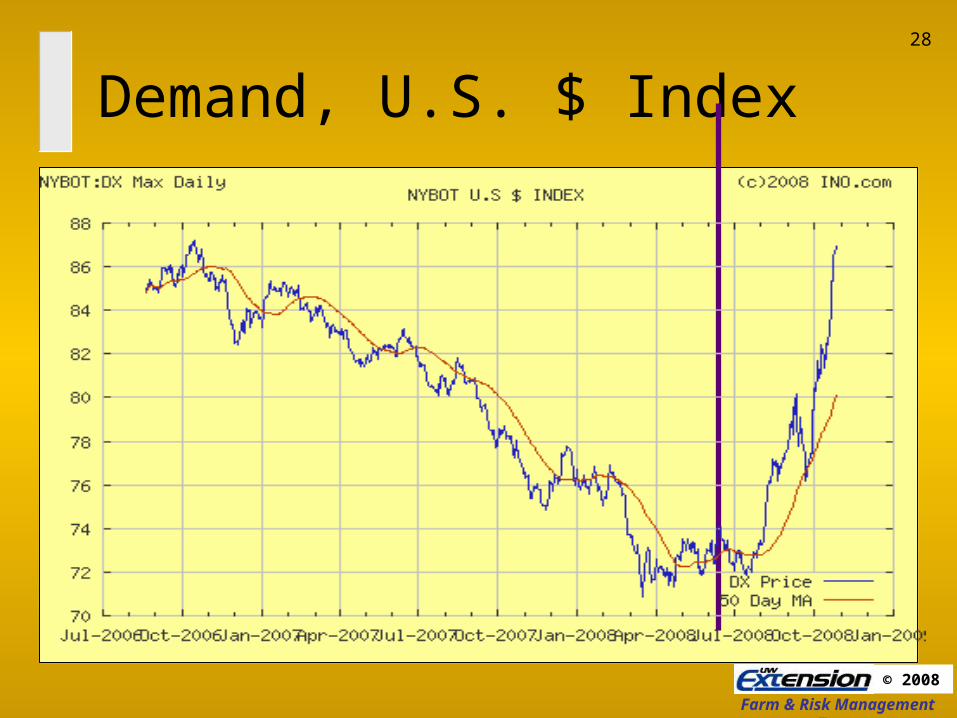
Impact on Price
Farm & Risk Management Team
© 2008
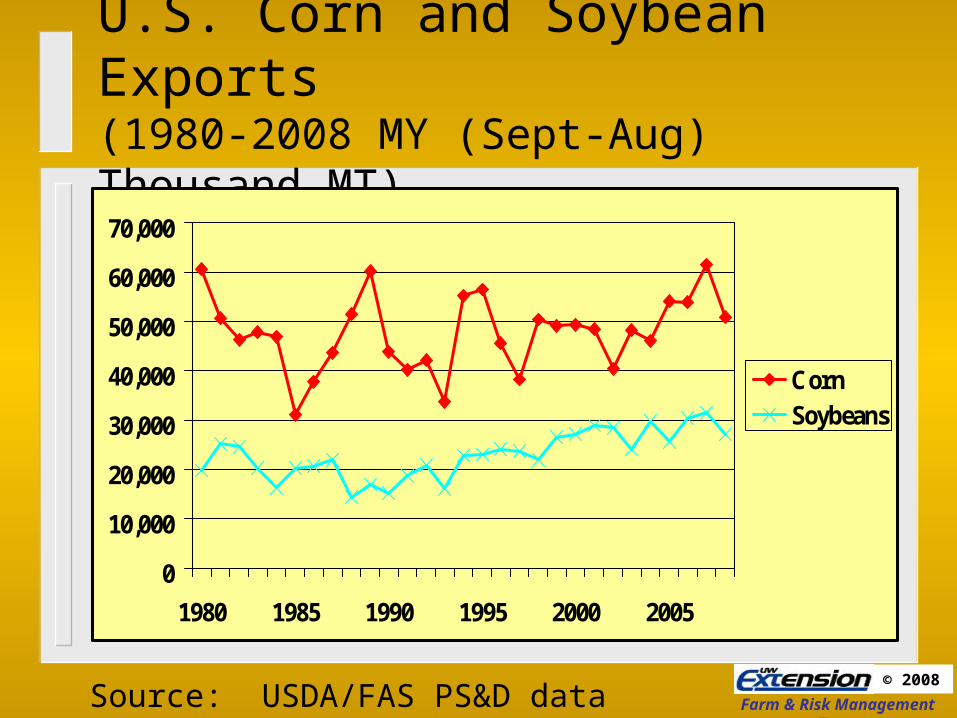
U.S. Corn and Soybean Exports (1980-2008 MY (Sept-Aug) Thousand MT)
0
10,000
20,000
30,000
40,000
50,000
60,000
70,000
1980 1985 1990 1995 2000 2005
CornSoybeans
Source: USDA/FAS PS&D data

Farm & Risk Management Team
© 2008
U.S. Beef and Pork Exports (1980-2008, Calendar Year, TMT)
0
200
400
600
800
1000
1200
1400
1600
1800
1980 1985 1990 1995 2000 2005
BeefPork20082008
Source: USDA/FAS PS&D data
Farm & Risk Management Team
© 2008
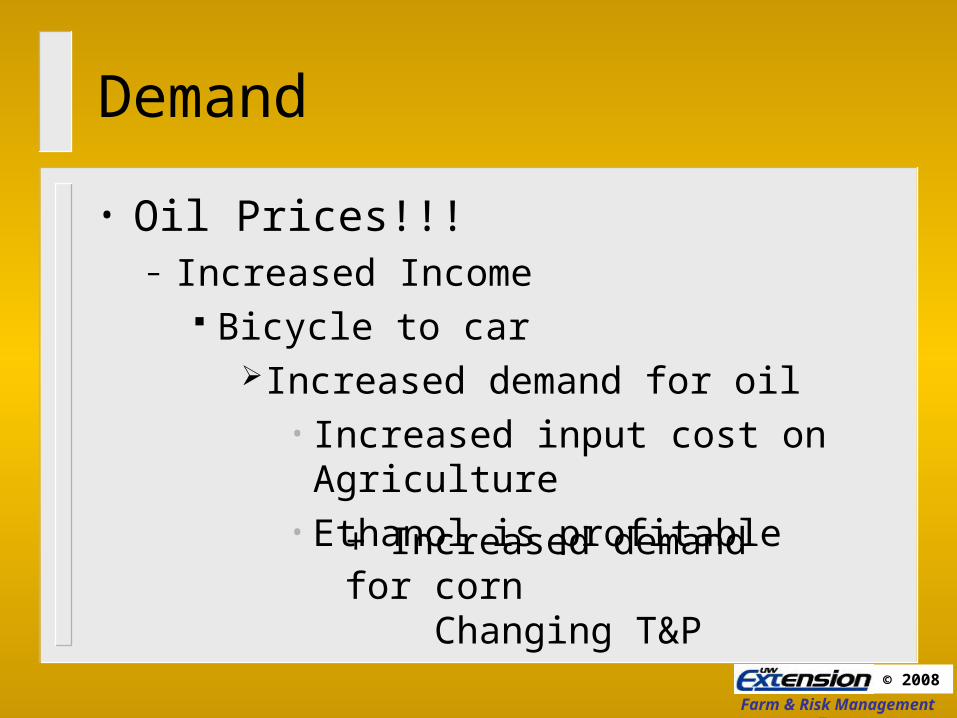
Demand
• Oil Prices!!!– Increased Income
Bicycle to carIncreased demand for oil
• Increased input cost on Agriculture• Ethanol is profitable
+ Increased demand for corn Changing T&P

Farm & Risk Management Team
© 2008
Impact on Price

Farm & Risk Management Team
© 2008
Demand
• Hedge and Index Funds
Impact on Price
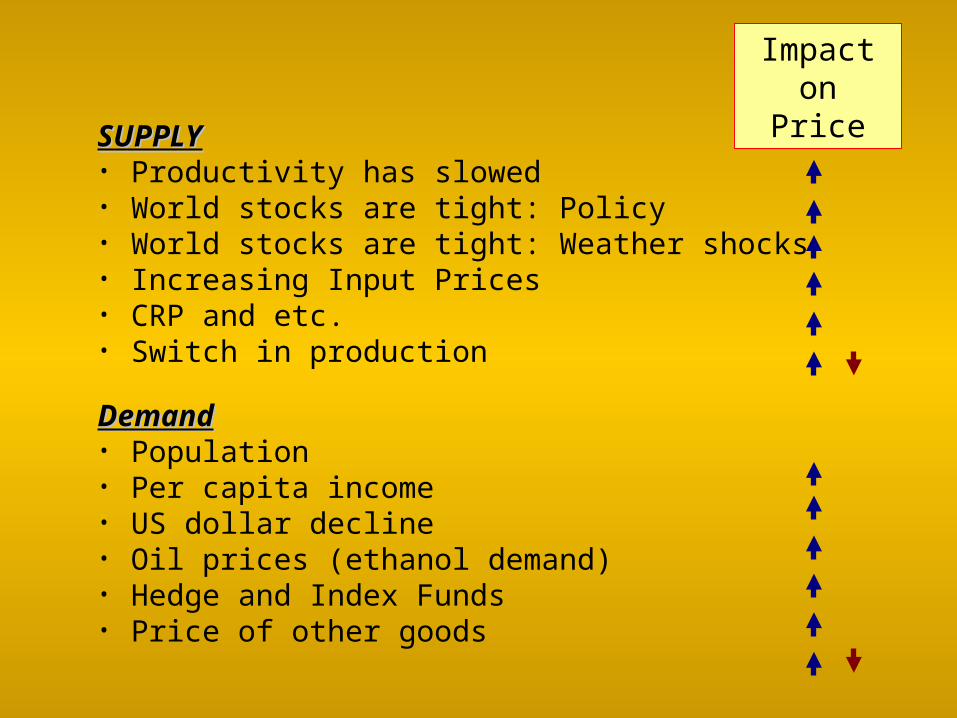
SUPPLYSUPPLY• Productivity has slowed• World stocks are tight: Policy• World stocks are tight: Weather shocks• Increasing Input Prices• CRP and etc.• Switch in production
DemandDemand• Population• Per capita income• US dollar decline• Oil prices (ethanol demand)• Hedge and Index Funds• Price of other goods
Impact on Price

Farm & Risk Management Team
© 2008
Prices – A Perfect Storm

27
Its Not July Its Not July AnymoreAnymore
Farm & Risk Management Team
© 2008
28
Demand, U.S. $ Index

Farm & Risk Management Team
© 2008

Farm & Risk Management Team
© 2008
U.S. Blended Motor Gasoline Consumption
30
Source: U.S. Department of Energy, Energy Information Administration

Farm & Risk Management Team
© 2008
Anything Else Happen Since July?
• A Dow that fell and rose by record levels within a week
• A potential world-wide financial collapse• A $700 billion dollar bailout from Congress• Similar actions by other countries• Favre’s playing for the Jets
31
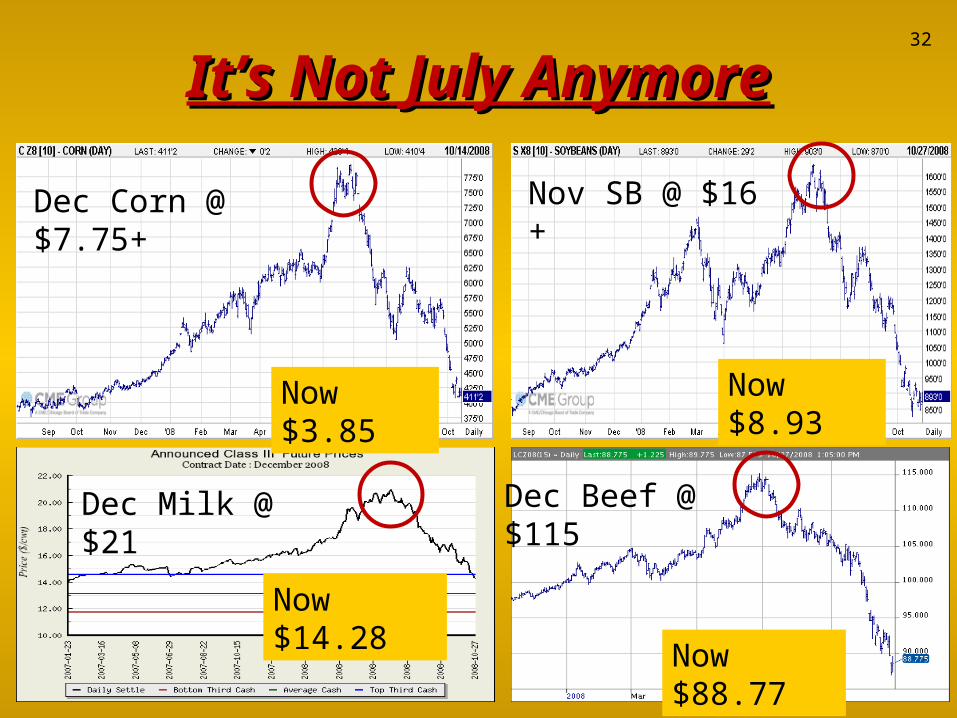
It’s Not July AnymoreIt’s Not July Anymore32
Dec Corn @ $7.75+ Nov SB @ $16 +
Dec Milk @ $21 Dec Beef @ $115
Now $3.85
Now $14.28
Now $8.93
Now $88.77
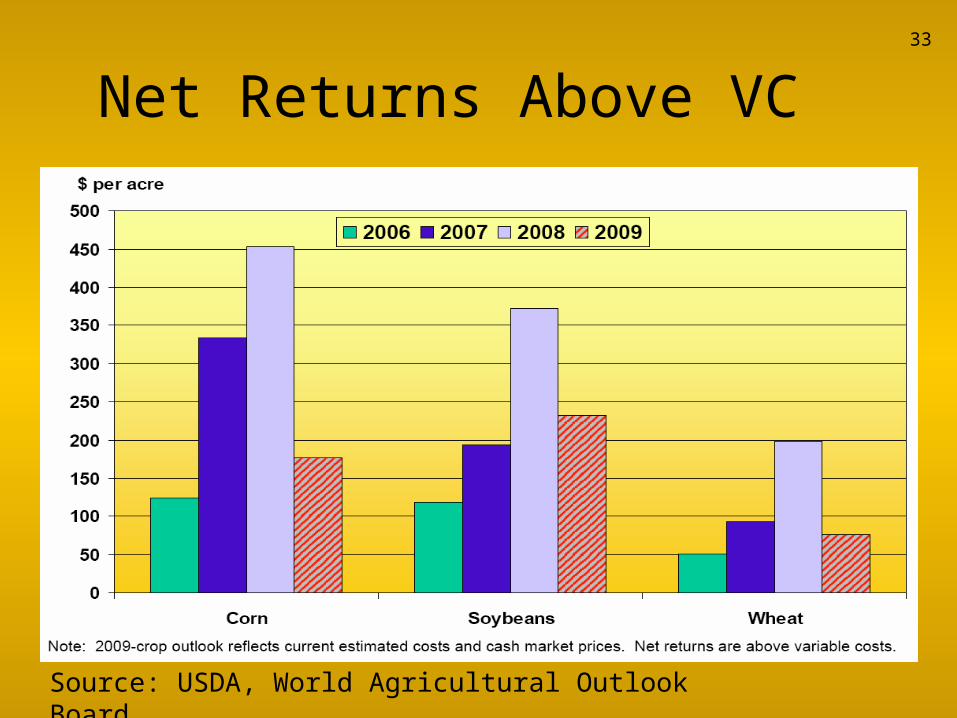
Net Returns Above VC33
Source: USDA, World Agricultural Outlook Board

34
Farm & Risk Management Team
© 2008
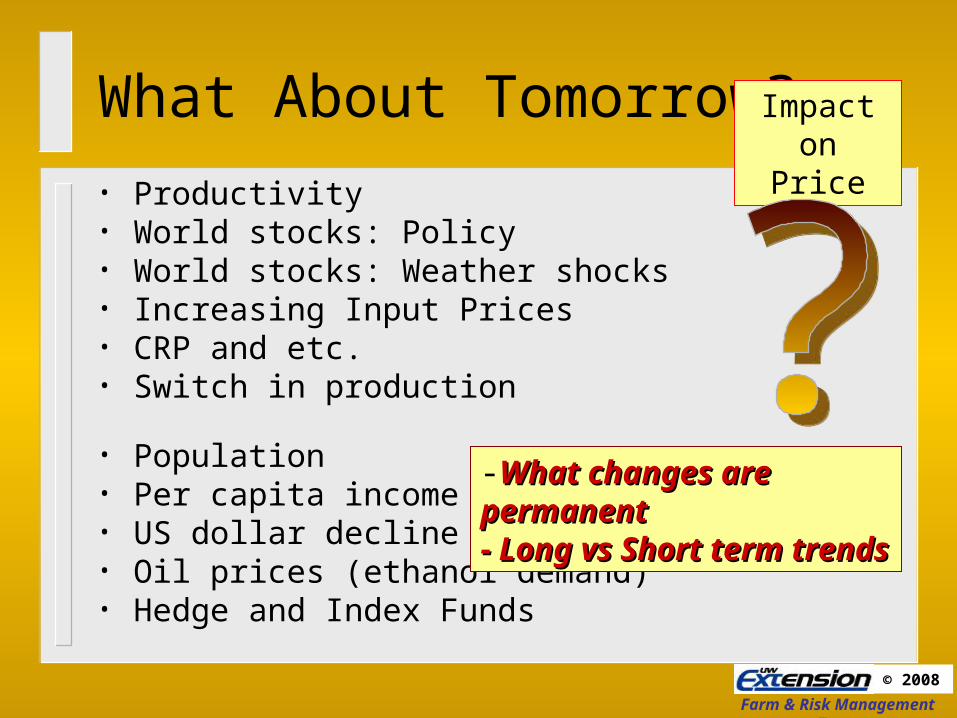
What About Tomorrow?
• Productivity • World stocks: Policy• World stocks: Weather shocks• Increasing Input Prices• CRP and etc.• Switch in production
• Population• Per capita income• US dollar decline• Oil prices (ethanol demand)• Hedge and Index Funds
Impact on Price
-What changes are permanentWhat changes are permanent- Long vs Short term trends- Long vs Short term trends

Farm & Risk Management Team
© 2008
Nominal Corn Prices(Future Range Based on Average of Prior Periods)
0
1
2
3
4
5
6
1860 1880 1900 1920 1940 1960 1980 2000 2020 2040
5.24
4.13
3.14

Farm & Risk Management Team
© 2008
Nominal Corn PricesFuture Range Based on Average of Most Recent Period Change
0
1
2
3
4
5
6
1860 1880 1900 1920 1940 1960 1980 2000 2020 2040
2.25
4.86
4.42
Farm & Risk Management Team
© 2008
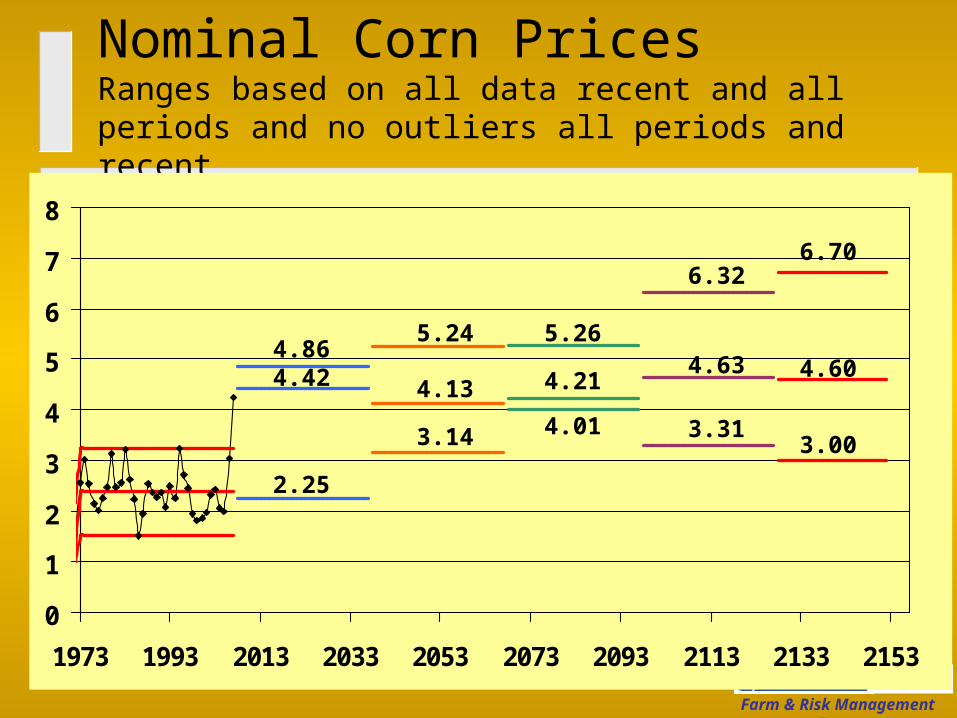
Nominal Corn PricesRanges based on all data recent and all periods and no outliers all periods and recent
0
1
2
3
4
5
6
7
8
1973 1993 2013 2033 2053 2073 2093 2113 2133 2153
2.25
4.864.42
6.326.70
4.60
3.00
4.635.26
3.31
4.21
4.01
5.24
4.13
3.14

Farm & Risk Management Team
© 2008
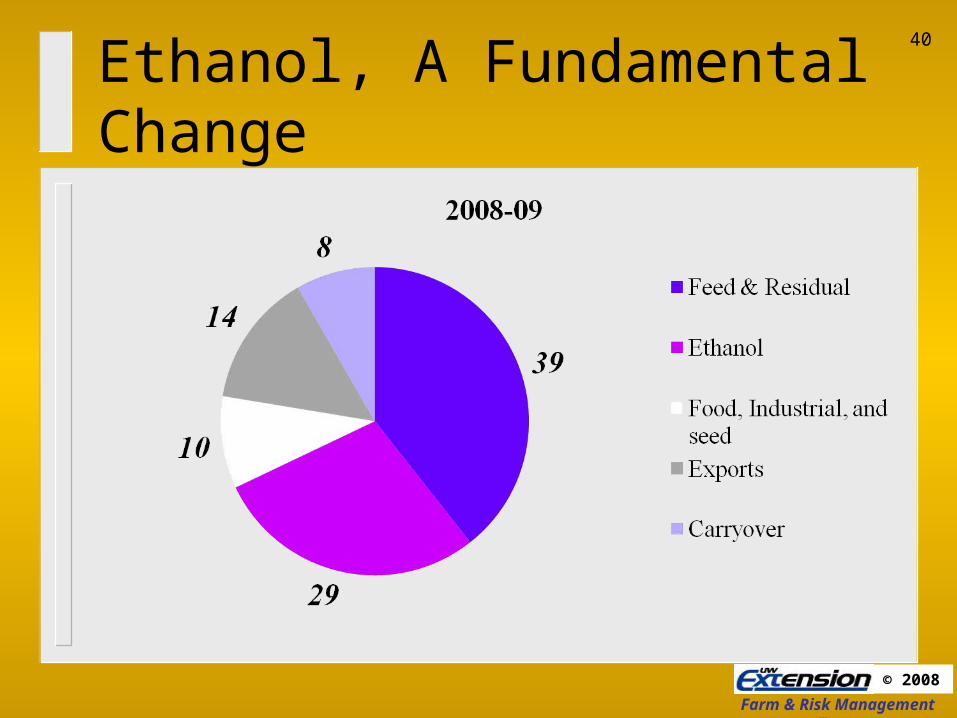
Ethanol, A Fundamental Change39
Farm & Risk Management Team
© 2008
Ethanol, A Fundamental Change40
Farm & Risk Management Team
© 2008
We’ve Hitched Ourselves to the Oil Train
41
Oil’s Volatility As WellOil’s Volatility As Well
42
Farm & Risk Management Team
© 2008
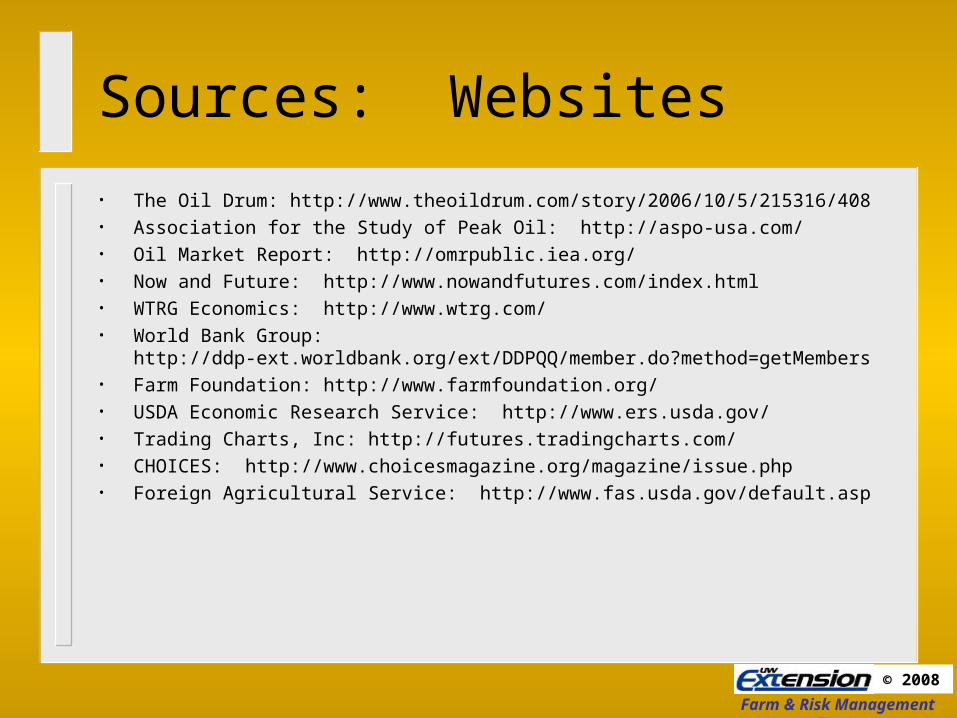
Sources: Websites
• The Oil Drum: http://www.theoildrum.com/story/2006/10/5/215316/408• Association for the Study of Peak Oil: http://aspo-usa.com/ • Oil Market Report: http://omrpublic.iea.org/ • Now and Future: http://www.nowandfutures.com/index.html • WTRG Economics: http://www.wtrg.com/ • World Bank Group: http://ddp-ext.worldbank.org/ext/DDPQQ/member.do?method=getMembers• Farm Foundation: http://www.farmfoundation.org/ • USDA Economic Research Service: http://www.ers.usda.gov/ • Trading Charts, Inc: http://futures.tradingcharts.com/ • CHOICES: http://www.choicesmagazine.org/magazine/issue.php • Foreign Agricultural Service: http://www.fas.usda.gov/default.asp

Farm & Risk Management Team
© 2008
Sources: Written Articles
• Global Agricultural Supply and Demand: Factors Contributing to the Recent Increase in Food Commodity Prices. USDA/ERS, July 2008. http://www.ers.usda.gov/Publications/WRS0801/
• Bahn, Henry. “Commodity Prices Rock World Markets: Structural Shift or Short Term Adjustments?” Choices, AAEA, 2nd qrt 2008 23(2). http://www.choicesmagazine.org/magazine/issue.php
• Westhoff, Pat. “Farm Commodity Prices: Why the Boom and What Happens Now?” Choices, AAEA, 2nd qrt 2008 23(2).
• Lawrence, John D., James Mintert, John D. Anderson, and David P. Anderson. “Feed Grains and Livestock: Impacts on Meat Supplies and Prices.” Choices, AAEA, 2nd qrt 2008 23(2).
• Irwin, Scott H., Philip Garcia, Darrel L. Good and Eugene L. Kunda. “Recent Convergence Performance of CBOT Corn, Soybean, and Wheat Futures Contracts.” Choices, AAEA, 2nd qrt 2008 23(2).
• Mark, Darrell R., B. Wade Brorsen, Kim B. Anderson, and Rebecca M. Small. “Price Risk Management Alternatives for Farmers in the Absence of Forward Contracts with Grain Merchants.” Choices, AAEA, 2nd qrt 2008 23(2).
• Abbott, Philip C., Christopher Hurt, and Wallace E. Tyner. “What’s Driving Food Prices?” Issue Report from the Farm Foundation, July 2008. http://www.farmfoundation.org/news/templates/template.aspx?articleid=404&zoneid=26
• Fortenbery, T. Randall and Hwanil Park. “The Effect of Ethanol Production on the U.S. National Corn Price.” Univ. of WI-Madison Dept. of Ag and Applied Econ: Staff Paper no. 523, April 2008.

Farm & Risk Management Team
© 2008
Sources: Other
• Extension Outlook Conference, Kansas City, Aug 18-19, 2008.
• Fortenbery, Randy. Presentation to WI Ag Consultants, March 2008.