Vietnam Economics Update September 26, 2018
17
1 Vietnam│Economics Update│September 26, 2018 Economics Update Growth remains robust ■ Vietnam’s economy expanded 7.1% yoy in 1H18 and we forecast GDP growth to be reported at 6.8% yoy for 3Q18. ■ Depreciation pressures on the dong have eased but still linger. ■ We rule out a potential policy rate hike towards the end of 2018. ■ Vietnam’s fundamentals are sound compared to other emerging markets with ample FX, a current account surplus and a fiscal balance under control. ■ The US-China trade war could hurt computer parts and components exports; potential beneficiaries: exporters of handbags, furniture and fishery products. We expect GDP growth to remain strong in 3Q18 The latest reading on industrial activities showed better-than-expected growth (Index of Industrial Production, IIP, grew at 14.3% yoy in Jul and 13.4% yoy in Aug), which pointed to a sustained expansion in the manufacturing sector. Despite a high base in 3Q17, we expect GDP growth in 3Q18 to remain strong at 6.8% yoy. There could be a positive surprise in 4Q18, which could bring GDP growth to 6.9% for the full year. Depreciation pressures on the dong have eased but linger We believe pressures on the dong have eased in the short run as 1) the country has a healthy balance of payments, thanks to a trade surplus and positive FDI inflow; 2) PBOC has undertaken measures to mitigate Rmb depreciation pressure; and 3) market sentiment has improved in the official and black markets. In the long run, we think policy makers will tolerate modest depreciation in the dong amid broad US$ strength. We do not project a policy rate hike in end-2018 The recent developments in Vietnam’s money market offer a slew of signals on where we are in the interest rate cycle. Interbank rates rose to a record high, bond yields rebounded and there was a small hike in deposit rates. We view this tightening of liquidity in the banking system as a normalisation of monetary conditions. As such, we believe that the SBV will not be rushed into a policy rate hike this year. Fundamentals remain sound compared to other emerging markets In many emerging markets, financial conditions have tightened more appreciably, particularly for countries with large current account deficits and high inflation rates. For Vietnam, we believe that the risk is relatively limited since Vietnam has much stronger fundamentals than Argentina and Turkey or even Indonesia and seems less vulnerable to current account pressures compared to other Asian countries. Be selective to ride an escalating US-China trade war We think pressure is building for Vietnamese technology exporters, especially computer parts and components. However, we also see a silver lining for domestic exporters of handbags, furniture and fishery products as US tariffs on Chinese imports in these categories are unlikely to be absorbed by the producers, rendering them uncompetitive vis-à-vis Vietnam. Figure 1: Vietnam's real GDP growth by sector SOURCES: VND RESEARCH, VIETNAM GENERAL STATISTICS OFFICE Vietnam Economist(s) My TRAN Ha T (84) 96 681 1636 E [email protected] -1.0% 0.0% 1.0% 2.0% 3.0% 4.0% 5.0% 6.0% 7.0% 8.0% 1Q2015 2Q2015 3Q2015 4Q2015 1Q2016 2Q2016 3Q2016 4Q2016 1Q2017 2Q2017 3Q2017 4Q2017 1Q2018 2Q2018 Agriculture, forestry and fishing Industry and construction Service Taxes and subsidies
Transcript of Vietnam Economics Update September 26, 2018

1
Vietnam│Economics Update│September 26, 2018
Economics Update Growth remains robust
■ Vietnam’s economy expanded 7.1% yoy in 1H18 and we forecast GDP
growth to be reported at 6.8% yoy for 3Q18.
■ Depreciation pressures on the dong have eased but still linger.
■ We rule out a potential policy rate hike towards the end of 2018.
■ Vietnam’s fundamentals are sound compared to other emerging markets with
ample FX, a current account surplus and a fiscal balance under control.
■ The US-China trade war could hurt computer parts and components exports;
potential beneficiaries: exporters of handbags, furniture and fishery products.
We expect GDP growth to remain strong in 3Q18 The latest reading on industrial activities showed better-than-expected growth (Index of
Industrial Production, IIP, grew at 14.3% yoy in Jul and 13.4% yoy in Aug), which pointed
to a sustained expansion in the manufacturing sector. Despite a high base in 3Q17, we
expect GDP growth in 3Q18 to remain strong at 6.8% yoy. There could be a positive
surprise in 4Q18, which could bring GDP growth to 6.9% for the full year.
Depreciation pressures on the dong have eased but linger We believe pressures on the dong have eased in the short run as 1) the country has a
healthy balance of payments, thanks to a trade surplus and positive FDI inflow; 2) PBOC
has undertaken measures to mitigate Rmb depreciation pressure; and 3) market
sentiment has improved in the official and black markets. In the long run, we think policy
makers will tolerate modest depreciation in the dong amid broad US$ strength.
We do not project a policy rate hike in end-2018 The recent developments in Vietnam’s money market offer a slew of signals on where we
are in the interest rate cycle. Interbank rates rose to a record high, bond yields rebounded
and there was a small hike in deposit rates. We view this tightening of liquidity in the
banking system as a normalisation of monetary conditions. As such, we believe that the
SBV will not be rushed into a policy rate hike this year.
Fundamentals remain sound compared to other emerging markets In many emerging markets, financial conditions have tightened more appreciably,
particularly for countries with large current account deficits and high inflation rates. For
Vietnam, we believe that the risk is relatively limited since Vietnam has much stronger
fundamentals than Argentina and Turkey or even Indonesia and seems less vulnerable to
current account pressures compared to other Asian countries.
Be selective to ride an escalating US-China trade war We think pressure is building for Vietnamese technology exporters, especially computer
parts and components. However, we also see a silver lining for domestic exporters of
handbags, furniture and fishery products as US tariffs on Chinese imports in these
categories are unlikely to be absorbed by the producers, rendering them uncompetitive
vis-à-vis Vietnam.
Figure 1: Vietnam's real GDP growth by sector
SOURCES: VND RESEARCH, VIETNAM GENERAL STATISTICS OFFICE
Vietnam
Economist(s)
My TRAN Ha
T (84) 96 681 1636 E [email protected]
Title:
Source:
Please fill in the values above to have them entered in your report
-1.0%
0.0%
1.0%
2.0%
3.0%
4.0%
5.0%
6.0%
7.0%
8.0%
1Q2015 2Q2015 3Q2015 4Q2015 1Q2016 2Q2016 3Q2016 4Q2016 1Q2017 2Q2017 3Q2017 4Q2017 1Q2018 2Q2018
Agriculture, forestry and fishing Industry and construction Service Taxes and subsidies
2
Vietnam│Economics Update│September 26, 2018
Growth remains robust and broad-based
Vietnam’s GDP growth remains resilient
The Vietnamese economy expanded by 6.8% yoy in 2Q18 after GDP growth of
7.5% yoy in the first quarter (revised up from an initial estimate of 7.4% yoy).
Vietnam’s real GDP therefore recorded robust growth of 7.1% yoy in 1H18, led
by strong manufacturing activity and domestic consumption. In our previous note,
we forecast GDP growth to ease in the second half of 2018. However, the latest
reading on industrial activities points to sustained strength in manufacturing.
According to the General Statistics Office (GSO), the IIP rose 14.3% in Jul and
13.4% in Aug, supported by stronger manufacturing and a rebound in mining
activities. As expected, the debut of the Nghi Son Refinery and Petrochemical
complex boosted petroleum products output by 60.5% yoy in the first eight
months of 2018, bolstering manufacturing growth. Despite an escalating trade
war, export growth was sustained in the Jul-Aug period with the launch of
Samsung’s Galaxy Note 9 smartphone.
Figure 2: Industrial production growth and Vietnam PMI Figure 3: Retail sales value and growth (Jan 17-Aug 18)
SOURCES: VND RESEARCH, GSO, NIKKEI SOURCES: VND RESEARCH, GSO
In addition, domestic demand remains resilient, supported by sustained high
consumer confidence levels. Retail sales (ex-inflation) grew 8.5% yoy in the first
eight months of 2018 vs. 8.4% in the same period the previous year. Despite a
high base in 3Q17, we expect GDP growth in 3Q18 to remain strong at 6.8% yoy.
Our 2018 economic growth forecast remains unchanged at 6.8% as we maintain
our 4Q18 GDP forecast at 6.5%. However, we see the likelihood of a positive
growth surprise in 4Q18, which could raise full-year GDP growth to 6.9%.
Depreciation pressures on the dong have eased but linger
The dong turned materially weaker from 20 Jul 2018. Although the DXY index
appreciated only 0.4%, the dong depreciated 1.0% against the US$ over the
period 20 Jul-13 Sep, largely owing to concerns about Rmb depreciation amid
rising trade tensions and the recent economic turmoil in Turkey putting pressure
on emerging market currencies, including the dong. Notably, the black market
exchange rate broke the upper boundary of the currency band to touch 23,650
dong per US$, expanding the spread between the black market and the official
exchange rate to a record high in mid-Aug 2018.

3
Vietnam│Economics Update│September 26, 2018
Figure 4: Exchange rate movements (dong per US$) Figure 5: Asian currencies’ depreciation against US$ (ytd)
SOURCES: VND RESEARCH, BLOOMBERG SOURCES: VND RESEARCH, BLOOMBERG
Figure 6 illustrates key indicators that we use to analyse the exchange rate
movement. Although most trend-related indicators reflect negatively on the
dong’s stability, we see pressures on the dong depreciation being contained in
the short term due to the following reasons:
1) Positive current account: Vietnam posted a surprise US$2.2bn trade surplus in Aug 2018, thanks to the recovery of telephone exports; although there were net outflows in both equity and bond markets in Jul-Aug 2018, FDI inflow has continued to support the supply side of US$.
2) The People’s Bank of China (PBOC) raised its reserve requirement on some trading of foreign-exchange forward contracts from 0% to 20%, making it more expensive to short the Rmb. This is meant to be part of its counter-cyclical measures to control the Rmb depreciation.
3) Sentiment on the dong has improved in the black market. In addition, the spread between the dong and US$ interbank rates has turned positive, reducing the banks’ incentive to hoard US$.
In the medium term, depreciation pressure could reappear if the US-China tariff
dispute escalates into a full-blown and sustained trade war. Another risk is
currency turmoil in emerging markets, especially evident in Argentina and
Turkey. However, Vietnam is well equipped to weather the volatility due to a
healthy balance of payments, in our view.
For now, investors are waiting for two more Fed rate hikes in the remaining
months of 2018 and several more in 2019. We think policy makers could tolerate
some modest depreciation in the dong amid broad US$ strength. Meanwhile, a
sharp depreciation is unlikely given the lessons learnt by policy makers in Aug
2015 where a sharp competitive devaluation of the VND could hurt market
confidence and endanger Vietnam’s economic stability. Furthermore, stiff tariffs
on Chinese imports into the US imply that Vietnam does not need to match the
devaluation of the Rmb to maintain competitiveness versus Chinese exports as
was the case in previous rounds of competitive devaluation.
Compared to other Asian currencies, such as the Indian rupee, Indonesian
rupiah and Philippine peso, which have been among the worst-performing
regional currencies, Vietnam has experienced a relatively small depreciation
(just 2.5% YTD). We maintain our forecast of a 3.0-3.6% full-year depreciation
vs. the US$ for 2018.
Title:
Source:
Please fill in the values above to have them entered in your report
22000
22200
22400
22600
22800
23000
23200
23400
23600
23800
Jan-18 Feb-18 Mar-18 Apr-18 May-18 Jun-18 Jul-18 Aug-18 Sep-18
Central rate Official rate Parallel rate Upper bound
Title:
Source:
Please fill in the values above to have them entered in your report
-13.8%
-10.2%
-8.8%
-5.6%
-4.8% -4.6%
-2.9% -2.8%-2.2%
0.4%
INR IDR PHP RMB MYR KRW TWD VND SGD THB

4
Vietnam│Economics Update│September 26, 2018
Figure 6: Key indicators for exchange rate
SOURCES: VND RESEARCH
NOTE: USD/CNY and central rate columns: positive value meant the CNY depreciation and the dong depreciation, respectively.
(+): positive impact on the dong’s stability; (-): negative impact on the dong’s stability
Higher rate environment still on the cards
Interbank liquidity is tightening, driven by pressure on the dong
In our view, pressure on the dong has tightened banking liquidity since Jul 2018
because of a direct FX intervention by the central bank in selling US$. In mid-Jul
2018, the State Bank of Vietnam (SBV) sold nearly US$2bn worth of forex to
commercial banks, which led to a fall in dong liquidity. In order to counteract this
action, the SBV injected liquidity into the banking system via open market
operations (OMO). However, we see that the intended neutralisation was not
sufficient to bring down interbank rates. The overnight rate is currently at the
highest level seen in 2018, hovering at around 4.0-4.5%.
Figure 7: Interbank rates have surged since Jul 2018 Figure 8: Cash withdrawal/injection via open market operations
(VND bn)
SOURCES: VND RESEARCH, BLOOMBERG SOURCES: VND RESEARCH, SBV
Government bond (G-bond) yields on the rise
The Vietnam government bond market experienced a sharp decline in yields
during the first half of the year due to excess liquidity in the banking system
which led to easy absorption of government bond auctions. However, as liquidity
has tightened and foreign investors have continued their net selling in the bond
market, Vietnam bond yields have significantly recovered since the last two
months. Yields on 5-year and 10-year government bonds are currently at 4.5%
and 5.1%, respectively. Both yields have recovered to the same levels as at the
end of last year. The yield spread between Vietnam and US government bonds
widened to 212 basis points from its record low of 123 basis points in early 2018.
In the primary market, demand for G-bonds has declined with the average
winning ratio at around 54.3% in three recent months. Winning yields have also
Trade
balance
Equity
flow
Bond flow FDI US$ deposits
growth
US$ loans
growth
Spread bw black
& official markets
USD/VND rate
DXY USDCNY Spread bw VND
& US$
interbank rates
Central rate
(USDVND)
US$ m US$ m US$ m US$ m ytd % ytd % avg. (dong) % chg % chg avg. (% points) % chg
1Q18 2732 524 49 3880 na na -14 -2.3% -4.0% -0.1 0.2%
2Q18 1008 1065 29 4490 -3.1% 8.0% 35 5.0% 6.0% -0.5 0.9%
3Q18E 2758 -155 -215 4280 na na 147 -0.3% 3.3% 1.1 0.3%
Impact (+) (-) (-) (+) (-) (-) (-) (+) (-) (+)
Note Estimated 3Q (till 25
Sep)
3Q (till 25
Sep)
Estimated End of May
2018
End of May
2018
Gap was
narrowed vs. the
early of 3Q
DXY has fallen
recently
Depreciation has
eased after the
PBoC's intervention
Turn to positive
in 3Q
Gov. controls
Supply-demand side Trend
Title:
Source:
Please fill in the values above to have them entered in your report
0.0%
0.5%
1.0%
1.5%
2.0%
2.5%
3.0%
3.5%
4.0%
4.5%
5.0%
Jan-18 Feb-18 Mar-18 Apr-18 May-18 Jun-18 Jul-18 Aug-18 Sep-18
ON 1M 3M
Title:
Source:
Please fill in the values above to have them entered in your report
(80,000)
(60,000)
(40,000)
(20,000)
-
20,000
40,000
60,000
Jan-18 Feb-18 Mar-18 Apr-18 May-18 Jun-18 Jul-18 Aug-18 Sep-18

5
Vietnam│Economics Update│September 26, 2018
increased; the yield on 10-year government bond posted an increase of 34bp in
3Q18. We think a sharp drop in bond yields in the first half was largely driven by
excess liquidity in the banking system. Therefore, tightening interbank liquidity
led to a rebound of G-bond yields to their normal levels rather than foreign
selling of bonds as was the case in many Asian emerging markets; this is largely
because foreign participation in Vietnam’s G-bond market is rather limited.
Nonetheless, this and yields’ rise in itself is not a clear signal for any potential
policy rate hikes in the near term as yields still remain low relative to historical
levels even as the policy rate has remain unchanged.
Figure 9: Vietnam government bond yields Figure 10: The spread between 10-year Vietnam and US yields
SOURCES: VND RESEARCH, BLOOMBERG SOURCES: VND RESEARCH, SBV, BLOOMBERG
We are not too concerned about a recent rise in deposit rates
In recent months, many local banks have adjusted up their deposit rates across
tenors by 10-30 basis points. There might be concerns about higher funding
costs for banks, but we still believe these adjustments will not have a significant
impact on local banks’ profitability as well as the outlook for lending rates. We
see two main reasons for the recent hike in deposit rates: 1) the SBV only allows
banks to use 40% of their short-term capital for long and medium-term loans
from 2019 instead of 45% as in this year. Therefore, banks have to raise deposit
rates for tenors of more than 12 months in order to attract more long term
funding to meet SBV’s requirement for next year; and 2) in first half of 2018,
some major banks cut deposit rates to unusually low levels because of excess
liquidity. Now, with liquidity tightening, a hike in deposit rates is a necessity. In
early Aug 2018, the SBV issued Directive No.04, which strictly controls credit
growth pace and credit quality of the banking system. As the SBV
communicated a more conservative monetary policy, we think the SBV has
recognised the need for measures to contain rising external risks. In other words,
we see SBV’s communication of their monetary policy direction as a strong
signal indicating their intention to implement a tighter monetary policy in the
future, even if this is accomplished without a hike in policy rates.
What do we expect?
Our observations are that the SBV has tightened by 1) reducing interventions in
the OMO market; 2) requiring banks to control their lending according to credit
growth limits set by the SBV; and 3) targeting credit growth at a maximum of
17% for 2018, lower than the 18.2% recorded last year. While we stress that the
recovery of interbank rates and bond yields alone is not a clear signal for a hike
in policy rates, it is a helpful starting point to assess the outlook for interest rates,
especially from 2019 onwards.
For now, domestic inflation is stable and the dong has only depreciated slightly
against the US dollar. If the dong faces greater pressure and inflationary
expectation rises beyond the 5.0% threshold, the SBV might be forced to hike
rates. Against the backdrop of rising global uncertainty led by lingering concerns
about emerging market financial turmoil, increasing global trade tensions and
Title:
Source:
Please fill in the values above to have them entered in your report
0.0%
1.0%
2.0%
3.0%
4.0%
5.0%
6.0%
7.0%
8.0%
Jan-1
5
Mar-
15
May-
15
Jul-15
Sep-1
5
Nov-
15
Jan-1
6
Mar-
16
May-
16
Jul-16
Sep-1
6
Nov-
16
Jan-1
7
Mar-
17
May-
17
Jul-17
Sep-1
7
Nov-
17
Jan-1
8
Mar-
18
May-
18
Jul-18
1Y 3Y 5Y 10Y
Title:
Source:
Please fill in the values above to have them entered in your report
0.0%
1.0%
2.0%
3.0%
4.0%
5.0%
6.0%
7.0%
8.0%
Jan-1
5
Mar-
15
May-
15
Jul-15
Sep-1
5
Nov-
15
Jan-1
6
Mar-
16
May-
16
Jul-16
Sep-1
6
Nov-
16
Jan-1
7
Mar-
17
May-
17
Jul-17
Sep-1
7
Nov-
17
Jan-1
8
Mar-
18
May-
18
Jul-18
Yield spread 10Y VN GB 10Y UST
Refinancing rate Discount rate

6
Vietnam│Economics Update│September 26, 2018
monetary policy tightening by the central banks in developed countries in 2019
and beyond, we believe SBV’s policy rate hike is likely to happen next year. We
now project a 50bp hike in policy rates in 2019, bringing the discount rate and
refinancing rate to 4.75% and 6.75%, respectively.
Emerging market financial turbulence is unlikely to have a huge impact on Vietnam Turkey and Argentina are experiencing a bout of financial instability against the
backdrop of rising US rates and the effects of a resurgent US$. The instability is
evident in the sharp depreciation of the Turkish lira and Argentine peso, which
have fallen by 65.0% and 105.2% YTD, respectively. Weak fundamentals, as
evidenced by high inflation and sizeable current account and budget deficits
have contributed to the erosion of confidence in these economies and are
spurring anxiety in financial markets that tightening credit cycle conditions
globally may spread to a broader set of frontier and emerging economies,
including Vietnam. As we see in Figure 11, Turkey and Argentina seem
vulnerable according to all indicators. For Asia frontier and emerging countries,
we think a high current account deficit and high inflation rate might trigger a
large currency depreciation. For Vietnam, we believe that the risk is relatively
limited since Vietnam has much stronger fundamentals than Argentina and
Turkey, and seems less vulnerable in its current account balance compared to
other Asian countries such as Indonesia, the Philippines and India.
In particular, Vietnam’s Aug headline inflation eased to just under 4.0% from
4.5% in Jun 2018, due to a decline in government-administered healthcare costs.
Although we see broad inflationary pressures in food and transportation prices,
we expect administrative controls and monetary tightening from the SBV to keep
inflation under control this year (the SBV’s target of below 4%). If successful, this
will be well below levels seen in Argentina and Turkey. Other vulnerability
indicators show a mixed picture. Vietnam is more vulnerable than peers in terms
of external debt and import cover. However, it is important to note that external
debt risk is contained as concessional loans account for around 40% of
government guaranteed external debt. Regarding import cover, traditional “rules
of thumb” that have been used to guide reserve adequacy suggest that countries
should hold reserves covering 100% of short-term debt or the equivalent of three
months’ worth of imports. But for FDI-dependent economies like Vietnam that
operate in downstream stages of the export manufacturing value chain, we think
these traditional measures of reserve adequacy have limited relevance as a
sizeable portion of Vietnam’s imports are inputs for manufactured exports. If
exports slow down due to a full-blown of trade war, import deceleration will
follow, thereby mitigating the risk of a balance of payments crisis.
Figure 11: Vulnerability indicators for Asia emerging and frontier economies compared to Turkey and Argentina
SOURCES: VND RESEARCH, CEIC, WB, ADB, BLOOMBERG
Note: Current account balance/GDP, external debt/GDP, Fiscal balance/GDP and short-term external as of 2017. Import cover as of Jun 2018 for China, Korea, Indonesia, Pakistan, Argentina; as of May 2018 for remaining countries. Inflation as of Jun 2018; year-to-date change in local currency vs. US$.
Market Country Current account
balance/GDP
External
debt/GDP
Short-term
external
debt/reserves
Import cover
(months)
Fiscal
balance/GDP
Inflation YTD change in
local currency
vs. US$
Emerging China 1.3 14.0 34.8 17.8 (2.9) 1.9 5.4
Emerging Korea 5.1 27.3 30.2 8.7 1.4 1.5 4.6
Emerging India (2.0) 20.0 25.1 8.9 (3.5) 5.0 13.8
Emerging Indonesia (1.7) 34.8 38.6 10.1 (2.5) 3.1 10.2
Emerging Malaysia 3.0 65.0 92.0 5.6 (5.4) 0.8 2.3
Emerging Pakistan (4.1) 27.4 19.5 1.9 (5.8) 5.2 11.6
Emerging Philippines (0.8) 23.3 19.5 7.3 (2.2) 5.7 8.8
Emerging Thailand 10.8 35.3 31.9 9.8 0.9 1.4 (0.4)
Frontier Bangladesh (2.5) na na 5.6 (4.8) 5.5 2.5
Frontier Sri Lanka (2.7) 59.5 109.4 4.3 (5.5) 2.5 9.9
Frontier Vietnam 2.7 48.9 45.0 3.0 (3.5) 4.5 2.8
Emerging Turkey (5.6) 53.2 21.4 3.7 (1.6) 15.4 62.6
Frontier Argentina (4.9) 37.0 67.1 10.1 (6.0) 29.5 105.2

7
Vietnam│Economics Update│September 26, 2018
Neither Turkey nor Argentina are important export markets for Vietnam,
therefore, the impact of a sharp depreciation of the Turkish lira and Argentine
peso on Vietnam’s trade is not significant. However, Argentina is Vietnam’s
largest source market for corn and animal feed products, accounting for 50.8%
and 46.2% of total imports of these two products into Vietnam in 2017,
respectively. Therefore, domestic animal feed companies (DBC VN Equity, Not
Rated) could benefit from the plummeting peso, and thereby lower their
production costs. Since Turkey and Argentina do not compete directly with
Vietnam in terms of exports to a significant degree, we do not believe that
Vietnam will lose export market share to these countries as a result of the
devaluation.
The escalating US-China trade war remains the biggest unknown In our view, the big risk that markets may not yet have fully factored in is the
growing threat of a trade war between the US and China, whose effects would
ripple through regional supply chains. With the US$50bn of tariffs becoming a
done deal for both countries, the focus is now on the next US$200bn of Chinese
goods and US$60bn of US goods that are targeted for additional tariffs. In the
latest development, President Trump announced 10% tariff hikes on an
additional US$200bn of Chinese goods, starting from 24 Sep 2018 with the tariff
expected to kick up to 25% from 01 Jan 2019. If implemented, the latest round of
tariffs would cover half of the total Chinese goods imported into the US and
nearly all of US goods exports to China in 2017.
Figure 12: US-China tariff timeline
SOURCES: VND RESEARCH, US CENSUS
Vietnam was in the top 15 list of the US’s import partners with around US$46bn
worth of imports in 2017. The US was ranked 3rd in Vietnam’s list of top trading
partners with total trade of US$51bn in 2017. China, on the other hand was
Vietnam’s top trading partner with a total trade value of US$94bn in 2017. The
US was Vietnam’s largest export destination in 2017 (19.4% of total exports)
while China was Vietnam’s largest import partner (27.5% of total imports).
In this report, we access the list of the whole package of tariffs for Chinese
goods including: 1) the US$50bn that was already implemented; and 2) the
proposed US$200bn awaiting official implementation by the US. In our view, the
direct impact on Vietnam from the US tariff on Chinese goods is relatively
insignificant for the US$50bn list as most of the products on this list are
comprised of intermediate inputs and capital equipment; consumer goods made
up only 1% of the list; the total value of Vietnam’s export products that are
exposed to this list was around US$4.4bn, only accounting for 2.1% of Vietnam’s
total exports in 2017.
However, we are concerned about the next set of tariffs worth US$200bn on
Chinese goods. We estimate the total value of Vietnam’s export products that
are exposed to the US$200bn list to be around US$13.5bn, which is equivalent
to 29.3% of Vietnam’s total exports to the US and 6.3% of Vietnam’s total
exports in 2017. In our view, the impact of the ongoing US-China trade war on
Vietnam could be four-pronged:
Direct decline in demand for intermediate goods used in the production of China’s exports to the US (negative).
Date in effect Tariff Value of goods (US$ bn) % of imports from China
6 Jul 2018 25% 34 6.7%
23 Aug 2018 25% 16 3.2%
Proposed 10-25% 200 39.6%
Implied next step na 267 52.8%
Date in effect Tariff Value of goods (US$ bn) % of imports from US
6 Jul 2018 25% 34 26.2%
23 Aug 2018 25% 16 12.3%
Proposed 5-10% 60 46.2%
US-led
China-led

8
Vietnam│Economics Update│September 26, 2018
Indirect decline in demand for final consumer goods due to rising costs for US consumers (negative).
Potential rise in demand for alternative sources if the US needs substitutes for Chinese goods (positive).
Indirect impact on Vietnam’s exports to China as a result of slower Chinese economic growth denting Chinese consumption (negative).
Figures 13 &14 illustrate the types of goods subject to the US tariffs. The list has
been expanded to target consumer products. Figure 15 shows the potential
products from Vietnam that are exposed to the US$200bn list. Vietnam is one of
the top suppliers of furniture (PTB VN Equity, Not Rated) and handbags (GIL
VN Equity, Not Rated), after China. Therefore, Vietnam could become an
alternative sourcing destination for the US, thereby benefiting exports. The US
tariffs on Chinese agricultural products could also indirectly benefit Vietnam. In
fact, Vietnam’s exports of agricultural products, fishery products (VHC VN
Equity, Not Rated), vegetables & fruits will benefit the most if the US needs
substitutes for Chinese imports. Moreover, these measures would directly raise
the price of the Chinese goods that are subject to the tariffs and therefore
encourage Vietnamese exporters to raise prices as well.
In contrast, companies that produce intermediate goods used in the production
of China’s exports to the US may see softer demand. The imposition of direct
tariffs on telecommunication equipment and computer exports is likely to hurt
Vietnam’s exports of these products. Since some of these products are re-
processed and re-exported to China in the form of semi-finished products, tariffs
on Chinese goods may harm Vietnamese exports as they might cascade up the
value chain. However, in the case of telephone exports, most Vietnamese
exports are final products. Therefore, the impact will not be significant, in our
view. Computer parts & components might be affected the most. For other
types of products (auto parts, electrical transformers, plastics, lamps, steel,
aluminium), we assume that they are not sold as raw or intermediate products to
be re-exported to the US. In other words, they are more subject to Chinese end
consumption which could suffer indirectly due to a sharper slowdown in China’s
economy due to the trade war.
Figure 13: US imports from China subject to the US$200bn list by
type – category-wise share of imports
Figure 14: US imports from Vietnam that overlap with the
US$200bn list by type – category-wise share of imports
SOURCES: VND RESEARCH, USTR, PIIE SOURCES: VND RESEARCH, USTR, PIIE
Title:
Source:
Please fill in the values above to have them entered in your report
Capital goods29%
Intermediate goods
47%
Others1%
Consumer goods23%
Title:
Source:
Please fill in the values above to have them entered in your report
Capital goods13%
Intermediate goods
23%
Others3%
Consumer goods61%

9
Vietnam│Economics Update│September 26, 2018
Figure 15: Export product categories that Vietnam is exposed to in the US tariffs imposed on US$200bn worth of Chinese imports
SOURCES: VND RESEARCH, UNTACD, PIIE, USTR
There are risks that the tariffs will significantly pressure China’s economic
growth particularly into 2019. According to Bloomberg’s median estimation, the
ongoing trade conflict will reduce China’s economic growth to 6.3% in 2019 from
the 6.6% expected this year. Again, China is the top trading partner of Vietnam,
ranked 1st in term of imports into Vietnam and ranked 3rd in term of Vietnam’s top
export markets. By and large, if overall regional and China-centric trade flows
decline, Vietnam will likely take a hit due to its dependence on trade and
manufacturing activities with China but the potential fallout is not quantifiable
due to the complex nature of supply chains. There could also be financial
spillovers, dampening FDI and portfolio investments as companies delay capex
plans and financial investors scurry for cover. We believe markets have not yet
priced in a long and hard US-China confrontation. In the latest announcement,
President Trump further said that another US$267bn of Chinese goods are
coming under consideration for additional tariffs. This would bring tariff actions
on all of China’s exports to the US.
Figure 16: Top 10 exports to China from Vietnam (2017, US$ bn) Figure 17: Top 10 imports to Vietnam from China (2017, US$ bn)
SOURCES: VND RESEARCH, VIETNAM CUSTOMS SOURCES: VND RESEARCH, VIETNAM CUSTOMS
Products Category Impact
Value (US$ m) % of total US
imports
Value (US$ m) % of total US
imports
Value (US$ m) % of total VN
exports
Telecommunication
equipment
Capital 23,509 47.5% 903 1.8% 41,634 19.4% Not clear
Computers, parts and
accessories of computer
66%: intermediate,
34%: capital
23,110 21.7% 162 0.2% 25,978 12.1% Negative
Furniture Mixed; 65%:
consumer
21,088 45.4% 4,624 10.0% 6,646 3.1% Positive
Electrical transformers, static
converters and inductors
Mostly capital 5,043 36.2% 168 0.2% 1,408 0.7% Not clear
Auto parts Intermediate 9,183 13.9% 153 0.2% 1,327 0.6% Not clear
Plastics 81%: intermediate;
19%: consumer
6,367 12.2% 126 0.2% 1,231 0.6% Not clear
Travel bags Consumer 6,605 60.9% 1,100 10.1% 3,404 1.6% Positive
Lamp and lighting and parts 78%: intermediate;
22%: consumer
7,253 63.9% 16 0.1% 190 0.1% Not clear
Steel Mixed; 70%:
intermediate
7,763 12.0% 263 0.4% 3,745 1.7% Not clear
Aluminium Mostly intermediate 794 3.5% 15 0.1% 394 0.2% Not clear
Agriculture Mixed; 77%:
consumer
5,726 4.1% 2,858 2.0% 27,446 12.8% Positive
Others Mostly services 79,500 na 3,081 na na na na
US imports from China US imports from Vietnam Vietnam's exports
Title:
Source:
Please fill in the values above to have them entered in your report
7.15
6.86
2.65
2.09
2.04
1.57
1.44
1.14
1.10
1.08
Telephones
Computers, electrical products
Fruits and vegetables
Still image, video cameras
Yarn
Machine, equipment
Rubber
Footwear
Textile and garment
Fishery products
Title:
Source:
Please fill in the values above to have them entered in your report
10.91
8.75
7.08
6.08
4.10
2.05
1.93
1.27
1.27
1.22
Machine & equipment
Telephones
Computers, electrical products
Fabrics
Iron and steel
Textile, leather and foot-wear materials
Plastic products
Iron and steel products
Chemicals
Chemical products
10
Vietnam│Economics Update│September 26, 2018
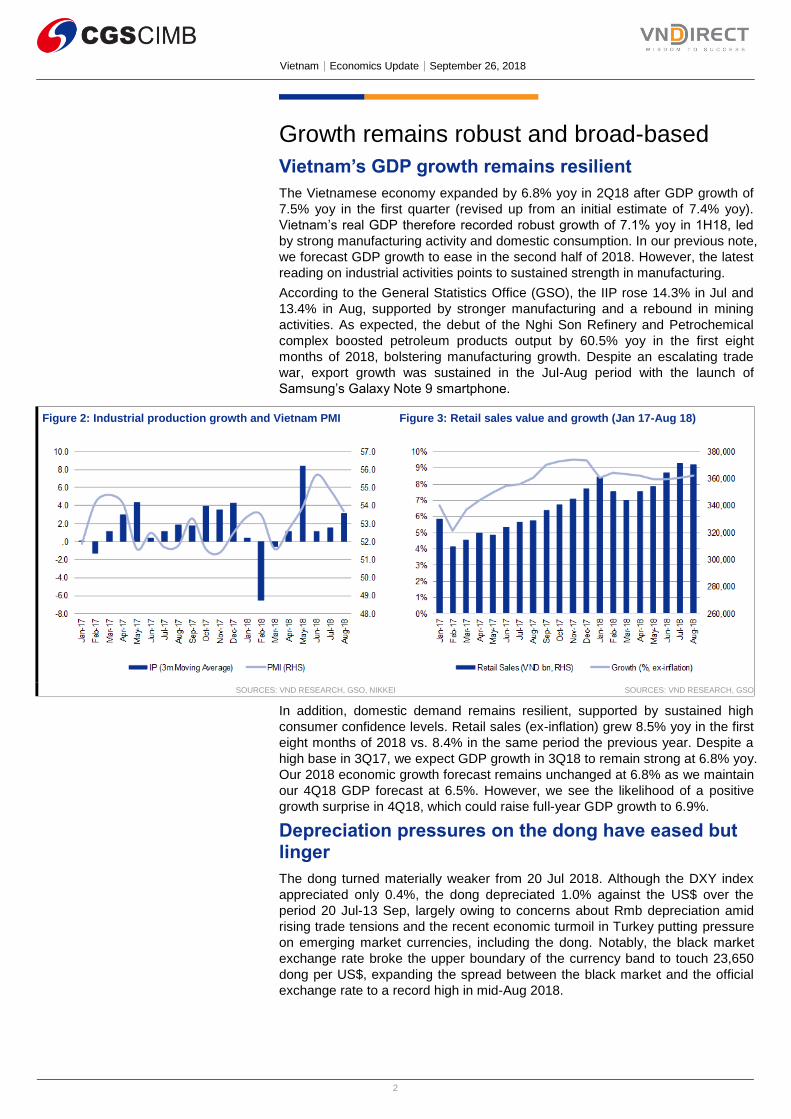
Macro indicators in Aug 2018
Figure 18: Vietnam’s industrial production growth (mom %
change, 3-month moving average) from Jan 2015 to Aug 2018
Figure 19: Vietnam PMI from Jan 2015 to Aug 2018
SOURCE: VND RESEARCH, GSO SOURCE: VND RESEARCH, NIKKEI
Figure 20: Retail sales from Jan 2015 to Aug 2018 Figure 21: Vietnam’s trade balance, import and export growth
from Jan 2015 to Aug 2018
SOURCE: VND RESEARCH, GSO SOURCE: VND RESEARCH, GSO, CUSTOMS
Figure 22: FDI disbursement & commitment from Jan 2015 to
Aug 2018
Figure 23: Public investment from Jan 2015 to Aug 2018
SOURCE: VND RESEARCH, GSO SOURCE: VND RESEARCH, GSO
Title:
Source:
Please fill in the values above to have them entered in your report
-10.0%
-8.0%
-6.0%
-4.0%
-2.0%
0.0%
2.0%
4.0%
6.0%
8.0%
10.0%
Jan-1
5
Mar-
15
May-
15
Jul-15
Sep-1
5
Nov-
15
Jan-1
6
Mar-
16
May-
16
Jul-16
Sep-1
6
Nov-
16
Jan-1
7
Mar-
17
May-
17
Jul-17
Sep-1
7
Nov-
17
Jan-1
8
Mar-
18
May-
18
Jul-18
Title:
Source:
Please fill in the values above to have them entered in your report
49.0
50.0
51.0
52.0
53.0
54.0
55.0
56.0
57.0
Jan-1
5
Mar-
15
May-
15
Jul-15
Sep-1
5
Nov-
15
Jan-1
6
Mar-
16
May-
16
Jul-16
Sep-1
6
Nov-
16
Jan-1
7
Mar-
17
May-
17
Jul-17
Sep-1
7
Nov-
17
Jan-1
8
Mar-
18
May-
18
Jul-18
Title:
Source:
Please fill in the values above to have them entered in your report
0.0%
2.0%
4.0%
6.0%
8.0%
10.0%
12.0%
14.0%
-
50,000
100,000
150,000
200,000
250,000
300,000
350,000
400,000
Jan-1
5
Mar-
15
May-
15
Jul-15
Sep-1
5
Nov-
15
Jan-1
6
Mar-
16
May-
16
Jul-16
Sep-1
6
Nov-
16
Jan-1
7
Mar-
17
May-
17
Jul-17
Sep-1
7
Nov-
17
Jan-1
8
Mar-
18
May-
18
Jul-18
Retail sales (VND bn) YoY (CPI adj., RHS)
Title:
Source:
Please fill in the values above to have them entered in your report
-3,000
-2,000
-1,000
0
1,000
2,000
3,000
-10.0%
-5.0%
0.0%
5.0%
10.0%
15.0%
20.0%
25.0%
30.0%
35.0%
Jan-1
5
Mar-
15
May-
15
Jul-15
Sep-1
5
Nov-
15
Jan-1
6
Mar-
16
May-
16
Jul-16
Sep-1
6
Nov-
16
Jan-1
7
Mar-
17
May-
17
Jul-17
Sep-1
7
Nov-
17
Jan-1
8
Mar-
18
May-
18
Jul-18
Trade balance (US$ m, RHS) Export growth (3mma, %)
Import growth (3mma, %)
Title:
Source:
Please fill in the values above to have them entered in your report
-40.0%
-20.0%
0.0%
20.0%
40.0%
60.0%
80.0%
100.0%
120.0%
0
2000
4000
6000
8000
10000
12000
Jan-1
5
Mar-
15
May-
15
Jul-15
Sep-1
5
Nov-
15
Jan-1
6
Mar-
16
May-
16
Jul-16
Sep-1
6
Nov-
16
Jan-1
7
Mar-
17
May-
17
Jul-17
Sep-1
7
Nov-
17
Jan-1
8
Mar-
18
May-
18
Jul-18
FDI disbursement (US$ m)
FDI commitment (US$ m)
FDI disbursement growth (yoy, 3mma, RHS)
Title:
Source:
Please fill in the values above to have them entered in your report
-100.0%
-50.0%
0.0%
50.0%
100.0%
150.0%
200.0%
0
10
20
30
40
50
60
Jan-1
5
Mar-
15
May-
15
Jul-15
Sep-1
5
Nov-
15
Jan-1
6
Mar-
16
May-
16
Jul-16
Sep-1
6
Nov-
16
Jan-1
7
Mar-
17
May-
17
Jul-17
Sep-1
7
Nov-
17
Jan-1
8
Mar-
18
May-
18
Jul-18
Value (VND tr) Growth (yoy, RHS)

Vietnam │ Economics Update │ September 26, 2018
11
Figure 24: Commodity prices by industry (Sep 2018)
SOURCE: CGS-CIMB RESEARCH, BLOOMBERG, PRICE AS OF 25 SEP 2018
Unit Current +/- YTD (%) Sep 2018 average +/- YoY (%) +/- MoM (%)
Oil&Gas
Brent US$/barrel 81.9 23.0% 78.5 41.6% 6.4%
WTI US$/barrel 72.3 19.7% 69.5 39.6% 2.5%
Transportation
Baltic Dry Index 1,434.0 -22.5% 1,441.3 5.8% -15.9%
Baltic Clean Tanker 516.0 -21.2% 514.6 -16.5% 6.1%
Baltic Dirty Tanker 801.0 14.4% 777.7 5.4% 2.4%
Steel inputs
HRC US$/tonne 617.0 -4.6% 619.7 -3.8% -0.1%
Scrap US$/tonne 387.0 2.7% 382.5 35.6% 0.2%
Iron ore US$/tonne 64.9 -10.8% 63.7 -12.3% 1.7%
Hard coal US$/tonne 364.0 -1.1% 382.0 10.0% 11.9%
Graphite US$/tonne 8,949.5 -19.6% 8,909.9 -45.4% -10.7%
Agriculture
Rice US$/tonne 397.0 2.8% 395.0 2.6% 0.4%
Corn US$/tonne 124.4 -2.5% 122.4 -1.0% -3.2%
Wheat US$/tonne 191.3 20.1% 185.2 15.4% -6.3%
Chemical
Urea US$/tonne 319.0 -8.1% 314.0 17.6% 4.2%
Natural Rubber US$/tonne 1,301.8 -28.8% 1,343.8 -30.7% -8.3%
Textile
Cotton US$/tonne 750.0 -1.3% 776.3 11.9% -4.2%
Metal
Lead US$/tonne 2,009.5 -21.8% 2,051.3 -14.3% -1.0%
Steel US$/tonne 662.1 0.3% 678.6 7.1% 7.3%
Zinc US$/tonne 2,507.0 -25.1% 2,416.2 -22.3% -3.3%
Copper US$/tonne 6,318.0 -12.3% 6,024.4 -9.0% -1.0%
Gold US$/oz 1,201.3 -7.8% 1,199.4 -8.8% -0.1%

Vietnam │ Economics Update │ September 26, 2018
12
DISCLAIMER
The content of this report (including the views and opinions expressed therein, and the information comprised therein) has been prepared by and belongs to VNDIRECT Securities Corporation, and is distributed by CGS-CIMB or CIMB Investment Bank Berhad (“CIMB”), as the case may be, pursuant to an arrangement between VNDIRECT Securities Corporation and CGS-CIMB. VNDIRECT Securities Corporation is not an affiliate of CGS-CIMB or CIMB.
This report is not directed to, or intended for distribution to or use by, any person or entity who is a citizen or resident of or located in any locality, state, country or other jurisdiction where such distribution, publication, availability or use would be contrary to law or regulation.
By accepting this report, the recipient hereof represents and warrants that he is entitled to receive such report in accordance with the restrictions set forth below and agrees to be bound by the limitations contained herein (including the “Restrictions on Distributions” set out below). Any failure to comply with these limitations may constitute a violation of law. This publication is being supplied to you strictly on the basis that it will remain confidential. No part of this report may be (i) copied, photocopied, duplicated, stored or reproduced in any form by any means or (ii) redistributed or passed on, directly or indirectly, to any other person in whole or in part, for any purpose without the prior written consent of CGS-CIMB or CIMB, as the case may be.
The information contained in this research report is prepared from data believed to be correct and reliable at the time of issue of this report.
VNDIRECT Securities Corporation may or may not issue regular reports on the subject matter of this report at any frequency and may cease to do so or change the periodicity of reports at any time. None of VNDIRECT Securities Corporation, CGS-CIMB or CIMB is under any obligation to update this report in the event of a material change to the information contained in this report. None of VNDIRECT Securities Corporation, CGS-CIMB or CIMB has any and will accept any, obligation to (i) check or ensure that the contents of this report remain current, reliable or relevant, (ii) ensure that the content of this report constitutes all the information a prospective investor may require, (iii) ensure the adequacy, accuracy, completeness, reliability or fairness of any views, opinions and information, and accordingly, VNDIRECT Securities Corporation, CGS-CIMB and CIMB and their respective affiliates and related persons including China Galaxy International Financial Holdings Limited (“CGIFHL”) and CIMB Group Sdn. Bhd. (“CIMBG”) and their respective related corporations (and their respective directors, associates, connected persons and/or employees) shall not be liable in any manner whatsoever for any consequences (including but not limited to any direct, indirect or consequential losses, loss of profits and damages) of any reliance thereon or usage thereof. In particular, VNDIRECT Securities Corporation, CGS-CIMB and CIMB disclaim all responsibility and liability for the views and opinions set out in this report.
Unless otherwise specified, this report is based upon reasonable sources. Such sources will, unless otherwise specified, for market data, be market data and prices available from the main stock exchange or market where the relevant security is listed, or, where appropriate, any other market. Information on the accounts and business of company(ies) will generally be based on published statements of the company(ies), information disseminated by regulatory information services, other publicly available information and information resulting from our research. Whilst every effort is made to ensure that statements of facts made in this report are accurate, all estimates, projections, forecasts, expressions of opinion and other subjective judgments contained in this report are based on assumptions considered to be reasonable as of the date of the document in which they are contained and must not be construed as a representation that the matters referred to therein will occur. Past performance is not a reliable indicator of future performance. The value of investments may go down as well as up and those investing may, depending on the investments in question, lose more than the initial investment. No report shall constitute an offer or an invitation by or on behalf of CGS-CIMB, CIMB, or VNDIRECT Securities Corporation, or their respective affiliates (including CGIFHL, CIMBG and their respective related corporations) to any person to buy or sell any investments.
CGS-CIMB, CIMB and/or VNDIRECT Securities Corporation and/or their respective affiliates and related corporations (including CGIFHL, CIMBG and their respective related corporations), their respective directors, associates, connected parties and/or employees may own or have positions in securities of the company(ies) covered in this research report or any securities related thereto and may from time to time add to or dispose of, or may be materially interested in, any such securities. Further, CGS-CIMB, CIMB and/or VNDIRECT Securities Corporation, and/or their respective affiliates and their respective related corporations (including CGIFHL, CIMBG and their respective related corporations) do and seek to do business with the company(ies) covered in this research report and may from time to time act as market maker or have assumed an underwriting commitment in securities of such company(ies), may sell them to or buy them from customers on a principal basis and may also perform or seek to perform significant investment banking, advisory, underwriting or placement services for or relating to such company(ies) as well as solicit such investment, advisory or other services from any entity mentioned in this report.
CGS-CIMB, CIMB and/or VNDIRECT Securities Corporation and/or their respective affiliates (including CGIFHL, CIMBG and their respective related corporations) may enter into an agreement with the company(ies) covered in this report relating to the production of research reports. CGS-CIMB, CIMB and/or VNDIRECT Securities Corporation may disclose the contents of this report to the company(ies) covered by it and may have amended the contents of this report following such disclosure.
The analyst responsible for the production of this report hereby certifies that the views expressed herein accurately and exclusively reflect his or her personal views and opinions about any and all of the issuers or securities analysed in this report and were prepared independently and autonomously. No part of the compensation of the analyst(s) was, is, or will be directly or indirectly related to the inclusion of specific recommendations(s) or view(s) in this report. The analyst(s) who prepared this research report is prohibited from receiving any compensation, incentive or bonus based on specific investment banking transactions or for providing a specific recommendation for, or view of, a particular company. Information barriers and other arrangements may be established where necessary to prevent conflicts of interests arising. However, the analyst(s) may receive compensation that is based on his/their coverage of company(ies) in the performance of his/their duties or the performance of his/their recommendations and the research personnel involved in the preparation of this report may also participate in the solicitation of the businesses as described above. In reviewing this research report, an investor should be aware that any or all of the foregoing, among other things, may give rise to real or potential conflicts of interest. Additional information is, subject to the duties of confidentiality, available on request.
The term “VNDIRECT Securities Corporation” shall, unless the context otherwise requires, mean VNDIRECT Securities Corporation and its affiliates, subsidiaries and related companies. The term “CGS-CIMB” shall denote, where appropriate, the relevant entity distributing or

Vietnam │ Economics Update │ September 26, 2018
13
disseminating the report in the particular jurisdiction referenced below, or, in every other case except as otherwise stated herein, CIMB Securities International Pte. Ltd. and its affiliates, subsidiaries and related corporations.
CGS-CIMB
Country CGS-CIMB Entity Regulated by
Hong Kong CGS-CIMB Securities Limited Securities and Futures Commission Hong Kong
India CGS-CIMB Securities (India) Private Limited Securities and Exchange Board of India (SEBI)
Indonesia PT CGS-CIMB Sekuritas Indonesia Financial Services Authority of Indonesia
Singapore CGS-CIMB Research Pte. Ltd. Monetary Authority of Singapore
South Korea CGS-CIMB Securities Limited, Korea Branch Financial Services Commission and Financial Supervisory Service
Thailand CGS-CIMB Securities (Thailand) Co. Ltd. Securities and Exchange Commission Thailand
CIMB
Country CIMB Entity Regulated by
Malaysia CIMB Investment Bank Berhad Securities Commission Malaysia
(i) As of September 26, 2018 VNDIRECT Securities Corporation has a proprietary position in the securities (which may include but not limited to shares, warrants, call warrants and/or any other derivatives) in the following company or companies covered or recommended in this report:
(a) -
(ii) As of September 26, 2018, the analyst(s) who prepared this report, and the associate(s), has / have an interest in the securities (which may include but not limited to shares, warrants, call warrants and/or any other derivatives) in the following company or companies covered or recommended in this report:
(a) - This report does not purport to contain all the information that a prospective investor may require. CGS-CIMB, and VNDIRECT Securities Corporation and their respective affiliates (including CGIFHL, CIMBG and their related corporations) do not make any guarantee, representation or warranty, express or implied, as to the adequacy, accuracy, completeness, reliability or fairness of any such information and opinion contained in this report. None of CGS-CIMB, CIMB and VNDIRECT Securities Corporation and their respective affiliates nor their related persons (including CGIFHL, CIMBG and their related corporations) shall be liable in any manner whatsoever for any consequences (including but not limited to any direct, indirect or consequential losses, loss of profits and damages) of any reliance thereon or usage thereof.
This report is general in nature and has been prepared for information purposes only. It is intended for circulation amongst CGS-CIMB’s, CIMB’s and their respective affiliates’ (including CGIFHL’s, CIMBG’s and their respective related corporations’) clients generally and does not have regard to the specific investment objectives, financial situation and the particular needs of any specific person who may receive this report. The information and opinions in this report are not and should not be construed or considered as an offer, recommendation or solicitation to buy or sell the subject securities, related investments or other financial instruments or any derivative instrument, or any rights pertaining thereto.
Investors are advised to make their own independent evaluation of the information contained in this research report, consider their own individual investment objectives, financial situation and particular needs and consult their own professional and financial advisers as to the legal, business, financial, tax and other aspects before participating in any transaction in respect of the securities of company(ies) covered in this research report. The securities of such company(ies) may not be eligible for sale in all jurisdictions or to all categories of investors.
Australia: Despite anything in this report to the contrary, this research is provided in Australia by CIMB Securities (Singapore) Pte. Ltd. and CIMB Securities Limited. This research is only available in Australia to persons who are “wholesale clients” (within the meaning of the Corporations Act 2001 (Cth) and is supplied solely for the use of such wholesale clients and shall not be distributed or passed on to any other person. You represent and warrant that if you are in Australia, you are a “wholesale client”. This research is of a general nature only and has been prepared without taking into account the objectives, financial situation or needs of the individual recipient. CIMB Securities (Singapore) Pte. Ltd. and CIMB Securities Limited do not hold, and are not required to hold an Australian financial services license. CIMB Securities (Singapore) Pte. Ltd. and CIMB Securities Limited rely on “passporting” exemptions for entities appropriately licensed by the Monetary Authority of Singapore (under ASIC Class Order 03/1102) and the Securities and Futures Commission in Hong Kong (under ASIC Class Order 03/1103).
Canada: This research report has not been prepared in accordance with the disclosure requirements of Dealer Member Rule 3400 – Research Restrictions and Disclosure Requirements of the Investment Industry Regulatory Organization of Canada. For any research report distributed by CIBC, further disclosures related to CIBC conflicts of interest can be found at https://researchcentral.cibcwm.com.
China: For the purpose of this report, the People’s Republic of China (“PRC”) does not include the Hong Kong Special Administrative Region, the Macau Special Administrative Region or Taiwan. The distributor of this report has not been approved or licensed by the China Securities Regulatory Commission or any other relevant regulatory authority or governmental agency in the PRC. This report contains only marketing information. The distribution of this report is not an offer to buy or sell to any person within or outside PRC or a solicitation to any person within or outside of PRC to buy or sell any instruments described herein. This report is being issued outside the PRC to a limited number of institutional investors and may not be provided to any person other than the original recipient and may not be reproduced or used for any other purpose.
France: Only qualified investors within the meaning of French law shall have access to this report. This report shall not be considered as an offer to subscribe to, or used in connection with, any offer for subscription or sale or marketing or direct or indirect distribution of financial instruments and it is not intended as a solicitation for the purchase of any financial instrument.
Germany: This report is only directed at persons who are professional investors as defined in sec 31a(2) of the German Securities Trading Act (WpHG). This publication constitutes research of a non-binding nature on the market situation and the investment instruments cited here at the time of the publication of the information.
Vietnam │ Economics Update │ September 26, 2018
14
The current prices/yields in this issue are based upon closing prices from Bloomberg as of the day preceding publication. Please note that neither the German Federal Financial Supervisory Agency (BaFin), nor any other supervisory authority exercises any control over the content of this report.
Hong Kong: This report is issued and distributed in Hong Kong by CIMB Securities Limited (“CHK”) which is licensed in Hong Kong by the Securities and Futures Commission for Type 1 (dealing in securities), Type 4 (advising on securities) and Type 6 (advising on corporate finance) activities. Any investors wishing to purchase or otherwise deal in the securities covered in this report should contact the Head of Sales at CIMB Securities Limited. The views and opinions in this research report are of VNDIRECT Securities Corporation as of the date hereof and are subject to change. If the Financial Services and Markets Act of the United Kingdom or the rules of the Financial Conduct Authority apply to a recipient, our obligations owed to such recipient therein are unaffected. CHK has no obligation to update its opinion or the information in this research report.
This publication is strictly confidential and is for private circulation only to clients of CHK.
CHK does not make a market on other securities mentioned in the report.
India: This report is issued and distributed in India by CIMB Securities (India) Private Limited (“CIMB India”) which is registered with the National Stock Exchange of India Limited and BSE Limited as a trading and clearing member under the Securities and Exchange Board of India (Stock Brokers and Sub-Brokers) Regulations, 1992. In accordance with the provisions of Regulation 4(g) of the Securities and Exchange Board of India (Investment Advisers) Regulations, 2013, CIMB India is not required to seek registration with the Securities and Exchange Board of India (“SEBI”) as an Investment Adviser. CIMB India is registered with SEBI as a Research Analyst pursuant to the SEBI (Research Analysts) Regulations, 2014 ("Regulations").
This report does not take into account the particular investment objectives, financial situations, or needs of the recipients. It is not intended for and does not deal with prohibitions on investment due to law/jurisdiction issues etc. which may exist for certain persons/entities. Recipients should rely on their own investigations and take their own professional advice before investment.
The report is not a “prospectus” as defined under Indian Law, including the Companies Act, 2013, and is not, and shall not be, approved by, or filed or registered with, any Indian regulator, including any Registrar of Companies in India, SEBI, any Indian stock exchange, or the Reserve Bank of India. No offer, or invitation to offer, or solicitation of subscription with respect to any such securities listed or proposed to be listed in India is being made, or intended to be made, to the public, or to any member or section of the public in India, through or pursuant to this report.
The research analysts, strategists or economists principally responsible for the preparation of this research report are segregated from the other activities of CIMB India and they have received compensation based upon various factors, including quality, accuracy and value of research, firm profitability or revenues, client feedback and competitive factors. Research analysts', strategists' or economists' compensation is not linked to investment banking or capital markets transactions performed or proposed to be performed by CIMB India or its affiliates.
CGS-CIMB India has not received any investment banking related compensation from the companies mentioned in the report in the past 12 months.
CGS-CIMB India has not received any compensation from the companies mentioned in the report in the past 12 months.
Indonesia: This report is issued and distributed by PT CIMB Sekuritas Indonesia (“CIMBI”). The views and opinions in this research report are our own as of the date hereof and are subject to change. CIMBI has no obligation to update its opinion or the information in this research report. Neither this report nor any copy hereof may be distributed in Indonesia or to any Indonesian citizens wherever they are domiciled or to Indonesian residents except in compliance with applicable Indonesian capital market laws and regulations.
This research report is not an offer of securities in Indonesia. The securities referred to in this research report have not been registered with the Financial Services Authority (Otoritas Jasa Keuangan) pursuant to relevant capital market laws and regulations, and may not be offered or sold within the territory of the Republic of Indonesia or to Indonesian citizens through a public offering or in circumstances which constitute an offer within the meaning of the Indonesian capital market law and regulations.
Ireland: CGS-CIMB is not an investment firm authorised in the Republic of Ireland and no part of this document should be construed as CGS-CIMB acting as, or otherwise claiming or representing to be, an investment firm authorised in the Republic of Ireland.
Malaysia: This report is distributed in Malaysia by CIMB solely for the benefit of and for the exclusive use of our clients. Recipients of this report are to contact CIMB, at 17th Floor Menara CIMB No. 1 Jalan Stesen Sentral 2, Kuala Lumpur Sentral 50470 Kuala Lumpur, Malaysia, in respect of any matters arising from or in connection with this report. CIMB has no obligation to update, revise or reaffirm its opinion or the information in this research reports after the date of this report.
New Zealand: In New Zealand, this report is for distribution only to persons who are wholesale clients pursuant to section 5C of the Financial Advisers Act 2008.
Singapore: This report is issued and distributed by CIMB Research Pte Ltd (“CIMBR”). CIMBR is a financial adviser licensed under the Financial Advisers Act, Cap 110 (“FAA”) for advising on investment products, by issuing or promulgating research analyses or research reports, whether in electronic, print or other form. Accordingly CIMBR is a subject to the applicable rules under the FAA unless it is able to avail itself to any prescribed exemptions.
Recipients of this report are to contact CIMB Research Pte Ltd, 50 Raffles Place, #16-02 Singapore Land Tower, Singapore in respect of any matters arising from, or in connection with this report. CIMBR has no obligation to update its opinion or the information in this research report. This publication is strictly confidential and is for private circulation only. If you have not been sent this report by CIMBR directly, you may not rely, use or disclose to anyone else this report or its contents.
If the recipient of this research report is not an accredited investor, expert investor or institutional investor, CIMBR accepts legal responsibility for the contents of the report without any disclaimer limiting or otherwise curtailing such legal responsibility. If the recipient is an accredited investor, expert investor or institutional investor, the recipient is deemed to acknowledge that CIMBR is exempt from certain requirements under the FAA and its attendant regulations, and as such, is exempt from complying with the following :
(a) Section 25 of the FAA (obligation to disclose product information);
(b) Section 27 (duty not to make recommendation with respect to any investment product without having a reasonable basis where you may be reasonably expected to rely on the recommendation) of the FAA;
(c) MAS Notice on Information to Clients and Product Information Disclosure [Notice No. FAA-N03];
Vietnam │ Economics Update │ September 26, 2018
15
(d) MAS Notice on Recommendation on Investment Products [Notice No. FAA-N16];
(e) Section 36 (obligation on disclosure of interest in securities), and
(f) any other laws, regulations, notices, directive, guidelines, circulars and practice notes which are relates to the above, to the extent permitted by applicable laws, as may be amended from time to time, and any other laws, regulations, notices, directive, guidelines, circulars, and practice notes as we may notify you from time to time. In addition, the recipient who is an accredited investor, expert investor or institutional investor acknowledges that a CIMBR is exempt from Section 27 of the FAA, the recipient will also not be able to file a civil claim against CIMBR for any loss or damage arising from the recipient’s reliance on any recommendation made by CIMBR which would otherwise be a right that is available to the recipient under Section 27 of the FAA, the recipient will also not be able to file a civil claim against CIMBR for any loss or damage arising from the recipient’s reliance on any recommendation made by CIMBR which would otherwise be a right that is available to the recipient under Section 27 of the FAA.
CIMBR, its affiliates and related corporations, their directors, associates, connected parties and/or employees may own or have positions in securities of the company(ies) covered in this research report or any securities related thereto and may from time to time add to or dispose of, or may be materially interested in, any such securities. Further, CIMBR, its affiliates and its related corporations do and seek to do business with the company(ies) covered in this research report and may from time to time act as market maker or have assumed an underwriting commitment in securities of such company(ies), may sell them to or buy them from customers on a principal basis and may also perform or seek to perform significant investment banking, advisory, underwriting or placement services for or relating to such company(ies) as well as solicit such investment, advisory or other services from any entity mentioned in this report.
As of September 26, 2018,, CIMBR does not have a proprietary position in the recommended securities in this report.
CIMBR does not make a market on other securities mentioned in the report.
South Korea: This report is issued and distributed in South Korea by CIMB Securities Limited, Korea Branch (“CIMB Korea”) which is licensed as a cash equity broker, and regulated by the Financial Services Commission and Financial Supervisory Service of Korea. In South Korea, this report is for distribution only to professional investors under Article 9(5) of the Financial Investment Services and Capital Market Act of Korea (“FSCMA”).
Spain: This document is a research report and it is addressed to institutional investors only. The research report is of a general nature and not personalised and does not constitute investment advice so, as the case may be, the recipient must seek proper advice before adopting any investment decision. This document does not constitute a public offering of securities.
CGS-CIMB is not registered with the Spanish Comision Nacional del Mercado de Valores to provide investment services.
Sweden: This report contains only marketing information and has not been approved by the Swedish Financial Supervisory Authority. The distribution of this report is not an offer to sell to any person in Sweden or a solicitation to any person in Sweden to buy any instruments described herein and may not be forwarded to the public in Sweden.
Switzerland: This report has not been prepared in accordance with the recognized self-regulatory minimal standards for research reports of banks issued by the Swiss Bankers’ Association (Directives on the Independence of Financial Research).
Thailand: This report is issued and distributed by CIMB Securities (Thailand) Co. Ltd. (“CIMBT”) based upon sources believed to be reliable (but their accuracy, completeness or correctness is not guaranteed). The statements or expressions of opinion herein were arrived at after due and careful consideration for use as information for investment. Such opinions are subject to change without notice and CIMBT has no obligation to update its opinion or the information in this research report.
CIMBT may act or acts as Market Maker, and issuer and offerer of Derivative Warrants and Structured Note which may have the following securities as its underlying securities. Investors should carefully read and study the details of the derivative warrants in the prospectus before making investment decisions.
AAV, ADVANC, AMATA, ANAN, AOT, AP, BA, BANPU, BBL, BCH, BCP, BCPG, BDMS, BEAUTY, BEC, BEM, BJC, BH, BIG, BLA, BLAND, BPP, BTS, CBG, CENTEL, CHG, CK, CKP, COM7, CPALL, CPF, CPN, DELTA, DTAC, EA, EGCO, EPG, GFPT, GLOBAL, GLOW, GPSC, GUNKUL, HMPRO, INTUCH, IRPC, ITD, IVL, KBANK, KCE, KKP, KTB, KTC, LH, LHBANK, LPN, MAJOR, MALEE, MEGA, MINT, MONO, MTLS, PLANB, PSH, PTL, PTG, PTT, PTTEP, PTTGC, QH, RATCH, ROBINS, S, SAWAD, SCB, SCC, SCCC, SIRI, SPALI, SPRC, STEC, STPI, SUPER, TASCO, TCAP, THAI, THANI, THCOM, TISCO, TKN, TMB, TOP, TPIPL, TRUE, TTA, TU, TVO, UNIQ, VGI, WHA, WORK.
Corporate Governance Report:
The disclosure of the survey result of the Thai Institute of Directors Association (“IOD”) regarding corporate governance is made pursuant to the policy of the Office of the Securities and Exchange Commission. The survey of the IOD is based on the information of a company listed on the Stock Exchange of Thailand and the Market for Alternative Investment disclosed to the public and able to be accessed by a general public investor. The result, therefore, is from the perspective of a third party. It is not an evaluation of operation and is not based on inside information.
The survey result is as of the date appearing in the Corporate Governance Report of Thai Listed Companies. As a result, the survey result may be changed after that date. CIMBT does not confirm nor certify the accuracy of such survey result.
Score Range: 90 - 100 80 – 89 70 - 79 Below 70 or No Survey Result
Description: Excellent Very Good Good N/A
United Arab Emirates: The distributor of this report has not been approved or licensed by the UAE Central Bank or any other relevant licensing authorities or governmental agencies in the United Arab Emirates. This report is strictly private and confidential and has not been reviewed by, deposited or registered with UAE Central Bank or any other licensing authority or governmental agencies in the United Arab Emirates. This report is being issued outside the United Arab Emirates to a limited number of institutional investors and must not be provided to any person other than the original recipient and may not be reproduced or used for any other purpose. Further, the information contained in this report is not intended to lead to the sale of investments under any subscription agreement or the conclusion of any other contract of whatsoever nature within the territory of the United Arab Emirates.
United Kingdom and European Economic Area (EEA): In the United Kingdom and European Economic Area, this material is also being distributed by CIMB Securities (UK) Limited (“CIMB UK”). CIMB UK is authorized and regulated by the Financial Conduct Authority and its registered office is at 27 Knightsbridge, London, SW1X7YB. The material distributed by CIMB UK has been prepared in accordance with CGS-

Vietnam │ Economics Update │ September 26, 2018
16
CIMB’s policies for managing conflicts of interest arising as a result of publication and distribution of this material. This material is for distribution only to, and is solely directed at, selected persons on the basis that those persons: (a) are eligible counterparties and professional clients of CIMB UK; (b) have professional experience in matters relating to investments falling within Article 19(5) of the Financial Services and Markets Act 2000 (Financial Promotion) Order 2005 (as amended, the “Order”), (c) fall within Article 49(2)(a) to (d) (“high net worth companies, unincorporated associations etc”) of the Order; (d) are outside the United Kingdom subject to relevant regulation in each jurisdiction, material(all such persons together being referred to as “relevant persons”). This material is directed only at relevant persons and must not be acted on or relied on by persons who are not relevant persons. Any investment or investment activity to which this material relates is available only to relevant persons and will be engaged in only with relevant persons.
Where this material is labelled as non-independent, it does not provide an impartial or objective assessment of the subject matter and does not constitute independent “research” (cannot remove research from here under the applicable rules of the Financial Conduct Authority in the UK. Consequently, any such non-independent material will not have been prepared in accordance with legal requirements designed to promote the independence of research (cannot remove research from here) and will not subject to any prohibition on dealing ahead of the dissemination of research. Any such non-independent material must be considered as a marketing communication.
United States: This research report is distributed in the United States of America by CIMB Securities (USA) Inc, a U.S. registered broker-dealer and a related company of CIMB Research Pte Ltd, PT CIMB Sekuritas Indonesia, CIMB Securities (Thailand) Co. Ltd, CIMB Securities Limited, CIMB Securities (India) Private Limited, and is distributed solely to persons who qualify as “U.S. Institutional Investors” as defined in Rule 15a-6 under the Securities and Exchange Act of 1934. This communication is only for Institutional Investors whose ordinary business activities involve investing in shares, bonds, and associated securities and/or derivative securities and who have professional experience in such investments. Any person who is not a U.S. Institutional Investor or Major Institutional Investor must not rely on this communication. The delivery of this research report to any person in the United States of America is not a recommendation to effect any transactions in the securities discussed herein, or an endorsement of any opinion expressed herein. CIMB Securities (USA) Inc, is a FINRA/SIPC member and takes responsibility for the content of this report. For further information or to place an order in any of the above-mentioned securities please contact a registered representative of CIMB Securities (USA) Inc.
CGS-CIMB Securities (USA) Inc. does not make a market on other securities mentioned in the report.
CIMB Securities (USA) Inc. has not managed or co-managed a public offering of any of the securities mentioned in the past 12 months.
CIMB Securities (USA) Inc. has not received compensation for investment banking services from any of the company mentioned in the past 12 months.
CIMB Securities (USA) Inc. neither expects to receive nor intends to seek compensation for investment banking services from any of the company mentioned within the next 3 months.
Other jurisdictions: In any other jurisdictions, except if otherwise restricted by laws or regulations, this report is only for distribution to professional, institutional or sophisticated investors as defined in the laws and regulations of such jurisdictions.

Vietnam │ Economics Update │ September 26, 2018
17
RECOMMENDATION FRAMEWORK
Stock Ratings Definition:
Add The stock’s total return is expected to reach 15% or higher over the next 12 months.
Hold The stock’s total return is expected to be between negative 10% and positive 15% over the next 12 months.
Reduce The stock’s total return is expected to fall below negative 10% over the next 12 months.
The total expected return of a stock is defined as the sum of the:(i) percentage difference between the target price and the current price and (ii) the forward net dividend yields of the stock. Stock price targets have an investment horizon of 12 months.
Sector Ratings Definition:
Overweight An Overweight rating means stocks in the sector have, on a market cap-weighted basis, a positive absolute recommendation.
Neutral A Neutral rating means stocks in the sector have, on a market cap-weighted basis, a neutral absolute recommendation.
Underweight An Underweight rating means stocks in the sector have, on a market cap-weighted basis, a negative absolute recommendation.
Country Ratings Definition:
Overweight An Overweight rating means investors should be positioned with an above-market weight in this country relative to benchmark.
Neutral A Neutral rating means investors should be positioned with a neutral weight in this country relative to benchmark.
Underweight An Underweight rating means investors should be positioned with a below-market weight in this country relative to benchmark.
Anirban Lahiri – Head of Research Email: [email protected]
My Tran Ha – Senior Analyst Email: [email protected]
– Email: – Email: – Email: – Email:
VNDIRECT Securities Corporation
1 Nguyen Thuong Hien Str – Hai Ba Trung Dist – Ha Noi │ Tel: +84 2439724568
Email: [email protected] │ Website: https://vndirect.com.vn