Vietnam Cotton and Products Annual - USDA GAIN Publications/Cotton and... · the government’s...
14
1 THIS REPORT CONTAINS ASSESSMENTS OF COMMODITY AND TRADE ISSUES MADE BY USDA STAFF AND NOT NECESSARILY STATEMENTS OF OFFICIAL U.S. GOVERNMENT POLICY Date: GAIN Report Number: Approved By: Prepared By: Report Highlights: Due to limited cotton production -- less than two percent of total cotton demand -- Vietnam relies heavily on cotton imports to feed its growing textile and spinning industry. Post maintains Vietnam's 2012/2013 cotton production estimate at 4,590 metric tons (mt) or 21 thousand bales. The cotton import reliance is revised to increase by 14 percent in Marketing Year (MY) 2012/2013 with imports reaching 405,000 mt, thanks to strong exports of yarn. In CY 2012, Vietnam imported 416,000 mt of cotton, a year-on-year increase of 27 percent. U.S. cotton accounted for 30 percent (despite recent contract defaults) of total imports that year. Due to a strong increase of U.S. cotton exports to Vietnam in the first 6 months of this MY 2012/2013, post believes U.S. cotton exports this MY will likely lead to a bigger market share. Current trade data on value-added cotton products (mainly yarns) is also provided. Although it is still early to provide a forecast on Vietnam’s cotton production and trade for the next MY (2013/2014), post’s initial production forecast has been set at the same level of 2012/2013, due to no changes to Vietnam’s biotechnology policy. MY2013/2014 cotton imports are projected to increase slightly. Truong Minh Dao and Bui Thi Huong Dwight Wilder and Michael Ward Commodity Report Cotton and Products Annual Vietnam VM3017 4/1/2013 Required Report - public distribution
Transcript of Vietnam Cotton and Products Annual - USDA GAIN Publications/Cotton and... · the government’s...
1
THIS REPORT CONTAINS ASSESSMENTS OF COMMODITY AND TRADE ISSUES MADE BY
USDA STAFF AND NOT NECESSARILY STATEMENTS OF OFFICIAL U.S. GOVERNMENT
POLICY
Date:
GAIN Report Number:
Approved By:
Prepared By:
Report Highlights:
Due to limited cotton production -- less than two percent of total cotton demand -- Vietnam relies heavily on
cotton imports to feed its growing textile and spinning industry. Post maintains Vietnam's 2012/2013 cotton
production estimate at 4,590 metric tons (mt) or 21 thousand bales. The cotton import reliance is revised to
increase by 14 percent in Marketing Year (MY) 2012/2013 with imports reaching 405,000 mt, thanks to strong
exports of yarn. In CY 2012, Vietnam imported 416,000 mt of cotton, a year-on-year increase of 27 percent.
U.S. cotton accounted for 30 percent (despite recent contract defaults) of total imports that year. Due to a strong
increase of U.S. cotton exports to Vietnam in the first 6 months of this MY 2012/2013, post believes U.S. cotton
exports this MY will likely lead to a bigger market share. Current trade data on value-added cotton products
(mainly yarns) is also provided.
Although it is still early to provide a forecast on Vietnam’s cotton production and trade for the next MY
(2013/2014), post’s initial production forecast has been set at the same level of 2012/2013, due to no changes to
Vietnam’s biotechnology policy. MY2013/2014 cotton imports are projected to increase slightly.
Truong Minh Dao and Bui Thi Huong
Dwight Wilder and Michael Ward
Commodity Report
Cotton and Products Annual
Vietnam
VM3017
4/1/2013
Required Report - public distribution
2
SITUATION AND OUTLOOK
Textile Industry
Vietnam is now ranked among the world’s top seven textile, garment, and apparel-exporting countries.
Despite the global economic downturn, Vietnam’s 2012 textile, garment, and apparel exports still met
the government’s target, reaching a value of $16.9 billion -- an increase of 7 percent over 2011 (Source:
Vietnam Customs Office). This growth is mainly due to the sector maintaining its traditional export
markets (USA, EU, Japan), while also expanding to new export markets (China, Turkey, Korea, the
Middle East, Africa etc.). Vietnam has set ambitious targets for the textile industry, with exports
targeted by the Vietnam Ministry of Industry and Trade (see table 2) to reach $25 billion by the 2020.
The Trans-Pacific Partnership Agreement (TPP), if finalized, would help Vietnam achieve this target.
The United States remains the largest market for Vietnam’s textile industry, and accounted for nearly 45
percent of total sector exports in 2012. This represented a year-to-year increase of nearly 7 percent.
Vietnam is one of very few countries in Asia that have expanded their yarn spinning sector in recent
years. From only 2 million spindles in 2000, Vietnam’s spindle capacity reached over 5.1 million
spindles (equivalent) in 2012, creating the potential for voracious demand for imported cotton.
Due to strong demand for yarns from international markets, especially China and Turkey, Vietnam
exports of yarn in 2012 continued growing, and reached 415,000 metric tons, a year-on-year increase of
8 percent. Vietnam exports over 60 percent of the yarn (including cotton yarn) that it produces. Main
export markets for Vietnamese cotton yarn are China, Turkey, Korea, Indonesia, and Thailand.
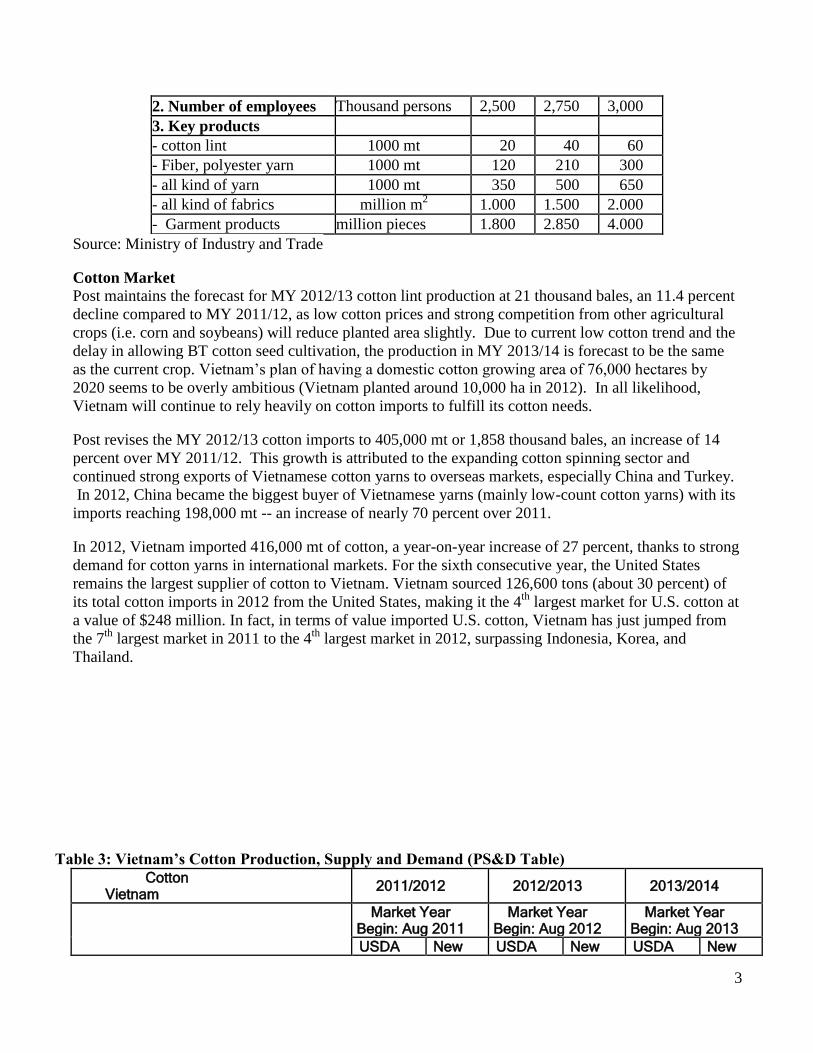
Table 1 and table 2 below illustrate an overview of the Vietnam textile/spinning industry:
Table 1: Vietnam Textile/Spinning Industry Overview
2010 2011 2012
Total Number of Spindles 3,650,000 4,500,000 5,100,000
Total Number of Rotors 103,348 103,348 103,348
Yarn Production from cotton and polyester/rayon (Unit:
MT) 514,000 620,000 680,000
Yarns Exports (Unit: MT) 336,000 384,000 415,000
Fabric Production (billion m2) 1.0 1.0 1.0
Fabric Imports (billion m2)
Not
available
Not
available 6.0
Source: Vietnam Spinning Association (VCOSA)
Table 2: Vietnam’s Projections for the garment and textile industry to 2020
Description Unit 2010 2015 2020
1. Export value $ million 12,000 18,000 25,000
3
2. Number of employees Thousand persons 2,500 2,750 3,000
3. Key products
- cotton lint 1000 mt 20 40 60
- Fiber, polyester yarn 1000 mt 120 210 300
- all kind of yarn 1000 mt 350 500 650
- all kind of fabrics million m2 1.000 1.500 2.000
- Garment products million pieces 1.800 2.850 4.000
Source: Ministry of Industry and Trade
Cotton Market
Post maintains the forecast for MY 2012/13 cotton lint production at 21 thousand bales, an 11.4 percent
decline compared to MY 2011/12, as low cotton prices and strong competition from other agricultural
crops (i.e. corn and soybeans) will reduce planted area slightly. Due to current low cotton trend and the
delay in allowing BT cotton seed cultivation, the production in MY 2013/14 is forecast to be the same
as the current crop. Vietnam’s plan of having a domestic cotton growing area of 76,000 hectares by
2020 seems to be overly ambitious (Vietnam planted around 10,000 ha in 2012). In all likelihood,
Vietnam will continue to rely heavily on cotton imports to fulfill its cotton needs.
Post revises the MY 2012/13 cotton imports to 405,000 mt or 1,858 thousand bales, an increase of 14
percent over MY 2011/12. This growth is attributed to the expanding cotton spinning sector and
continued strong exports of Vietnamese cotton yarns to overseas markets, especially China and Turkey.
In 2012, China became the biggest buyer of Vietnamese yarns (mainly low-count cotton yarns) with its
imports reaching 198,000 mt -- an increase of nearly 70 percent over 2011.
In 2012, Vietnam imported 416,000 mt of cotton, a year-on-year increase of 27 percent, thanks to strong
demand for cotton yarns in international markets. For the sixth consecutive year, the United States
remains the largest supplier of cotton to Vietnam. Vietnam sourced 126,600 tons (about 30 percent) of
its total cotton imports in 2012 from the United States, making it the 4th
largest market for U.S. cotton at
a value of $248 million. In fact, in terms of value imported U.S. cotton, Vietnam has just jumped from
the 7th
largest market in 2011 to the 4th
largest market in 2012, surpassing Indonesia, Korea, and
Thailand.
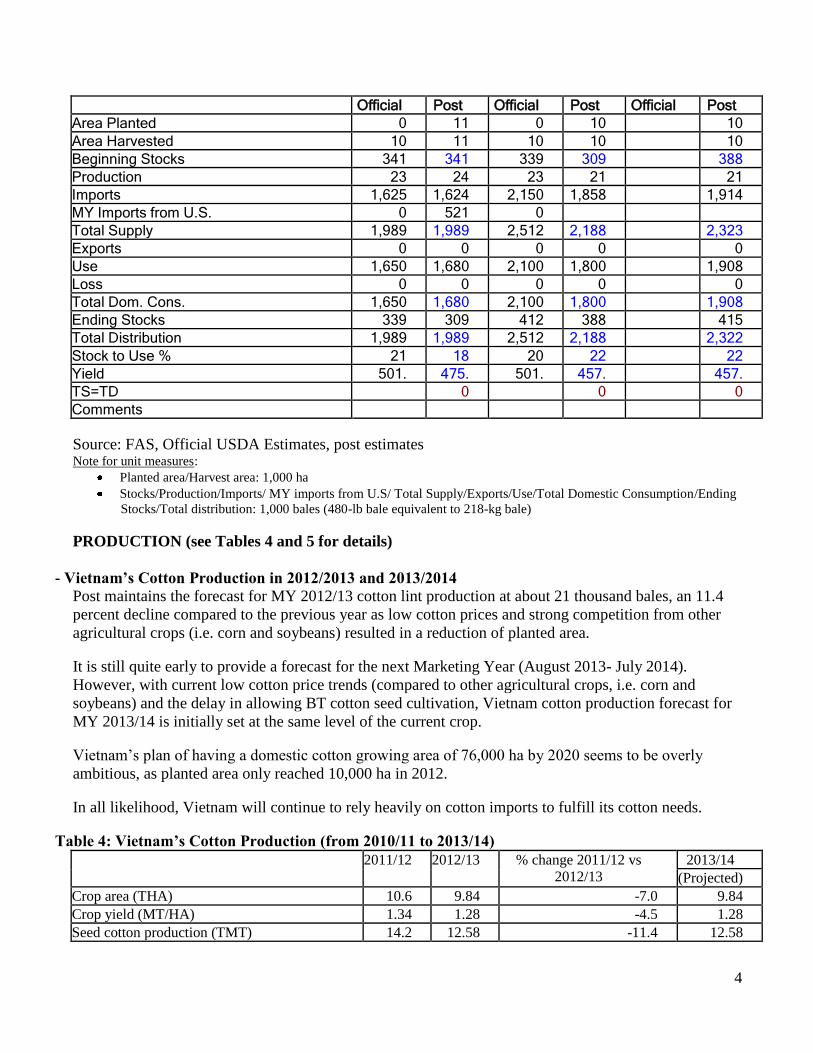
Table 3: Vietnam’s Cotton Production, Supply and Demand (PS&D Table)
Cotton Vietnam
2011/2012 2012/2013 2013/2014
Market Year Begin: Aug 2011
Market Year Begin: Aug 2012
Market Year Begin: Aug 2013
USDA New USDA New USDA New
4
Official Post Official Post Official Post
Area Planted 0 11 0 10 10
Area Harvested 10 11 10 10 10
Beginning Stocks 341 341 339 309 388
Production 23 24 23 21 21
Imports 1,625 1,624 2,150 1,858 1,914
MY Imports from U.S. 0 521 0
Total Supply 1,989 1,989 2,512 2,188 2,323
Exports 0 0 0 0 0
Use 1,650 1,680 2,100 1,800 1,908
Loss 0 0 0 0 0
Total Dom. Cons. 1,650 1,680 2,100 1,800 1,908
Ending Stocks 339 309 412 388 415
Total Distribution 1,989 1,989 2,512 2,188 2,322
Stock to Use % 21 18 20 22 22
Yield 501. 475. 501. 457. 457.
TS=TD 0 0 0
Comments
Source: FAS, Official USDA Estimates, post estimates Note for unit measures:
Planted area/Harvest area: 1,000 ha
Stocks/Production/Imports/ MY imports from U.S/ Total Supply/Exports/Use/Total Domestic Consumption/Ending
Stocks/Total distribution: 1,000 bales (480-lb bale equivalent to 218-kg bale)
PRODUCTION (see Tables 4 and 5 for details)
- Vietnam’s Cotton Production in 2012/2013 and 2013/2014 Post maintains the forecast for MY 2012/13 cotton lint production at about 21 thousand bales, an 11.4
percent decline compared to the previous year as low cotton prices and strong competition from other
agricultural crops (i.e. corn and soybeans) resulted in a reduction of planted area.
It is still quite early to provide a forecast for the next Marketing Year (August 2013- July 2014).
However, with current low cotton price trends (compared to other agricultural crops, i.e. corn and
soybeans) and the delay in allowing BT cotton seed cultivation, Vietnam cotton production forecast for
MY 2013/14 is initially set at the same level of the current crop.
Vietnam’s plan of having a domestic cotton growing area of 76,000 ha by 2020 seems to be overly
ambitious, as planted area only reached 10,000 ha in 2012.
In all likelihood, Vietnam will continue to rely heavily on cotton imports to fulfill its cotton needs.
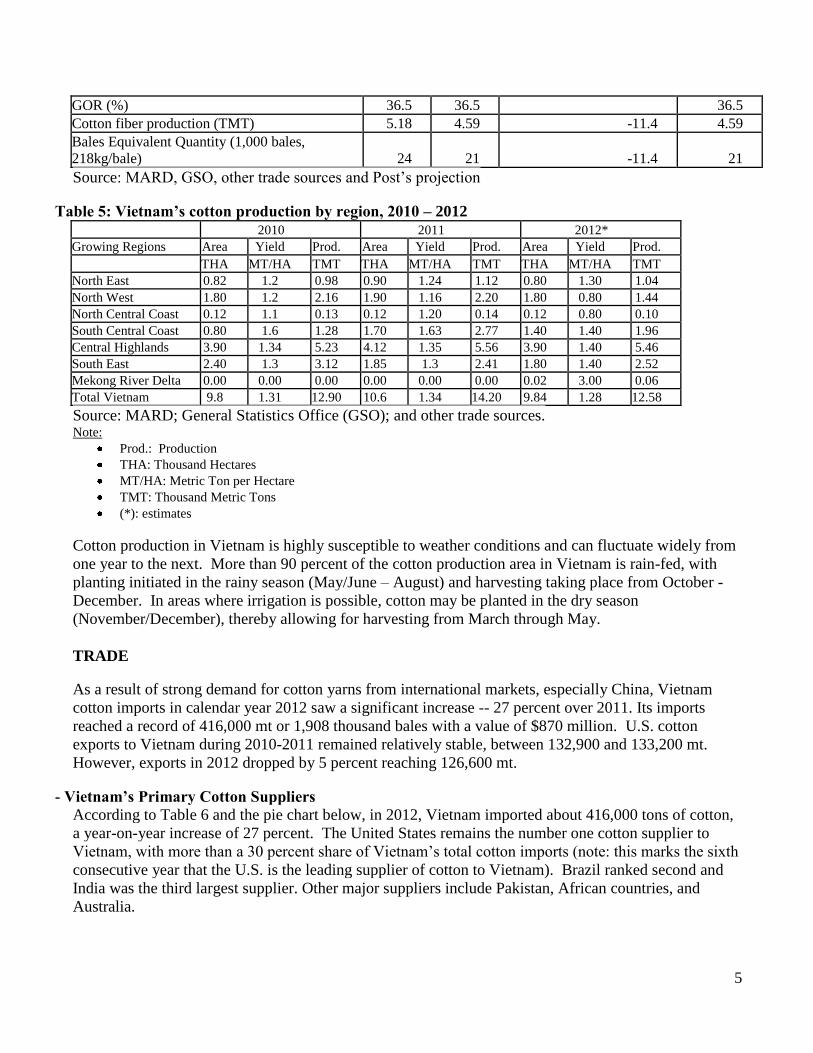
Table 4: Vietnam’s Cotton Production (from 2010/11 to 2013/14)
2011/12 2012/13 % change 2011/12 vs
2012/13
2013/14
(Projected)
Crop area (THA) 10.6 9.84 -7.0 9.84
Crop yield (MT/HA) 1.34 1.28 -4.5 1.28
Seed cotton production (TMT) 14.2 12.58 -11.4 12.58
5
GOR (%) 36.5 36.5 36.5
Cotton fiber production (TMT) 5.18 4.59 -11.4 4.59
Bales Equivalent Quantity (1,000 bales,
218kg/bale) 24 21 -11.4 21
Source: MARD, GSO, other trade sources and Post’s projection
Table 5: Vietnam’s cotton production by region, 2010 – 2012
2010 2011 2012*
Growing Regions Area Yield Prod. Area Yield Prod. Area Yield Prod.
THA MT/HA TMT THA MT/HA TMT THA MT/HA TMT
North East 0.82 1.2 0.98 0.90 1.24 1.12 0.80 1.30 1.04
North West 1.80 1.2 2.16 1.90 1.16 2.20 1.80 0.80 1.44
North Central Coast 0.12 1.1 0.13 0.12 1.20 0.14 0.12 0.80 0.10
South Central Coast 0.80 1.6 1.28 1.70 1.63 2.77 1.40 1.40 1.96
Central Highlands 3.90 1.34 5.23 4.12 1.35 5.56 3.90 1.40 5.46
South East 2.40 1.3 3.12 1.85 1.3 2.41 1.80 1.40 2.52
Mekong River Delta 0.00 0.00 0.00 0.00 0.00 0.00 0.02 3.00 0.06
Total Vietnam 9.8 1.31 12.90 10.6 1.34 14.20 9.84 1.28 12.58
Source: MARD; General Statistics Office (GSO); and other trade sources. Note:
Prod.: Production
THA: Thousand Hectares
MT/HA: Metric Ton per Hectare
TMT: Thousand Metric Tons
(*): estimates
Cotton production in Vietnam is highly susceptible to weather conditions and can fluctuate widely from
one year to the next. More than 90 percent of the cotton production area in Vietnam is rain-fed, with
planting initiated in the rainy season (May/June – August) and harvesting taking place from October -
December. In areas where irrigation is possible, cotton may be planted in the dry season
(November/December), thereby allowing for harvesting from March through May.
TRADE
As a result of strong demand for cotton yarns from international markets, especially China, Vietnam
cotton imports in calendar year 2012 saw a significant increase -- 27 percent over 2011. Its imports
reached a record of 416,000 mt or 1,908 thousand bales with a value of $870 million. U.S. cotton
exports to Vietnam during 2010-2011 remained relatively stable, between 132,900 and 133,200 mt.
However, exports in 2012 dropped by 5 percent reaching 126,600 mt.
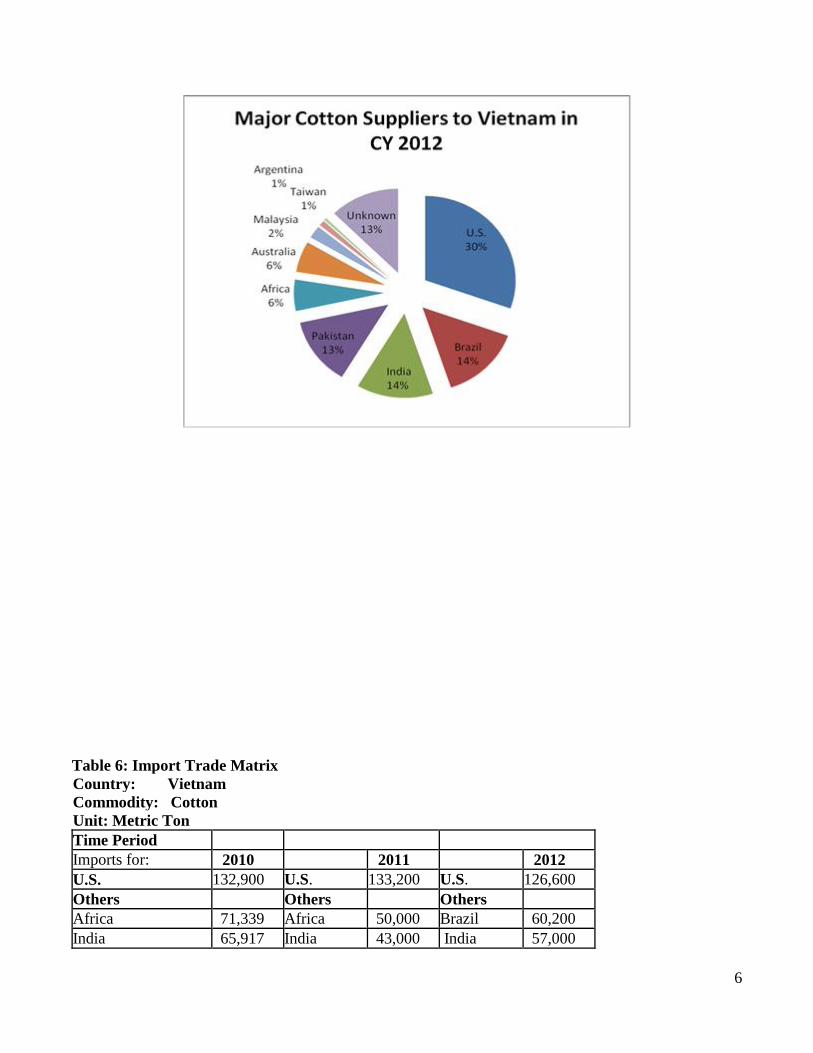
- Vietnam’s Primary Cotton Suppliers According to Table 6 and the pie chart below, in 2012, Vietnam imported about 416,000 tons of cotton,
a year-on-year increase of 27 percent. The United States remains the number one cotton supplier to
Vietnam, with more than a 30 percent share of Vietnam’s total cotton imports (note: this marks the sixth
consecutive year that the U.S. is the leading supplier of cotton to Vietnam). Brazil ranked second and
India was the third largest supplier. Other major suppliers include Pakistan, African countries, and
Australia.
6
Table 6: Import Trade Matrix
Country: Vietnam
Commodity: Cotton
Unit: Metric Ton
Time Period
Imports for: 2010 2011 2012
U.S. 132,900 U.S. 133,200 U.S. 126,600
Others Others Others
Africa 71,339 Africa 50,000 Brazil 60,200
India 65,917 India 43,000 India 57,000
7
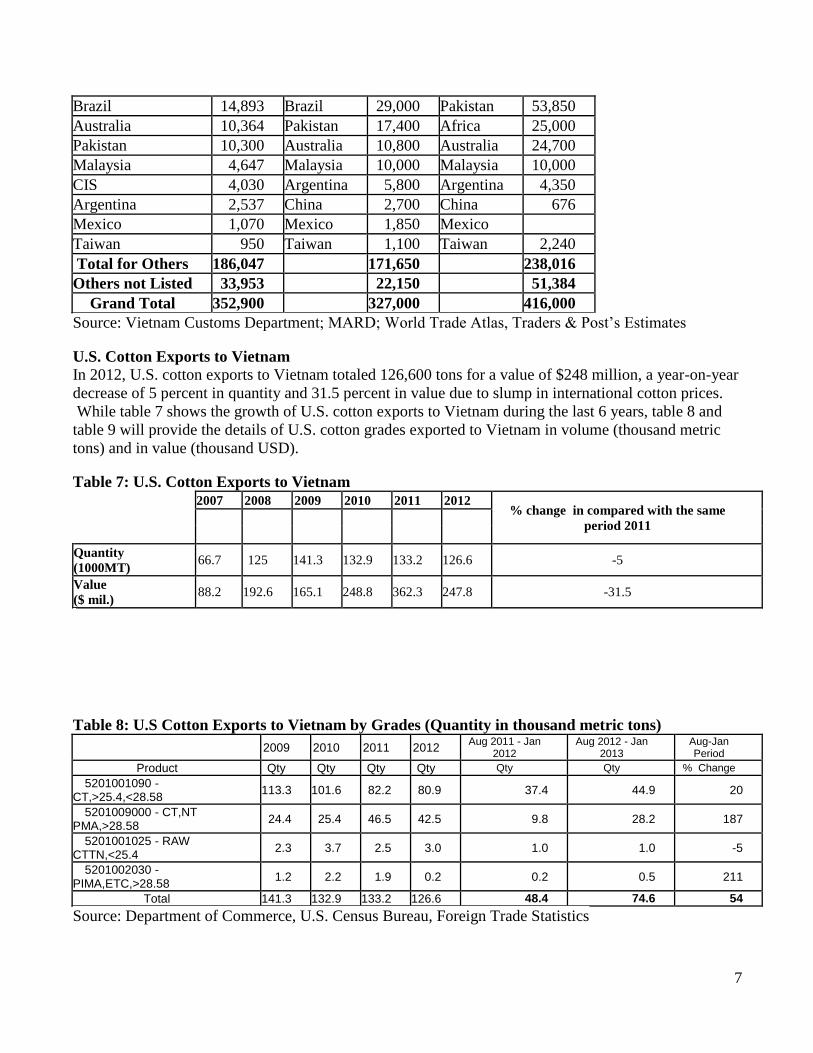
Brazil 14,893 Brazil 29,000 Pakistan 53,850
Australia 10,364 Pakistan 17,400 Africa 25,000
Pakistan 10,300 Australia 10,800 Australia 24,700
Malaysia 4,647 Malaysia 10,000 Malaysia 10,000
CIS 4,030 Argentina 5,800 Argentina 4,350
Argentina 2,537 China 2,700 China 676
Mexico 1,070 Mexico 1,850 Mexico
Taiwan 950 Taiwan 1,100 Taiwan 2,240
Total for Others 186,047 171,650 238,016
Others not Listed 33,953 22,150 51,384
Grand Total 352,900 327,000 416,000
Source: Vietnam Customs Department; MARD; World Trade Atlas, Traders & Post’s Estimates
U.S. Cotton Exports to Vietnam
In 2012, U.S. cotton exports to Vietnam totaled 126,600 tons for a value of $248 million, a year-on-year
decrease of 5 percent in quantity and 31.5 percent in value due to slump in international cotton prices.
While table 7 shows the growth of U.S. cotton exports to Vietnam during the last 6 years, table 8 and
table 9 will provide the details of U.S. cotton grades exported to Vietnam in volume (thousand metric
tons) and in value (thousand USD).
Table 7: U.S. Cotton Exports to Vietnam
2007 2008 2009 2010 2011 2012 % change in compared with the same
period 2011
Quantity
(1000MT) 66.7 125 141.3 132.9 133.2 126.6 -5
Value ($ mil.)
88.2 192.6 165.1 248.8 362.3 247.8 -31.5
Table 8: U.S Cotton Exports to Vietnam by Grades (Quantity in thousand metric tons)
2009 2010 2011 2012 Aug 2011 - Jan
2012 Aug 2012 - Jan
2013 Aug-Jan Period
Product Qty Qty Qty Qty Qty Qty % Change 5201001090 -
CT,>25.4,<28.58 113.3 101.6 82.2 80.9 37.4 44.9 20
5201009000 - CT,NT PMA,>28.58
24.4 25.4 46.5 42.5 9.8 28.2 187
5201001025 - RAW CTTN,<25.4
2.3 3.7 2.5 3.0 1.0 1.0 -5
5201002030 - PIMA,ETC,>28.58
1.2 2.2 1.9 0.2 0.2 0.5 211
Total 141.3 132.9 133.2 126.6 48.4 74.6 54
Source: Department of Commerce, U.S. Census Bureau, Foreign Trade Statistics
8
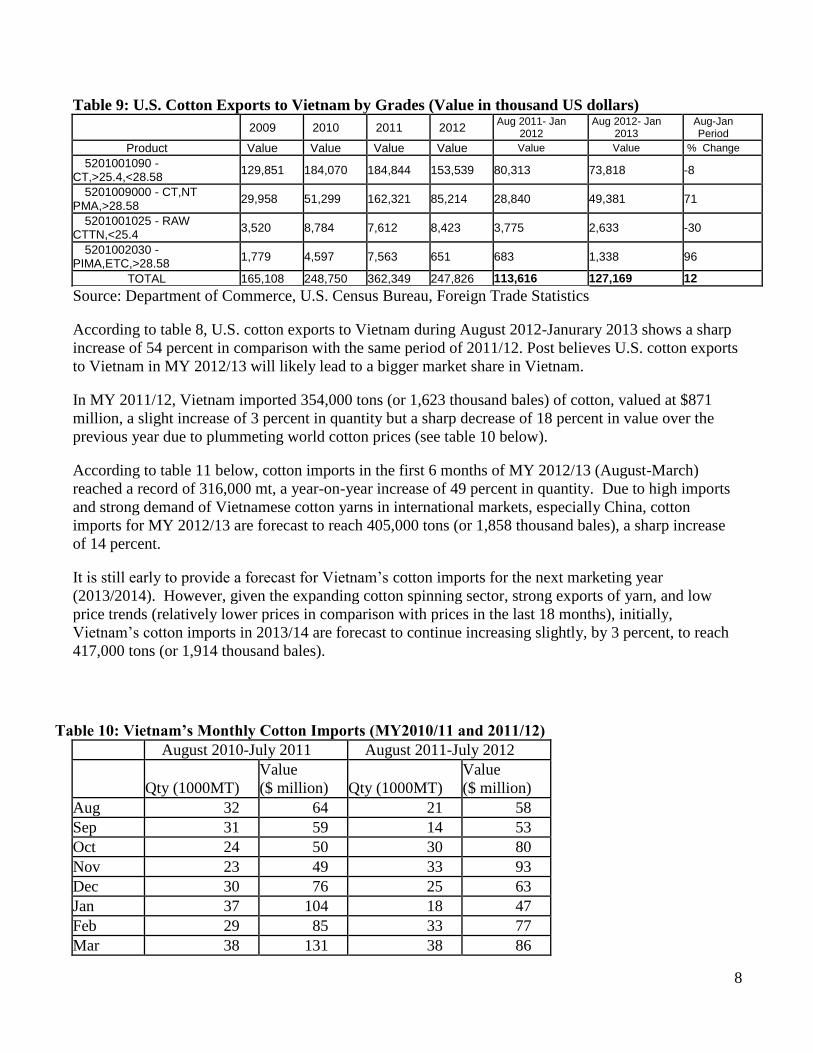
Table 9: U.S. Cotton Exports to Vietnam by Grades (Value in thousand US dollars)
2009 2010 2011 2012 Aug 2011- Jan
2012 Aug 2012- Jan
2013 Aug-Jan Period
Product Value Value Value Value Value Value % Change 5201001090 -
CT,>25.4,<28.58 129,851 184,070 184,844 153,539 80,313 73,818 -8
5201009000 - CT,NT PMA,>28.58
29,958 51,299 162,321 85,214 28,840 49,381 71
5201001025 - RAW CTTN,<25.4
3,520 8,784 7,612 8,423 3,775 2,633 -30
5201002030 - PIMA,ETC,>28.58
1,779 4,597 7,563 651 683 1,338 96
TOTAL 165,108 248,750 362,349 247,826 113,616 127,169 12
Source: Department of Commerce, U.S. Census Bureau, Foreign Trade Statistics
According to table 8, U.S. cotton exports to Vietnam during August 2012-Janurary 2013 shows a sharp
increase of 54 percent in comparison with the same period of 2011/12. Post believes U.S. cotton exports
to Vietnam in MY 2012/13 will likely lead to a bigger market share in Vietnam.
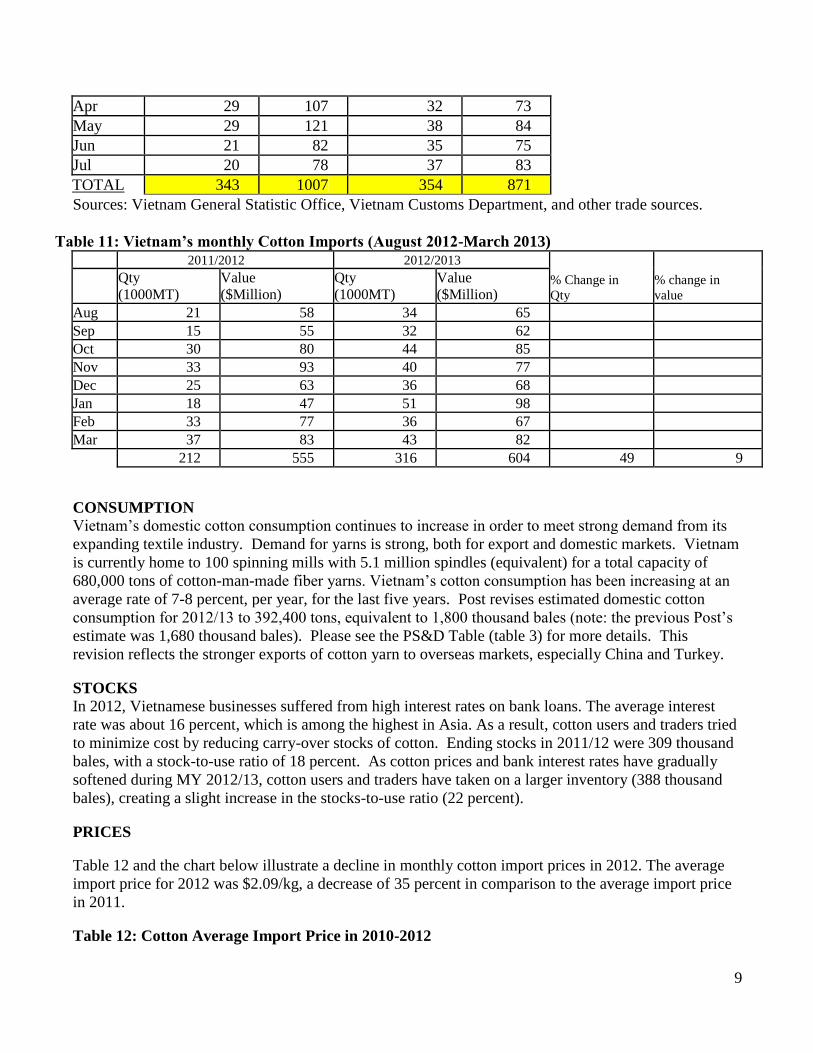
In MY 2011/12, Vietnam imported 354,000 tons (or 1,623 thousand bales) of cotton, valued at $871
million, a slight increase of 3 percent in quantity but a sharp decrease of 18 percent in value over the
previous year due to plummeting world cotton prices (see table 10 below).
According to table 11 below, cotton imports in the first 6 months of MY 2012/13 (August-March)
reached a record of 316,000 mt, a year-on-year increase of 49 percent in quantity. Due to high imports
and strong demand of Vietnamese cotton yarns in international markets, especially China, cotton
imports for MY 2012/13 are forecast to reach 405,000 tons (or 1,858 thousand bales), a sharp increase
of 14 percent.
It is still early to provide a forecast for Vietnam’s cotton imports for the next marketing year
(2013/2014). However, given the expanding cotton spinning sector, strong exports of yarn, and low
price trends (relatively lower prices in comparison with prices in the last 18 months), initially,
Vietnam’s cotton imports in 2013/14 are forecast to continue increasing slightly, by 3 percent, to reach
417,000 tons (or 1,914 thousand bales).
Table 10: Vietnam’s Monthly Cotton Imports (MY2010/11 and 2011/12)
August 2010-July 2011 August 2011-July 2012
Qty (1000MT)
Value
($ million) Qty (1000MT)
Value
($ million)
Aug 32 64 21 58
Sep 31 59 14 53
Oct 24 50 30 80
Nov 23 49 33 93
Dec 30 76 25 63
Jan 37 104 18 47
Feb 29 85 33 77
Mar 38 131 38 86
9
Apr 29 107 32 73
May 29 121 38 84
Jun 21 82 35 75
Jul 20 78 37 83
TOTAL 343 1007 354 871
Sources: Vietnam General Statistic Office, Vietnam Customs Department, and other trade sources.
Table 11: Vietnam’s monthly Cotton Imports (August 2012-March 2013)
2011/2012 2012/2013
% Change in
Qty % change in
value
Qty
(1000MT)
Value
($Million)
Qty
(1000MT)
Value
($Million)
Aug 21 58 34 65
Sep 15 55 32 62
Oct 30 80 44 85
Nov 33 93 40 77
Dec 25 63 36 68
Jan 18 47 51 98
Feb 33 77 36 67
Mar 37 83 43 82
212 555 316 604 49 9
CONSUMPTION
Vietnam’s domestic cotton consumption continues to increase in order to meet strong demand from its
expanding textile industry. Demand for yarns is strong, both for export and domestic markets. Vietnam
is currently home to 100 spinning mills with 5.1 million spindles (equivalent) for a total capacity of
680,000 tons of cotton-man-made fiber yarns. Vietnam’s cotton consumption has been increasing at an
average rate of 7-8 percent, per year, for the last five years. Post revises estimated domestic cotton
consumption for 2012/13 to 392,400 tons, equivalent to 1,800 thousand bales (note: the previous Post’s
estimate was 1,680 thousand bales). Please see the PS&D Table (table 3) for more details. This
revision reflects the stronger exports of cotton yarn to overseas markets, especially China and Turkey.
STOCKS
In 2012, Vietnamese businesses suffered from high interest rates on bank loans. The average interest
rate was about 16 percent, which is among the highest in Asia. As a result, cotton users and traders tried
to minimize cost by reducing carry-over stocks of cotton. Ending stocks in 2011/12 were 309 thousand
bales, with a stock-to-use ratio of 18 percent. As cotton prices and bank interest rates have gradually
softened during MY 2012/13, cotton users and traders have taken on a larger inventory (388 thousand
bales), creating a slight increase in the stocks-to-use ratio (22 percent).
PRICES
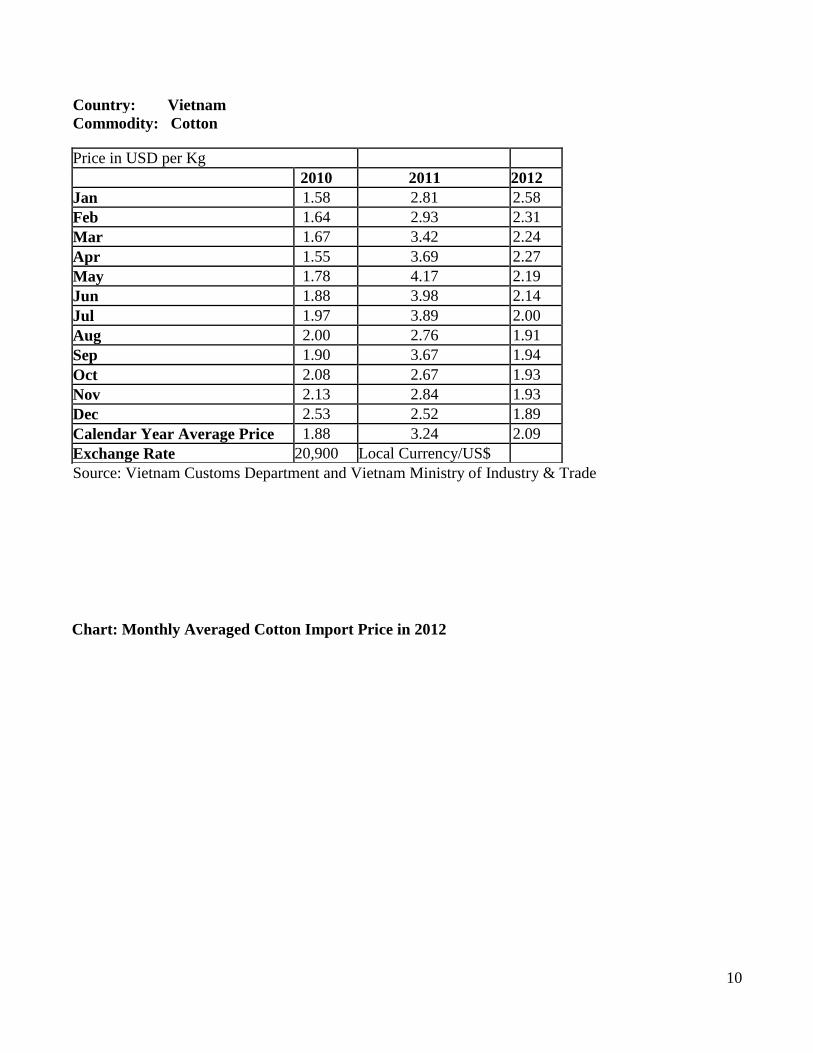
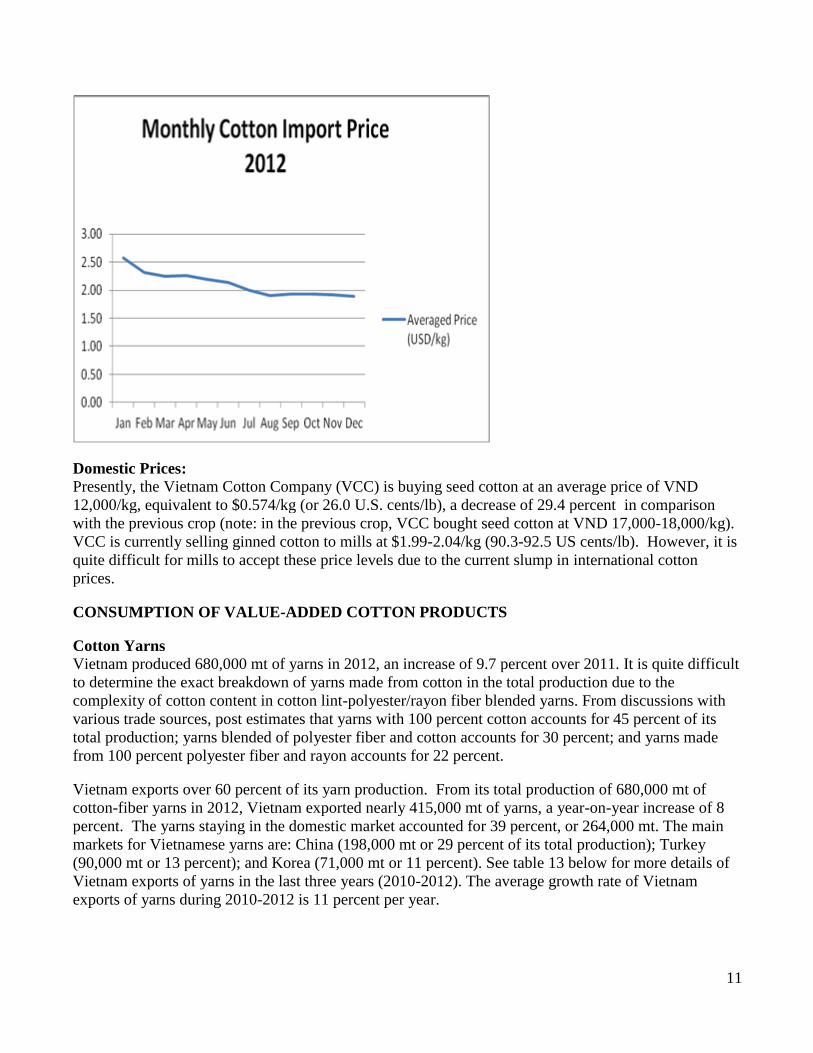
Table 12 and the chart below illustrate a decline in monthly cotton import prices in 2012. The average
import price for 2012 was $2.09/kg, a decrease of 35 percent in comparison to the average import price
in 2011.
Table 12: Cotton Average Import Price in 2010-2012
10
Country: Vietnam
Commodity: Cotton
Price in USD per Kg
2010 2011 2012
Jan 1.58 2.81 2.58
Feb 1.64 2.93 2.31
Mar 1.67 3.42 2.24
Apr 1.55 3.69 2.27
May 1.78 4.17 2.19
Jun 1.88 3.98 2.14
Jul 1.97 3.89 2.00
Aug 2.00 2.76 1.91
Sep 1.90 3.67 1.94
Oct 2.08 2.67 1.93
Nov 2.13 2.84 1.93
Dec 2.53 2.52 1.89
Calendar Year Average Price 1.88 3.24 2.09
Exchange Rate 20,900 Local Currency/US$
Source: Vietnam Customs Department and Vietnam Ministry of Industry & Trade
Chart: Monthly Averaged Cotton Import Price in 2012
11
Domestic Prices:
Presently, the Vietnam Cotton Company (VCC) is buying seed cotton at an average price of VND
12,000/kg, equivalent to $0.574/kg (or 26.0 U.S. cents/lb), a decrease of 29.4 percent in comparison
with the previous crop (note: in the previous crop, VCC bought seed cotton at VND 17,000-18,000/kg).
VCC is currently selling ginned cotton to mills at $1.99-2.04/kg (90.3-92.5 US cents/lb). However, it is
quite difficult for mills to accept these price levels due to the current slump in international cotton
prices.
CONSUMPTION OF VALUE-ADDED COTTON PRODUCTS
Cotton Yarns
Vietnam produced 680,000 mt of yarns in 2012, an increase of 9.7 percent over 2011. It is quite difficult
to determine the exact breakdown of yarns made from cotton in the total production due to the
complexity of cotton content in cotton lint-polyester/rayon fiber blended yarns. From discussions with
various trade sources, post estimates that yarns with 100 percent cotton accounts for 45 percent of its
total production; yarns blended of polyester fiber and cotton accounts for 30 percent; and yarns made
from 100 percent polyester fiber and rayon accounts for 22 percent.
Vietnam exports over 60 percent of its yarn production. From its total production of 680,000 mt of
cotton-fiber yarns in 2012, Vietnam exported nearly 415,000 mt of yarns, a year-on-year increase of 8
percent. The yarns staying in the domestic market accounted for 39 percent, or 264,000 mt. The main
markets for Vietnamese yarns are: China (198,000 mt or 29 percent of its total production); Turkey
(90,000 mt or 13 percent); and Korea (71,000 mt or 11 percent). See table 13 below for more details of
Vietnam exports of yarns in the last three years (2010-2012). The average growth rate of Vietnam
exports of yarns during 2010-2012 is 11 percent per year.
12
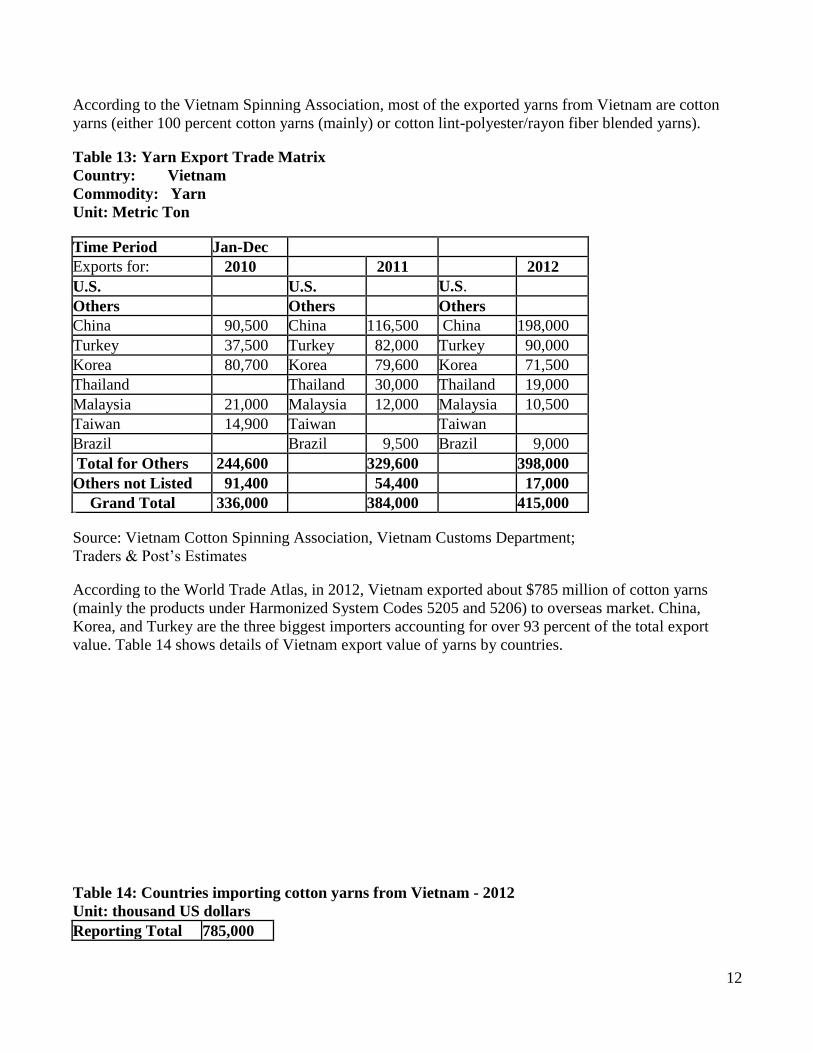
According to the Vietnam Spinning Association, most of the exported yarns from Vietnam are cotton
yarns (either 100 percent cotton yarns (mainly) or cotton lint-polyester/rayon fiber blended yarns).
Table 13: Yarn Export Trade Matrix
Country: Vietnam
Commodity: Yarn
Unit: Metric Ton
Time Period Jan-Dec
Exports for: 2010 2011 2012
U.S. U.S. U.S.
Others Others Others
China 90,500 China 116,500 China 198,000
Turkey 37,500 Turkey 82,000 Turkey 90,000
Korea 80,700 Korea 79,600 Korea 71,500
Thailand Thailand 30,000 Thailand 19,000
Malaysia 21,000 Malaysia 12,000 Malaysia 10,500
Taiwan 14,900 Taiwan Taiwan
Brazil Brazil 9,500 Brazil 9,000
Total for Others 244,600 329,600 398,000
Others not Listed 91,400 54,400 17,000
Grand Total 336,000 384,000 415,000
Source: Vietnam Cotton Spinning Association, Vietnam Customs Department;
Traders & Post’s Estimates
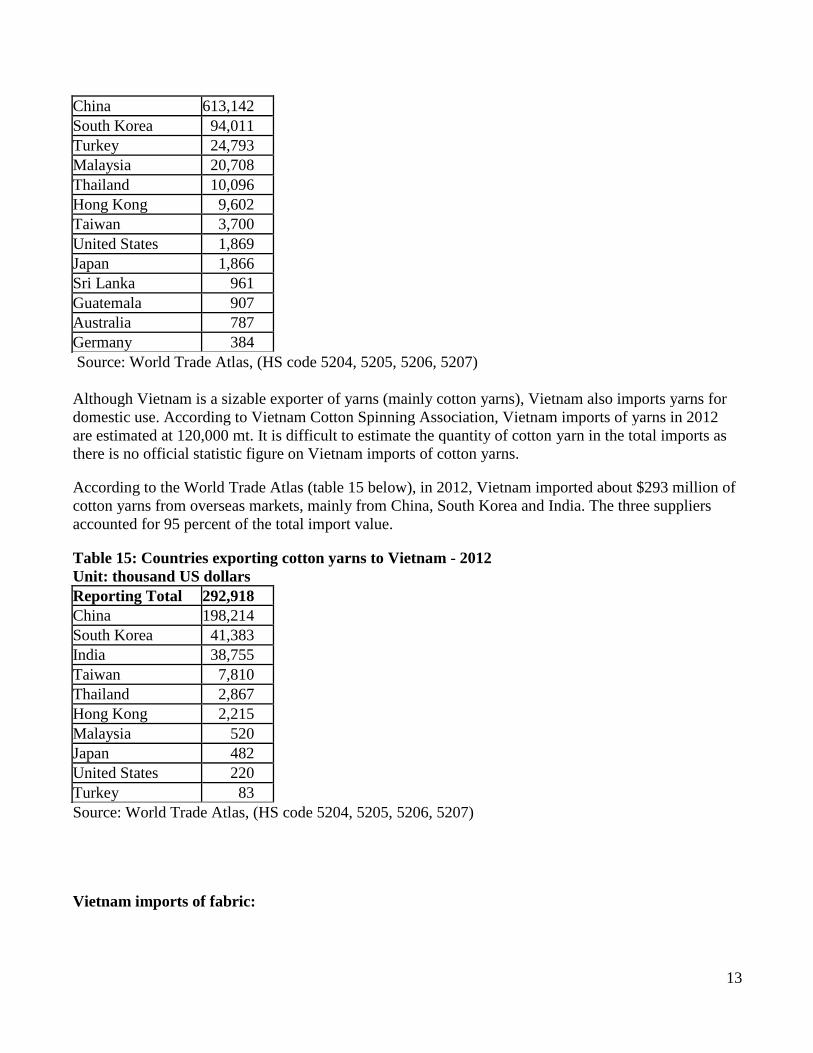
According to the World Trade Atlas, in 2012, Vietnam exported about $785 million of cotton yarns
(mainly the products under Harmonized System Codes 5205 and 5206) to overseas market. China,
Korea, and Turkey are the three biggest importers accounting for over 93 percent of the total export
value. Table 14 shows details of Vietnam export value of yarns by countries.
Table 14: Countries importing cotton yarns from Vietnam - 2012
Unit: thousand US dollars
Reporting Total 785,000
13
China 613,142
South Korea 94,011
Turkey 24,793
Malaysia 20,708
Thailand 10,096
Hong Kong 9,602
Taiwan 3,700
United States 1,869
Japan 1,866
Sri Lanka 961
Guatemala 907
Australia 787
Germany 384
Source: World Trade Atlas, (HS code 5204, 5205, 5206, 5207)
Although Vietnam is a sizable exporter of yarns (mainly cotton yarns), Vietnam also imports yarns for
domestic use. According to Vietnam Cotton Spinning Association, Vietnam imports of yarns in 2012
are estimated at 120,000 mt. It is difficult to estimate the quantity of cotton yarn in the total imports as
there is no official statistic figure on Vietnam imports of cotton yarns.
According to the World Trade Atlas (table 15 below), in 2012, Vietnam imported about $293 million of
cotton yarns from overseas markets, mainly from China, South Korea and India. The three suppliers
accounted for 95 percent of the total import value.
Table 15: Countries exporting cotton yarns to Vietnam - 2012
Unit: thousand US dollars
Reporting Total 292,918
China 198,214
South Korea 41,383
India 38,755
Taiwan 7,810
Thailand 2,867
Hong Kong 2,215
Malaysia 520
Japan 482
United States 220
Turkey 83
Source: World Trade Atlas, (HS code 5204, 5205, 5206, 5207)
Vietnam imports of fabric:
14
With the limited dyeing capacity, Vietnam is able to produce about 1-1.2 billion square meters of fabric.
To feed the growing apparel sector (for exports), Vietnam has to rely on imported fabrics. In 2012,
Vietnam imported over 6 billion square meters of fabric, mainly from China.
MARKETING/POLICY
Tariff on Cotton Cotton lint (HS code 5201 and 5203) has a zero tariff but a 5 percent value added tax is assessed.
Tariff on Cotton Yarn
Cotton yarn (HS code 5204-5205-5206-5207) has a 5 percent tariff and a 10 percent value added tax.
Biotech Policy and Cotton Production
Currently, the regulatory framework to evaluate and approve the cultivation biotech crops and for
utilization of biotech agriculture for food and feed use are under development. The Vietnamese
Ministry of Natural Resources and Environment (MONRE) has been working on the Circular on the
Procedure to issue Bio-Safety Certificate for Genetically Modified Organisms (GMO) since last year.
The Circular provides legal frame for agricultural biotechnology to be legally cultivated in Vietnam
following successful field trials conducted by the Ministry of Agricultural and Rural Development
(MARD). MONRE’s Circular will permit the legal cultivation of biotech corn, cotton, and soybeans,
once a biotech trait receives the Bio-safety Certificate from MONRE.
MARD is also developing the Circulars on the approval of GMO products allowed for feed and food
use. The Feed Circular was notified to the WTO for comments by trading partners. MARD is now
reviewing comments. In addition, MARD also plans to have the Circular on Approval of GMO
products allowed for food use issued by the end of 2013.
For more information on agricultural biotechnology in Vietnam, please refer to VM2071.