VIETNAM CHEMICAL INDUSTRY REPORT...
205
VIETNAM CHEMICAL INDUSTRY REPORT Q2/2018
Transcript of VIETNAM CHEMICAL INDUSTRY REPORT...
VIETNAM CHEMICAL INDUSTRY REPORT Q2/2018
TABLE OF CONTENTS
Content Page Content Page
Abbreviations 4 2.5. Current status of the regional chemical industry 29
Summary 5 2.6. Some typical chemicals producing countries 31
1. Business environment 7 2.7. Key players in the industry 38
1.1. Macroeconomic Indicator 7 3. Vietnam market 42
1.2. Legal framework 12 3.1. Formation and development history 42
2. World market 16 3.2. Definition and classification 44
2.1. Raw materials 16 3.3. Input materials 47
2.2. Production 20 3.4. Production and consumption 51
2.3. Consumption 24 3.5. Import Export 54
2.4. Import Export 27 4. Major sector groups 56
2
TABLE OF CONTENTS
Content Page Content Page
4.1. Fertilizers and nitrogen compounds 56 6.1. Development planning of the chemical industry 154
4.2. Synthetic rubber and raw plastic resins 756.2. Development planning of the paint and printing
ink industry
161
4.3. Detergents 92 6.3. Development planning of the plastics industry 163
4.4. Paint and printing ink 106 6.4. Outlooks of world chemical industry 166
4.5. Plant protection products 116 6.5. Outlooks of Vietnam chemical industry 171
4.6. Basic chemicals 129 7. Business Analysis 174
4.7. Synthetic fiber 139 7.1. Enterprise introduction 174
5. Industry risk 149 7.2. Financial analysis 185
6. Outlooks and forecasts 154 8. Appendix of financial statements 193
3
Content
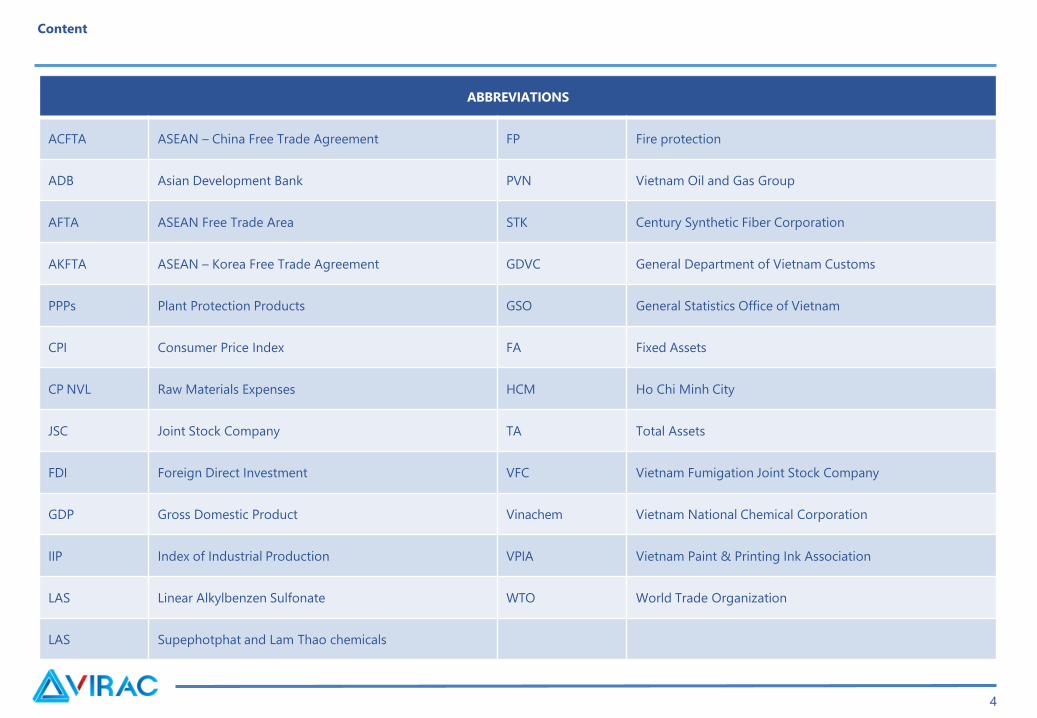
ABBREVIATIONS
ACFTA ASEAN – China Free Trade Agreement FP Fire protection
ADB Asian Development Bank PVN Vietnam Oil and Gas Group
AFTA ASEAN Free Trade Area STK Century Synthetic Fiber Corporation
AKFTA ASEAN – Korea Free Trade Agreement GDVC General Department of Vietnam Customs
PPPs Plant Protection Products GSO General Statistics Office of Vietnam
CPI Consumer Price Index FA Fixed Assets
CP NVL Raw Materials Expenses HCM Ho Chi Minh City
JSC Joint Stock Company TA Total Assets
FDI Foreign Direct Investment VFC Vietnam Fumigation Joint Stock Company
GDP Gross Domestic Product Vinachem Vietnam National Chemical Corporation
IIP Index of Industrial Production VPIA Vietnam Paint & Printing Ink Association
LAS Linear Alkylbenzen Sulfonate WTO World Trade Organization
LAS Supephotphat and Lam Thao chemicals
4
Summary
• Chemical industry has 8 sub-product categories including:
• Fertilizers and nitrogen compounds:
• Synthetic rubber and raw plastic resins:
• Detergents:
5
• Paint and printing ink
• Plant protection products:
• Basic chemicals:Content is intentionally removed for demo purpose
Summary
• Synthetic fiber:
• Technical machinery system of the chemical industry is largely
medium-sized compared to that of some countries in the region
• Almost all enterprises in the industry are small and medium-sized
and are facing up to fierce competition with multinational
corporations
• Vietnam chemical industry is still in strong development
6
Content is intentionally removed for demo purpose
TABLE OF CONTENTS
1. Business environment
1.1 Macroeconomic situation
1.2 Legal framework
7
9
GDP growth rate by quarter, 2015-Q1/2018
Sources: VIRAC, GSO
GDP by current price and GDP per capita, 2013-2017
Sources: VIRAC, GSO
1. Business environment
1.1 Macroeconomic situation
Content is intentionally removed for demo purpose
Source: VIRAC, GSO
• Consumer price index (CPI) in the first quarter of 2018 had a lot of changes.
1. Business environment
1.1 Macroeconomic situation
9
Monthly CPI fluctuations 2014 – 3/2018
Content is intentionally removed for demo purpose

1. Business environment
1.1 Macroeconomic situation
Source: VIRAC,GDVC
Million USD
billion USD
Source: VIRAC,GDVC
10
Import and export of commodity, 2006 – Q1/2018
Vietnam's export of crude oil and coal, 2011 –
Q1/2018e
Content is intentionally removed for demo purpose
Vietnam’s export and import value in Q1/2018 was 108.43 billion USD
• The VND / USD exchange rate was quite stable and still supported by a plentiful supply of foreign currencies
Source: VIRAC, SBV Source: VIRAC, SBV
1. Business environment
1.1 Macroeconomic situation
11
VND/USD exchange rate, 2013-3/2018 VND/CNY exchange rate, 2/2016 – 3/2018
Content is intentionally removed for demo purpose
TABLE OF CONTENTS
1. Business environment
1.1 Macroeconomic situation
1.2 Legal framework
12
1. Business environment
1.2 Legal framework – 1.2.1 General rules
Groups of policy on the chemical industry
13
Content is intentionally removed for demo purpose

1. Business environment
1.2 Legal framework – 1.2.1 General rules
Impact evaluation of laws, circulars and decrees on the business activities in the sector.
14
Content is intentionally removed for demo purpose
1. Business environment
1.2 Legal framework – 1.2.2 Impact of Free Trade Agreements
Impact evaluation of Trade Agreements on the Chemical industry
Vietnam's average tariffs under major trade agreements
Tariffs of Vietnam and Korea after AKFTA application
15
Content is intentionally removed for demo purpose

TABLE OF CONTENTS
2. World market
2.1 Raw materials
2.2 Production
2.3 Consumption
2.4 Import Export
2.5 Current status of the regional chemical industry
2.6 Some typical chemicals producing countries
2.7 Key players in the industry
16
• Major input materials for the chemical industry include petroleum, natural
gas/shale gas and coal,
2. World market
2.1 Raw materials
Million barrels/day
Source: VIRAC, EIA
Source: VIRAC, OPEC
17
Natural gas production volume by type worldwide, 2010 – 2040e
World crude oil supply and demand, 2006-2017e
Content is intentionally removed for demo purpose

2. World market
2.1 Raw materials
Million tons
Source: VIRAC, OPEC
17
Price movement of thermal coal, 1/2013-3/2018Global coal production and consumption, 2011-2016
USD/ton
Source: VIRAC, Indexmundi
Source: VIRAC, BP Statistical Review
Content is intentionally removed for demo purpose
Today, coal is the main source of energy globally, providing one fourth of all primary energy
• World crude oil price in 2017 :
• Natural gas price:
18
2. World market
2.1 Raw materials
Content is intentionally removed for demo purpose
Sources: VIRAC, Indexmundi
USD/barrel
Price movements of crude oil and natural gas in the world, 2014 – 3/2018

TABLE OF CONTENTS
20
2. World market
2.1 Raw materials
2.2 Production
2.3 Consumption
2.4 Import Export
2.5 Current status of the regional chemical industry
2.6 Some typical chemicals producing countries
2.7 Key players in the industry

Source: VIRAC, BASF
2. World market
2.2 Production
billion
USD
Source: VIRAC, BASF
21
World production value of chemicals, 2010 - 2016e Structure of chemical production by region, 2015e
Content is intentionally removed for demo purpose

Source: VIRAC, Statista
2. World market
2.2 Production
In 2016, production volume of chemicals in all regions was estimated to
increase,
Source: VIRAC, Statista
22
Production structure of chemical products worldwide, 2015
Chemical production growth by region, 2014 – 2020e
Content is intentionally removed for demo purpose

Source: VIRAC, Statista
2. World market
2.2 Production
23
Forecast for annual production growth in chemical industry by field, 2016 - 2021e
Content is intentionally removed for demo purpose
TABLE OF CONTENTS
24
2. World market
2.1 Raw materials
2.2 Production
2.3 Consumption
2.4 Import Export
2.5 Current status of the regional chemical industry
2.6 Some typical chemicals producing countries
2.7 Key players in the industry

00)
00)
00)
25%
17%
13%
13%
Source: VIRAC, Statista Source: VIRAC, Statista
• In 2015, the whole world witnessed a decline in the global chemical industry;
2. World market
2.3 Consumption
billion USD
25
Global Chemical Industry's Revenue, 2007 - 2016eSales growth in chemical industry by region,
2015 – 2018F
Content is intentionally removed for demo purpose
Source: VIRAC, Statista
Source: VIRAC, Statista
2. World market
2.3 Consumption
billion Euro
billion
Euro
26
Top 10 most chemicals consuming countries, 2016
Revenue from chemical consumption by region, 2016
Content is intentionally removed for demo purpose
TABLE OF CONTENTS
27
2. World market
2.1 Raw materials
2.2 Production
2.3 Consumption
2.4 Import Export
2.5 Current status of the regional chemical industry
2.6 Some typical chemicals producing countries
2.7 Key players in the industry
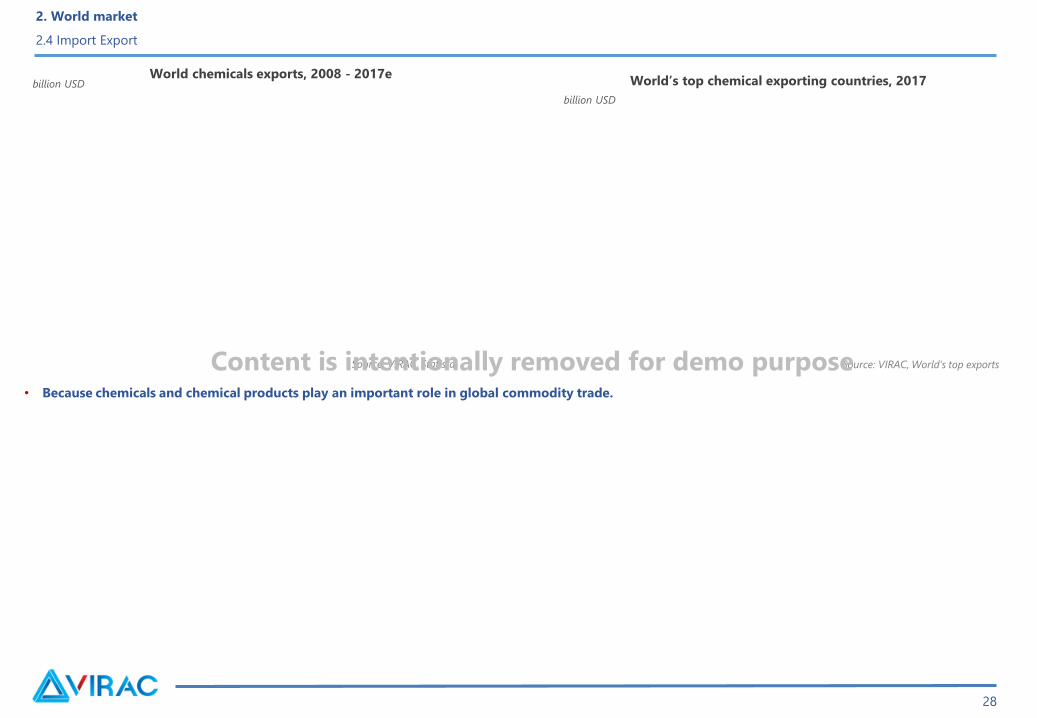
• Because chemicals and chemical products play an important role in global commodity trade.
Source: VIRAC, Statista
2. World market
2.4 Import Export
billion USD
billion USD
Source: VIRAC, World’s top exports
28
World chemicals exports, 2008 - 2017eWorld’s top chemical exporting countries, 2017
Content is intentionally removed for demo purpose

TABLE OF CONTENTS
29
2. World market
2.1 Raw materials
2.2 Production
2.3 Consumption
2.4 Import Export
2.5 Current status of the regional chemical industry
2.6 Some typical chemicals producing countries
2.7 Key players in the industry

30
2. World market
2.5 Current status of the regional chemical industry
Content is intentionally removed for demo purpose
• Asia market has recently accounted for 45% of the world’s chemical production value and 61% of the world’s chemical consumption
TABLE OF CONTENTS
31
2. World market
2.1 Raw materials
2.2 Production
2.3 Consumption
2.4 Import Export
2.5 Current status of the regional chemical industry
2.6 Some typical chemicals producing countries
2.7 Key players in the industry
• China is the largest chemical producer in the world and also in the top 10 largest chemicals exporting countries.
2. World market
2.6 Some typical chemicals producing countries – 2.6.1 China
32
Content is intentionally removed for demo purpose

2. World market
2.6 Some typical chemicals producing countries – 2.6.1 China
Thousand
tons
Source: VIRAC, ICIS
33
PTA net import and export in China, 2014 - 6M/2016
Content is intentionally removed for demo purpose

• In 2016, China's chemical volume was adjusted to decline as the economy growth was on the downward trend.
2. World market
2.6 Some typical chemicals producing countries – 2.6.1 China
34
Content is intentionally removed for demo purpose

• The United States is the largest chemical producer in the world and is rapidly developing.
2. World market
2.6 Some typical chemicals producing countries – 2.6.2 The United States
35
Content is intentionally removed for demo purpose

Source: VIRAC, Statista
2. World market
2.6 Some typical chemicals producing countries – 2.6.2 The United States
billion
USD
36
Revenue of American chemicals industry, 2008 – 2016e
Top largest US chemical companies by revenue, 2017e
Content is intentionally removed for demo purpose
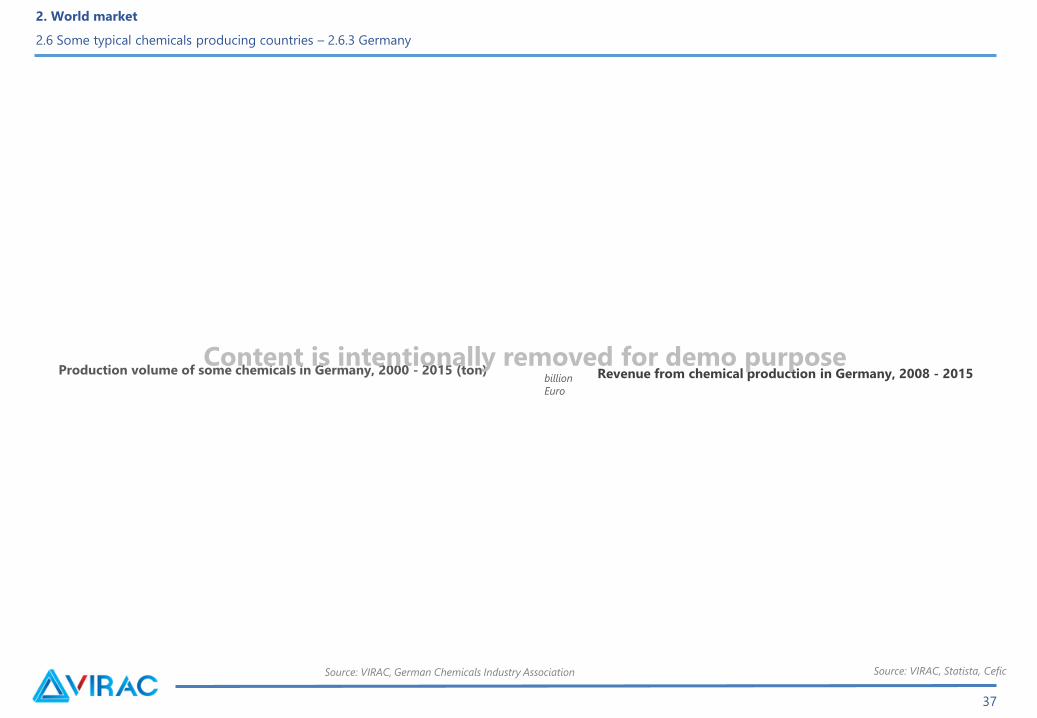
Source: VIRAC, German Chemicals Industry Association
2. World market
2.6 Some typical chemicals producing countries – 2.6.3 Germany
Production volume of some chemicals in Germany, 2000 - 2015 (ton)
Source: VIRAC, Statista, Cefic
billion
Euro
37
Revenue from chemical production in Germany, 2008 - 2015Content is intentionally removed for demo purpose

TABLE OF CONTENTS
38
2. World market
2.1 Raw materials
2.2 Production
2.3 Consumption
2.4 Import Export
2.5 Current status of the regional chemical industry
2.6 Some typical chemicals producing countries
2.7 Key players in the industry

2016 continues to be a year of an exciting M & A activity, following the
development of 2015 with 650 M & A deals
Source: VIRAC, Deloitte, Statista
Billion USD
39
M&A activity in the global chemical industry, 2009 - 2017
Content is intentionally removed for demo purpose
2. World market
2.7 Key players in the industry
2. World market
2.7 Key players in the industry
40
Source: VIRAC, Statista
billion USD
Source: VIRAC, Statista
Leading countries in mergers and acquisitions, Q1/2017
Top 10 largest chemical companies in the world by revenue, 2017e
Content is intentionally removed for demo purpose

• BASF, Germany:
• Bayer, Germany:
• Dow Chemical, the United States:
41
2. World market
2.7 Key players in the industry
Content is intentionally removed for demo purpose
3. Vietnam market
3.1 Formation and development history
3.2 Definition and classification
3.3 Input materials
3.4 Production and consumption
3.5 Import Export
TABLE OF CONTENTS
42
Definition
Formation and development history of Vietnam chemical industry
3. Vietnam market
3.1 Formation and development history
43
Content is intentionally removed for demo purpose
3. Vietnam market
3.1 Formation and development history
3.2 Definition and classification
3.3 Input materials
3.4 Production and consumption
3.5 Import Export
TABLE OF CONTENTS
44

Source: VIRAC, GSO
Product group Input materials Main product Customer
3. Vietnam market
3.2 Definition and classification
45
Content is intentionally removed for demo purpose
Sources: VIRAC, GSO
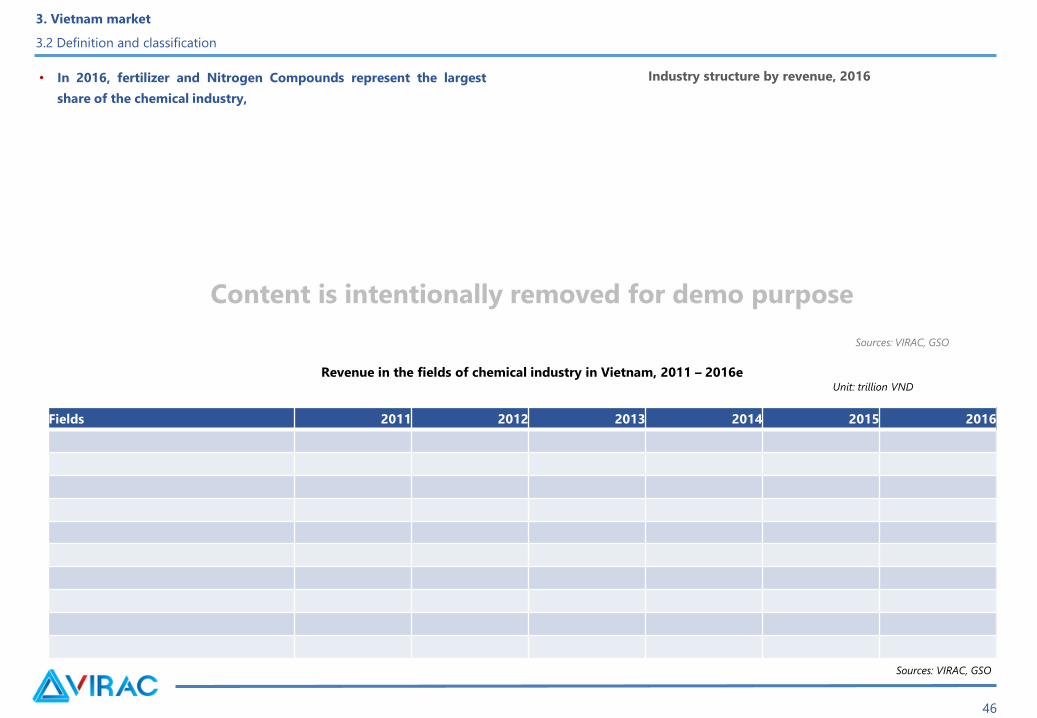
• In 2016, fertilizer and Nitrogen Compounds represent the largest
share of the chemical industry,
46
Fields 2011 2012 2013 2014 2015 2016
Revenue in the fields of chemical industry in Vietnam, 2011 – 2016e
Sources: VIRAC, GSO
Unit: trillion VND
Industry structure by revenue, 2016
3. Vietnam market
3.2 Definition and classification
Content is intentionally removed for demo purpose
3. Vietnam market
3.1 Formation and development history
3.2 Definition and classification
3.3 Input materials
3.4 Production and consumption
3.5 Import Export
TABLE OF CONTENTS
47

Main input material sources for chemicals production are coal,
petroleum, oil and gas and apatite.
Coal
Source: VIRAC, GSO
3. Vietnam market
3.3 Input materials
Million tons
Source: VIRAC, Vinacomin
Million tons
48
Coal production and export in Vietnam, 2011 – Q1/2018e
Forecast for coal supply and demand, 2015 - 2030
Content is intentionally removed for demo purpose
Source: VIRAC, Vietnam National Chemical GroupSource: VIRAC, Vietnam National Chemical Group
Thousand tonsThousand tons
49
3. Vietnam market
3.3 Input materials
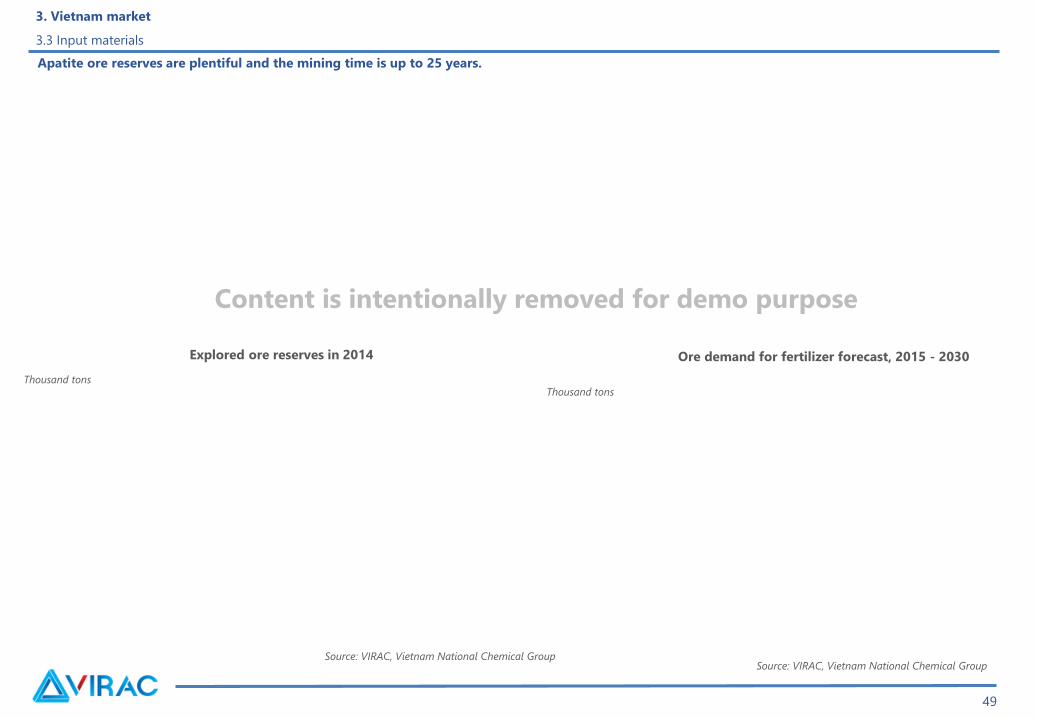
Ore demand for fertilizer forecast, 2015 - 2030Explored ore reserves in 2014
Content is intentionally removed for demo purpose
Apatite ore reserves are plentiful and the mining time is up to 25 years.
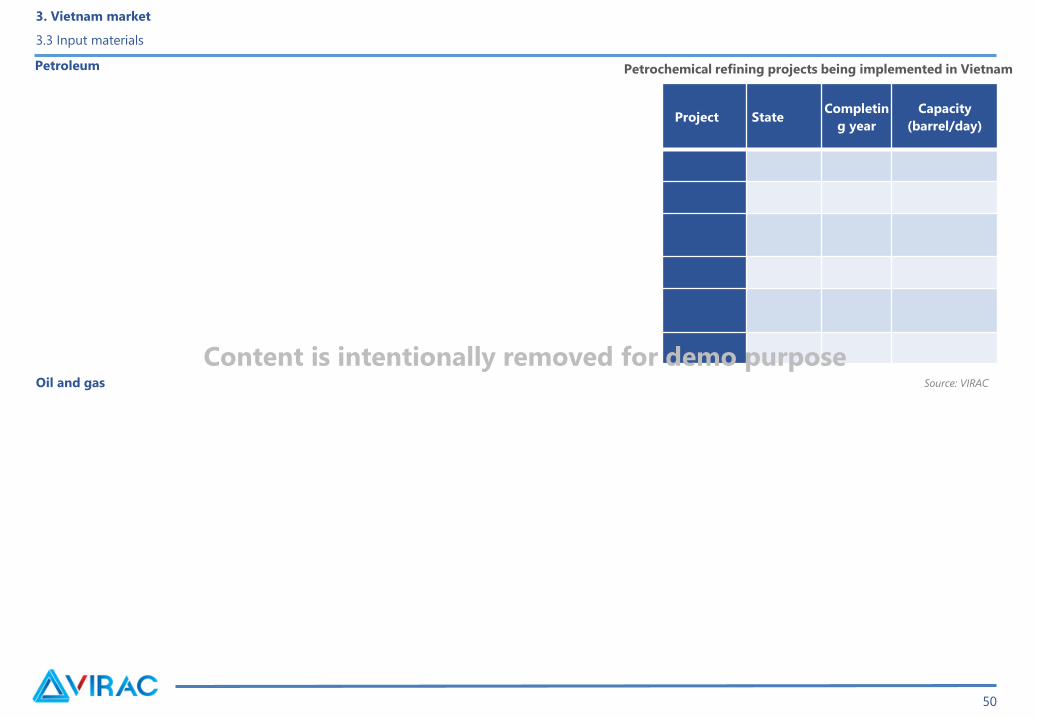
Petrochemical refining projects being implemented in VietnamPetroleum
Project StateCompletin
g year
Capacity
(barrel/day)
Source: VIRACOil and gas
3. Vietnam market
3.3 Input materials
50
Content is intentionally removed for demo purpose

3. Vietnam market
3.1 Formation and development history
3.2 Definition and classification
3.3 Input materials
3.4 Production and consumption
3.5 Import Export
TABLE OF CONTENTS
51
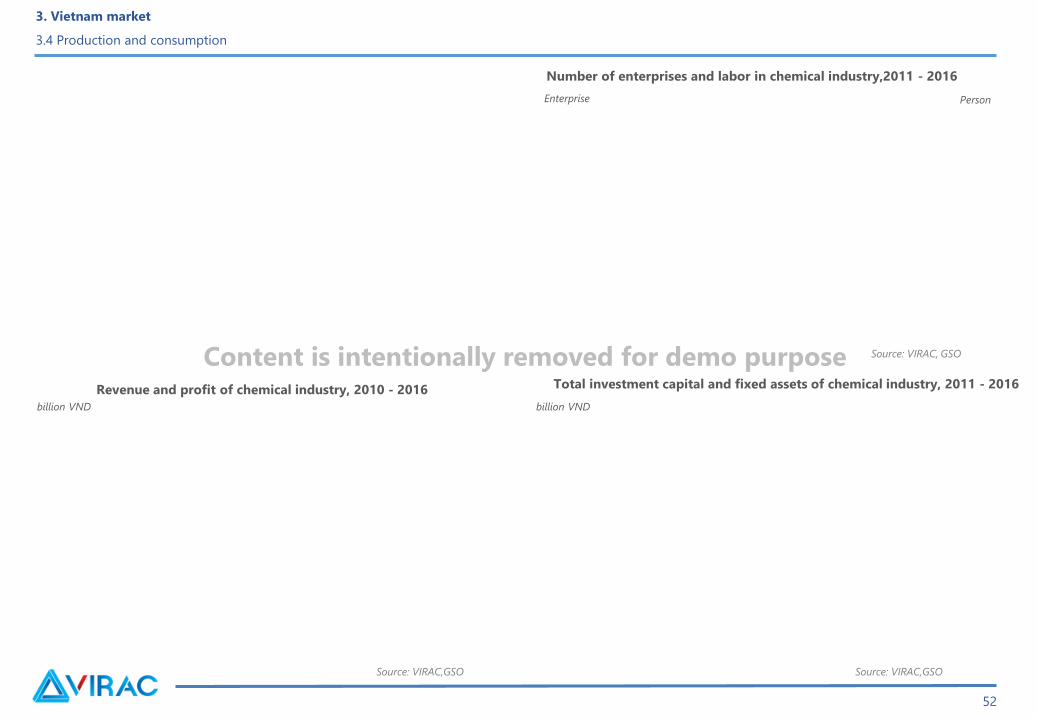
Source: VIRAC,GSO
Source: VIRAC, GSO
Enterprise Person
3. Vietnam market
3.4 Production and consumption
billion VND billion VND
Source: VIRAC,GSO
52
Number of enterprises and labor in chemical industry,2011 - 2016
Revenue and profit of chemical industry, 2010 - 2016 Total investment capital and fixed assets of chemical industry, 2011 - 2016
Content is intentionally removed for demo purpose
Source: VIRAC, GSO
Source: VIRAC, GSO
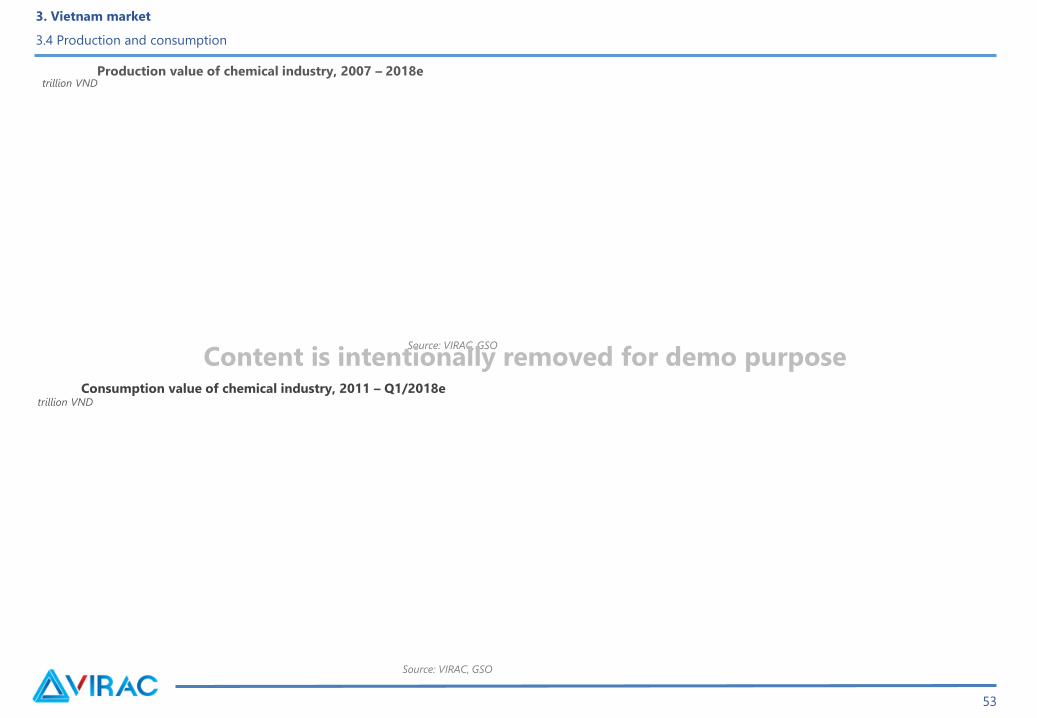
3. Vietnam market
3.4 Production and consumption
trillion VND
trillion VND
53
Consumption value of chemical industry, 2011 – Q1/2018e
Production value of chemical industry, 2007 – 2018e
Content is intentionally removed for demo purpose
3. Vietnam market
3.1 Formation and development history
3.2 Definition and classification
3.3 Input materials
3.4 Production and consumption
3.5 Import Export
TABLE OF CONTENTS
54
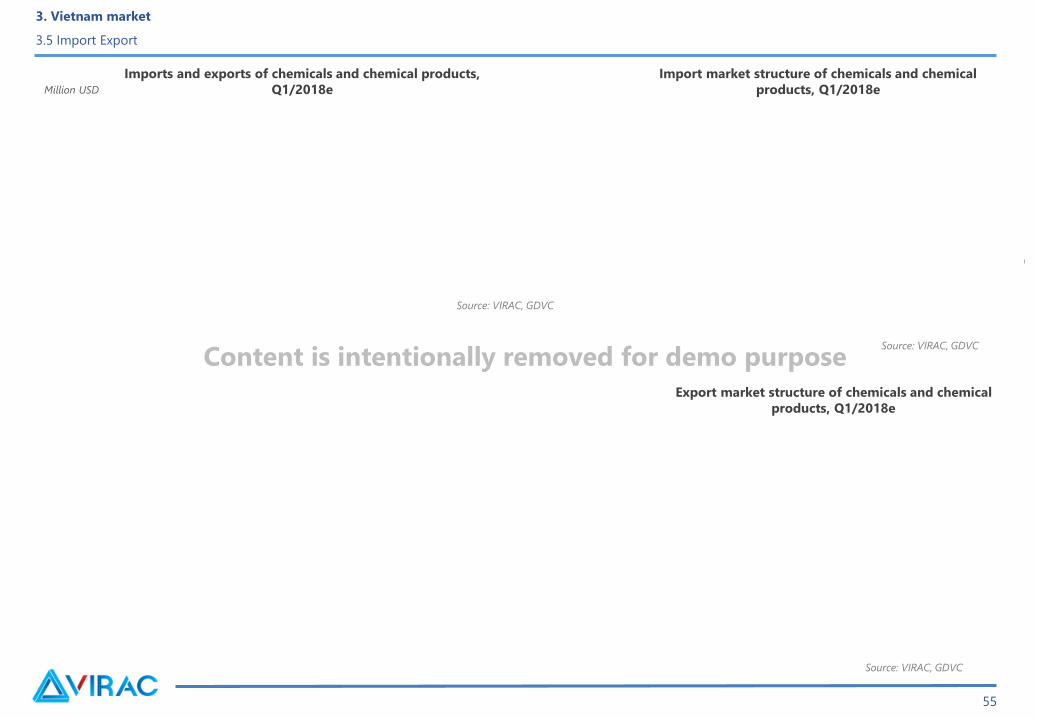
Source: VIRAC, GDVC
3. Vietnam market
3.5 Import Export
Source: VIRAC, GDVC
Source: VIRAC, GDVC
Million USD
55
Export market structure of chemicals and chemical
products, Q1/2018e
Import market structure of chemicals and chemical
products, Q1/2018e
Content is intentionally removed for demo purpose
Imports and exports of chemicals and chemical products,
Q1/2018e

4. Major sector groups
4.1 Fertilizers and nitrogen compounds
4.2 Synthetic rubber and raw plastic resins
4.3 Detergents
4.4 Paint and printing ink
4.5 Plant protection products
4.6 Basic chemicals
4.7 Synthetic fiber
TABLE OF CONTENTS
56

4. Major sector groups
4.1 Fertilizers and nitrogen compounds – 4.1.1 Definition and classification
58
Structure of major fertilizers 2014
Source: VIRAC, GSO
Content is intentionally removed for demo purpose
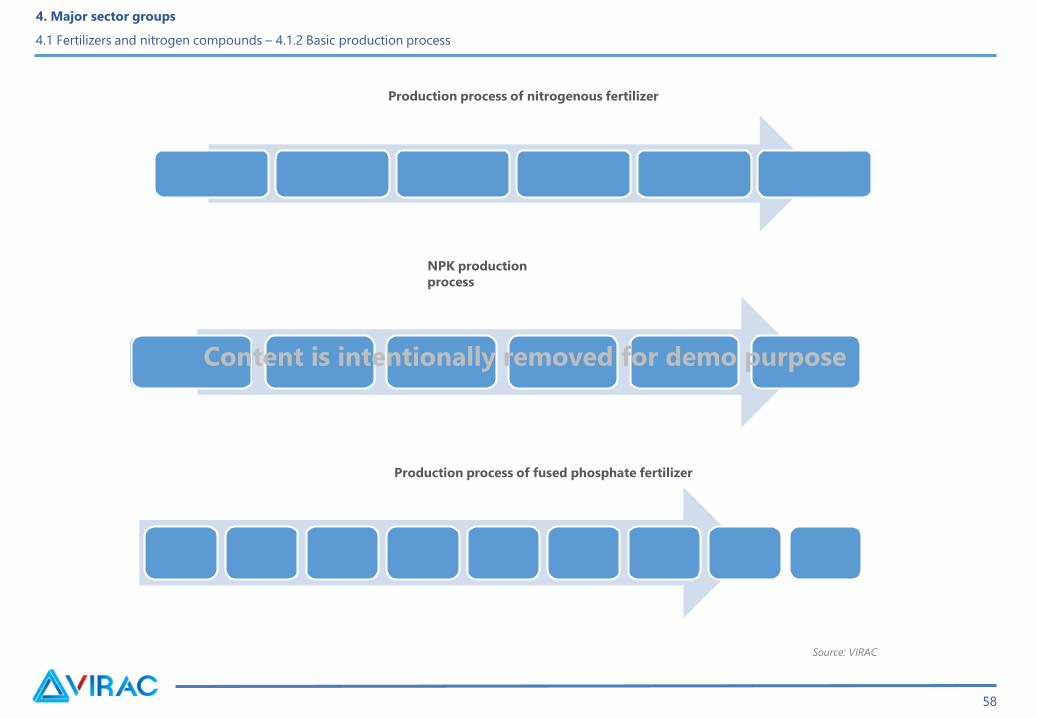
Production process of nitrogenous fertilizer
NPK production
process
Production process of fused phosphate fertilizer
Source: VIRAC
4. Major sector groups
4.1 Fertilizers and nitrogen compounds – 4.1.2 Basic production process
58
Content is intentionally removed for demo purpose

Materials
4. Major sector groups
4.1 Fertilizers and nitrogen compounds – 4.1.3 Input materials
59
Content is intentionally removed for demo purpose

Company's name Production technology
Production technology
Source: VIRAC
4. Major sector groups
4.1 Fertilizers and nitrogen compounds – 4.1.4 Production technology
60
Content is intentionally removed for demo purpose

Source: VIRAC, GSO
Production and consumption of domestic producers, Q1/2018e
4. Major sector groups
4.1 Fertilizers and nitrogen compounds – 4.1.5 Production
62
Revenue of the fertilizer industry, 2010-2016
Domestic fertilizer production, 2010-Q1/2018e
Million tons
Source: VIRAC, GSOSource: VIRAC, GSO, MARD, GDVC
Content is intentionally removed for demo purpose

Source: VIRAC
Group No EnterpriseDesign capacity(Thousand tons/year)
Production capacity của Key players in the industry, 3/2018
4. Major sector groups
4.1 Fertilizers and nitrogen compounds – 4.1.5 Production
62
Content is intentionally removed for demo purpose
Domestic fertilizer supply was mainly from large companies from Vinachem and PVN, which is particularly:
63
4. Major sector groups
4.1 Fertilizers and nitrogen compounds – 4.1.5 Production
Content is intentionally removed for demo purpose

2,0
0,9
Fertilizer consumption tends to decrease over the years, which is due to Million tons
64
Sources: VIRAC, GSO, MARD
Fertilizer demand and consumption , 2012 – 3M/2018e
4. Major sector groups
4.1 Fertilizers and nitrogen compounds – 4.1.6 Consumption
Content is intentionally removed for demo purpose

PetroVietnam Fertilizer and Chemicals CorporationPetroVietnam Camau Fertilizer Joint Stock
Company
Source: VIRAC
4. Major sector groups
4.1 Fertilizers and nitrogen compounds – 4.1.7 Competitive Analysis in the Fertilizer Industry
66
Content is intentionally removed for demo purpose
Sources: VIRAC, GSOSources: VIRAC, GSO
67
Market share by revenue, 2016
billion VND
Revenue of fertilizer industry, 2010 - 2016
4. Major sector groups
4.1 Fertilizers and nitrogen compounds – 4.1.7 Competitive Analysis in the Fertilizer Industry
Content is intentionally removed for demo purpose
Sources: VIRAC, GDVC, MARD
Thousand tons
Fertilizer import, 2012 – 2013M/2018ee
68
Fertilizer imports have fluctuated continuously over the years as the impact
of the domestic demand - supply and import and export tax policies as well
as major import markets.
Sources: VIRAC, MARD, GDVC
Structure of fertilizer import by type, 3M/2018e
4. Major sector groups
4.1 Fertilizers and nitrogen compounds – 4.1.8 Import Export
Content is intentionally removed for demo purpose

Source: VIRAC, MARD, GDVC
Fertilizer imports from China have fallen sharply in the fertilizer import structure
Fertilizer import structure by country, 3M/2017 – 3M/2018
4. Major sector groups
4.1 Fertilizers and nitrogen compounds – 4.1.8 Import Export
69
Content is intentionally removed for demo purpose

Source: VIRAC, MARD, GDVC
Million tonsFertilizer exports, 2012 – 3M/2018e
4. Major sector groups
4.1 Fertilizers and nitrogen compounds – 4.1.8 Import Export
70
Content is intentionally removed for demo purpose
Exports have decreased continuously over the years since 2012, due to the competition with Chinese fertilizer in Korea and Cambodia. However, in 2017,
the output of fertilizer export has grown strongly with the export volume grew strongly in ASEAN countries such as Cambodia, Malaysia ...
Fertilizer exports by country, 3M/2018e
Source: VIRAC, MARD, GDVC
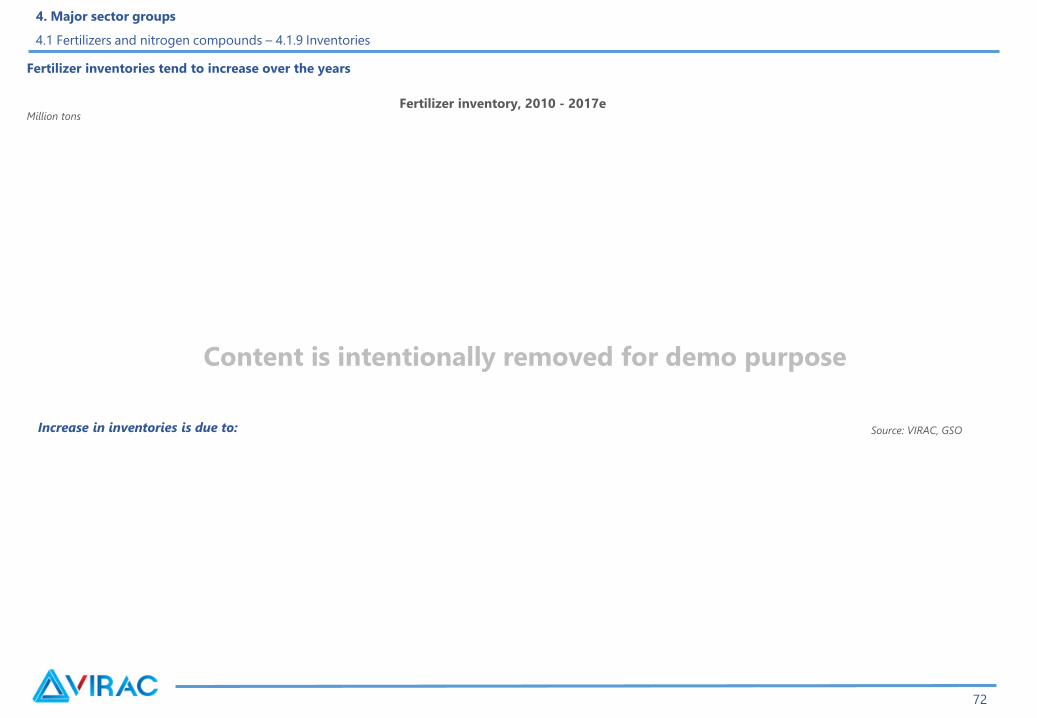
Fertilizer inventories tend to increase over the years
Increase in inventories is due to:
72
Source: VIRAC, GSO
Million tonsFertilizer inventory, 2010 - 2017e
4. Major sector groups
4.1 Fertilizers and nitrogen compounds – 4.1.9 Inventories
Content is intentionally removed for demo purpose
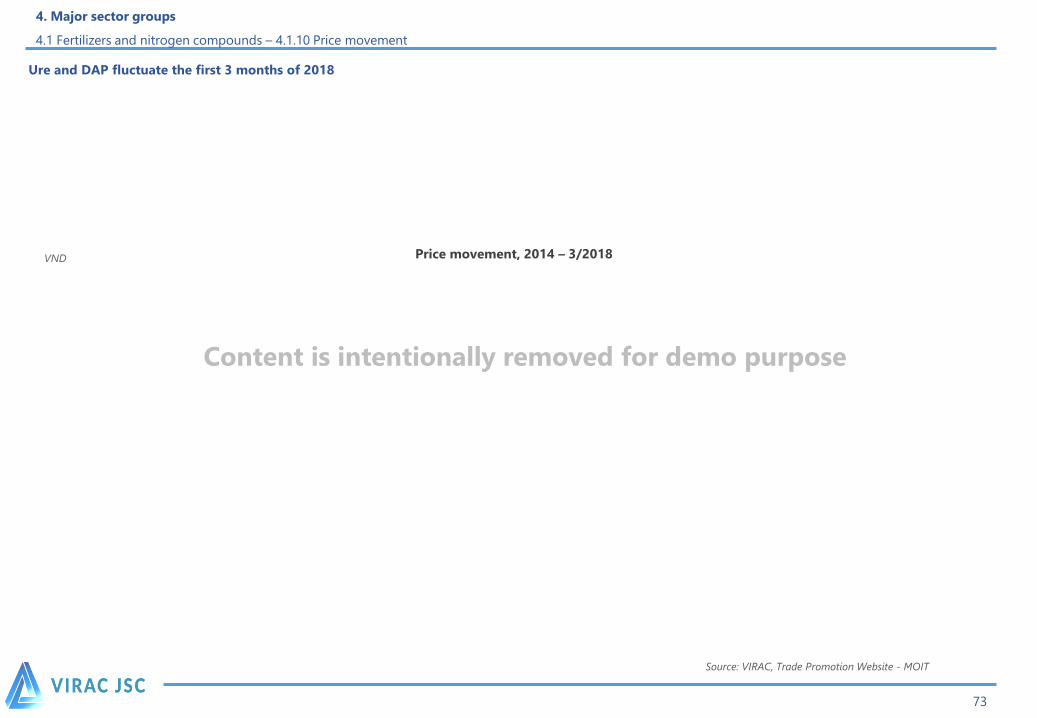
Ure and DAP fluctuate the first 3 months of 2018
VND
73
Price movement, 2014 – 3/2018
Source: VIRAC, Trade Promotion Website - MOIT
4. Major sector groups
4.1 Fertilizers and nitrogen compounds – 4.1.10 Price movement
Content is intentionally removed for demo purpose
72
Price forecasts
4. Major sector groups
4.1 Fertilizers and nitrogen compounds – 4.1.10 Price movement
Content is intentionally removed for demo purpose
4. Major sector groups
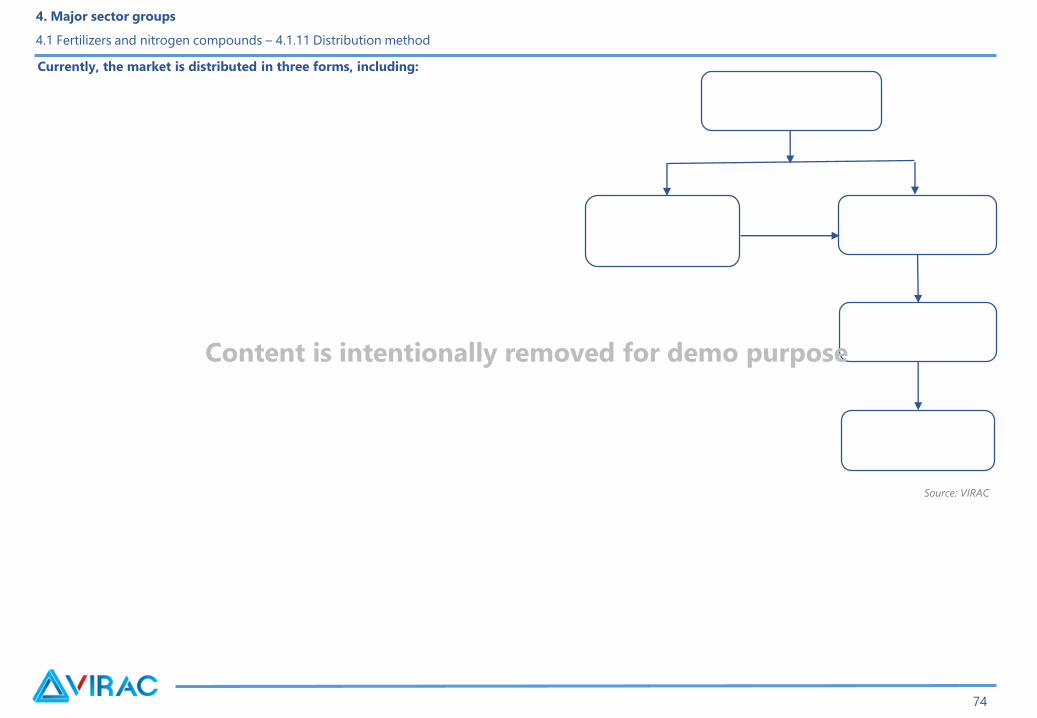
4.1 Fertilizers and nitrogen compounds – 4.1.11 Distribution method
Source: VIRAC
74
Content is intentionally removed for demo purpose
Currently, the market is distributed in three forms, including:

Method of transport: The logistics system is weak
Payment methods
75
4. Major sector groups
4.1 Fertilizers and nitrogen compounds – 4.1.12 Payment and transport method
Content is intentionally removed for demo purpose

TABLE OF CONTENTS
4. Major sector groups
4.1 Fertilizers and nitrogen compounds
4.2 Synthetic rubber and raw plastic resins
4.3 Detergents
4.4 Paint and printing ink
4.5 Plant protection products
4.6 Basic chemicals
4.7 Synthetic fiber
76

17%
Source: VIRAC, ICIS
4. Major sector groups
4.2 Synthetic rubber and raw plastic resins – 4.2.1 Definition and classification
77
Polymer structure used, 2015
Content is intentionally removed for demo purpose
Source: VIRAC, Rubbernews
4. Major sector groups
4.2 Synthetic rubber and raw plastic resins – 4.2.1 Definition and classification
78
Structure of synthetic rubber production in the world, 2015
Content is intentionally removed for demo purpose

4. Major sector groups
4.2 Synthetic rubber and raw plastic resins – 4.2.2 Basic production process
Content is intentionally removed for demo purpose

4. Major sector groups
4.2 Synthetic rubber and raw plastic resins – 4.2.3 Input materials
81
Material structure for Monomers production, 2016
Source: VIRAC, IHS
Content is intentionally removed for demo purpose

• Ethylene prices :
• Propylene prices :
• Benzene prices :
4. Major sector groups
4.2 Synthetic rubber and raw plastic resins – 4.2.3 Input materials
Source: VIRAC, Platts
USD/ton
81
Source: VIRAC, Platts
Fluctuations in global benzene prices, 5/2017 – 5/2018Worldwide propylene prices, 5/2017 – 4/2018
Source: VIRAC, Platts
Global ethylene prices, 5/2017 – 4/2018
USD/ton
USD/ton
Content is intentionally removed for demo purpose
Production of raw plastic resins
Production of synthetic rubber
4. Major sector groups
4.2 Synthetic rubber and raw plastic resins – 4.2.4 Production technology
82
Content is intentionally removed for demo purpose
Sources: VIRAC Sources: VIRAC, GSO
83
Production of raw plastic resins in some provinces, Q1/2018
4. Major sector groups
4.2 Synthetic rubber and raw plastic resins – 4.2.5 Production
Content is intentionally removed for demo purpose
Polypropylene supply and demand in Vietnam, 2010-
Q1/2018e
Production of raw plastic resins in the country, Q1/2018e

No Company name Sales (tons/year) Market share
85
PP production output and consumption of Binh Son Refining and Petrochemical,
2013 – 6M/2017
Sources: VIRAC, HCD Prospectus
4. Major sector groups
4.2 Synthetic rubber and raw plastic resins – 4.2.6 Consumption
LLDPE, LDPE, HDPE, PP distribution from enterprises in 2014-2015 in the
Northern market
Content is intentionally removed for demo purpose
Polymer consumption in Vietnam, 2010 – Q1/2018e
85
Market share of plastic additives, 2017
4. Major sector groups
4.2 Synthetic rubber and raw plastic resins – 4.2.6 Consumption
Source: VIRAC, GSO, MOIT
Source: VIRAC, GSO, MOIT
Content is intentionally removed for demo purpose

Import of plastic raw materials in Vietnam, 2010 – Q1/2018
4. Major sector groups
4.2 Synthetic rubber and raw plastic resins – 4.2.7 Import Export
85
Source: VIRAC, GDVC
Content is intentionally removed for demo purposeImport market of plastic raw materials by volume, Q1/2018
Source: VIRAC, GDVC

86
Sources: VIRAC, GSO
Proportion of top importers of plastic raw materials, 9M/2017
Import structure of plastic raw materials by type, Q1/2018
4. Major sector groups
4.2 Synthetic rubber and raw plastic resins – 4.2.7 Import Export
Content is intentionally removed for demo purpose
Sources: VIRAC, GSO

4. Major sector groups
4.2 Synthetic rubber and raw plastic resins – 4.2.7 Import Export
85
Source: VIRAC, GDVC, UN Comtrade
Import - export of synthetic rubber, 2011 – Q1/2018e
Content is intentionally removed for demo purpose
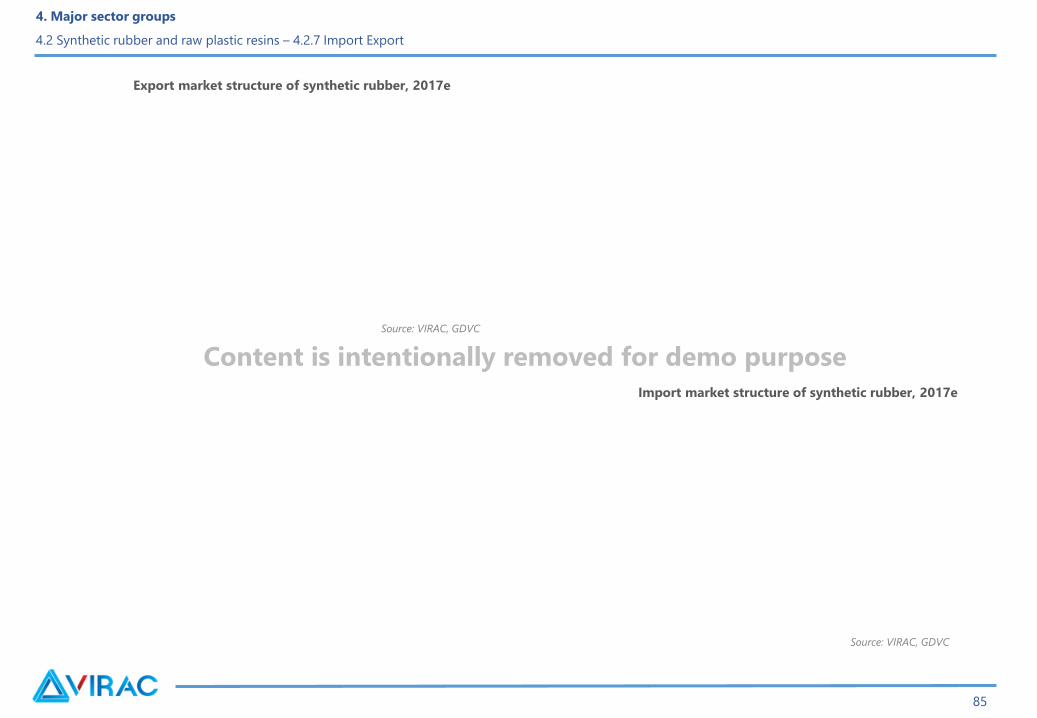
Import market structure of synthetic rubber, 2017e
4. Major sector groups
4.2 Synthetic rubber and raw plastic resins – 4.2.7 Import Export
85
Source: VIRAC, GDVC
Source: VIRAC, GDVC
Export market structure of synthetic rubber, 2017e
Content is intentionally removed for demo purpose

89
Source: VIRAC, Plastics New Europe
USD/ton
4. Major sector groups
4.2 Synthetic rubber and raw plastic resins – 4.2.8 Price movement
Polymer price fluctuations, 5/2015 – 4/2018
Content is intentionally removed for demo purpose
90
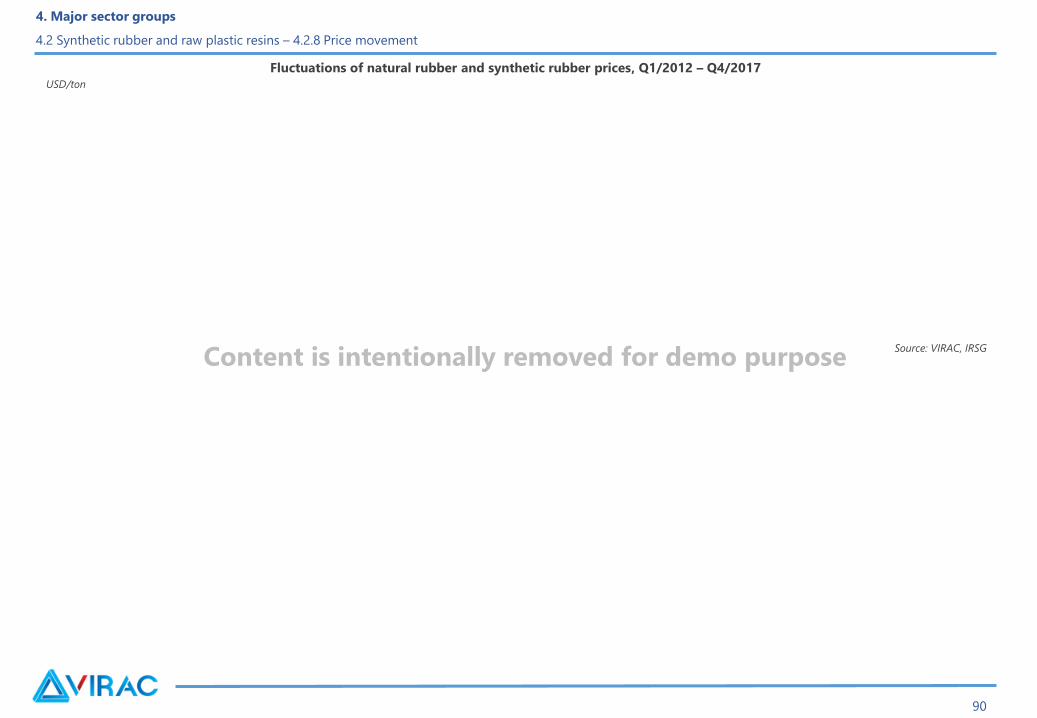
Source: VIRAC, IRSG
USD/ton
4. Major sector groups
4.2 Synthetic rubber and raw plastic resins – 4.2.8 Price movement
Fluctuations of natural rubber and synthetic rubber prices, Q1/2012 – Q4/2017
Content is intentionally removed for demo purpose
4. Major sector groups
4.2 Synthetic rubber and raw plastic resins – 4.2.8 Price movement
93
Content is intentionally removed for demo purpose
TABLE OF CONTENTS
4. Major sector groups
4.1 Fertilizers and nitrogen compounds
4.2 Synthetic rubber and raw plastic resins
4.3 Detergents
4.4 Paint and printing ink
4.5 Plant protection products
4.6 Basic chemicals
4.7 Synthetic fiber
94

• Detergents
Source: VIRAC, GSO
4. Major sector groups
4.3 Detergents – 4.3.1 Definition and classification
95
Number of enterprises and labor in the industry, 2011 - 2016
Content is intentionally removed for demo purpose
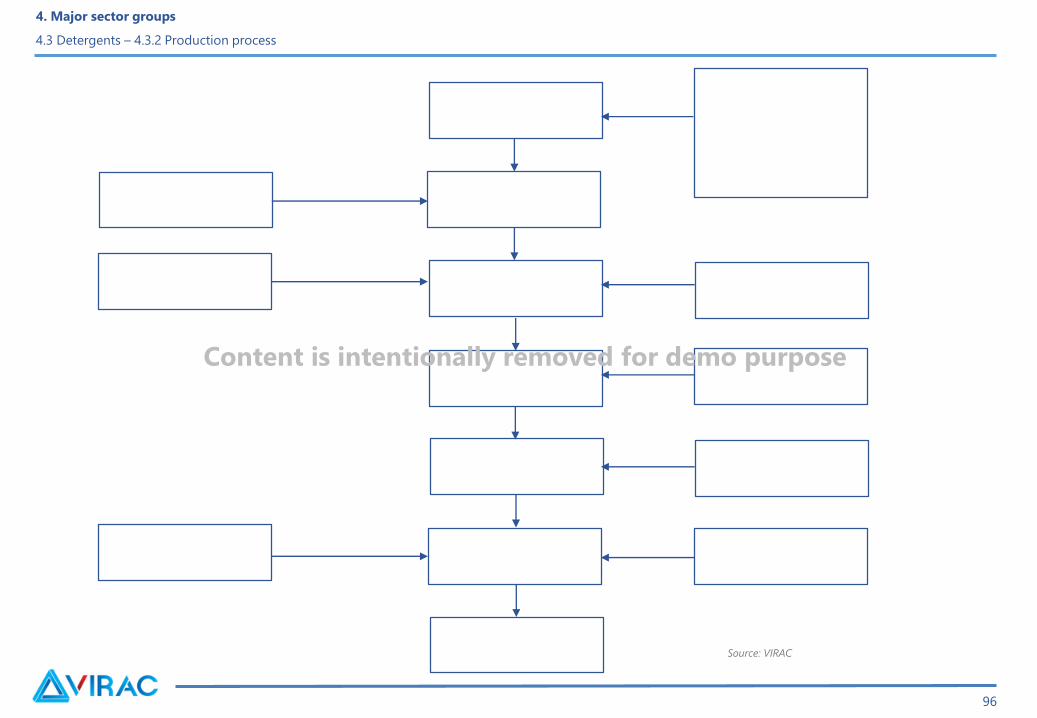
Source: VIRAC
4. Major sector groups
4.3 Detergents – 4.3.2 Production process
96
Content is intentionally removed for demo purpose

4. Major sector groups
4.3 Detergents – 4.3.3 Raw materials
97
Content is intentionally removed for demo purpose
4. Major sector groups
4.3 Detergents – 4.3.4 Production technology
98
Content is intentionally removed for demo purpose
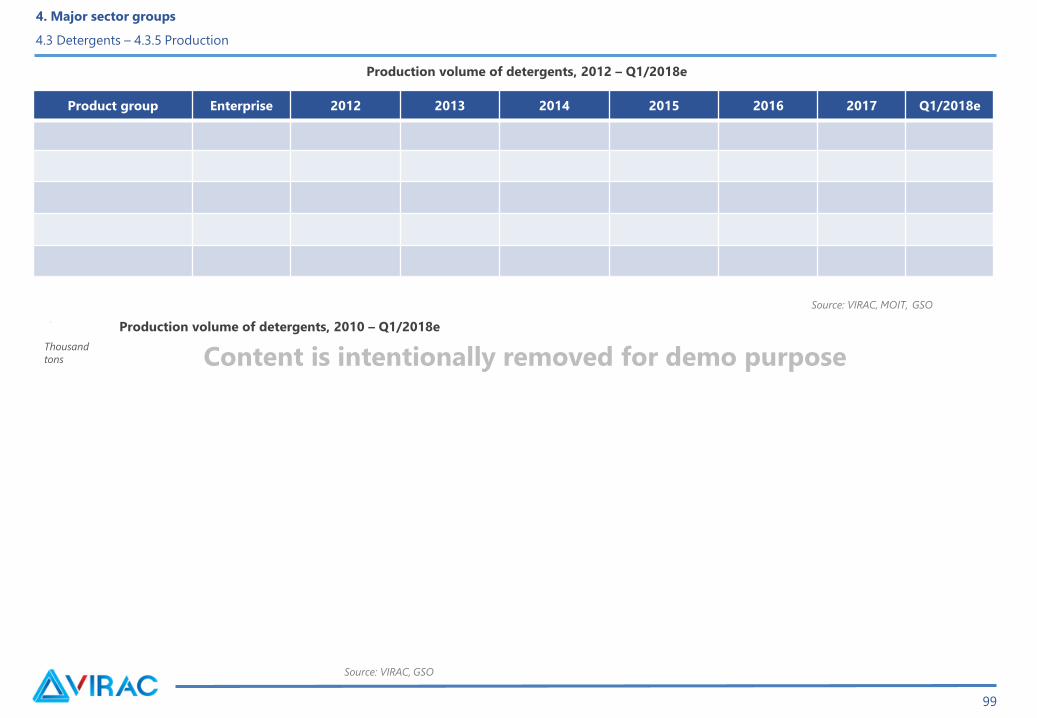
Source: VIRAC, MOIT, GSO
4. Major sector groups
4.3 Detergents – 4.3.5 Production
Product group Enterprise 2012 2013 2014 2015 2016 2017 Q1/2018e
Source: VIRAC, GSO
Thousand
tons
99
Production volume of detergents, 2012 – Q1/2018e
Production volume of detergents, 2010 – Q1/2018e
Content is intentionally removed for demo purpose
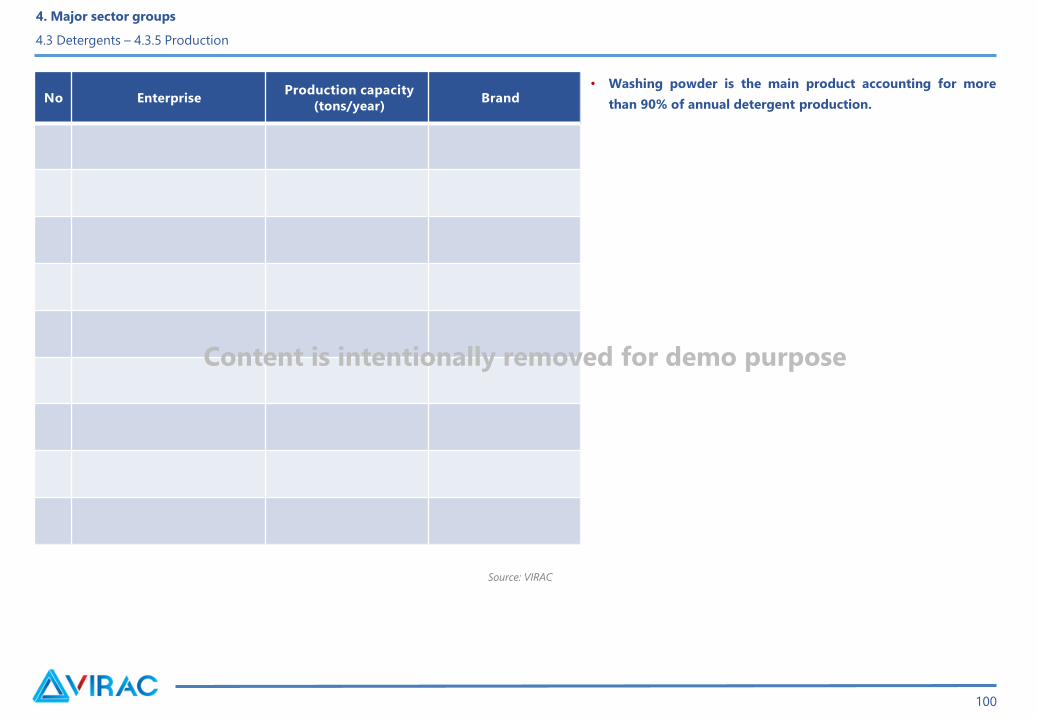
Source: VIRAC
No EnterpriseProduction capacity
(tons/year)Brand
• Washing powder is the main product accounting for more
than 90% of annual detergent production.
4. Major sector groups
4.3 Detergents – 4.3.5 Production
100
Content is intentionally removed for demo purpose
Source: VIRAC, GSO
4. Major sector groups
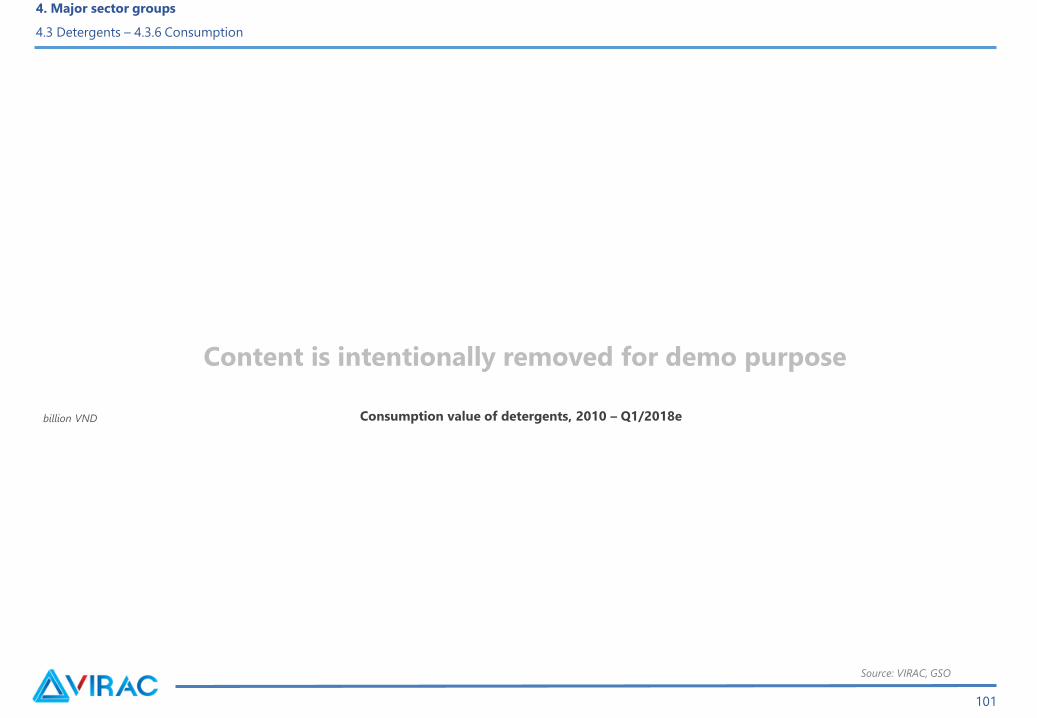
4.3 Detergents – 4.3.6 Consumption
billion VND
101
Consumption value of detergents, 2010 – Q1/2018e
Content is intentionally removed for demo purpose

Company
Total
investment
(Million USD)
Unilever'
s capital
contribut
ionLocation Business area
Source: VIRAC
4. Major sector groups
4.3 Detergents – 4.3.7 Competitive Analysis (P&G and Unilever)
102
Companies in Unilever Vietnam
Content is intentionally removed for demo purpose

Brands of Unilever in Vietnam
4. Major sector groups
4.3 Detergents – 4.3.7 Competitive Analysis (P&G and Unilever)
103
Content is intentionally removed for demo purpose

4. Major sector groups
4.3 Detergents – 4.3.7 Competitive Analysis (P&G and Unilever)
104
Content is intentionally removed for demo purpose
Comparison between P&G and Unilever
4. Major sector groups
4.3 Detergents – 4.3.7 Competitive Analysis (P&G and Unilever)
105
Content is intentionally removed for demo purpose
Source: VIRAC, GDVC
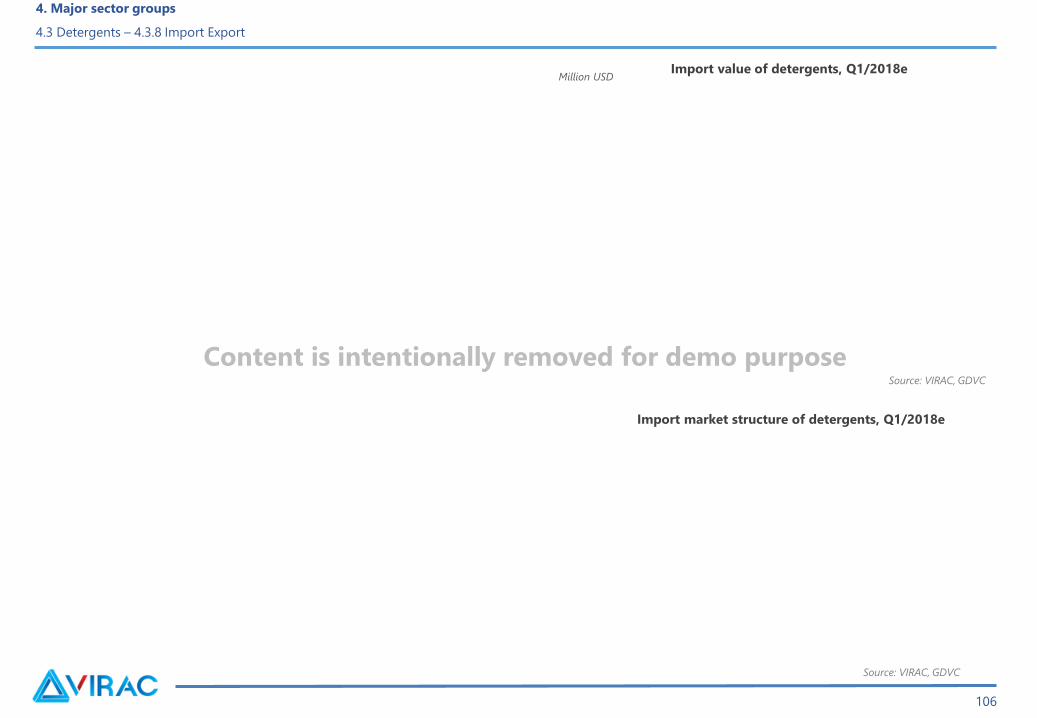
4. Major sector groups
4.3 Detergents – 4.3.8 Import Export
Source: VIRAC, GDVC
106
Million USDImport value of detergents, Q1/2018e
Import market structure of detergents, Q1/2018e
Content is intentionally removed for demo purpose
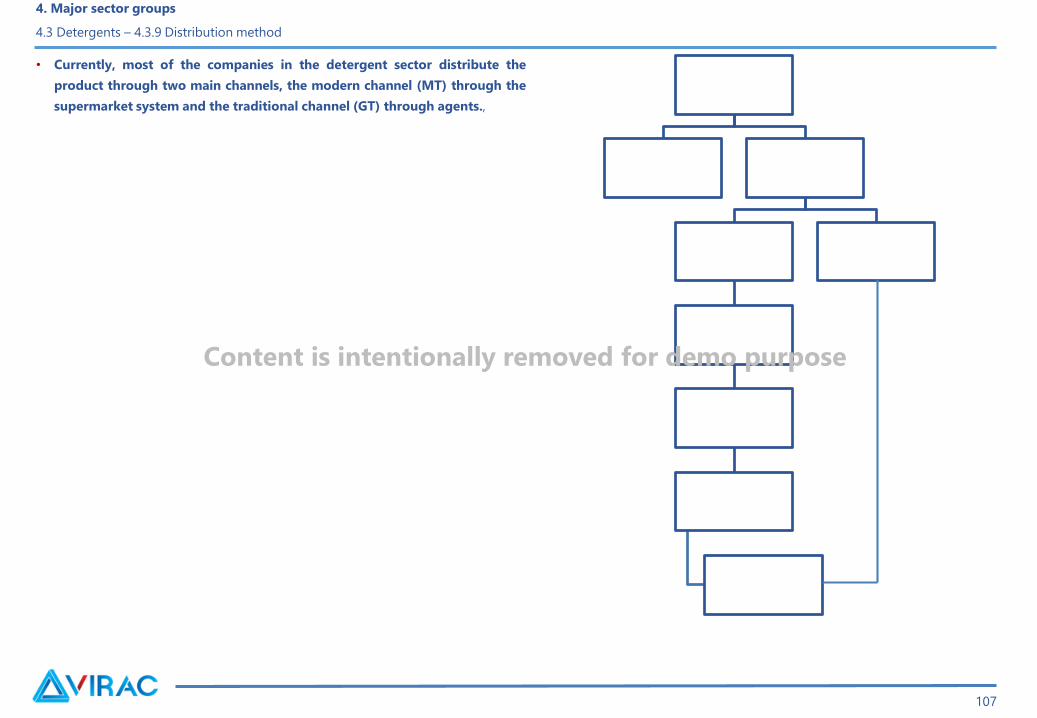
• Currently, most of the companies in the detergent sector distribute the
product through two main channels, the modern channel (MT) through the
supermarket system and the traditional channel (GT) through agents.,
4. Major sector groups
4.3 Detergents – 4.3.9 Distribution method
107
Content is intentionally removed for demo purpose

MỤC LỤC
4. Major sector groups
4.1 Fertilizers and nitrogen compounds
4.2 Synthetic rubber and raw plastic resins
4.3 Detergents
4.4 Paint and printing ink
4.5 Plant protection products
4.6 Basic chemicals
4.7 Synthetic fiber
108
Definition and classification
Classification
4. Major sector groups
4.4 Paint and printing ink – 4.4.1 Definition and classification
109
Content is intentionally removed for demo purpose
4. Major sector groups
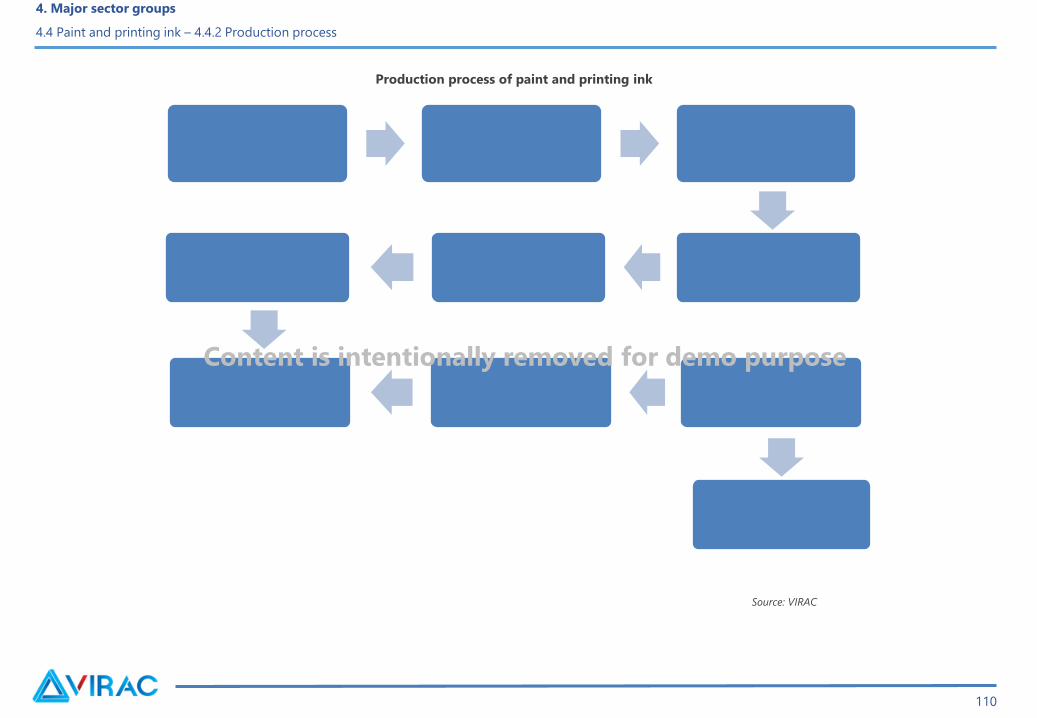
4.4 Paint and printing ink – 4.4.2 Production process
110
Production process of paint and printing ink
Source: VIRAC
Content is intentionally removed for demo purpose

Raw materials for paint production
Main materials for printing ink production include pigments, adhesives, solvents and additives.
4. Major sector groups
4.4 Paint and printing ink – 4.4.3 Raw materials
111
Content is intentionally removed for demo purpose
Source: VIRAC, GSO
Company name Production capacity Brand
Source: VIRAC
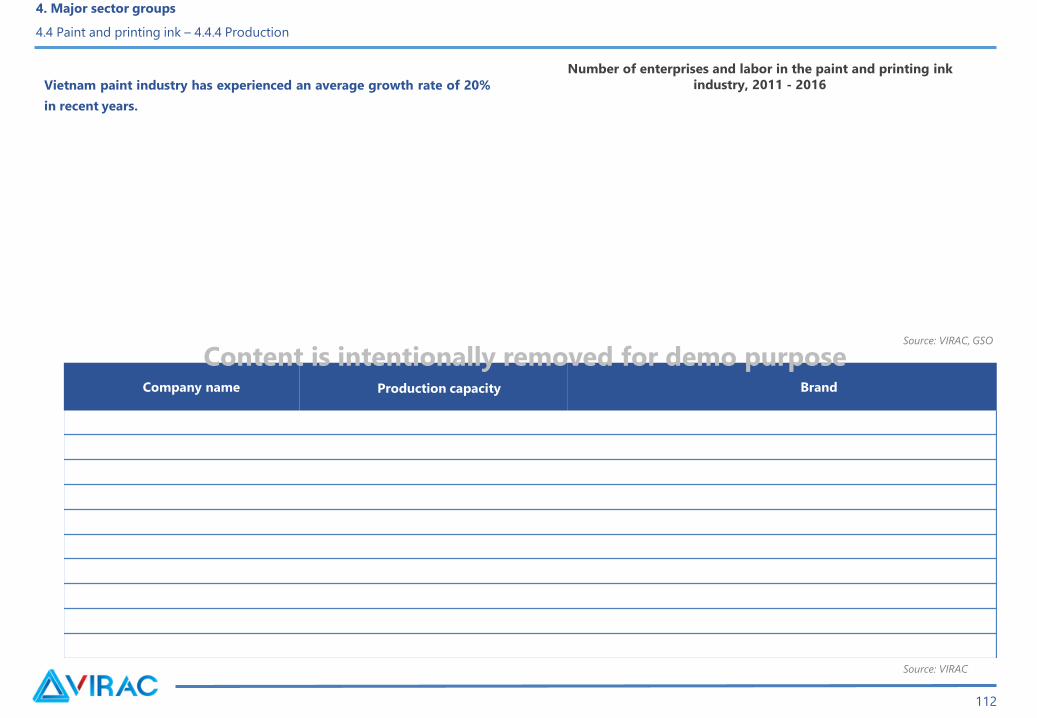
Vietnam paint industry has experienced an average growth rate of 20%
in recent years.
4. Major sector groups
4.4 Paint and printing ink – 4.4.4 Production
112
Number of enterprises and labor in the paint and printing ink
industry, 2011 - 2016
Content is intentionally removed for demo purpose
Source: VIRAC, GSO
4. Major sector groups
4.4 Paint and printing ink – 4.4.4 Production
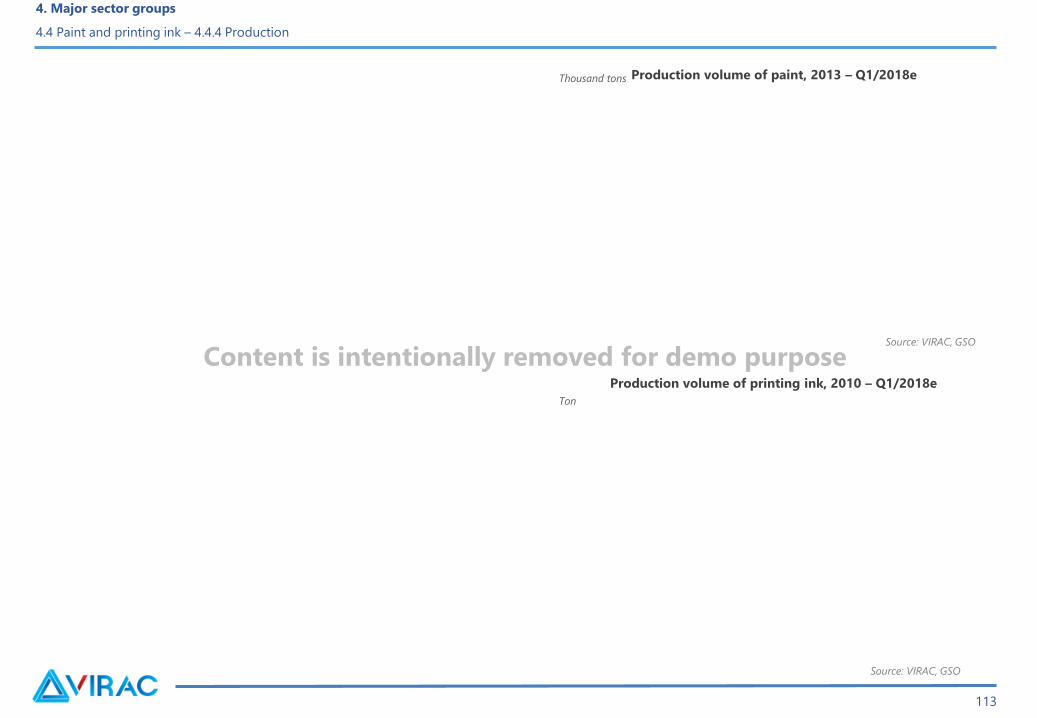
Thousand tons
Ton
Source: VIRAC, GSO
113
Production volume of paint, 2013 – Q1/2018e
Production volume of printing ink, 2010 – Q1/2018e
Content is intentionally removed for demo purpose
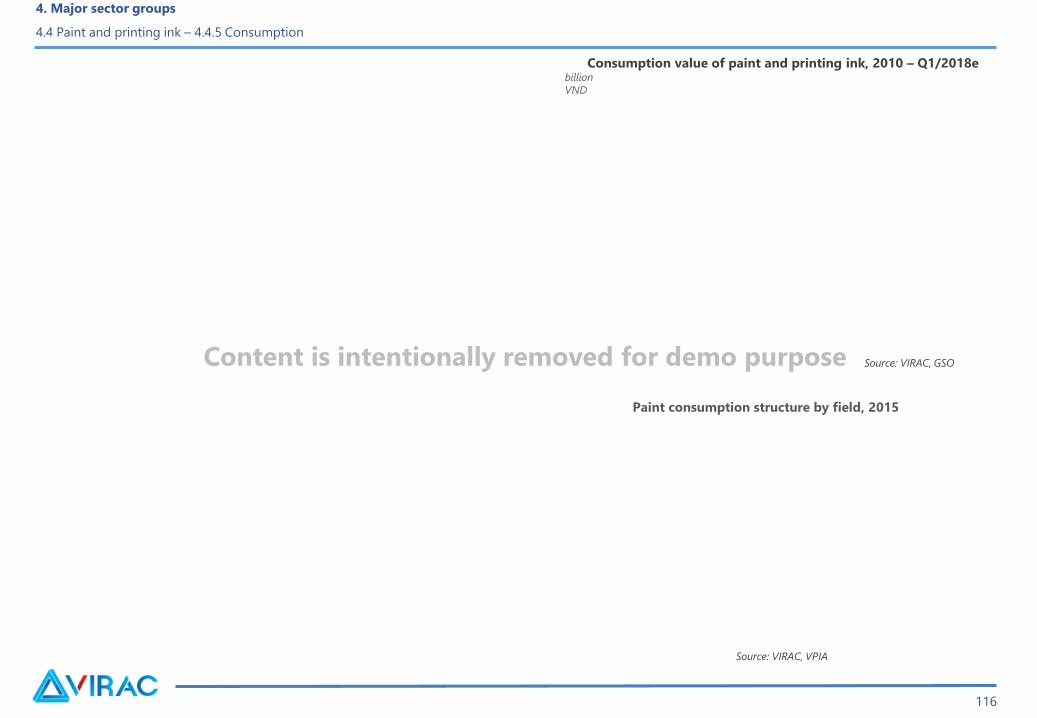
Source: VIRAC, VPIA
4. Major sector groups
4.4 Paint and printing ink – 4.4.5 Consumption
billion
VND
Source: VIRAC, GSO
116
Paint consumption structure by field, 2015
Consumption value of paint and printing ink, 2010 – Q1/2018e
Content is intentionally removed for demo purpose
4. Major sector groups
4.4 Paint and printing ink – 4.4.6 Competitive analysis in the industry
117
Content is intentionally removed for demo purpose
Vietnam Paint market in 2017
4. Major sector groups
4.4 Paint and printing ink – 4.4.6 Competitive analysis in the industry
117
Content is intentionally removed for demo purpose
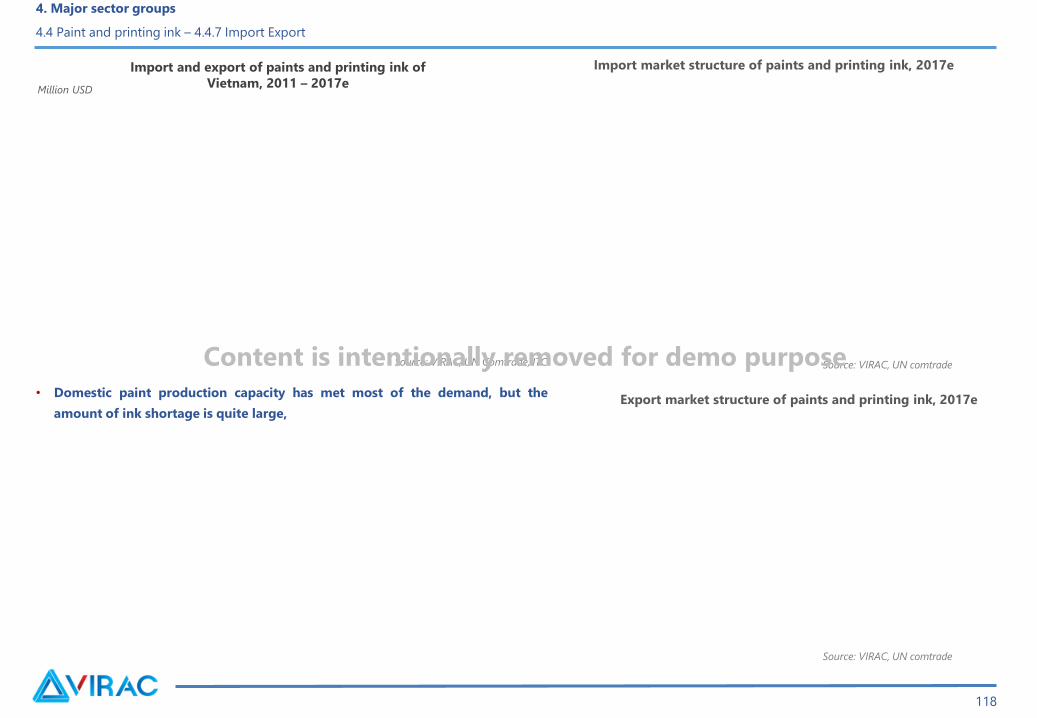
• Domestic paint production capacity has met most of the demand, but the
amount of ink shortage is quite large,
Source: VIRAC, UN comtrade
4. Major sector groups
4.4 Paint and printing ink – 4.4.7 Import Export
Source: VIRAC, UN Comtrade, ITC
Million USD
118
Source: VIRAC, UN comtrade
Export market structure of paints and printing ink, 2017e
Import and export of paints and printing ink of
Vietnam, 2011 – 2017e
Import market structure of paints and printing ink, 2017e
Content is intentionally removed for demo purpose
TABLE OF CONTENTS
4. Major sector groups
4.1 Fertilizers and nitrogen compounds
4.2 Synthetic rubber and raw plastic resins
4.3 Detergents
4.4 Paint and printing ink
4.5 Plant protection products
4.6 Basic chemicals
4.7 Synthetic fiber
119
Plant protection products (PPPs)
Classification:
Effect of PPPs
4. Major sector groups
4.5 Plant protection products – 4.5.1 Definition and classification
120
Content is intentionally removed for demo purpose

Source: VIRAC
4. Major sector groups
4.5 Plant protection products – 4.5.2 Production process
Source: VIRAC
121
Content is intentionally removed for demo purpose
Input materials
4. Major sector groups
4.5 Plant protection products – 4.5.3 Raw materials
No Product group Main material
122
Content is intentionally removed for demo purpose

4. Major sector groups
4.5 Plant protection products – 4.5.4 Production
Source: VIRAC, GSO
Thousand
tons
Source: VIRAC, GSO
123
Number of enterprises and labor in the industry,
2011 - 2016
Production volume of pesticides, 2013 – Q1/2018e
Content is intentionally removed for demo purpose
Source: VIRAC, GSO
Source: VIRAC, Agromonitor
4. Major sector groups
4.5 Plant protection products – 4.5.4 Production
124
Structure of pesticide consumption, 2016e
Structure of pesticide production, Q1/2018e
Content is intentionally removed for demo purpose

Source: VIRAC
4. Major sector groups
4.5 Plant protection products – 4.5.5 Consumption
Source: VIRAC, GSO
125
billion VNDConsumption value of pesticides, 2012 – Q1/2018eMarket share of pesticides in Vietnam, 2016e
Content is intentionally removed for demo purpose

Source: VIRAC
4. Major sector groups
4.5 Plant protection products – 4.5.5 Consumption
Source: VIRAC
126
Consumption structure of pesticides by product group, Q1/2018eConsumption of pesticides by plant group, 2016
Content is intentionally removed for demo purpose

The level of investment in marketing and distribution plays a decisive role in creating
competitive advantage:
No Company name Branch Tier 1 agent
4. Major sector groups
4.5 Plant protection products – 4.5.6 Competitive analysis
Distribution channel size of some companies in the industry
127
Content is intentionally removed for demo purpose
Research and development play an important role in creating competitive advantage
Competitive situation in the industry
4. Major sector groups
4.5 Plant protection products – 4.5.6 Competitive analysis
128
Content is intentionally removed for demo purpose

4. Major sector groups
4.5 Plant protection products – 4.5.7 Import Export
Source: VIRAC, ITC
129
Million USD
Source: VIRAC, GDVC, ITC
Import and export of pesticides and raw materials,
2011 - 2017e
Export structure of export of pesticides by volume, 2017
Content is intentionally removed for demo purpose

4. Major sector groups
4.5 Plant protection products – 4.5.7 Import Export
Source: VIRAC, GDVC
130
Import market of pesticides and raw materials,
Q1/2018e
Content is intentionally removed for demo purpose
Million USD
Source: VIRAC, GDVC, ITC
Export value of pesticides in Vietnam to some countries,
2011 - 2016

4. Major sector groups
4.5 Plant protection products – 4.5.8 Payment and shipping method
131
Content is intentionally removed for demo purpose
TABLE OF CONTENTS
4. Major sector groups
4.1 Fertilizers and nitrogen compounds
4.2 Synthetic rubber and raw plastic resins
4.3 Detergents
4.4 Paint and printing ink
4.5 Plant protection products
4.6 Basic chemicals
4.7 Synthetic fiber
132

133
Basic chemicals are divided into two main branches which are inorganic and organic.
4. Major sector groups
4.6 Basic chemicals – 4.6.1 Definition and classification
Content is intentionally removed for demo purpose
Source: VIRAC
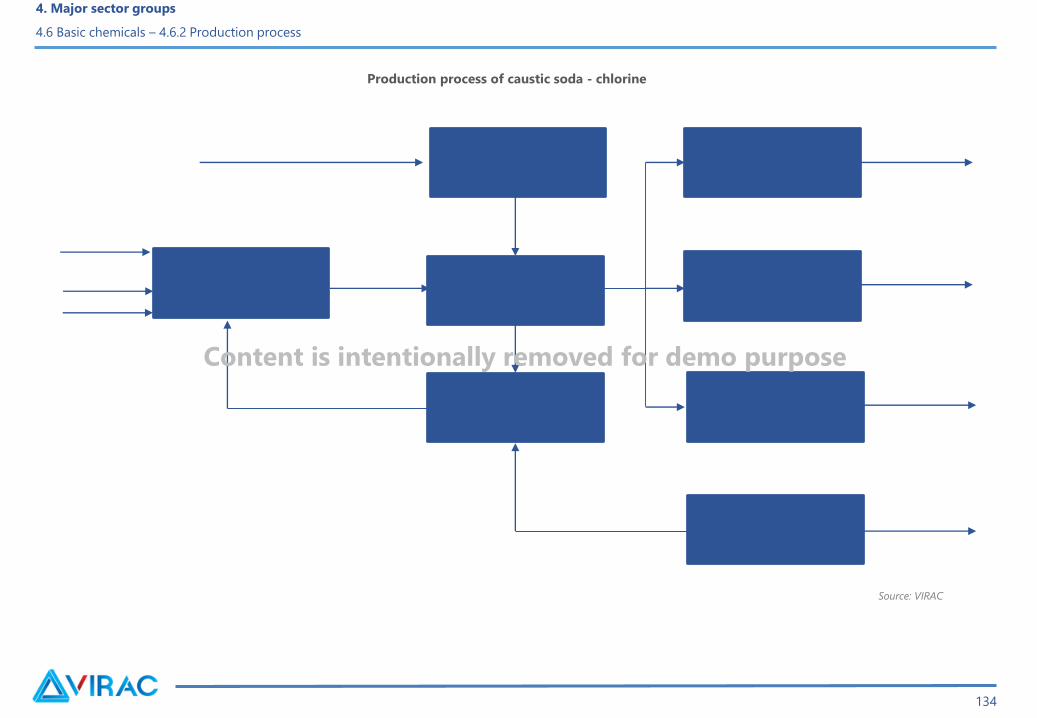
4. Major sector groups
4.6 Basic chemicals – 4.6.2 Production process
Production process of caustic soda - chlorine
134
Content is intentionally removed for demo purpose

Input materials
Sulfur price fluctuations, 9/2014 – 2/2017
4. Major sector groups
4.6 Basic chemicals – 4.6.3 Raw materials
135
Source: VIRAC, ICIS
Content is intentionally removed for demo purpose
Source: VIRAC
Fluctuation of raw material prices
4. Major sector groups
4.6 Basic chemicals – 4.6.3 Raw materials
136
Average electricity price, 7/2007 – 3/2018
Content is intentionally removed for demo purpose
4. Major sector groups
4.6 Basic chemicals – 4.6.4 Production technology
137
Content is intentionally removed for demo purpose
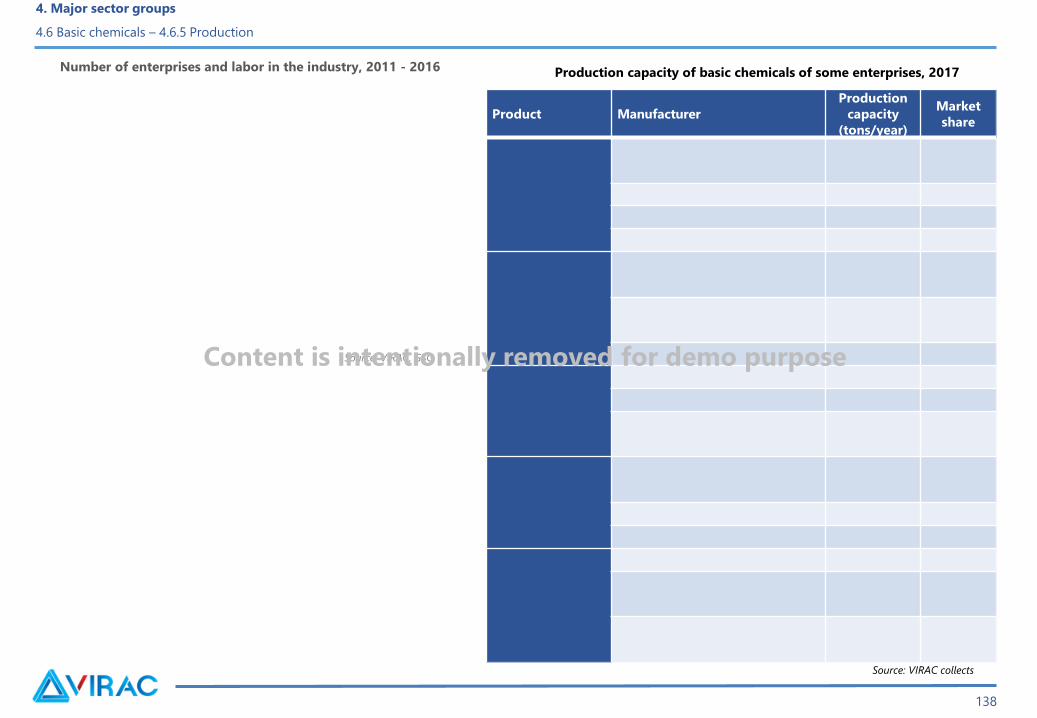
Product Manufacturer
Production
capacity
(tons/year)
Market
share
Source: VIRAC, GSO
4. Major sector groups
4.6 Basic chemicals – 4.6.5 Production
138
Number of enterprises and labor in the industry, 2011 - 2016
Content is intentionally removed for demo purpose
Production capacity of basic chemicals of some enterprises, 2017
Source: VIRAC collects
Source: VIRAC, GSO
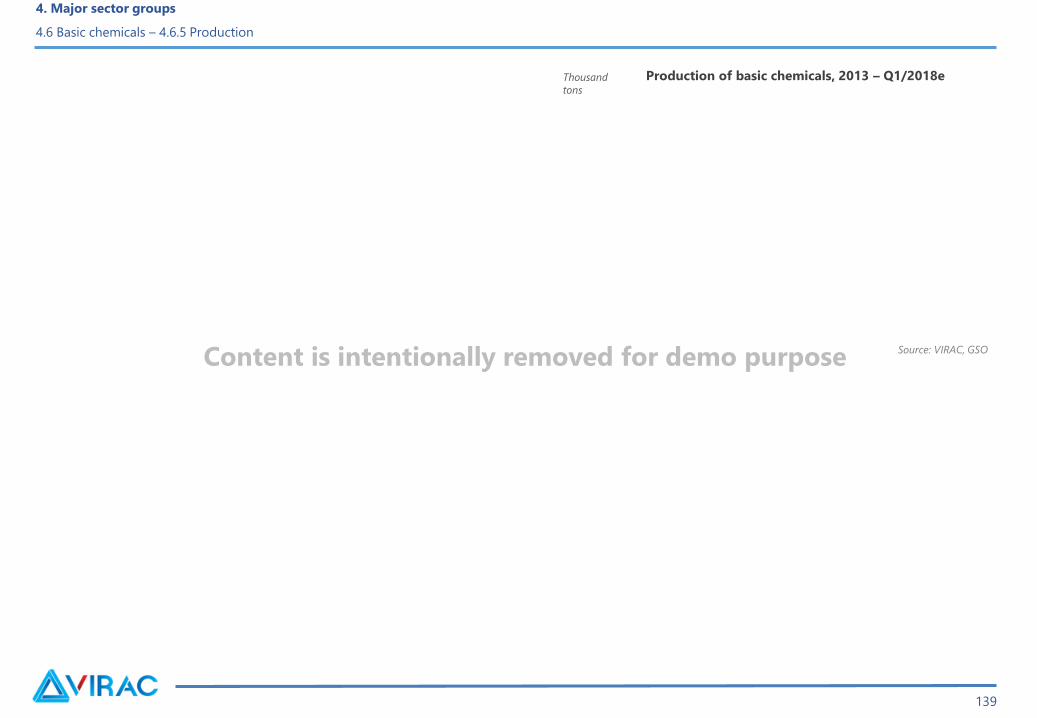
4. Major sector groups
4.6 Basic chemicals – 4.6.5 Production
Thousand
tons
139
Production of basic chemicals, 2013 – Q1/2018e
Content is intentionally removed for demo purpose

billion VND
4. Major sector groups
4.6 Basic chemicals – 4.6.6 Consumption
Source: VIRAC, GSO
140
Comsumption value of basic chemicals, 2011 – Q1/2018e
Content is intentionally removed for demo purposeImpact of chlorine products
Impact of soda products
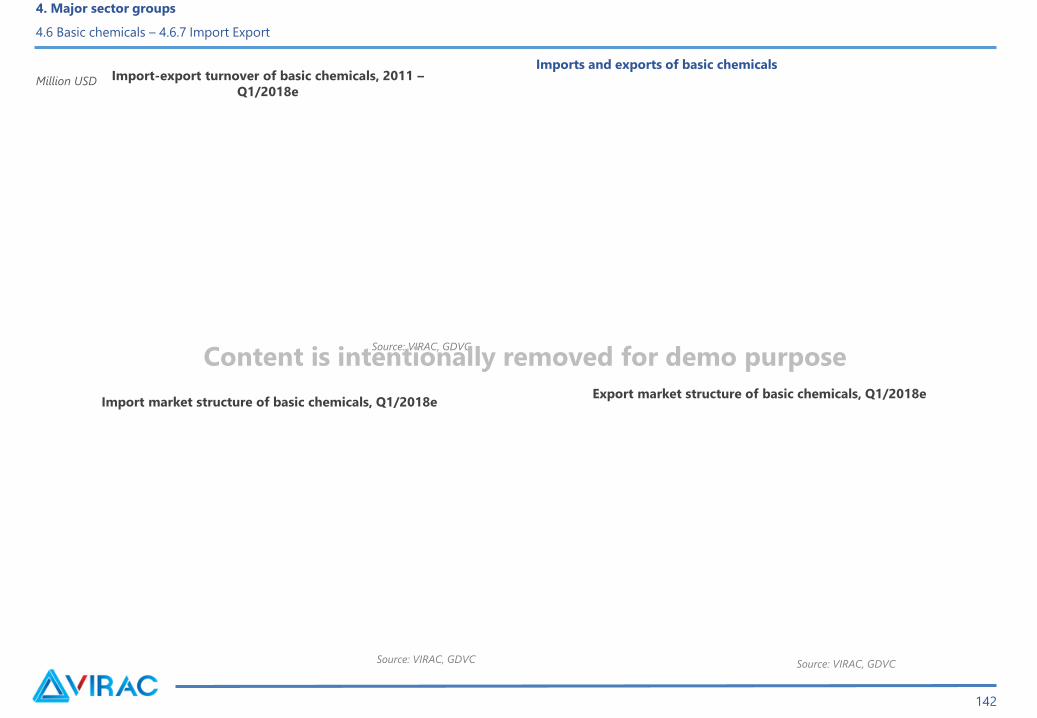
Million USD
4. Major sector groups
4.6 Basic chemicals – 4.6.7 Import Export
Source: VIRAC, GDVC
142
Source: VIRAC, GDVC
Source: VIRAC, GDVC
Import-export turnover of basic chemicals, 2011 –
Q1/2018e
Import market structure of basic chemicals, Q1/2018eExport market structure of basic chemicals, Q1/2018e
Content is intentionally removed for demo purpose
Imports and exports of basic chemicals

TABLE OF CONTENTS
4. Major sector groups
4.1 Fertilizers and nitrogen compounds
4.2 Synthetic rubber and raw plastic resins
4.3 Detergents
4.4 Paint and printing ink
4.5 Plant protection products
4.6 Basic chemicals
4.7 Synthetic fiber
143

• Synthetic fiber
4. Major sector groups
4.7 Synthetic fiber – 4.7.1 Definition and classification
144
Content is intentionally removed for demo purpose
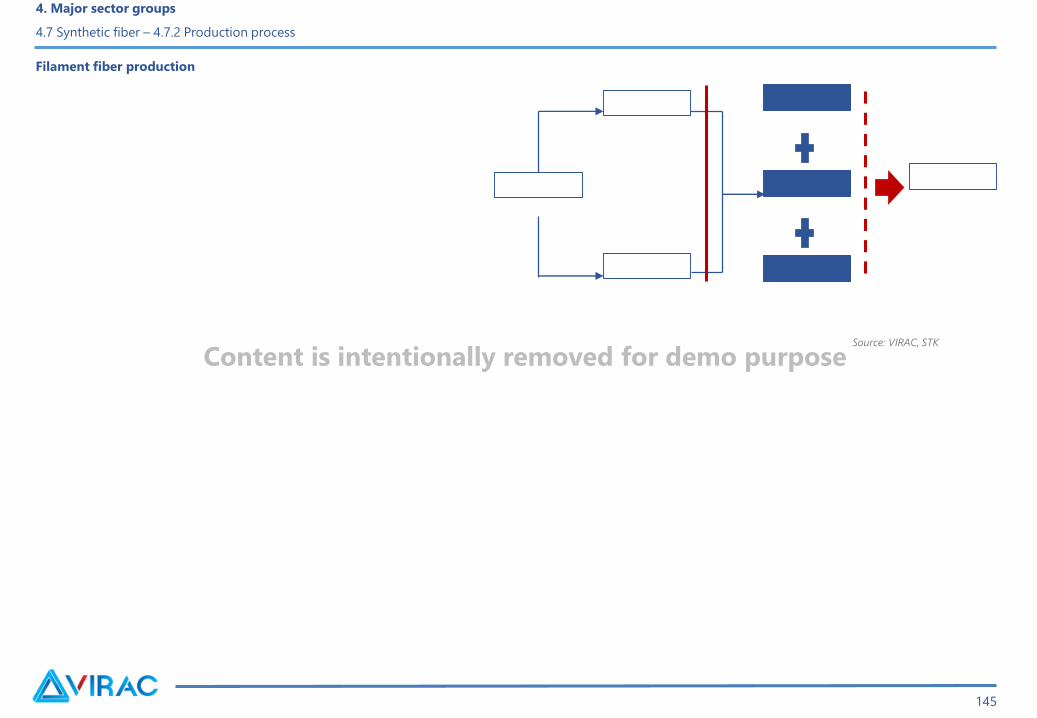
Source: VIRAC, STK
Filament fiber production
4. Major sector groups
4.7 Synthetic fiber – 4.7.2 Production process
145
Content is intentionally removed for demo purpose
4. Major sector groups
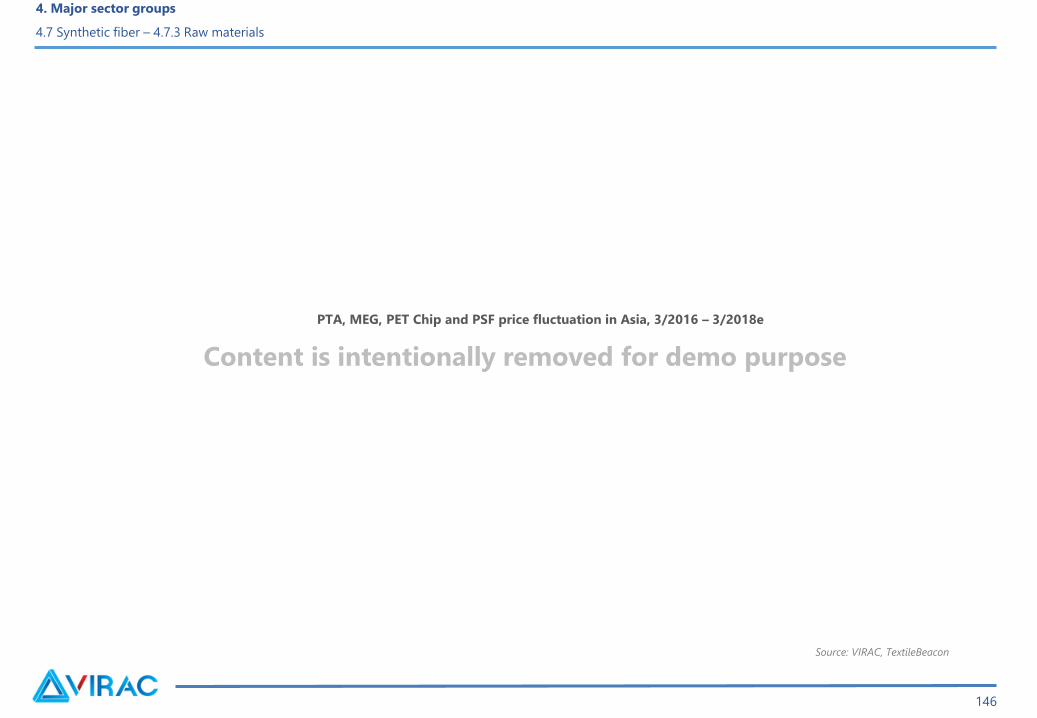
4.7 Synthetic fiber – 4.7.3 Raw materials
146
PTA, MEG, PET Chip and PSF price fluctuation in Asia, 3/2016 – 3/2018e
Content is intentionally removed for demo purpose
Source: VIRAC, TextileBeacon
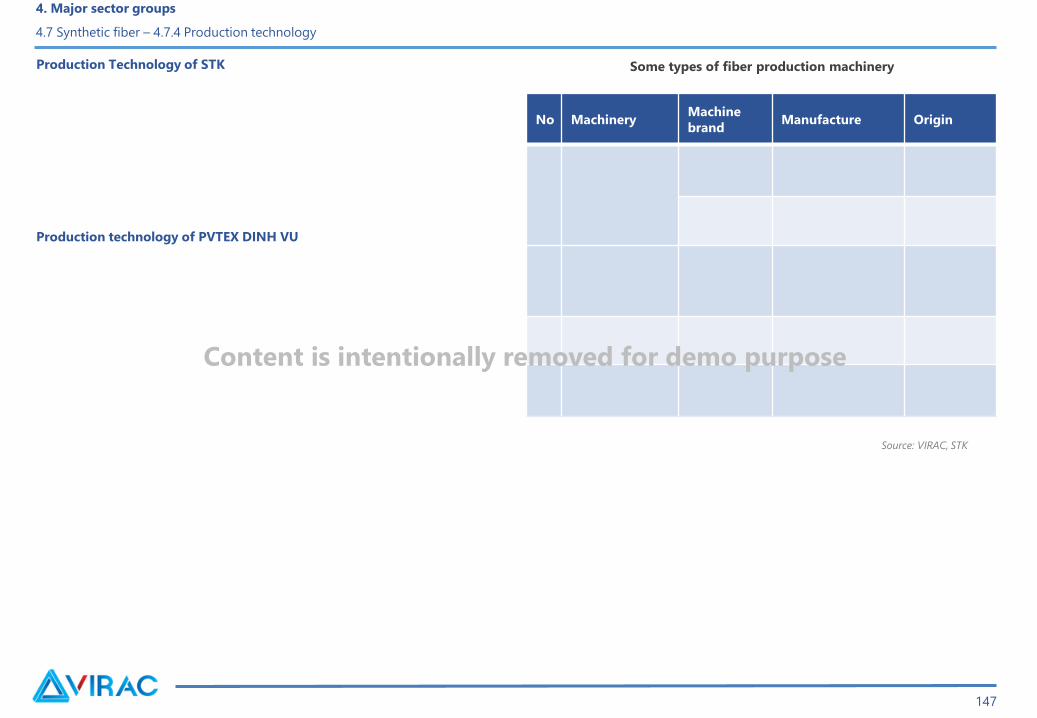
Production Technology of STK
Production technology of PVTEX DINH VU
No MachineryMachine
brandManufacture Origin
Source: VIRAC, STK
4. Major sector groups
4.7 Synthetic fiber – 4.7.4 Production technology
147
Some types of fiber production machinery
Content is intentionally removed for demo purpose
4. Major sector groups
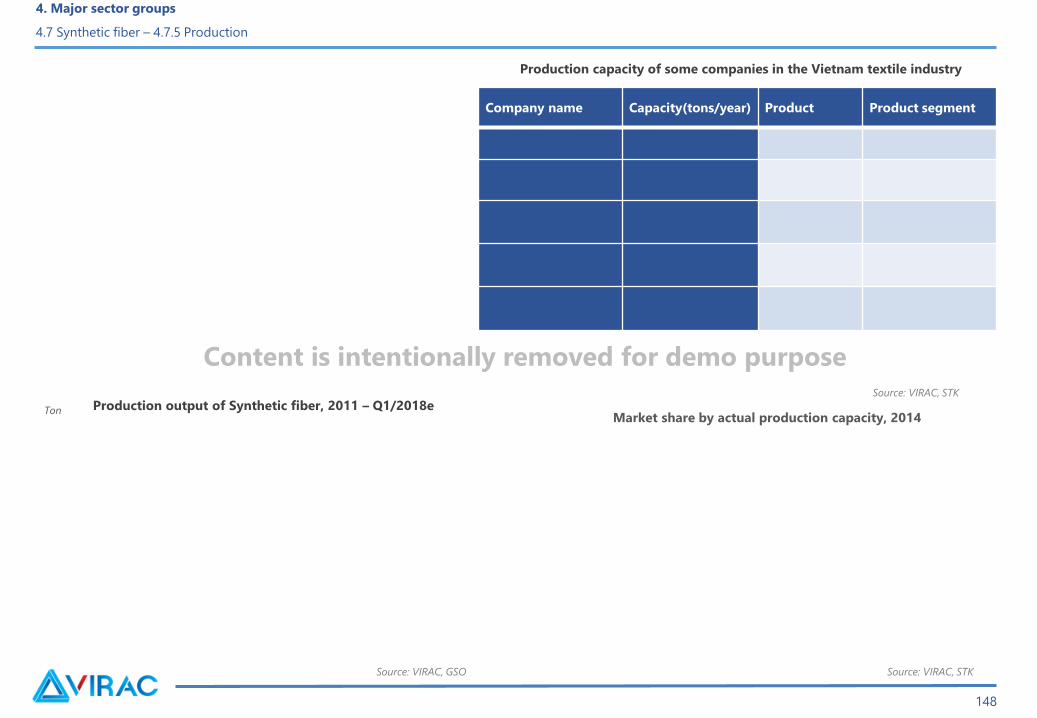
4.7 Synthetic fiber – 4.7.5 Production
Company name Capacity(tons/year) Product Product segment
Ton
Source: VIRAC, GSO Source: VIRAC, STK
Source: VIRAC, STK
148
Production capacity of some companies in the Vietnam textile industry
Market share by actual production capacity, 2014Production output of Synthetic fiber, 2011 – Q1/2018e
Content is intentionally removed for demo purpose
Source: VIRAC, GSO
4. Major sector groups
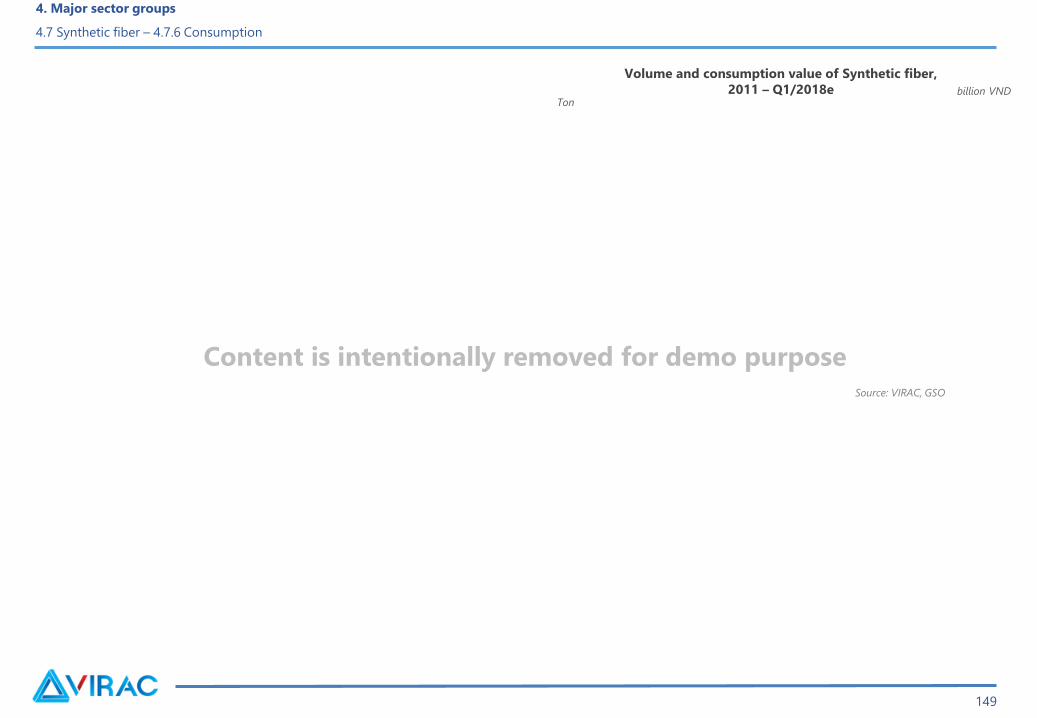
4.7 Synthetic fiber – 4.7.6 Consumption
Tonbillion VND
149
Volume and consumption value of Synthetic fiber,
2011 – Q1/2018e
Content is intentionally removed for demo purpose

4. Major sector groups
4.7 Synthetic fiber – 4.7.7 Import Export
Source: VIRAC, STK
Source: VIRAC, GDVC
Million
USD
150
Market share by export value, 2015eImport-export turnover of Synthetic fiber, 2009 – 2017e
Content is intentionally removed for demo purpose

Source: VIRAC, UN Comtrade Source: VIRAC, UN Comtrade
4. Major sector groups
4.7 Synthetic fiber – 4.7.7 Import Export
151
Export market structure of Synthetic fiber, 2017eImport market structure of Synthetic fiber, 2017e
Content is intentionally removed for demo purpose

Sale and payment methods
4. Major sector groups
4.7 Synthetic fiber – 4.7.8 Payment and shipping method
152
Content is intentionally removed for demo purpose
Part V. Industry risk
TABLE OF CONTENTS
153
Risk of policy and law
Risk of exchange rate and interest rate.
5. Industry risk
154
Content is intentionally removed for demo purpose
Risk of environmental pollution
Risk of input material price
Risks in the process of transporting, storing and preserving chemical products and risks of labor safety due to the dangerous and harmful nature of these
products..
5. Industry risk
155
Content is intentionally removed for demo purpose
Risk of economic integration
Economic risk
Competitive risk
Financial risk
Risk of supply and demand
5. Industry risk
156
Content is intentionally removed for demo purpose

Risk of technology
Industry risk
5. Industry risk
157
Content is intentionally removed for demo purpose

Part VI. Outlooks and forecasts
1. Development planning for the chemical industry
2. Development planning for the printing and ink industry
3. Development planning for the plastics industry
4. Outlooks of world chemical industry
5. Outlooks of Vietnam chemical industry
TABLE OF CONTENTS
158
155
According to Decision No. 1621 / QD-TTg of the Prime Minister promulgated on September 18, 2013 approving the development plan of chemical industry
of Vietnam to 2020, by 2030.
6. Outlooks and forecasts
6.1 Development planning for the chemical industry
Content is intentionally removed for demo purpose
156
6. Outlooks and forecasts
6.1 Development planning for the chemical industry
Content is intentionally removed for demo purpose

157
6. Outlooks and forecasts
6.1 Development planning for the chemical industry
Content is intentionally removed for demo purpose
MOIT issued Decision No. 8989 / QD-BCT dated 25/08/2015 approving the restructuring plan of Vietnam chemical industry, 10 areas of restructuring in the
chemical industry include fertilizer, petrochemicals, plant protection chemicals, basic chemicals, chemical electricity, industrial gas, rubber, detergents, paint
- printing ink.
6. Outlooks and forecasts
6.1 Development planning for the chemical industry
162
Content is intentionally removed for demo purpose

No Project Location
Investment information
Capacity
(Thousand
tons/year)
Investment
capital(Million
USD)
Investment
time
Source: VIRAC
6. Outlooks and forecasts
6.1 Development planning for the chemical industry
163
Content is intentionally removed for demo purpose

No Project Location
Investment information
Capacity(Thousand tons/year)
Investment
capital(Mill
ion USD)
Investmen
t time
Source: VIRAC
6. Outlooks and forecasts
6.1 Development planning for the chemical industry
164
Content is intentionally removed for demo purpose

TABLE OF CONTENTS
Part VI. Outlooks and forecasts
1. Development planning for the chemical industry
2. Development planning for the printing and ink industry
3. Development planning for the plastics industry
4. Outlooks of world chemical industry
5. Outlooks of Vietnam chemical industry
165

TT Project Location Unit CapacityInvestment
time
6. Outlooks and forecasts
6.2 Development planning for the printing and ink industry
166
Content is intentionally removed for demo purpose
TABLE OF CONTENTS
Part VI. Outlooks and forecasts
1. Development planning for the chemical industry
2. Development planning for the printing and ink industry
3. Development planning for the plastics industry
4. Outlooks of world chemical industry
5. Outlooks of Vietnam chemical industry
167
168
According to Decision No. 1621 / QD-TTg of the Prime Minister promulgated on September 18, 2013 approving the development plan of chemical industry
of Vietnam to 2020, by 2030,
6. Outlooks and forecasts
6.3 Development planning for the plastics industry
Content is intentionally removed for demo purpose
165
Sources: VIRAC, MOIT
No. Projects Location
Investment information
Capacity(1.000
tons/year)
Investment capital
(million USD)Investment time
Refining and petrochemical projects, 2011 - 2020
6. Outlooks and forecasts
6.3 Development planning for the plastics industry
Content is intentionally removed for demo purpose
TABLE OF CONTENTS
Part VI. Outlooks and forecasts
1. Development planning for the chemical industry
2. Development planning for the printing and ink industry
3. Development planning for the plastics industry
4. Outlooks of world chemical industry
5. Outlooks of Vietnam chemical industry
169

European chemical industry: Low oil prices help reduce difficulties
Asian chemical industry: Supply exceeds demand and grows slowly
6. Outlooks and forecasts
6.4 Outlooks of world chemical industry
170
Content is intentionally removed for demo purpose

Middle East Chemical Industry: Increase in competition pressure
Latin American chemical industry: Recovering from economic growth
6. Outlooks and forecasts
6.4 Outlooks of world chemical industry
171
Content is intentionally removed for demo purpose
Increasing competition requires dynamic response
Cooperative relations with customers
Frequently meet the ever-changing legal regulations
6. Outlooks and forecasts
6.4 Outlooks of world chemical industry
172
Content is intentionally removed for demo purpose
Data processing is continuously updated in real time
Prepare for changes in distribution channels
6. Outlooks and forecasts
6.4 Outlooks of world chemical industry
173
Content is intentionally removed for demo purpose

TABLE OF CONTENTS
Part VI. Outlooks and forecasts
1. Development planning for the chemical industry
2. Development planning for the printing and ink industry
3. Development planning for the plastics industry
4. Outlooks of world chemical industry
5. Outlooks of Vietnam chemical industry
174

• For fertilizer group:
• For petrochemical group (synthetic rubber and raw plastic resins)
• For detergent group:
• For paint and printing ink group
6. Outlooks and forecasts
6.5 Outlooks of Vietnam chemical industry
175
Content is intentionally removed for demo purpose
• Pesticides:
• Basic chemicals:
• Synthetic fiber:
176
6. Outlooks and forecasts
6.5 Outlooks of Vietnam chemical industry

Part VII. Business Analysis
1. Enterprise introduction
2. Business Analysis
TABLE OF CONTENTS
177

Company name Address
Net revenue
2017(billion
VND)
Total assets
(billion VND)
Charter
capital
(billion
VND)
CountryCustomer
segmentationBusiness area
7. Business Analysis
7.1 Enterprise introduction
178
Content is intentionally removed for demo purpose
7. Business Analysis
7.1 Enterprise introduction
PetroVietnam Camau Fertilizer Joint Stock Company
179
Content is intentionally removed for demo purpose

PetroVietnam Fertilizer and Chemicals Corporation
7. Business Analysis
7.1 Enterprise introduction
180
Content is intentionally removed for demo purpose

7. Business Analysis
7.1 Enterprise introduction
Lam Thao Fertilizers & Chemicals Joint Stock Company
181
Content is intentionally removed for demo purpose
Binh Dien Fertilizer Joint Stock Company
7. Business Analysis
7.1 Enterprise introduction
182
Content is intentionally removed for demo purpose
7. Business Analysis
7.1 Enterprise introduction
Southern Basic Chemicals JSC
183
Content is intentionally removed for demo purpose

LIX Detergent Joint Stock Company
7. Business Analysis
7.1 Enterprise introduction
184
Content is intentionally removed for demo purpose

7. Business Analysis
7.1 Enterprise introduction
Duc Giang Detergent and Detergent Joint Stock Company
185
Content is intentionally removed for demo purpose

7. Business Analysis
7.1 Enterprise introduction
Saigon Plant Protection Joint Stock Company
186
Content is intentionally removed for demo purpose
Dry Cell And Storage Battery Joint Stock Company
7. Business Analysis
7.1 Enterprise introduction
187
Content is intentionally removed for demo purpose

Part VII. Business Analysis
1. Enterprise introduction
2. Business Analysis
TABLE OF CONTENTS
188

-
7. Business Analysis
7.2 Financial analysis
billion VND
189
Source: VIRAC
Net revenue, 2016 - 2017
Content is intentionally removed for demo purpose

-
7. Business Analysis
7.2 Financial analysis
billion VND
189
Source: VIRAC
Gross profit margin, 2016 - 2017
Content is intentionally removed for demo purpose
Cost of sales
7. Business Analysis
7.2 Financial analysis
billion VND
190
Source: VIRAC
Cost of sales, 2016 - 2017
Content is intentionally removed for demo purpose

Enterprise cost management
7. Business Analysis
7.2 Financial analysis
billion VND
191
Source: VIRAC
Enterprise cost management, 2016 - 2017
Content is intentionally removed for demo purpose
7. Business Analysis
7.2 Financial analysis
193
Source: VIRAC
Source: VIRAC
Solvency, 2016 - 2017
Profit Ratio, 206 - 2017
Content is intentionally removed for demo purpose

7. Business Analysis
7.2 Financial analysis
194
Source: VIRAC
Payment ratio, 2016 - 2017
Content is intentionally removed for demo purpose

7. Business Analysis
7.2 Financial analysis
195
Source: VIRAC
Inventory turnover, 2016 - 2017Content is intentionally removed for demo purpose

Part VIII. Appendix of financial statements
TABLE OF CONTENTS
196
194
APPENDIX
PETROVIETNAM FERTILIZER AND CHEMICALS CORPORATION (DPM)
INCOME STATEMENTUnit: VND
BALANCE SHEETUnit: VND
CASH FLOW STATEMENTUnit: VND
Indicator 2016 2017
ASSETS
A. CURRENT ASSETS
I. Cash and cash equivalents
II. Short-term financial investments
III. Short-term receivables
IV. Inventories
V. OTHER CURRENT ASSETS
B - LONG TERM ASSETS
II. Fixed assets
III. Real estate investment
V. Long-term financial investments
TOTAL ASSETS
C - LIABILITIES
I. Current liabilities
II. Long-term liabilities
D - OWNER'S EQUITY
I. Investment capital of owners
II. Surplus equity
III. Retained earnings
IV. Minority interest
TOTAL LIABILITIES AND OWNER’S EQUITY
Indicator2016 2017
1. Net Revenue from Sales and services provided
2. Cost of goods sold
3. Gross Profit from sales and services provided
4. Financing income
5. Financial expenses
6. Sales expenses
7. Administrative expenses
8. Net profits from operating activities
9. Other profit
10. Profit / loss from joint venture companies
11. Gross profit before tax
12. Profit After Enterprise Income Tax
13. Profit after tax of shareholders of holding
company
Indicator 2016 2017
I. Net Cash Flow From Operating activities
II. Net Cash Flow From Investing activities
III. Net Cash Flow From Financial activities
Net Cash Flow during the fiscal period
Opening cash and cash equivalents
Impact of exchange rate changes in foreign currency
Closing cash and cash equivalents
Content is intentionally removed for demo purpose

195
APPENDIX
Binh Dien Fertilizer JSC (BFC) (BFC)
INCOME STATEMENTUnit: VND
BALANCE SHEETUnit: VND
CASH FLOW STATEMENTUnit: VND
Indicator 2016 2017
ASSETS
A. CURRENT ASSETS
I. Cash and cash equivalents
II. Short-term financial investments
III. Short-term receivables
IV. Inventories
V. OTHER CURRENT ASSETS
B - LONG TERM ASSETS
II. Fixed assets
III. Real estate investment
V. Long-term financial investments
TOTAL ASSETS
C - LIABILITIES
I. Current liabilities
II. Long-term liabilities
D - OWNER'S EQUITY
I. Investment capital of owners
II. Surplus equity
III. Retained earnings
IV. Minority interest
TOTAL LIABILITIES AND OWNER’S EQUITY
Indicator2016 2017
1. Net Revenue from Sales and services provided
2. Cost of goods sold
3. Gross Profit from sales and services provided
4. Financing income
5. Financial expenses
6. Sales expenses
7. Administrative expenses
8. Net profits from operating activities
9. Other profit
10. Profit / loss from joint venture companies
11. Gross profit before tax
12. Profit After Enterprise Income Tax
13. Profit after tax of shareholders of holding
company
Indicator 2016 2017
I. Net Cash Flow From Operating activities
II. Net Cash Flow From Investing activities
III. Net Cash Flow From Financial activities
Net Cash Flow during the fiscal period
Opening cash and cash equivalents
Impact of exchange rate changes in foreign currency
Closing cash and cash equivalents
Content is intentionally removed for demo purpose

196
APPENDIX
PetroVietNam CaMau Fertilizer Joint Stock Company (DCM)
INCOME STATEMENTUnit: VND
BALANCE SHEETUnit: VND
CASH FLOW STATEMENTUnit: VND
Indicator 2016 2017
ASSETS
A. CURRENT ASSETS
I. Cash and cash equivalents
II. Short-term financial investments
III. Short-term receivables
IV. Inventories
V. OTHER CURRENT ASSETS
B - LONG TERM ASSETS
II. Fixed assets
III. Real estate investment
V. Long-term financial investments
TOTAL ASSETS
C - LIABILITIES
I. Current liabilities
II. Long-term liabilities
D - OWNER'S EQUITY
I. Investment capital of owners
II. Surplus equity
III. Retained earnings
IV. Minority interest
TOTAL LIABILITIES AND OWNER’S EQUITY
Indicator2016 2017
1. Net Revenue from Sales and services provided
2. Cost of goods sold
3. Gross Profit from sales and services provided
4. Financing income
5. Financial expenses
6. Sales expenses
7. Administrative expenses
8. Net profits from operating activities
9. Other profit
10. Profit / loss from joint venture companies
11. Gross profit before tax
12. Profit After Enterprise Income Tax
13. Profit after tax of shareholders of holding
company
Indicator 2016 2017
I. Net Cash Flow From Operating activities
II. Net Cash Flow From Investing activities
III. Net Cash Flow From Financial activities
Net Cash Flow during the fiscal period
Opening cash and cash equivalents
Impact of exchange rate changes in foreign currency
Closing cash and cash equivalents
Content is intentionally removed for demo purpose

197
APPENDIX
Lamthao Fertilizers and Chemicals Joint Stock Company (LAS)
INCOME STATEMENTUnit: VND
BALANCE SHEETUnit: VND
CASH FLOW STATEMENTUnit: VND
Indicator 2016 2017
ASSETS
A. CURRENT ASSETS
I. Cash and cash equivalents
II. Short-term financial investments
III. Short-term receivables
IV. Inventories
V. OTHER CURRENT ASSETS
B - LONG TERM ASSETS
II. Fixed assets
III. Real estate investment
V. Long-term financial investments
TOTAL ASSETS
C - LIABILITIES
I. Current liabilities
II. Long-term liabilities
D - OWNER'S EQUITY
I. Investment capital of owners
II. Surplus equity
III. Retained earnings
IV. Minority interest
TOTAL LIABILITIES AND OWNER’S EQUITY
Indicator2016 2017
1. Net Revenue from Sales and services provided
2. Cost of goods sold
3. Gross Profit from sales and services provided
4. Financing income
5. Financial expenses
6. Sales expenses
7. Administrative expenses
8. Net profits from operating activities
9. Other profit
10. Profit / loss from joint venture companies
11. Gross profit before tax
12. Profit After Enterprise Income Tax
13. Profit after tax of shareholders of holding
company
Indicator 2016 2017
I. Net Cash Flow From Operating activities
II. Net Cash Flow From Investing activities
III. Net Cash Flow From Financial activities
Net Cash Flow during the fiscal period
Opening cash and cash equivalents
Impact of exchange rate changes in foreign currency
Closing cash and cash equivalents
Content is intentionally removed for demo purpose

198
APPENDIX
DUC GIANG DETERGENTS AND CHEMICALS JOINT STOCK COMPANY (DGC)
INCOME STATEMENTUnit: VND
BALANCE SHEETUnit: VND
CASH FLOW STATEMENTUnit: VND
Indicator 2016 2017
ASSETS
A. CURRENT ASSETS
I. Cash and cash equivalents
II. Short-term financial investments
III. Short-term receivables
IV. Inventories
V. OTHER CURRENT ASSETS
B - LONG TERM ASSETS
II. Fixed assets
III. Real estate investment
V. Long-term financial investments
TOTAL ASSETS
C - LIABILITIES
I. Current liabilities
II. Long-term liabilities
D - OWNER'S EQUITY
I. Investment capital of owners
II. Surplus equity
III. Retained earnings
IV. Minority interest
TOTAL LIABILITIES AND OWNER’S
EQUITY
Indicator2016 2017
1. Net Revenue from Sales and services provided
2. Cost of goods sold
3. Gross Profit from sales and services provided
4. Financing income
5. Financial expenses
6. Sales expenses
7. Administrative expenses
8. Net profits from operating activities
9. Other profit
10. Profit / loss from joint venture companies
11. Gross profit before tax
12. Profit After Enterprise Income Tax
13. Profit after tax of shareholders of holding
company
Indicator 2016 2017
I. Net Cash Flow From Operating activities
II. Net Cash Flow From Investing activities
III. Net Cash Flow From Financial activities
Lưu chuyển tiền thuần trong kỳ
Opening cash and cash equivalents
Impact of exchange rate changes in foreign currency
Closing cash and cash equivalents
Content is intentionally removed for demo purpose
199
APPENDIX
Dry Cell And Storage Battery Joint Stock Company (PAC)
INCOME STATEMENTUnit: VND
BALANCE SHEETUnit: VND
CASH FLOW STATEMENTUnit: VND
Indicator 2016 2017
ASSETS
A. CURRENT ASSETS
I. Cash and cash equivalents
II. Short-term financial investments
III. Short-term receivables
IV. Inventories
V. OTHER CURRENT ASSETS
B - LONG TERM ASSETS
II. Fixed assets
III. Real estate investment
V. Long-term financial investments
TOTAL ASSETS
C - LIABILITIES
I. Current liabilities
II. Long-term liabilities
D - OWNER'S EQUITY
I. Investment capital of owners
II. Surplus equity
III. Retained earnings
IV. Minority interest
TOTAL LIABILITIES AND OWNER’S
EQUITY
Indicator2016 2017
1. Net Revenue from Sales and services provided
2. Cost of goods sold
3. Gross Profit from sales and services provided
4. Financing income
5. Financial expenses
6. Sales expenses
7. Administrative expenses
8. Net profits from operating activities
9. Other profit
10. Profit / loss from joint venture companies
11. Gross profit before tax
12. Profit After Enterprise Income Tax
13. Profit after tax of shareholders of holding
company
Indicator 2016 2017
I. Net Cash Flow From Operating activities
II. Net Cash Flow From Investing activities
III. Net Cash Flow From Financial activities
Net Cash Flow during the fiscal period
Opening cash and cash equivalents
Impact of exchange rate changes in foreign currency
Closing cash and cash equivalents
Content is intentionally removed for demo purpose

200
APPENDIX
VIETNAM FUMIGATION JOINT STOCK COMPANY (VFG)
INCOME STATEMENTUnit: VND
BALANCE SHEETUnit: VND
CASH FLOW STATEMENTUnit: VND
Indicator 2016 2017
ASSETS
A. CURRENT ASSETS
I. Cash and cash equivalents
II. Short-term financial investments
III. Short-term receivables
IV. Inventories
V. OTHER CURRENT ASSETS
B - LONG TERM ASSETS
II. Fixed assets
III. Real estate investment
V. Long-term financial investments
TOTAL ASSETS
C - LIABILITIES
I. Current liabilities
II. Long-term liabilities
D - OWNER'S EQUITY
I. Investment capital of owners
II. Surplus equity
III. Retained earnings
IV. Minority interest
TOTAL LIABILITIES AND OWNER’S EQUITY
Indicator2016 2017
1. Net Revenue from Sales and services provided
2. Cost of goods sold
3. Gross Profit from sales and services provided
4. Financing income
5. Financial expenses
6. Sales expenses
7. Administrative expenses
8. Net profits from operating activities
9. Other profit
10. Profit / loss from joint venture companies
11. Gross profit before tax
12. Profit After Enterprise Income Tax
13. Profit after tax of shareholders of holding
company
Indicator 2016 2017
I. Net Cash Flow From Operating activities
II. Net Cash Flow From Investing activities
III. Net Cash Flow From Financial activities
Net Cash Flow during the fiscal period
Opening cash and cash equivalents
Impact of exchange rate changes in foreign currency
Closing cash and cash equivalents
Content is intentionally removed for demo purpose
201
APPENDIX
LIX DETERGENTS JOINT STOCK COMPANY (LIX)
INCOME STATEMENTUnit: VND
BALANCE SHEETUnit: VND
CASH FLOW STATEMENTUnit: VND
Indicator 2016 2017
ASSETS
A. CURRENT ASSETS
I. Cash and cash equivalents
II. Short-term financial investments
III. Short-term receivables
IV. Inventories
V. OTHER CURRENT ASSETS
B - LONG TERM ASSETS
II. Fixed assets
III. Real estate investment
V. Long-term financial investments
TOTAL ASSETS
C - LIABILITIES
I. Current liabilities
II. Long-term liabilities
D - OWNER'S EQUITY
I. Investment capital of owners
II. Surplus equity
III. Retained earnings
IV. Minority interest
TOTAL LIABILITIES AND OWNER’S EQUITY
Indicator2016 2017
1. Net Revenue from Sales and services provided
2. Cost of goods sold
3. Gross Profit from sales and services provided
4. Financing income
5. Financial expenses
6. Sales expenses
7. Administrative expenses
8. Net profits from operating activities
9. Other profit
10. Profit / loss from joint venture companies
11. Gross profit before tax
12. Profit After Enterprise Income Tax
13. Profit after tax of shareholders of holding
company
Indicator 2016 2017
I. Net Cash Flow From Operating activities
II. Net Cash Flow From Investing activities
III. Net Cash Flow From Financial activities
Net Cash Flow during the fiscal period
Opening cash and cash equivalents
Impact of exchange rate changes in foreign currency
Closing cash and cash equivalents
Content is intentionally removed for demo purpose

202
APPENDIX
SOUTHERN BASIC CHEMICALS JSC (CSV)
INCOME STATEMENTUnit: VND
BALANCE SHEETUnit: VND
CASH FLOW STATEMENTUnit: VND
Indicator 2016 2017
ASSETS
A. CURRENT ASSETS
I. Cash and cash equivalents
II. Short-term financial investments
III. Short-term receivables
IV. Inventories
V. OTHER CURRENT ASSETS
B - LONG TERM ASSETS
II. Fixed assets
III. Real estate investment
V. Long-term financial investments
TOTAL ASSETS
C - LIABILITIES
I. Current liabilities
II. Long-term liabilities
D - OWNER'S EQUITY
I. Investment capital of owners
II. Surplus equity
III. Retained earnings
IV. Minority interest
TOTAL LIABILITIES AND OWNER’S EQUITY
Indicator2016 2017
1. Net Revenue from Sales and services provided
2. Cost of goods sold
3. Gross Profit from sales and services provided
4. Financing income
5. Financial expenses
6. Sales expenses
7. Administrative expenses
8. Net profits from operating activities
9. Other profit
10. Profit / loss from joint venture companies
11. Gross profit before tax
12. Profit After Enterprise Income Tax
13. Profit after tax of shareholders of holding company
Indicator 2016 2017
I. Net Cash Flow From Operating activities
II. Net Cash Flow From Investing activities
III. Net Cash Flow From Financial activities
Net Cash Flow during the fiscal period
Opening cash and cash equivalents
Impact of exchange rate changes in foreign currency
Closing cash and cash equivalents
Content is intentionally removed for demo purpose

203
APPENDIX
SAIGON PLANT PROTECTION JOINT STOCK COMPANY (SPC)
INCOME STATEMENTUnit: VND
BALANCE SHEETUnit: VND
CASH FLOW STATEMENTUnit: VND
Indicator 2016 2017
ASSETS
A. CURRENT ASSETS
I. Cash and cash equivalents
II. Short-term financial investments
III. Short-term receivables
IV. Inventories
V. OTHER CURRENT ASSETS
B - LONG TERM ASSETS
II. Fixed assets
III. Real estate investment
V. Long-term financial investments
TOTAL ASSETS
C - LIABILITIES
I. Current liabilities
II. Long-term liabilities
D - OWNER'S EQUITY
I. Investment capital of owners
II. Surplus equity
III. Retained earnings
IV. Minority interest
TOTAL LIABILITIES AND OWNER’S EQUITY
Indicator 2016 2017
1. Net Revenue from Sales and services provided
2. Cost of goods sold
3. Gross Profit from sales and services provided
4. Financing income
5. Financial expenses
6. Sales expenses
7. Administrative expenses
8. Net profits from operating activities
9. Other profit
10. Profit / loss from joint venture companies
11. Gross profit before tax
12. Profit After Enterprise Income Tax
13. Profit after tax of shareholders of holding company
Indicator 2016 2017
I. Net Cash Flow From Operating activities
II. Net Cash Flow From Investing activities
III. Net Cash Flow From Financial activities
Net Cash Flow during the fiscal period
Opening cash and cash equivalents
Impact of exchange rate changes in foreign currency
Closing cash and cash equivalents
Content is intentionally removed for demo purpose
REPORT DISCLAIMER
207
Report disclaimer
This document has been prepared in good faith on the basis of information available at the date of publication without any independent verification. VIRAC has
produced this report for private circulation to professional clients only. All information and statistical data herein have been obtained from sources we believe to
be reliable and made to ensure the accuracy of the contents of the pages of the report at the time of preparation. Such information has not been independently
verified and VIRAC makes no representation or warranty, whether express or implied, of any kind with respect to the document and its contents, information and
materials. The content found in this report is proprietary to VIRAC and is provided solely for your personal and non-commercial use. You agree that you will not
use this report for any purpose that is unlawful and that you will not reproduce the report or redistribute it outside your organization, or place it on a website for
public access without the express written permission of VIRAC.
SHOULD YOU NEED ANY ASSISTANCE, PLEASE CONTACT US:
VIETNAM INDUSTRY RESEARCH AND CONSULTANCY (VIRAC JSC.,)
6Mh Floor, Anh Minh Building, 36 Hoang Cau, O Cho Dua, Dong Da, Hanoi, Vietnam
Website: http://virac.com.vn/
Email: [email protected] | Tel: +84 463289520

Thank you !