
ViDI: Virtual Diagnostics Interface - NASA Virtual Diagnostics Interface ... keyed toward...
22
October 2004 NASA/CR-2004-212667 ViDI: Virtual Diagnostics Interface Volume 1 — The Future of Wind Tunnel Testing Richard J. Schwartz Swales Aerospace, Hampton, Virginia https://ntrs.nasa.gov/search.jsp?R=20040152103 2018-07-01T16:25:17+00:00Z
Transcript of ViDI: Virtual Diagnostics Interface - NASA Virtual Diagnostics Interface ... keyed toward...

October 2004
NASA/CR-2004-212667
ViDI: Virtual Diagnostics Interface
Volume 1 — The Future of Wind Tunnel Testing
Richard J. Schwartz
Swales Aerospace, Hampton, Virginia
https://ntrs.nasa.gov/search.jsp?R=20040152103 2018-07-01T16:25:17+00:00Z

The NASA STI Program Office . . . in Profile
Since its founding, NASA has been dedicated to the
advancement of aeronautics and space science. The
NASA Scientific and Technical Information (STI)
Program Office plays a key part in helping NASA
maintain this important role.
The NASA STI Program Office is operated by
Langley Research Center, the lead center for NASA’s
scientific and technical information. The NASA STI
Program Office provides access to the NASA STI
Database, the largest collection of aeronautical and
space science STI in the world. The Program Office is
also NASA’s institutional mechanism for
disseminating the results of its research and
development activities. These results are published by
NASA in the NASA STI Report Series, which
includes the following report types:
• TECHNICAL PUBLICATION. Reports of
completed research or a major significant phase
of research that present the results of NASA
programs and include extensive data or
theoretical analysis. Includes compilations of
significant scientific and technical data and
information deemed to be of continuing
reference value. NASA counterpart of peer-
reviewed formal professional papers, but having
less stringent limitations on manuscript length
and extent of graphic presentations.
• TECHNICAL MEMORANDUM. Scientific
and technical findings that are preliminary or of
specialized interest, e.g., quick release reports,
working papers, and bibliographies that contain
minimal annotation. Does not contain extensive
analysis.
• CONTRACTOR REPORT. Scientific and
technical findings by NASA-sponsored
contractors and grantees.
• CONFERENCE PUBLICATION. Collected
papers from scientific and technical
conferences, symposia, seminars, or other
meetings sponsored or co-sponsored by NASA.
• SPECIAL PUBLICATION. Scientific,
technical, or historical information from NASA
programs, projects, and missions, often
concerned with subjects having substantial
public interest.
• TECHNICAL TRANSLATION. English-
language translations of foreign scientific and
technical material pertinent to NASA’s mission.
Specialized services that complement the STI
Program Office’s diverse offerings include creating
custom thesauri, building customized databases,
organizing and publishing research results ... even
providing videos.
For more information about the NASA STI Program
Office, see the following:
• Access the NASA STI Program Home Page at
http://www.sti.nasa.gov
• E-mail your question via the Internet to
• Fax your question to the NASA STI Help Desk
at (301) 621-0134
• Phone the NASA STI Help Desk at
(301) 621-0390
• Write to:
NASA STI Help Desk
NASA Center for AeroSpace Information
7121 Standard Drive
Hanover, MD 21076-1320

National Aeronautics and
Space Administration
Langley Research Center Prepared for Langley Research Center
Hampton, Virginia 23681-2199 under Contract NAS1-00135
October 2004
NASA/CR-2004-212667
ViDI: Virtual Diagnostics Interface
Volume 1 — The Future of Wind Tunnel Testing
Richard J. Schwartz
Swales Aerospace, Hampton, Virginia
Available from:
NASA Center for AeroSpace Information (CASI) National Technical Information Service (NTIS)
7121 Standard Drive 5285 Port Royal Road
Hanover, MD 21076-1320 Springfield, VA 22161-2171
(301) 621-0390 (703) 605-6000
Acknowledgments
The support and vision provided by Gary A. Fleming, Dr. Jeffrey Jordan and
James F. Meyers of the NASA Langley Research Center has been both essential and
highly appreciated.
The use of trademarks or names of manufacturers in the report is for accurate reporting and does not
constitute an official endorsement, either expressed or implied, of such products or manufacturers by the
National Aeronautics and Space Administration.

Contents Introduction…………………………………………………………………………………… 1 The Philosophy of ViDI………………………………………………………………………. 1 Why ViDI – A Historical Perspective………………………………………………………… 2 The Primary ViDI Components………………………………………………………………. 4 Facility Walk Through……………………………………………………………………. 4 Pre-test Planning………………………………………………………………………….. 4 Safety Assessment………………………………………………………………………… 5 Real Time Visualization #1. Tunnel Operator……………………………………………. 5 Real Time Visualization #2. Data Visualization…………………………………………. 5 Real Time Visualization #3. Comparison with Computational Results………………….. 6 Post Test Data processing and Analysis…………………………………………………... 6 A Future Test Scenario with a ViDI Enabled Facility……………………………….……….. 6 Unifying the ViDI Components………………………………………………………………. 12 File Formats……………………………………………………………………………….. 12 Database Storage………………………………………………………………………….. 13 Web Services……………………………………………………………………………… 13 Common Geometry Database……………………………………………………………... 13 Unified User Interface…………………………………………………………………….. 13 Common Access Portal……………………………………………………………………. 13 Summary……………………………………………………………………………………… 14 References…………………………………………………………………………………….. 14
The NASA Langley Unitary Plan Wind Tunnel depicted as a glass structure around a model of a high-
speed civil transport.
iii

iv

Introduction The quality of data acquired in a given test facility ultimately resides within the fidelity and implementation of the instrumentation systems. Over the last decade, the emergence of robust optical techniques has vastly expanded the envelope of measurement possibilities. At the same time the capabilities for data processing, data archiving and data visualization required to extract the highest level of knowledge from these global, on and off body measurement techniques have equally expanded. Yet today, while the instrumentation has matured to the production stage, an optimized solution for gaining knowledge from the gigabytes of data acquired per test (or even per test point) is lacking. A technological void has to be filled in order to possess a mechanism for near-real time knowledge extraction during wind tunnel experiments. Under these auspices, the Virtual Diagnostics Interface, or ViDI, was developed. The goal of ViDI will be to provide tools to the researcher to design, analyze, compare and make timely and relevant decisions concerning both the experimental setup and the test configuration. Many of the tools could provide real (or close to real) time data for analysis in both the wind tunnel control room and remote terminals. The current impasses between computational and experimental data sets will have to be bridged, and tools for easily manipulating the data for direct comparisons will need to be created. Thus, ViDI will encompass the realms of rapid processing of very large data sets, advanced networking technologies for timely data routing, and data visualization tools including cutting edge three-dimensional visualizations. Elements of each of these components have been utilized successfully in support of wind tunnel testing, and a clear plan for future integration has been developed. This will provide a seamless path between test planning, data processing, real-time and post-test data visualization, and data archiving. The Philosophy of ViDI The creation of ViDI began in the Advanced Measurement and Diagnostics Branch (AMDB) at the NASA Langley Research Center (LaRC). AMDB is dedicated to the development of cutting edge technologies for use in many aspects of aerodynamic, structural, wind tunnel, and flight testing1. Most of the technology is based on non-intrusive techniques, which use optical methods such as laser light to probe a region of interest without affecting the property being measured. Thus, the capabilities developed into the current embodiment of ViDI have evolved from a need to support the design, installation, operation, and data analysis of these instruments. To date, most of the work has been done using commercial software with some custom code, and the tools developed have been in response to specific requests. While this mode of operation has worked well within a single branch at LaRC, it is not a viable option for distribution to a large number of customers. This report addresses how ViDI must become an integral part of the production test environment in order to maximize the value (knowledge) produced by implementing current state of the art wind tunnel instrumentation. The key to ViDI is to get it in the hands of the researchers. To do so it must be based on the needs of the researchers. A suite of tools that brings the awesome capabilities of today’s three dimensional computer graphics and data automation must be easy to use, and provide true improvements over current capabilities.
1

It is envisioned that the researcher will be able to use ViDI at their desk. Most aspects of ViDI are keyed toward PC-compatible computers. Considering the marketplace in the fourth quarter of 2002, a $1000 dollar home PC with a mid level three-dimensional graphics accelerator card (also known as a gaming card) is adequate. Dedicated workstations for real time data visualization, as described below, will require PC hardware in the $2,500 price range. A key aspect of ViDI is the ability to create a backbone, or infrastructure, that can be modified and enhanced by the addition of code modules. This is achieved by following a “plug-in” design philosophy. At the start of development, a common protocol for information organization, file data storage, and user interface issues are established, and common software libraries are created. The elements of the design of this protocol have emerged from experience gained during years of operating numerous non-intrusive global wind tunnel instrumentation systems along with the development of associated data acquisition and processing software. By creating a robust foundation and following “open source” practices that allow others to contribute, the ultimate scope of ViDI can far exceed the vision presented in this paper. The core ViDI applications avoid reliance on non-traditional user interfaces, which include three dimensional display devices such as stereo goggles or display screens, immersive virtual environments, and haptic user inputs. The goal is to make a simple tool that a new user can learn in a short period of time. This tool must be available whenever needed, it must be easily accessible, and it must be as transparent as possible to the user. In a nutshell, ViDI is about bringing knowledge to the customer, and not about making the customer come to technology. Why ViDI – A Historical Perspective In the early 1990’s the decreasing price and increasing performance of several key technologies led to the emergence of today’s state of the art wind tunnel instrumentation. Key components included scientific grade video cameras and frame grabbers for digitizing imagery. In addition, the tremendous gains in computing power and data storage provided an affordable data acquisition and processing environment. With these new tools, a variety of non-intrusive, global measurement techniques were developed that were capable of obtaining planar or volumetric measurements. For example, Particle Image Velocimetry (PIV) and molecular filtering techniques such as Doppler Global Velocimetry, (DGV) were used to acquire off-body flow velocity measurements. On-body measurements included Pressure Sensitive Paint (PSP) for surface pressure measurements, and Projection Moiré Interferometry (PMI), for measurement of surface deformation. All of these instrumentation systems are image-based employing charge- coupled device (CCD) video cameras as their primary sensor. A single CCD camera with 512x512 pixel resolution can be thought of as a sensor that can produce 262,144 individual measurement on each acquisition. Acquiring data at standard 30 Hz video frame rates yields 7,864,320 measurements per second. If each measurement is allocated a 16-bit integer for data storage, the storage requirements are over 15,700,000 bytes (15.36 MB). The number of cameras required per system dictates the ultimate data storage requirement. PIV, for example, requires at least two cameras (30.72MB), and DGV requires 8 cameras (123 MB) for a fully three-dimensional flow velocity measurement. The data handling and storage requirements are further compounded through data processing, which often involves a number of intermediate steps that create images which are as large as (or larger) than the original image sets. Image based instrument have emerged from wind tunnel tests with gigabytes of raw and processed information, which required archives along the order of terabytes for long term storage of multiple test entries.
2
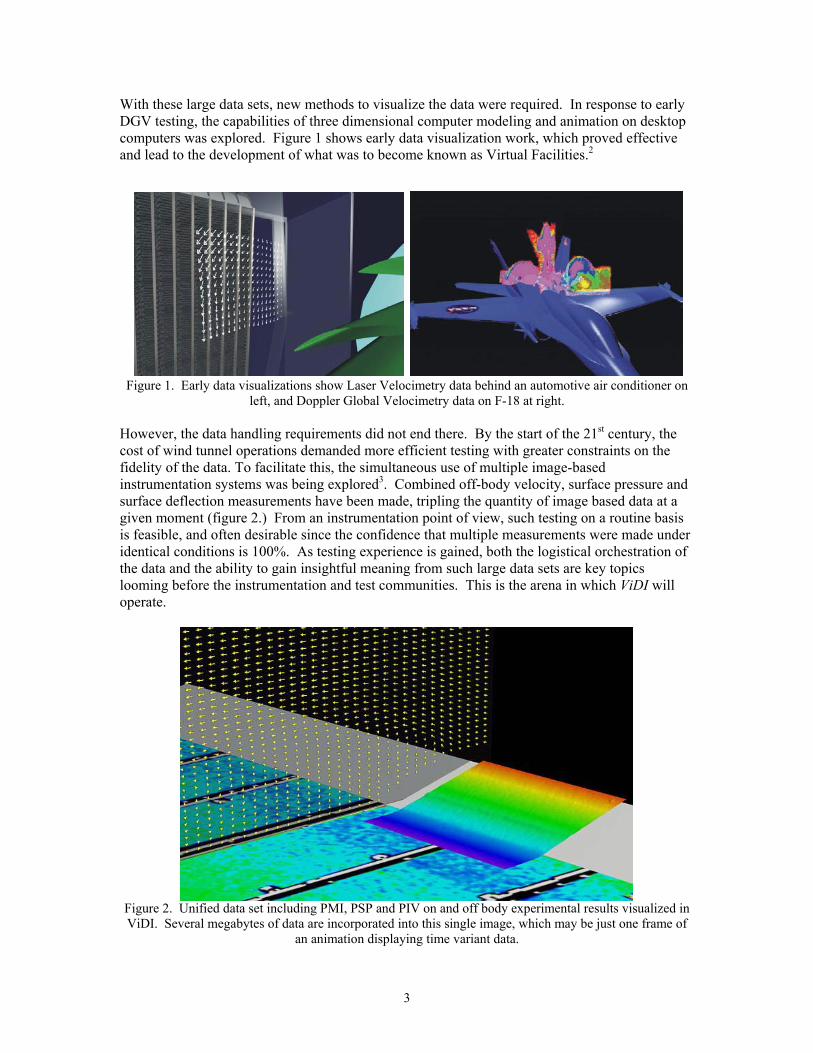
With these large data sets, new methods to visualize the data were required. In response to early DGV testing, the capabilities of three dimensional computer modeling and animation on desktop computers was explored. Figure 1 shows early data visualization work, which proved effective and lead to the development of what was to become known as Virtual Facilities.2
Figure 1. Early data visualizations show Laser Velocimetry data behind an automotive air conditioner on left, and Doppler Global Velocimetry data on F-18 at right.
However, the data handling requirements did not end there. By the start of the 21st century, the cost of wind tunnel operations demanded more efficient testing with greater constraints on the fidelity of the data. To facilitate this, the simultaneous use of multiple image-based instrumentation systems was being explored3. Combined off-body velocity, surface pressure and surface deflection measurements have been made, tripling the quantity of image based data at a given moment (figure 2.) From an instrumentation point of view, such testing on a routine basis is feasible, and often desirable since the confidence that multiple measurements were made under identical conditions is 100%. As testing experience is gained, both the logistical orchestration of the data and the ability to gain insightful meaning from such large data sets are key topics looming before the instrumentation and test communities. This is the arena in which ViDI will operate.
Figure 2. Unified data set including PMI, PSP and PIV on and off body experimental results visualized in ViDI. Several megabytes of data are incorporated into this single image, which may be just one frame of
an animation displaying time variant data.
3

The Primary ViDI Components ViDI encompasses a range of user needs and technology levels. These components are complimentary, starting from a very basic educational guide of a facility up through high- end productivity tools and real time data processing and analysis. By leveraging both the commonalities these components share as well as providing common user interfaces to access the tools, this suite of tools will provide the maximum amount of capability while minimizing training costs and eliminating wasteful reproduction of labor in their development. Below is a listing of currently envisioned (but not limited to) capabilities that ViDI would provide.
1. Facility Walk Through. Traditionally, the first level of interaction a potential customer has with a test facility is a written description of the facility, accompanied by photographs or drawings. These basic descriptions can be supplemented and greatly enhanced by providing a three-dimensional facility walk through provided by a web based, platform independent format. The user would be able to explore a facility representation that is rendered in a realistic manner, including all pertinent portions of the wind tunnel. However, due to the need to work on a web-based system with bandwidth limitations and multiple platforms, the computer models will by necessity have to be of low resolution (derived from the high resolution models used in the components described below), relying upon texture mapping to achieve the perceived level of realism. Additional educational material could be hyperlinked to the environment.
2. Pre-Test Planning. The production wind tunnel environment provides little time to spare in all aspects of the test operation. However, the implementation of a non-intrusive global measurement system generally requires careful analysis. This analysis must be done prior to the instrument hardware installation, and accomplished without consuming valuable tunnel occupancy time. For example, as model position changes in yaw, pitch, and roll, translates, or undergoes geometric alterations (or some combination of all of the above) the necessary optical access an instrument may need for a given measurement may not be available. The need for this analysis is significantly bolstered when more than one non-intrusive global instrument is used simultaneously, something that is planned to become a standard operating procedure in the future. With ViDI, the test engineer will be equipped with a high-resolution computer model that includes both the interior and exterior of the test section, merged with a CAD model of the configuration to be tested. Now the engineer can plan out the entire experiment at their desk. Numerous what-if scenarios can be examined with various camera placements, lens choices, lighting configurations, and model geometry. The subsequent behavior of each instrument camera system will be investigated in detail. Care can be taken to ensure that the unique parameters of one instrument are satisfactorily addressed without disrupting the ability of other instruments to operate. Questions about proper lens selection, lighting and depth of field can be answered, and limitations of any particular setup can be identified before any instrument hardware for the test is placed in the wind tunnel. The test engineer can share these finding with the customer, instrument operators, and tunnel personnel to determine the optimum test matrix. The ultimate goal of this stage of the test is to eliminate any uncertainty or costly surprises when it comes to setting up and operating the instrumentation.
4

3. Safety Assessment. All aspects of the proposed test can be modeled into the ViDI
environment, as described in the pre-test planning stage. Thus, a detailed analysis of the test operation, with an eye toward safety, can be made. The path of laser beams and light sheets, the hazards from high speed rotating machinery, or other dangerous operating conditions can be pinpointed and clearly documented. A review of each facilities safety procedures may find more applications for ViDI.
4. Real Time Visualization #1. Tunnel Operator. The procedures for running a given
wind tunnel are generally well established. However, each test will carry its own unique requirements due to model design or sting configuration. ViDI could be used to provide real time visualization that acts as an interface for control of the model and test parameters. One application that has already been explored is a real-time sting controller. This software will give a three-dimensional view of the sting, model and test section. The tunnel operator will have a simple program that allows him to select each joint on the sting, and command a change in position. The visualization would display the corresponding alteration in geometry. If additional instrumentation is included, such as strain gauges or accelerometers on the sting, the sting’s deformation due to aerodynamic loading can be modeled into the simulation as well. A very accurate visualization of the actual test configuration, in real time, would be available to the tunnel operator. Ultimately, the software can be tied into the hardware controllers, so an operator in the tunnel control room can first manipulate the geometry in the computer simulation. Once satisfied that a safe and proper change can be made, they can simply hit a button to feed the proper commands to the hardware.
5. Real Time Visualization #2. Data Visualization. Data acquired from global
instrumentation systems is usually in the form of an image. The image may be of surface pressure (PSP4), model deformation (PMI5), a color contour map, or velocity vector field (PIV6, DGV7). This data may be incorporated into the three-dimensional computer environment almost instantaneously using texture-mapping techniques or custom geometry creation techniques. In addition, video imagery from laser light sheet or Schlieren flow visualization8 can be fed real time into the virtual environment, so the real time data can be displayed in the virtual environment. It is also possible to have the user interact with the computer models while the data is being displayed, so the user can view the data on the model from any angle, at any magnification, and with any number of desired image-processing techniques applied.
In addition to viewing the images, data from the PMI system (or from stress-strain gauges or accelerometers) can be used to alter the simulated geometry showing the actual deformed state of the configuration under aerodynamic load. Additionally, data from each instrument can be incorporated into the visualization at the same time, so when simultaneous instrumentation systems are used, the measurements can be analyzed as a complimentary set. This will enhance the ability to identify coupled flow/structural features that may otherwise be missed if only a single measurement technique was employed and analyzed. Numerous other scenarios can be envisioned with this technology. The speed and power of the graphics development environment allow the visualizations to be tailored to the unique needs of the facility and the customer.
5

6. Real Time Visualization # 3. Comparison with Computational Results. An outgrowth of the Real Time Data Visualization described above would pair the visualization work described above with a comparison of pre-computed computational result for the same (or very close) given test condition. Analytical tools would be used to compare the data in a variety or formats such as line plots, color maps, particle traces and others as deemed appropriate by the researchers.
7. Post Test Data Processing and Analysis. The tools described above for use with the
real time data visualization and comparisons will be used here, except the data will be called up from the test archives. Data processing, or re-processing with different input parameters can be done for comparative or corrective purposes, and the tools required to find particular information in datasets can be incorporated into the software suite. From here, the data set, or portions of it, can be exported for use as input into complementarily technology systems (such as mission or flight simulators, aircraft design tools) that ultimately require the wind tunnel data.
Each of the components described above can be implemented in a stand-alone capacity. However, the greatest benefit to the researcher/customer will only be realized when the detailed logistics of file formats and transfers, unit conversions, user interfaces, color palette compatibility between data sets, and other administrative functions are handled automatically. Paramount to this success is a unifying infrastructure based on the state- of-the-art in information technology, designed to tackle these issues in a manner that is as transparent as possible to the end user. Before a detailed discussion of such technical details is approached a vision of how a fully integrated ViDI facility could operate is given. The discussion will then turn to the behind the scenes mechanizations essential to unifying the ViDI elements to create a truly seamless working environment.
A Future Test Scenario with a ViDI Enabled Facility There are many different ways in which ViDI could be incorporated into a wind tunnel (or any experimental facility) test cycle. Below is a vision for a baseline application, centered on testing experience gained at the NASA LaRC 14- by 22- Foot Subsonic Wind Tunnel. Please note: The following example shows an X-34 space-plane in the NASA LaRC 14- by 22- Foot Subsonic Wind Tunnel. This configuration represents an actual test that occurred in the facility several years ago. PSP, PMI, PIV and ViDI were not employed during this test. This visualization was developed at the time to show the potential of ViDI and unified testing; what follows describes a possible future scenario.
A test engineer at the NASA LaRC 14- by 22- Foot Subsonic Wind Tunnel receives a request from a customer to determine the subsonic aerodynamic characteristics of a reusable spacecraft. The customer has requested off body flow velocity measurements using PIV, surface pressure measurements with PSP, and surface deflection measurements using PMI. Each of these non-intrusive optical instrumentation techniques are considered “off the shelf” items routinely used in the facility. The test engineer begins by referring the new customer to a web site that provides a three-dimensional visualization environment in a web browser, shown in figure 3. Additionally, an inventory of components, such as stings, force and moment balances, and instrumentation is provided, as is a discussion of how each of these components can
6

be used. Facility manuals, safety criteria, cost, and availability are also tied into this web page. With this information, the customer can work efficiently with the test engineer to set realistic goals based on the capabilities and costs of the wind tunnel and instrumentation.
Figure 3. A web-based representation of the wind tunnel, viewed in a browser utilizing a standard,
free plug-in. This low-resolution geometry would familiarize the customer with the testing capabilities of a facility.
The first step towards detailed test planning occurs when the test engineer receives three-dimensional CAD (Computer Aided Design) geometry of the test configuration from the customer. The customer provides the files that are shared with those who will fabricate the model and then create meshes for the complimentary computational analysis (figure 4). For this test the customer has specified multiple configurations (i.e. flap positions, different wings, etc.) so a library of CAD files specifying the different geometries is organized. The files are stored in a common CAD format, such as IGES. If required, commercial-off-the-shelf file translation tools are available to translate between file formats. The library is organized in a way that allows all users of the geometry to have access to the files, and any changes made to the core configuration can be immediately accessible to everyone involved with the test.
Figure 4. Imported CAD model also used for computational analysis and model construction
7

Th
e
each
utput
an he
eer would put together the test configuration in an easy to use custom
ext, an analysis of the loading on the model and the effect that it will have on the
mic
d
e next step is to incorporate the customer’s test geometry into a three-dimensional representation of the test facility. This is accomplished by using a custom ViDI-basedapplication called a “Facility Builder.” The Facility Builder accesses a library of three dimensional computer models pertaining to the facility (figure 5). Besides the major parts of the wind tunnel itself, this library will also hold individual parts, such as stingcomponents, and be organized in a way that allows the test engineer, using the Facility Builder interface, to quickly pick and choose the pieces he feels are most appropriate. Hcan also swap out pieces with a few clicks of a mouse. Each component will have enough information tied to the geometry to describe what type of connectors are onend (mechanical and electrical), state where the part was last stored, give coefficients to use in equations to predict the bending under load, and even keep track of whether someone else is planning to use the part during the time of this test (figure 6). The oof the Facility Builder program is a baseline configuration that includes a highly detailed representation of the test environment, associated data that enables calculations of pertinence, and takes into account logistical issues. This process should take underhour of time, and provide for a baseline configuration upon which the investigation of texperiment can begin.
Figure 5. The test engininterface (called a Facility Builder) tied to the three-dimensional graphic environment.
Ngeometry is conducted. Based on the mass properties and estimates of the aerodynaforces on the model, the anticipated sting deflection can be determined and automaticallyincorporated into the visualization. By specifying various dynamic pressures, roll, yaw and pitch angles, the computations can be updated and viewed interactively. With a gooestimate of where the model will be located in the test section under a given test condition, a detailed analysis of the optical instrumentation can occur.
8

Figure 6. A library of components would exist, with specifications that would limit possible combinations to physically realistic setups (for example, on an B connector could mate with a B
connector, as shown above). Several factors influence the placement of optical instrumentation components, the foremost being optical access. The instrumentation system video cameras must have a clear line of sight to the region of interest being measured. Otherwise, the measurement cannot be obtained in the blocked portion of the field-of-view. Optical configurations having a clear line of sight for one particular test condition may have partially or fully blocked optical access for other configurations as changes in model attitude, position, or geometry can occlude the camera views. The ViDI software is capable of physically accurate simulations of camera, optical, and illumination systems, and can identify exactly what a video camera will image given its lens type and position within the test environment. A test engineer can use these capabilities to (a) examine different possible optical configurations, (b) determine the optimal placement of the hardware components, and (c) identify any conflicts with other instrumentation systems and compromises to circumvent any operational problems. This analysis will be carried out for each optical instrument, ensuring the compatibility between all of the required components. When complete, the engineer will have a good idea of where the parts go, what type of mounting hardware will be required, and how best to implement the test matrix based on any the operational constraints imposed by the instruments. Every effort is made in this early stage to eliminate the potential for expensive and time-consuming surprises once the test is ready to set up and run.
Setup information based on the visualization is then distributed to the various engineers and technicians responsible for each portion of the test. In addition, the final geometry of the test is sent to the tunnel operator, who will use it in real time for predicting and controlling the sting position. During testing, two data streams flow to two different ViDI terminals. One terminal is dedicated to the operation of the tunnel sting. As the model is moved through different
9

positions, the operator first controls the simulation to ensure that the movement meets the expected test criteria. In addition, telemetry from instrumentation on the sting shows the deformation in real time. This particular test includes “ground effects” testing, where the model is maneuvered very close to the floor of the wind tunnel, simulating the final pre-landing moments of the flight. The model is very close to the ground board at the end of the long sting (figure 7). In reality, several expensive models have been damaged by accidental crashes into the floor under these circumstances. Using the ViDI simulation, the translations and rotations commanded to the sting are verified as safe in real time simulation. Any mistakes are caught before the actual hardware undergoes the translation and or rotation, so testing can continue without expensive and time-consuming damage.
Figure 7. Sting bending can be depicted based on calculation or measurement
The second stream of data dedicated to ViDI is for the test engineer and customer. PMI and PSP data are acquired simultaneously, with a subset of the data being processed in real time. This is then brought into the ViDI environment, for analysis and display in three dimensions (figure 9). In addition, the PIV data that was acquired during the prior run is brought into the visualization. Now the users can view the surface pressure and off body flow field behavior on the model as it truly appears, in a deformed state due to aerodynamic loading. Along with the experimental data, pre-computed computational results are available for direct comparison in real time. The researchers now have a level of situational awareness about the physics of the aerodynamic configuration that has only been rarely achieved in the past. In addition, this information is provided in a timely enough manor that any problems with instrumentation, model configuration, or other unexpected phenomena can be investigated while the tunnel is still “on point”. Additionally, the researchers will have the flexibility to alter the test matrix if surprising results in the data occur; results that previously may have only been observed days or weeks after the test was run due to the current limitations of data processing and visualization technology.
10

IMPACT!!
Figure 8. ViDI used during the tunnel run by the tunnel technician to ensure that sting movements are both safe and produce the desired rotation/translation. An actual movement would only be
commanded once the predictive simulation shows it is safe. The rate at which knowledge is gained from the test allows the researchers to tailor new model components based on the test information. These components can be created using stereolithography, and be installed onto the model the next day. (This capability, known as Rapid Prototyping, exceeds the scope of this report but can be seen as a
Figure 9. Simulated instrumentation cam
complimentary technology to ViDI).
era views with expected PSP response on one wing and
t the conclusion of the test, the customer is given (physically on disk or via network)
PMI grid projection on the other wing.
Aseveral gigabytes of raw and processed data. The data is organized in a way that allowsthe researchers to later determine exactly what parameters went into processing the data, as well as the raw data and calibration files (figure 10). Thus, the data can be reprocessedin the future as necessary. The same visualization tools used in the wind tunnel control room during the real time testing will be available for continued post-test analysis at the researcher’s desktop. A test cycle that would have taken months of data processing and data visualization to complete in the past can now be accomplished in a matter of days.
11

And through the use of multiple instrument systems, the synergy created by observing thvarious “cause and effect” aspects of the physics leads to a greater knowledge of what actually occurred during the test.
e
Figure 10. Element of all aspects of the experiment are brought together under ViDI. These geometrical simulations, actual test imagery, and experimental and computational results.
(C )
Uni
s applications of all of the primary ViDI components. owever, for the components to provide maximum utility they must be linked together by an
y,
services) are complex issues that quire careful consideration. As such, a detailed white paper study, titled “Unified File Format
l to unifying instrumentation, computational results and ViDI as the use of a common file format that supports a self-
e of file that it
includeFD from S. Paul Pao, Configuration Aerodynamics Branch, NASA Langley Research Center
fying the ViDI Components
The test scenario described above highlightHinfrastructure – mostly invisible to the user – that allows them to interact seamlessly. By establishing a set of open standards based on commercial state of the art information technologViDI becomes a backbone upon which an unlimited number of additional elements can be connected to, providing a platform for information processing that will extend far into the future. Below is a discussion on each of the baseline components. Please note: File format and network transport issues (webreand Web Services as Applied to Seamless Data Transfer” has been developed. This report is included as Volume 2 of this set. The File Formats and Web Services descriptions below are brief summaries derived from the work in Volume 2.
1. File Formats. There is no issue more critica
descriptive header. A file format with a self-descriptive header refers to a typcan contain almost any type of data. Information about the type of data and how to use is stored in the header portion of the file. A modern trend in file design has been to allow several different types of information (for example a three-dimensional geometry as well
12

as pictures) within one file. Information within the file would be organized under a directory, or folder structure, just like a computer hard drive is organized. Thus, ViDI would specify a header structure that would allow one or more types of data (PSP imcalibration info and processing values) to be stored in one file. The system would be flexible enough to allow data from multiple instruments to be stored in the same file, if desired. By laying out a common set of logical rules that can allow data files to be automatically expanded and contracted as needed by individual applications, various types of information can be handled in a fast and efficient manor, without the need fuser to translate data manually. The actual data would be held in the HDF5 file formadeveloped by the National Center for Super Computing Applications (NCSA) a format specifically designed to handle very large data sets. See Volume 2 of this report for a detailed discussion of HDF5 files and the selection process that was undertaken to cometo this conclusion.
Database storage.
ages,
or the t
2. A central database that is designed to organize the numerous data
files will be implemented. This will be a COTS item that will be XML enabled. More ,
3. er networks (and the Internet) is
emerging at a rapid pace. This is called Web Services, and is currently comprised of a
rent iven
f
ASCII text, and not binary data. This excludes its
applicability to handle large data sets intrinsically. Thus, the XML will act as a wrapper
2. ement of ViDI that is exposed to an end user should
have a user interface that is consistent with the user interfaces of all other ViDI nt
y, colors,
3. ree-dimensional geometry
should be available to the end user. Wind tunnels will be modeled in major components, e
e
specifics will have to be researched in order to make a final decision on which productand what overall capabilities are best suited for the task.
Web Services. A new standard for data manipulation ov
number of different technologies that either complement or compete with one another. However, the end goal is clear. Web Services will allow far more efficient ways of handling large sets of data between large numbers of computers. It will also allow implementation of distributed computing, letting the computers decide where the curdata processing will occur based on utilization of the networked processors at any ginstant. The heart of this technology is based on XML (eXtensible Markup Language), a file format and programming language rolled into one. Leading software firms are already employing XML as the backbone for advanced network operations. Databases, office applications, and other common programming packages over a wide variety oplatforms are using XML today.
However, XML is based purely on
to the HDF file. The XML header will contain some basic information about the HDFfile, which will be used for cataloging and routing the file over the network, but the actualdata will be held in HDF format and hyper-linked to the HDF file. See Volume 2 for a detailed discussion on this topic.
Unified User Interfaces. Each el
applications. Terminology, look and feel of the applications should maintain a consistehigh standard for ease of use. This comes through the regular use of terminologcommands, and command structures, and control layout.
Common Geometry Database. A common database of th
so the end user can specify if they wish to work with a computer model that includes thentire facility, or just one portion, such as the test section. This database would be created in the NURBS based IGES 3D computer model file format, as IGES is one of the most widely used formats among multiple platforms. Thus, an IGES file can feed th
13

visualization aspects of ViDI, a mesh generation module for CFD or Finite Element analysis, or a CAD workstation for detail enhancement or modification. The IGES filewould then be “wrapped” into an HDF5 file for ease of incorporating it with the rest the test data. Besides the wind tunnel, each major sting component should be included ithe library, with information embedded into the three dimensional model to specify the type of connections (physical and electrical) that can be made at each end. Other parameters, such as mass, modulus of elasticity, and even the last user and location the hardware was stored at can be incorporated.
A Common Access Portal. Ideally, all of the
of
n
4. networked resources of ViDI would be
available over a common web portal available on an organization’s intra-net. Such a web
Summ
agnostic Interface is a unifying technology that draws upon the state of the art in ind tunnel instrumentation, computational capabilities, information technology and data
e goal r!
, Measurement Technology for Use in Active Flow Control, Paper No. AIAA 002-2705, Aerodynamic Measurement Technology and Ground Testing Conference, St. Louis, MO,
irtual Facilities: Imaging the Flow. Aerospace America, July 1995, pages 23 - 26
easurement Techniques for Increased Wind Tunnel Testing Capability,” Paper No. AIAA 2002-s,
ighty, A.N. Watkins, J.L. Ingram, D.M. Oglesby “Application of a mperature-Insensitive PSP for Biologically Inspired Planforms,” 9th Pressure Sensitive Paint
outh, Projection Moiré Interferometry for Rotorcraft Applications: eformation measurements of Active Twist Rotor Blades, AHS Forum 58 Paper No. 47, American
uctures Using A ultiple-Camera DPIV System, 19 International Congress on Instrumentation in Aerospace
f Measurement Error Sources in Doppler lobal Velocimetry, Measurement Science and Technology 12 (2001) 357-368
portal should also include other managerial and scheduling tools that are beyond the scope of the ViDI project.
ary The Virtual Diwvisualization. Some elements of ViDI are already close to maturity, while others simply exist asideas based on logical extensions of current capabilities. However, each proposed area of technology is based on emerging mainstream technologies, whose independent growth and development will only help advance the capabilities of ViDI. The vision of ViDI is clear, this attainable, and the first steps have been taken. Today we can see, tomorrow let us conque References 1. K.D. Wright, et al2June 24-26, 2002 2. R.J. Schwartz, V 3. G.A. Fleming, Unified Instrumentation: Examining the Simultaneous Application of Advanced M3244, AIAA 22nd Aerodynamic Measurement Technology and Ground Testing Conference, St. LouiMO, June 24-26, 2002 4. J.D. Jordan, B.D. LeteWorkshop, Washington DC, 2002. 5. G.A. Fleming, H.L. Soto, B.W. SDHelicopter Society 58th Annual Forum, Montreal, Canada, June 11-13, 2002. 6. W.M. Humphreys, Jr., S.M. Bartram, Measurement of Separating Flow Str
thMSimulation Facilities, Cleveland, OH, August 27-30, 2001 7. J.F. Meyers, J.W. Lee, R.J. Schwartz, Characterization oG
14

8. G.S. Settles, Schlieren and Shadowgraph Techniques: Visualizing Phenomena in Transparent Media, published by Springer, Berlin, 2001, ISBN 3-540-66155-7
15

REPORT DOCUMENTATION PAGE Form ApprovedOMB No. 0704-0188
2. REPORT TYPE
Contractor Report 4. TITLE AND SUBTITLE
ViDI: Virtual Diagnostics InterfaceVolume 1 — The Future of Wind Tunnel Testing
5a. CONTRACT NUMBER
NAS1-00135
6. AUTHOR(S)
Schwartz, Richard J.
7. PERFORMING ORGANIZATION NAME(S) AND ADDRESS(ES)
NASA Langley Research CenterHampton, VA 23681-2199
9. SPONSORING/MONITORING AGENCY NAME(S) AND ADDRESS(ES)
National Aeronautics and Space AdministrationWashington, DC 20546-0001
8. PERFORMING ORGANIZATION REPORT NUMBER
10. SPONSOR/MONITOR'S ACRONYM(S)
NASA
13. SUPPLEMENTARY NOTESLangley Technical Monitor: Gary A. FlemingAn electronic version can be found at http://techreports.larc.nasa.gov/ltrs/ or http://ntrs.nasa.gov
12. DISTRIBUTION/AVAILABILITY STATEMENTUnclassified - UnlimitedSubject Category 35Availability: NASA CASI (301) 621-0390 Distribution: Nonstandard
19a. NAME OF RESPONSIBLE PERSON
STI Help Desk (email: [email protected])
14. ABSTRACT
The quality of data acquired in a given test facility ultimately resides within the fidelity and implementation of the instrumentation systems. Over the last decade, the emergence of robust optical techniques has vastly expanded the envelope of measurement possibilities. At the same time the capabilities for data processing, data archiving and data visualization required to extract the highest level of knowledge from these global, on and off body measurement techniques have equally expanded. Yet today, while the instrumentation has matured to the production stage, an optimized solution for gaining knowledge from the gigabytes of data acquired per test (or even per test point) is lacking. A technological void has to be filled in order to possess a mechanism for near-real time knowledge extraction during wind tunnel experiments. Under these auspices, the Virtual Diagnostics Interface, or ViDI, was developed.
15. SUBJECT TERMS
Simulation; Virtual diagnostics; Virtual facilities, Virtual reality; Global instrumentation; Wind tunnel testing
18. NUMBER OF PAGES
22
19b. TELEPHONE NUMBER (Include area code)
(301) 621-0390
a. REPORT
U
c. THIS PAGE
U
b. ABSTRACT
U
17. LIMITATION OF ABSTRACT
UU
Prescribed by ANSI Std. Z39.18Standard Form 298 (Rev. 8-98)
3. DATES COVERED (From - To)
5b. GRANT NUMBER
5c. PROGRAM ELEMENT NUMBER
5d. PROJECT NUMBER
5e. TASK NUMBER
25RBG5f. WORK UNIT NUMBER
23-706-21-11
11. SPONSOR/MONITOR'S REPORT NUMBER(S)
NASA/CR-2004-212667
16. SECURITY CLASSIFICATION OF:
The public reporting burden for this collection of information is estimated to average 1 hour per response, including the time for reviewing instructions, searching existing data sources, gathering and maintaining the data needed, and completing and reviewing the collection of information. Send comments regarding this burden estimate or any other aspect of this collection of information, including suggestions for reducing this burden, to Department of Defense, Washington Headquarters Services, Directorate for Information Operations and Reports (0704-0188), 1215 Jefferson Davis Highway, Suite 1204, Arlington, VA 22202-4302. Respondents should be aware that notwithstanding any other provision of law, no person shall be subject to any penalty for failing to comply with a collection of information if it does not display a currently valid OMB control number.PLEASE DO NOT RETURN YOUR FORM TO THE ABOVE ADDRESS.
1. REPORT DATE (DD-MM-YYYY)
10 - 200401-