From Tenure Track to Tenure: The View of the NIH Central Tenure Committee (CTC)
Final Report of Major Research Project
Titled
VIDEO STREAMING IN 3G WIRELESS
NETWORK FOR TELEMEDICINE APPLICATION
UGC Reference No: F. 41-190/2012(SR) dated 16 July 2012
Submitted by
Dr. Dhananjay Kumar
Professor
Department of Information Technology
Anna University, MIT Campus
Chennai-600044

i
PROFORMA
1. UGC Approval Letter No.
& Date
41-190/2012 (SR) dated 16-07-2012
2. Title of the Project Video Streaming in 3G Wireless Network for
Telemedicine Application
3. Name & Address of The
Principal Investigator
Dr. Dhananjay Kumar
Professor
Department of Information Technology
Anna University, MIT Campus
Chennai-600044
4. Department & University
where the project has been
undertaken
Department of Information Technology
Anna University, MIT Campus
Chennai-600044
5. Tenure of the Project 24-12-2012 to 31-12-2015
6. Total Grant Allocated Rs.7,70,116
7. Objectives of the Project Develop a system to support adaptive video
streaming in 3G/4G wireless network for
telemedicine application
8. Whether Objectives Were
Achieved
Yes
9. No. of Publications Out of
the Project
08
10. Manpower Trained 12
PRINCIPAL INVESTIGATOR

ii
ABSTRACT
The smooth and reliable video streaming over HTTP through 3G/4G wireless
network for telemedicine application is challenging as available bit rate in the internet
changes due to sharing of network resources and time varying nature of wireless channels.
The present popular technique Dynamic Adaptive Streaming over HTTP (DASH)
provides solution up to some extent to stored video, but the effective adaptive streaming
of a live video remains a challenge in a high fluctuating bit rate environment. In this
project, some intelligent algorithms based on client server model are designed,
developed, and implemented in real-time internet environment with last mile connectivity
as wireless. In buffer filling based algorithm, the client system analyses the incoming bit
rate on the fly and periodically sends report to server which in turns adapts the outgoing
stream as per the feedback. The system was implemented and tested in real-time in
CDMA 1xEVDO Rev-A network using internet dongle. The use of maxima minima
concept and an RMS approximation which tries to estimate the bit rate pattern in real-
time provides an improvement of 37.53% in average PSNR (Peak Signal to Noise Ratio)
and 5.7% increase in mean SSIM (Structural Similarity Index) over traditional buffer
filling algorithm on a live video stream. The second method is based on ARIMA Based
Bit Rate Adaptation (ABBA) model, where the receiver/client side estimate network
traffic based on the incoming packet bit rate to predict the subsequent future link capacity
in order to notify the sender/server. Based on the response from the receiver the server
adapt its outgoing stream as per forecasted link data rate, and hence eliminate the
degradation of video due to channel throughput variations. The ABBA algorithm was
implemented on IP over 4G wireless network and the streaming quality was evaluated on
several full reference metrics of video quality. The test result outperformed an existing
buffer based approach and also a fuzzy based adaptation algorithm. The ABBA algorithm
exhibited an average increase of 9% in SSIM than a buffer based method. In third method,
a machine learning based approach is implemented, where State Action Reward State
Action (SARSA) Based Quality Adaptation algorithm using Softmax Policy (SBQA-SP)
identifies the current state (Throughput), action (Streaming quality) and reward (current
video quality) at client to determine the future state and action of the system. The ITU-T
G.1070 recommendation (parametric) model is embedded in the SBQA-SP to implement
adaptation process. The system was implemented on the top of HTTP in a typical internet
environment using 4G wireless network and the streaming quality is analyzed using
several full reference video metrics. The test results outperformed the existing Q-
Learning based video quality adaptation (QBQA) algorithm. An average improvement of
2 % in SSIM index over the QBQA approach was observed for the live stream.
iii
TABLE OF CONTENTS
CHAPTER NO. TITLE PAGE NO.
1 INTRODUCTION 1
1.1 MOTIVATION 1
1.2 OBJECTIVES OF THE PROJECT 1
1.3 ADAPTIVE VIDEO STREAMING
OVER INTERNET 2
1.4 CASE STUDY OF AVAILABLE DATA RATES 3
1.4.1 Bit Rate in 3G and 4G Wireless Networks 3
1.5 SYSTEM ARCHITECTURE 5
1.5.1 The Client Server Approach 5
1.5.2 Server side modules 6
1.5.3 Client side modules 7
1.6 THE ITU-T RECOMMENDATION 7
1.7 ORGANIZATION OF THE REPORT 8
2 ADAPTIVE VIDEO STREAMING OVER HTTP BY
PATTERN MATCHING 9
2.1 EXISTING APPROACH 9
2.2 ALGORITHM DEVELOPMENT 9
2.2.1 Client side algorithm 10
2.2.2 Analyse (Bitrates) 11
2.2.3 Find_rms (Bitrate) 11
2.2.4 Server side algorithm 12
2.2.5 Find_Switching_Time (Bitrate) 12
2.2.6 Buffer Filling Algorithm 12
2.3 IMPLIMENTATION ENVIRONMENT 13
2.3.1 Video Streaming and Bitrate Estimation in Java
Framework 13
2.3.2 Parameters Used to Evaluate the System
Performance 13
2.3.2.1 Peak Signal to Noise Ratio (PSNR) 14
2.3.2.2 Structural Similarity (SSIM) Index 14
2.4 RESULTS AND DISCUSSION 15
2.4.1 Inter-packet Arrival Delay 15
2.4.2 PSNR Measurement 16
2.4.3 SSIM Index 16
2.4.4 Some Selected Original and Received
Decoded Frame 17
3 ARIMA BASED ADAPTATION METHOD 18
3.1 OVERVIEW 18

iv
3.2 SYSTEM ARCHITECTURE 19
3.2.1 The Client Server Model 19
3.2.1.1 Sender Sub-modules 20
3.2.1.2 Receiver Sub-modules 20
3.3 SYSTEM MODEL 21
3.3.1 Stochastic Prediction Model 21
3.3.1.1 Auto-regressive (AR) Component 22
3.3.1.2 Auto Regressive Integrated Moving
Average (ARIMA) Model 22
3.4. ALGORITHM DEVELOPMENT 23
3.4.1 ARIMA Bitrate Based Adaptation (ABBA)
Algorithm 23
3.4.2 Buffer Switching Rate (BSR) Adaptation
Algorithm 25
3.4.3 Heuristic Decision based Rate
Adaptation (HDR) Algorithm 26
3.5. IMPLEMENTATION ENVIRONMENT 27
3.5.1 Performance Evaluation Parameters 27
3.6. RESULTS AND DISCUSSIONS 28
3.6.1 Peak Signal to Noise Ratio (PSNR)
Measurement 28
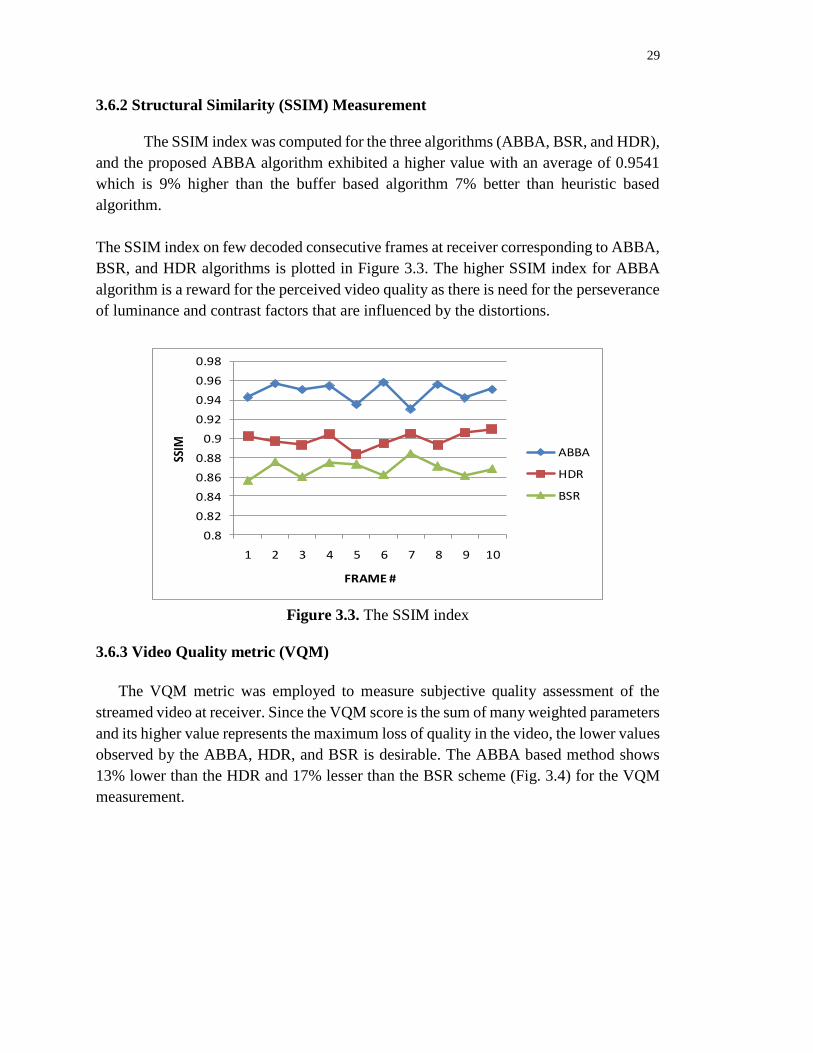
3.6.2 Structural Similarity (SSIM) Measurement 29
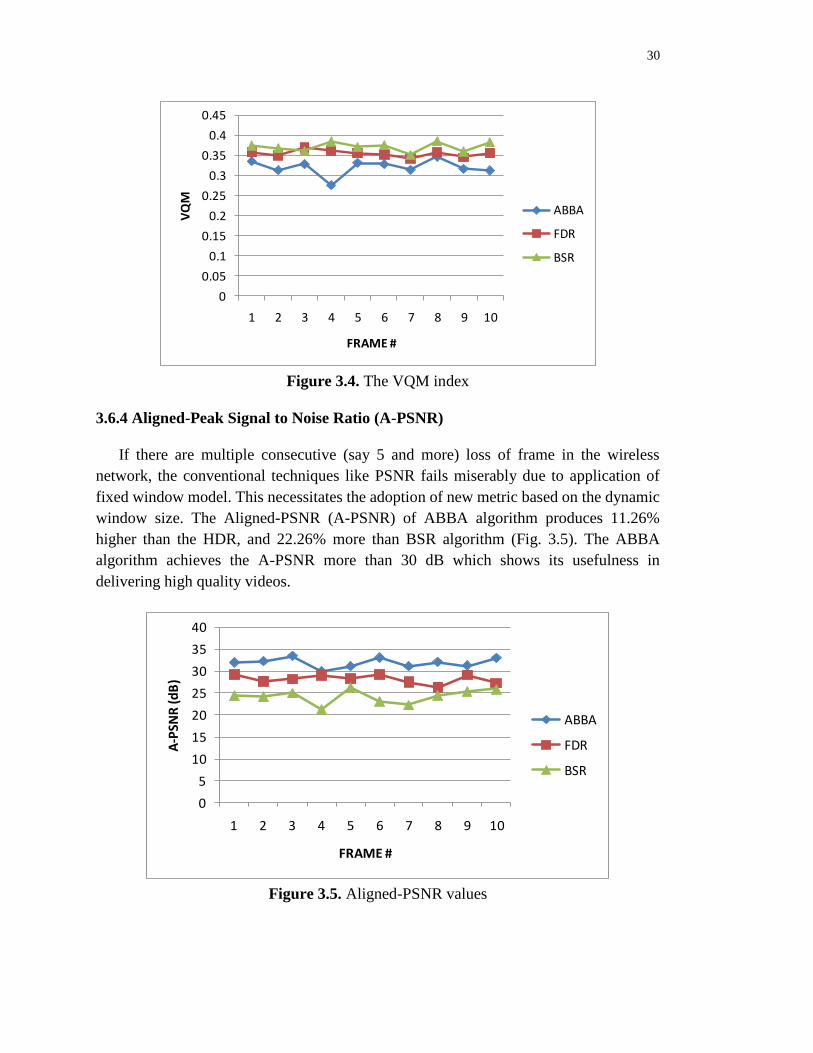
3.6.3 Video Quality metric (VQM) 29
3.6.4 Aligned-Peak Signal to Noise Ratio
(A-PSNR) 30
3.6.5 Multi Scale- Structural Similarity
(MS-SSIM) Index 31
3.6.6 Inter Arrival Packet Delay 31
3.6.7 Visual Frames 32
4 MACHINE LEARNING BASED APPROACH 33
4.1 OVERVIEW 33
4.2. PROPOSED SYSTEM 34
4.2.1. System Architecture 34
4.2.2. Server Side Functions 36
4.2.3. Client Side Functions 36
4.3. ELEMENTS OF PROPOSED WORK 36
4.3.1 Elements of SARSA Approach 37
4.3.2 Video Quality Estimation using
No-reference Metric 38
4.4. PROPOSED ALGORITHM 39
4.4.1. SBQA USING SOFTMAX POLICY
(SBQA-SP) 39

v
4.4.2. SBQA USING ε GREEDY POLICY
(SBQA-GP) 40
4.4.3. Q-LEARNING BASED QUALITY
ADAPTATION (QBQA) 40
4.5. IMPLEMENTATION ENVIRONMENT 41
4.6. RESULTS AND DISCUSSION 42
4.6.1. Peak Signal to Noise Ratio (PSNR) 43
4.6.2. Structural Similarity Measurement (SSIM) 43
4.6.3. Multi Scale Structural Similarity
(MS-SSIM) Measurement 44
4.6.4. Video Quality Metric (VQM) 44
4.6.5. Three-component Structural Similarity
(3-SSIM) Measurement 45
4.6.6. Inter Arrival Packet Delay 46
4.6.7. Experimental Original and Decoded
Sequence of Frames 46
5 CONCLUSION & FUTURE WORK 47
5.1 CONCLUSION 47
5.2 FUTURE WORK 47
REFERENCES 48

vi
LIST OF FIGURES
FIGURE NO. TITLE PAGE NO.
1.1 Download and upload bit rate observed on
wireless internet dongles at work place in a
given time 4
1.2 Bitrate observed during streaming of
live videos using Airtel 4G dongle 4
1.3 The schematic of an adaptive video streaming 5
1.4 Server side modular flow diagram 6
1.5 Client side modular flow diagram 7
2.1 Different bitrate patterns 11
2.2 Inter-packet delay 15
2.3 PSNR Measurements 16
2.4 SSIM Index comparison 17
2.5 Some selected frame from live video stream 17
2.6 Some selected frame from stored Foreman video 17
3.1 Server side modules 20
3.2 Client side modules 21
3.3 The SSIM index 29
3.4 The VQM index 30
3.5 Aligned-PSNR values 30
3.6 The Multi Scale SSIM observation 31
3.7 Inter Packet Delay for 20 packets 31
3.8 Live streaming from server to client 32
3.9 Stored Video Streaming for Entertainment 32
4.1 Architecture of the proposed work 35
4.2 Bitrate observed during stream of live video
using Airtel 4G LTE TD Hotspot 42
4.3 The PSNR observation 43
4.4 The SSIM index 44
4.5 The Multi Scale SSIM index 44
4.6 The VQM observation 45
4.7 The 3-SSIMindex 45
4.8 Inter packet delay 46
4.9 Live Streaming (few selected original
and decoded frames) 46

vii
LIST OF TABLES
TABLE NO. TITLE PAGE NO.
1.1 Test Factors as per the ITU-T J.247 8
3.1 Test factors as per ITU guidelines 19
3.2 List of parameters in HDR 27
3.3 Comparison of PSNR values 28
4.1 Test Parameters as per ITU-T J.247 35

viii
LIST OF ABBREVIATIONS
3G Third generation of wireless mobile telecommunications
technology
3GPP 3rd Generation Partnership Project
3-SSIM Three-component Structural Similarity Measurement
4G Fourth generation of broadband cellular network technology
ABBA Auto Regressive Integrated Moving Average (ARIMA)
Based Bit Rate Adaptation
AIC Akaike Information Criterion
A-PSNR Aligned-Peak Signal to Noise Ratio
AR Auto Regressive
ARIMA Auto Regressive Integrated Moving Average
AVC Advanced Video Coding
BSR Buffer Switching Rate
CDMA Code Division Multiple Access
CIF Common Intermediate Format
CPU Central Processing Unit
DASH Dynamic Adaptive Streaming over HTTP
EVDO Evolution-Data Optimized
FPS Frames Per Second
FR Full Reference
GB Gigabyte
HAS HTTP based Adaptive Streaming
HD High Definition
HDR Heuristic Decision Rate Adaptation
HEVC High Efficiency Video Coding
HTTP Hypertext Transfer Protocol
IEC International Electrotechnical Commission
ISO International Organization for Standardization
ITU-T International Telecommunication Union-Telecommunication
JPCAP Java network packet capture
JVT Joint Video Team
LTE Long-Term Evolution
Mbps Megabits per second
MPEG Moving Picture Experts Group
MSE Mean Square Error
MS-SSIM Multi Scale- Structural Similarity Index
NR No-Reference
OSMF Open Source Media Framework
PSNR Peak Signal to Noise Ratio
QBQA Q-Learning Based Quality Adaptation

ix
QCIF Quarter Common Intermediate Format
QoE Quality of Experience
QVGA Quarter Video Graphics Array
RAM Random-access memory
RL Reinforcement Learning
RMS Root Mean Square
RTCP RTP Control Protocol
RTP Real-time Transport Protocol
SARSA State Action Reward State Action
SBQA-GP SBQA using ε-Greedy Policy
SBQA-SP State Action Reward State Action (SARSA) Based Quality
Adaptation using Softmax Policy
SQCIF Sub Quarter Common Intermediate Format
SSIM Structural Similarity index
SSIM Structural Similarity Measurement
SVC Scalable Video Coding
TCP Transmission Control Protocol
TDD Time Division Duplex
UDP User Datagram Protocol
URL Uniform Resource Locator
VCEG Video Coding Experts Group
VGA Video Graphics Array
VLC VideoLAN Client
VLCJ VideoLAN Client Java framework
VNI Cisco Visual Networking Index
VQM Video Quality Metric
1
CHAPTER – 1
INTRODUCTION
1.1 MOTIVATION
The latest development in wireless mobile communications along with
developments in pervasive and wearable technologies is supposed to have a direct
influence on future healthcare systems. The live video streaming enables the predictive
analytics of data in motion for real-time decisions allowing medical expert to capture and
analyze data. Many times when doctors are on move or out of station, their expertise are
needed at hospital for critical health care. In this situation, a medical video streaming
becomes the most demanding application as it provide visual and other data to deliver
expert opinion. Further, the medical video communication techniques for tele-medical
applications have requirements of high fidelity. In order to keep diagnostic accuracy high,
the wireless network along with the wired internet must support high quality live
streaming considering best effort service model of the internet protocol.
1.2 OBJECTIVES OF THE PROJECT
The main objective of this project is to develop a system working on existing
3G/4G wireless cellular network that permits a medical expert not only get connected to
health center but also watch, monitor, and advice to an live critical medical activity. The
live medical video as well as stored image/video need to be transferred over wireless
mobile network to the expert irrespective of his location and movement. However the
available bandwidth for any user using dongles in 3G networks varies with time and
location. An intelligent system at source capture and encode video such that a best quality
video is delivered at the receiver. This necessitates the dynamically adjusting the video
parameters as per the available network bandwidth in a feed-back loop.
The prototype system need to permit medical expert to communicate
simultaneously with other experts at hospital premises through using laptops with 3G/4G
dongle. The existing popular streaming video codec e.g., H.264 is to be incorporated in
the system to support adaptive streaming considering the prevailing network bandwidth.
2
1.3 ADAPTIVE VIDEO STREAMING OVER INTERNET
The adaptive video streaming over Hypertext Transfer Protocol (HTTP) in
internet has become very popular today as HTTP is a widely used web technology, and
it does not require any specific technique below it to support streaming. In this aspect to
ensure interoperability, MPEG and 3GPP has developed a new standard called Dynamic
Adaptive Streaming over HTTP (DASH) [1]. In DASH, each video is fragmented and
stored with different quality parameters (e.g., resolution, frame rate etc.). The adaptation
process at the client request the server to stream the appropriate quality segment based
on the prevailing network bandwidth [2]. The present heuristic algorithms fail to respond
an abrupt change in network bandwidth, which leads to freeze in the video at play, thereby
degrading the quality of experience [3]. Furthermore, a new approach is needed in DASH
in implementing live streaming.
In live streaming, even a highly adaptive buffer management technique which
involves client monitoring the upper and lower threshold of the play out buffer, may not
produce good result as content rate depends on live capturing mechanism at the source.
This clearly justify the need for the on the fly Scalable Video Coding (SVC) mechanism.
The SVC can support frame by frame adaptation provided the system permits to switch
the video layers dynamically [4].
The user data traffic in wireless mobile network has been increasing rapidly
across the globe. As per the Cisco Visual Networking Index [5], the 4G wireless network
will have the highest stake (40.5 %) of total mobile connections worldwide, and 75% of
the global mobile data traffic will be video by 2020. Such remarkable progress is fueled
by the video streaming service over internet by YouTube, Netflix, etc. The ever
increasing number of smart phones with internet access over 4G wireless network is
another reason for the tremendous increase in streaming video traffic.
The ultimate objective of all streaming services is to deliver seamless content to
the end user in real-time, though it poses a huge challenge due to large fluctuating
bandwidth in the network. To provide user the seamless multimedia service with
maximum achievable Quality of Experience (QoE), the media content in particular video
need to be adaptive to match the available bit rate in the network. The traditional
streaming method based on progressive download fails to cope up with dynamic network
traffic [6] thereby degrading the media quality.

3
The streaming techniques [7] are classified into three major classes: i. Traditional
Real-time Transport Protocol (RTP)/ RTP Control Protocol (RTCP), ii. Progressive
streaming (HTTP/TCP), and iii. Adaptive streaming (HTTP/TCP, UDP). The HTTP
based Adaptive Streaming (HAS) has exhibited resilience to the internet traffic and hence
widely used as DASH in the present systems. The use of DASH in entertainment based
utilities, where the stored videos are being streamed to the client, requires segment based
information and pre-defined streaming parameters to facilitate ease in deciding the
upcoming bandwidth changes. However in live streaming where the video content is
created and encoded only when the systems connect in real time over the network, the
adaptability of DASH to intimate the sender about the link bandwidth becomes an
encumbrance for targeting an improvement in the perceived quality of video by the user
[8].
1.4 CASE STUDY OF AVAILABLE DATA RATES
1.4.1 Bit Rate in 3G and 4G Wireless Networks
One of the main motivating reasons to develop an adaptive SVC based video
streaming system here arises from the study of available bit rate in existing wireless
internet dongles (3G and 4G). Although the system supporting these devices have been
designed to meet the standard specification, in practice there is a lot of gap between what
is mentioned by the service provider and the actual resource available to the end customer
due to various reasons. Fig.1.1 shows the observation of a 3G dongle employing CDMA
1xEVDO Rev-A technique and a 4G dongle based on LTE TDD Category-3 system. The
measured data rate not only varies from locations to locations but also fluctuate in time.
(a) Data rate observed on a Reliance Netconnect+ (CDMA 1xEVDO Rev-A) 3G dongle
4
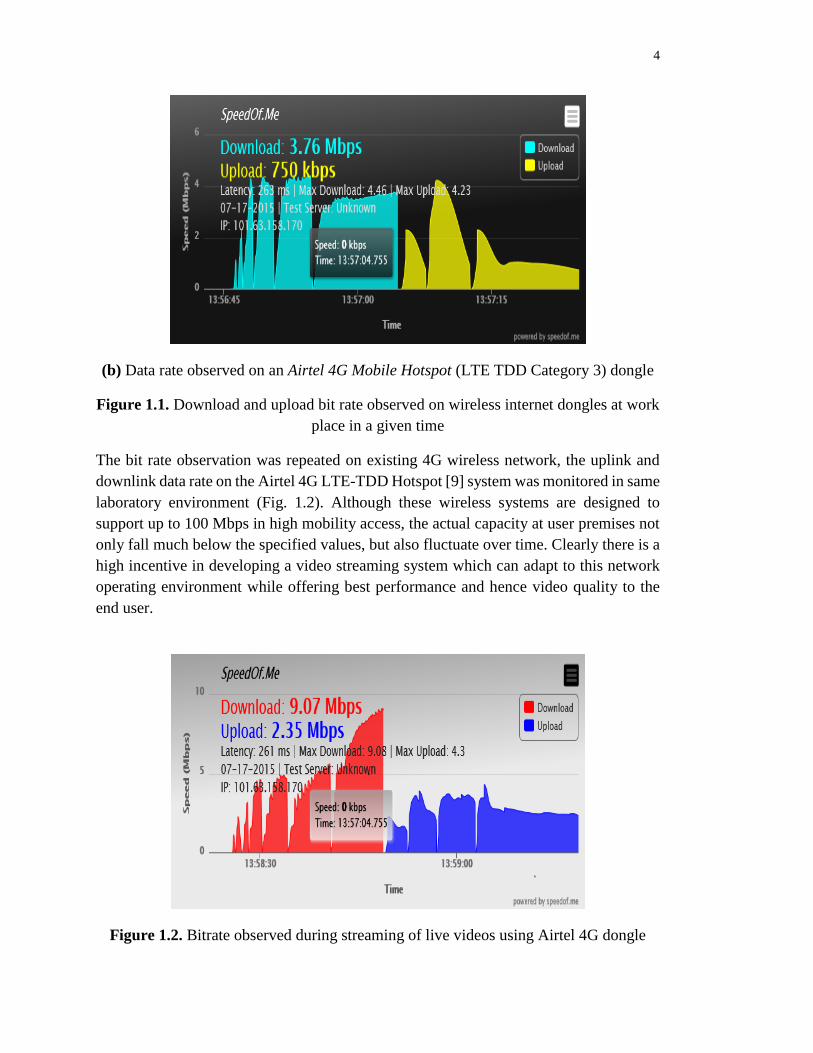
(b) Data rate observed on an Airtel 4G Mobile Hotspot (LTE TDD Category 3) dongle
Figure 1.1. Download and upload bit rate observed on wireless internet dongles at work
place in a given time
The bit rate observation was repeated on existing 4G wireless network, the uplink and
downlink data rate on the Airtel 4G LTE-TDD Hotspot [9] system was monitored in same
laboratory environment (Fig. 1.2). Although these wireless systems are designed to
support up to 100 Mbps in high mobility access, the actual capacity at user premises not
only fall much below the specified values, but also fluctuate over time. Clearly there is a
high incentive in developing a video streaming system which can adapt to this network
operating environment while offering best performance and hence video quality to the
end user.
Figure 1.2. Bitrate observed during streaming of live videos using Airtel 4G dongle

5
1.5 SYSTEM ARCHITECTURE
The traditional approach of link bandwidth estimation at the client/server used to
send a ping packet to the server/client and calculate the bandwidth with reference to the
time taken by the packet to return. This approach is not accurate as there are many factors
like instant congestion that can delay the arrival rate of a ping packet. Thus the best
approach to this problem will be to estimate the link capacity at the receiver/client by
analyzing incoming bit stream on the fly. The incoming bit rate can be sampled
periodically to send a feedback message to the server to carry out any remedial action on
the outgoing stream such that the end user enjoys a best quality of content all the time.
Fig.1.3 shows a schematic of proposed system where client applies a predefine algorithm
to estimate the incoming bit rate and report to the server. The action in the loop needs to
be fast enough to respond the real-time requirement of the video communication.
Figure 1.3. The schematic of an adaptive video streaming
1.5.1 The Client Server Approach
The proposed system architecture consists of two modules at the server side
(Fig.1.4) to acquire and stream live/stored video and three modules at the client side
(Fig.1.5) to receive, analyze, and play video. The server captures the live video stream
through a high-definition (HD) video camera connected locally. The video stream is then
encoded by a H.264 based codec. The live video stream is then streamed to the client,
which is connected through a 3G wireless network. After receiving N frames (say N=100)
of video steam the client starts playing it and simultaneously it also estimates the
incoming bit rate of the video. A pattern estimate algorithm is applied on the receiving
bit rate to pass feedback to the sender. If the pattern suggests that the bitrates are either
high or low and point towards a degradation, a response message is sent to the server to
make suitable changes to the video stream.
6
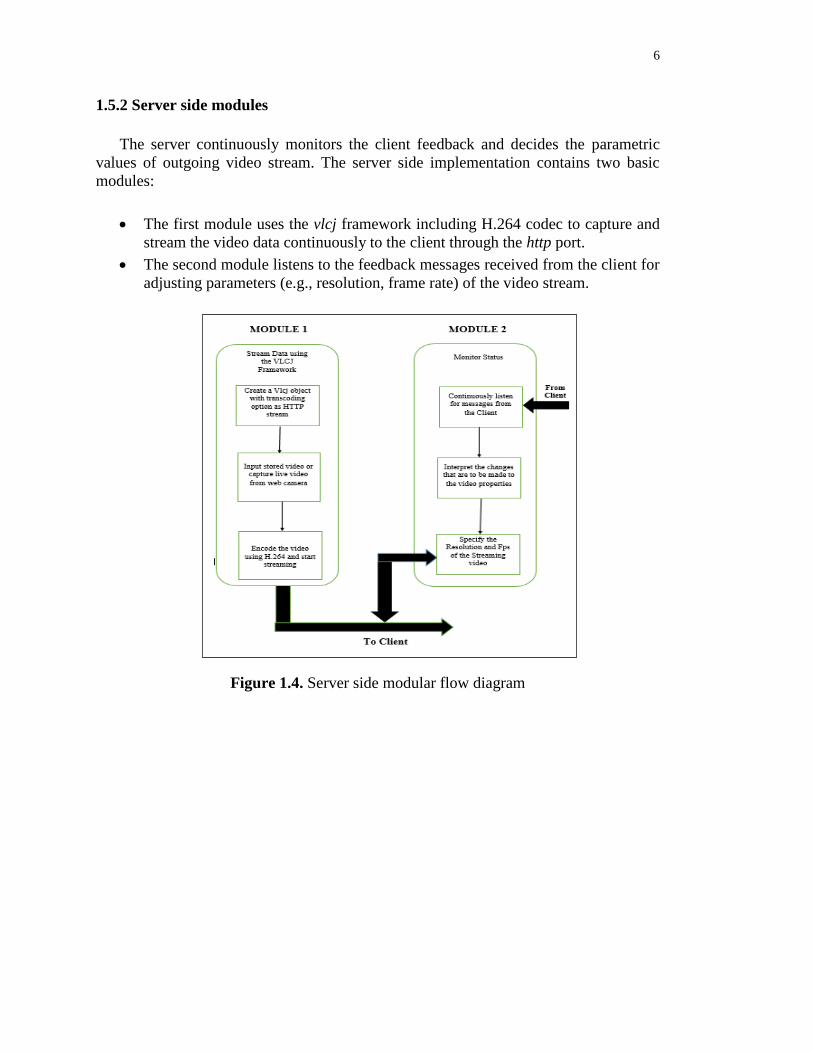
1.5.2 Server side modules
The server continuously monitors the client feedback and decides the parametric
values of outgoing video stream. The server side implementation contains two basic
modules:
The first module uses the vlcj framework including H.264 codec to capture and
stream the video data continuously to the client through the http port.
The second module listens to the feedback messages received from the client for
adjusting parameters (e.g., resolution, frame rate) of the video stream.
Figure 1.4. Server side modular flow diagram

7
Figure 1.5. Client side modular flow diagram
1.5.3 Client side modules
The client analyses the incoming bit stream periodically to find out the pattern of
variation of receiving bit rate. The client side contains three modules:
The first module uses the vlcj framework to play the stream of data received from
the server.
The client system is responsible for estimating the bit rate from the received video
and applying the algorithm to analyse the pattern of bit rate which is performed
by module 2.
The main job of the third module is to pack the feedback messages in agreed
format and send to the server.
1.6 THE ITU-T RECOMMENDATION
The system performance needs to be evaluated using standard parameters and
procedures. As per the ITU-T recommendation (J.247) on “objective perceptual video
quality measurement”, the full reference measurement method can be used when the
original reference video signal is obtainable at the receiver (decoding point), and hence
it is suitable to test an individual equipment or a chain in the laboratory [10]. The
assessment techniques are applied on video in QCIF, CIF, and VGA format for testing.
As listed in Table 1.1, these test factors provide a very low to high quality input to assess
the system under test conditions. The proposed system intends to utilize these parameters
with corresponding standard values for validation and testing.

8
Table 1.1. Test Factors as per the ITU-T J.247
S.No. Parameters Values
1 Transmission Errors with packet loss
2 Frame rate 5 fps to 30 fps
3 Video Codec H.264/AVC (MPEG-4 part 10),
VC-1, Windows Media 9, Real
Video (RV 10), MPEG-4 Part 2
4 Video
Resolution:
QCIF, CIF, and
VGA
QCIF: 16 - 320 Kbps
CIF: 64 - 2000 Kbps
VGA:128 - 4000 Kbps
5 Temporal errors
(pausing with
skipping)
Maximum of 2 seconds
1.7 ORGANIZATION OF THE REPORT
The chapters of the report are organized as follows:
The Chapter 1 provides the general overview and case study about the adaptive
video streaming technology and overall system architecture.
The Chapter 2 starts with adaptive video streaming over http by pattern matching
and proceeds to explain about the Buffer Filling Algorithm and its implementation
details, finally ends with results and discussion.
The Chapter 3 provides an overview of the Auto Regressive Integrated Moving
Average (ARIMA) Based Bit Rate Adaptation (ABBA). Then the system
modelling and algorithm development with implementation details are given. The
section ends with results and discussion.
The Chapter 4 starts with the details of machine learning approaches used for the
adaptive video streaming and proposed system architecture. Then the machine
learning algorithms used in the project is explained with implementation details.
The chapter ends with results and discussion.
The Chapter 5 provides the overall conclusion of the project along with the details
of further improvements and the scope for extension of project in future.

9
CHAPTER – 2
ADAPTIVE VIDEO STREAMING OVER IP BY PATTERN
MATCHING
2.1 EXISTING APPROACH
Understanding the theory behind the bit rate adaptation and analysing factors like
video segment scheduling, selection of bit rate, and bandwidth assessment with respect
to the performance of commercially available solutions like SmoothStreaming, Akamai
HD, Netflix, and Adobe OSMF could be rewarding [11]. Further, a proper modelling of
the main process i.e., automatic switching of video stream in the system adopted by these
commercial (video streaming) service provider, helps in improving system design as it
involves analysis of feed-back control loops [6].
In HTTP based Adaptive Streaming (HAS), the switching of video i.e., bit-rate
stream at client dictates the main parameter of quality of experience (QoE) [12]. The
analytical model/framework of QoE needs to include the probability of play out buffer
getting drained, running playback time, average quality of video etc. The client system
can estimate buffer level over time, and there is need to maintain balance between the
stability of buffer and quality of play out video [13]. Hence, any adaptation on layer
switching in SVC needs to accommodate the probability of buffer underflow of the
receiver [4].
There has been considerable interest in MPEG – DASH by many researchers. A
proper mapping between DASH layers and SVC layers can not only help in estimating
needed bitrates, but also enhancing the video throughput with reduced overhead of the
HTTP messages [2]. It could be further rewarding to work on scheduling and resource
allocation through a cross-layer approach which include DASH and radio layer. The
DASH can be implemented to support streaming to hand-held mobile devices through
multiple wireless network interfaces, but not only the energy efficiency but also the cost
of service becomes an important factor [14-15]. Some researchers [16] have argued that
when HAS occupies a considerable fraction of the total internet traffic and multiple HAS
clients start competing at a network resources, it will result in problem of its fair share of
bandwidth and a possible solution could be a probe and adapt policy. Furthermore, a HAS
client can apply machine learning of reinforcement type to adapts its behaviour leading
to the optimization of its quality of experience [17].
2.2 ALGORITHM DEVELOPMENT
The proposed algorithm analyses periodically the sampled data (bit rate) and provide
solution to the fluctuating available resource in the network. The fluctuating received bit

10
rate is categorized it into any one of the predefined pattern (Fig.2.1). The algorithm at
receive includes local maxima and minima of sampled data before it concludes the pattern
as either of (i) Progressive, (ii) Stabilized, (iii) Fluctuating, and (iv) Degraded. Sometimes
it may declare status as non-monotonic where it needs to find the RMS value. The
algorithm at server side decodes the received message from the client and decides the
video stream accordingly. The server also considers switching time as a metric in
deciding change in outgoing stream. Any error in estimating pattern at client will result
in non-remedial action by the server.
2.2.1 Client side algorithm
1) Read the bitrates and store in a buffer.
2) Find local maximum points and store it in an array “Lmax”
i) Read bitrates in pairs of 3 // i.e., v1, v2, v3
ii) If v1 < v2 > v3, add v2 to Lmax array // set max.
iii) Continue the process for the all the frames received.
3) Find local minimum points and store it in an array “Lmin”
i) Read bitrates in pairs of 3 // i.e., v1, v2, v3
ii) If v1 > v2 < v3, add v2 to Lmin array // set min.
iii) Continue the process for the N (N=100) frames received.
4) Max = Analyse (Lmax) // Call function to get α, β, γ
5) Min = Analyse (Lmin)
i) If max = β and min = β, set status as Progressive.
ii) Else if max = β and min = α, set status as Stabilized.
iii) Else if max = α and min = β, set status as Fluctuated
iv) Else if max = α and min = α, set status as degraded.
v) If max = γ or min = γ, Set status as non-monotonic and call
Find_rms(Bitrates)
2.2.2 Analyse (Bitrates)
1) Find start
2) Find end
3) Locate median
4) If (start, median, end) are monotonically increasing, Return β
5) Else if (start, median, end) are monotonically decreasing, Return α
6) If (start, median and end) are neither monotonically increasing nor decreasing,
return γ
The system analyses the bitrates and categorize them into four different patterns (Fig.2.1)
and adapts the ongoing session corresponding to each case. Case 1 represents a
progressive type where the network bit rate will increase in time. After some fluctuation
the bit may tend to become stable (Case 2). There may be a case when pattern of change
in bit rate may diverge (Case 3). If the received bit rate continues to fall, it represents a
serious problem in maintaining quality of service (Case 4).

11
Figure 2.1. Different bitrate patterns
If the system is unable to resolve into any of these categories, it will resort to a root-
mean-square (RMS) value.
2.2.3 Find_rms (Bitrate)
1) Find the RMS value of the bitrates.
xxx nrms nX
22
2
2
1....1 (2.1)
2) Split the N different (N = 100) bitrates into M parts (M = 3)
3) Repeat the first step to find the RMS values of the each (three) parts. Let them be
rms1, rms2, and rms3
4) Find the difference between the total RMS value and the RMS values of the
parts.
i) Compute Diff1 = RMS - rms1
ii) Compute Diff2 = RMS - rms2
iii) Compute Diff3 = RMS - rms3
5) If (Diff1 <= Diff2 <= Diff3), then return 1
6) Else if (Diff1 >= Diff2 >= Diff3), then return 0
7) Else return 2

12
2.2.4 Server side algorithm
// S = Spatial Resolution, T = Temporal Resolution
S = {S1, S2, S3, S4}, T = {T1, T2, T3, T4, T5}
1) Initially set the resolution in QCIF at default value, Td
2) Repeat
i) Receive status from the client
ii) If status = Good
a) Continue with same configuration.
iii) Else if status = Stable
b) Experiment with increased temporal resolution.
iv) Else if status = Fluctuated
c) Find_Switching_time (bitrate).
v) Else if status = Degraded
d) Reduce both spatial and temporal resolution.
vi) Else if status is non-monotonic
e) Wait for next feedback to make change
3) Until connection is terminated
2.2.5 Find_Switching_Time (Bitrate)
1) Quality switching time Tswitch = TQk+1 - TQk //where TQk+1 is the time-instant at
the end of kth quality request processed and TQk is the current time instant serving
previous quality request.
2) Start a timer when each quality switch is encountered to find the time needed to
switch from one quality level to another.
3) Wait till next feedback from the client.
4) If (Tswitch > Fluctuation_time)
i) Do not alter the quality and wait till next feedback from the client
5) Else, Alter the quality as per the current request.
2.2.6 Buffer Filling Algorithm
The buffer filling algorithm was implemented independently here which is based
on traditional adaptive stream control method. The system at the client monitors the lower
and upper threshold of the play out buffer and submits the report to the server. If the
buffer reaches the upper threshold it ask for slowing down the stream rate but if the
arriving contents approaches the lower threshold it signals the server to speed up the
transfer rate. The server reduces or increases the stream bit rate by changing the video
frame resolution and/or dropping frames accordingly.

13
2.3 IMPLIMENTATION ENVIRONMENT
We considered four standard video resolutions namely SQCIF, QCIF, CIF, and
QVGA to be adopted dynamically by the server based on client feed-back. The four
temporal resolutions (in fps) was: 10, 15, 25, 30, and 35; whereas the default frame and
also initial set-up was fixed at 30 fps. The server system was programmed using our
proposed algorithm to choose any of these combinations (spatial and temporal) to match
the available outgoing bit rate in the communication channel. The wireless internet
connectivity was established by a dongle, Reliance Netconnect+ [18] which works on
CDMA 1x RTT & CDMA 1xEVDO Rev A. As per the specification mentioned by the
service provider it is intended to provide a download speed up to 3.1 Mbps and up to 1.8
Mbps in uplink, but according to a real-time test conducted with the help of an online tool
by SpeedOf.Me [19] the average uplink speed was found to be 0.54 Mbps and the average
downlink rate was 0.45 Mbps during the experimentation. The internet bit rate fluctuation
in Reliance Netconnect+ in real-time during test and measurement provided us the perfect
platform to asses our proposed algorithms. The client and server were implemented on
Dell Inspiron N5010 desktop computer separately which is configured with Intel®
Core™ i7-3770 [email protected] GHz processor and 8 GB RAM. The Window7 Professional
32-bit operating system was installed to run the client/server program. The streaming
operation was carried over http with UDP protocol.
2.3.1 Video Streaming and Bitrate Estimation in Java Framework
The VLCJ in a Java framework is used here as an instance of a native VLC media
player. It helped in a higher level framework while hiding a lot of the intricacies of
working with VLC libraries. Since VLC supports many video/audio formats under
libavcodec it play back the H.264 streamed video. JPCAP provide a packet capture
function (library) for the network applications in Java specifically to analyse the real time
network data. It is used here at client side to estimate the bitrate of the incoming video
and to store it in a buffer (array) where the client program continuously evaluate it for
further action.
2.3.2 Parameters Used to Evaluate the System Performance
Since the targeted application here is a high quality video communication services
including tele-medical video, the full reference (FR) methods were used to evaluate the
system performance. Moreover FR metrics usually provide the most accurate result. The
two commonly used FR parameters are: Peak Signal to Noise Ratio (PSNR) and
Structural Similarity (SSIM) index. One of the main aims of implementation here is that
the system response to the changing network resource should result in higher PSNR and
SSIM provided the communication link is maintainable.

14
2.3.2.1 Peak Signal to Noise Ratio (PSNR)
The PSNR reveals the overall degradation of processed video signals and it can be
computed on luminance value (ITU-T recommendation [20]) and usually it is represented
on a logarithmic scale as:
)(log20 10
mMSE
MaxPSNR (2.2)
where Max = 2no. of bit/sample - 1 and for 8-bit per luminance value it is 255. The MSE(m)
is the mean square error which is the difference between the reference video and degraded
video in the mth frame, and it is computed as:
M
i
N
j
inout mjiYmjiYNM
mMSE1 1
2),,(),,(
1)( (2.3)
The PSNR measurements were carried out on few selected decoded frame at the receiver
resulting from the application of proposed adaptation algorithms. It was basically an
offline process where at the end of experiment the recorded data were compared and
analysed. The system was targeted to maintain an average PSNR of not less than 30 dB.
2.3.2.2 Structural Similarity (SSIM) Index
The SSIM index provides knowledge about perceived degradation due to structural
deformation in an image reconstruction. In video pixels have not only the temporal
dependency but also the spatial inter-pixel dependency. The spatial dependency offers
details about structure of the objects in an image and hence SSIM becomes important
quality evaluation parameters in video communication. The SSIM index is evaluated on
three different measures, the luminance, contrast, and structure comparison which is
defined by the Joint Video Team (JVT) of ISO/IEC MPEG & ITU-T VCEG as [21]:
1
22
12),(
C
Cl
yx
yx
yx
(2.4)
2
22
22),(
C
Cc
yx
yx
yx (2.5)
3
3),(
C
Cs
yx
xy
yx
(2.6)
where µx is the average of x, µy is the average of y, σx2 is the variance of x, σy
2 is the
variance of y, σxy is the covariance of x and y. The constants C1 , C2 , and C3 are given by
C1 = (K1 L)2 , C2 = (K2 L)2 and C3 = C2 / 2, which are to stabilize the division with weak
denominator. L is the dynamic range of the pixel values given by L = 2no. of bit/pixel - 1 and
K1<<1 and K2<<1 are two scalar constants.

15
Based on these metrics, the SSIM is formulated as
),(),(),(),( yxyxyxyx sclSSIM (2.7)
where α, β, and γ state the different weightage assigned to each measure.
The single scale SSIM is now formulated as [22]:
𝑆𝑆𝐼𝑀(𝑥, 𝑦) =(2𝜇𝑥𝜇𝑦+𝑐1)(2𝜎𝑥𝑦+𝐶2)
(𝜇𝑥2+𝜇𝑦
2+𝐶1) (𝜎𝑥2+𝜎𝑦
2+𝐶2) (2.8)
The aim of the proposed system was to maintain the SSIM index above 0.95. Like PSNR
the SSIM too was computed offline on stored data at the end of experimentation.
2.4 RESULTS AND DISCUSSION
2.4.1 Inter-packet Arrival Delay
The variation of packet delay as a difference in end-to-end one-way
delay between selected consecutive packets in a flow with any lost packets being ignored
was observed during experimental set of video communication. The observed random
variation in delay (Fig.2.2) is attributed to the prevailing internet traffic during test and
measurement period on 3G wireless modem (dongle) used to connect with the internet.
Although maximum delay requirement was not directly dealt with the proposed
algorithm, the bit rate was adjusted by the server to meet the targeted quality. For the data
shown in Fig.2.2 the average inter-packet delay is 69µs.
Figure 2.2. Inter-packet delay

16
2.4.2 PSNR Measurement
The PSNR measurement (Fig.2.3) was carried out on three approaches: (i)
Without any adaptation mechanism, (ii) Buffer filling algorithm, and (iii) the proposed
adaptation method. The proposed algorithm helps in achieving an average PSNR of
36.267 dB which is 37.53% higher compared to the buffer filling algorithm. Further it is
much higher than the without adaptation approach. This reward of increase in PSNR is
attributed to the high adaptation exhibited by the proposed method in real-time scenario
which in turn permitted underlying networks to deliver packets with fewer losses.
Figure 2.3. PSNR Measurements
2.4.3 SSIM Index
The SSIM index was computed in a similar way as that of PSNR on the three
methods i.e., without adaptation, buffer filling algorithm, and proposed algorithm
(Fig.2.4). The proposed algorithm offers 5.7% higher average SSIM value than the buffer
filling algorithm and much higher than the without adaptation approach. Because of
dynamic adaptation it was possible to retain and maintain the structural information
thereby resulting in higher SSIM index value. Although the system designs do not include
any parameter to retain the structural similarity during play out, a higher SSIM value is
an additional reward of in time adaptation.

17
Figure 2.4. SSIM Index comparison
2.4.4 Some Selected Original and Received Decoded Frame
Fig.2.5 and Fig.2.6 show the original and received decoded frames captured
during live video streaming and recorded Foreman video [23] respectively. Even a closer
look at these frames does not reveal a noticeable loss in decoded video quality, which is
highly desirable in high quality video communication services.
Figure 2.5. Some selected frame from live video stream: Original (above) and received
(below)
Figure 2.6. Some selected frame from stored Foreman video [23]: Original (above) and
received (below)

18
CHAPTER-3
ARIMA BASED ADAPTATION METHOD
3.1 OVERVIEW
The variations of incoming bit rates while the video is being streamed can be
analogized to a time series to rigorously analyze the past observations to make forecasts
about network conditions. The limitations of traditional linear regressive models need to
be rectified where the seasonality of a regularly repeated pattern could be eliminated with
increased focus towards accurate predictions. In this paper, a new algorithm based on a
non-linear stochastic model called, Auto Regressive Integrated Moving Average
(ARIMA) Based Bit Rate Adaptation (ABBA) is proposed. The ABBA algorithm is
modeled on a time series consisting of sequence of sampled bit rate over a continuous
time interval to analyze a successive statistical measurement that has no natural ordering
for the observations. This stochastic model is used for trend analysis of the forthcoming
bit rates, which decides the resolution of video to be sent from the server. The strategic
decisions are based on the successive observation of sampled bit rate in a regular time
interval to understand the nature of series.
To analyze the performance of the proposed ABBA algorithm, two existing
approaches: i. Heuristic Decision Rate Adaptation (HDR), and ii. Buffer Switching Rate
(BSR) algorithms has been formulated and developed here. The HDR [24] employs the
difference in arrival time of packets and buffering time as inputs for predicting the near
future using a set of decision rules whereas the BSR monitors the buffer occupancy [25]
level dynamically and chooses the mode of operation based on its fill percentile using
harmonic mean to effectively identify the nature of network for streaming the videos.
The ABBA, HDR, and BSR algorithm were implemented using VLC Framework
in Java (VLCJ) that is completely open source and can easily be plugged into to the
existing systems. The system level implementation was in adherence to the ITU-T J.247
recommendation (Table 3.1) that describes about the ‘objective perceptual multimedia
video quality measurement’. The developed system were tested for delay variability ITU-
Y.1540 [26] and quality of video were observed using PSNR ITU-R J.340 [27] and VQM
ITU-J.149 [28] along with other standard popular video quality evaluation metrics.

19
Table 3.1. Test factors as per ITU guidelines
Parameter Standard Metrics
Frame Rate
ITU –T J.247
5 to 30 fps
Codec H.264
Resolution QCIF,CIF,VGA
Temporal errors <=2 sec
Min bandwidth
Required
QCIF 16 kbps to 32kbps
CIF:64 kbps to 2Mbps
VGA 128 kbps to 4 Mbps
Performance Metrics
ITU-R J.340 PSNR >=25
ITU-T Y.1540
Delay Variation
(Quantile and min delay difference
should not be >50 ms)
ITU-T J. 149 VQM [0-1]
3.2 SYSTEM ARCHITECTURE
3.2.1 The Client Server Model
The proposed system architecture emulates the client server model where server’s
job gets simplified on the expense of client’s increased monitoring and analysis process.
The server consists of three sub modules: i. Frame capture, ii. Streaming the video, and
iii. Receiving feedback. On the other hand, the client consists of three modules: i. Decoder
/ Player, ii. Stream flow analysis, and iii. Receiver’s feedback. The video being streamed
is encoded dynamically using ITU-T H.264 [21] video codec. The live (or stored) video
is streamed from the server to client through 4G wireless networks and the client
scrutinizes the link bandwidth and analyses its trend to make an intelligent decision based
on prevailing scenario. This decision is sent as a feedback to server which tries to match
channel capacity and the sends the video at corresponding resolution and frames per
second.
The client samples the incoming bit rate and monitors the pattern with an aim to analyze
and predicts the near future bandwidth. The server is notified with the predicted link
capacity which in turn responds with content adaptation process. The bit rates of packets
are related to a time series model where a set of data points denotes the bit rates over
successive time. The sampled data are arranged in a proper chronological order
continuously and the past observations are analyzed to develop a mathematical model
(ABBA algorithm) that captures the underlying data to make strategic decisions. This
parametric approach considers that the underlying stochastic process has a certain
structure which can be described using two parameters: auto-correlations and auto-
covariance to forecast the future bit rates using regression.

20
3.2.1.1 Sender Sub-modules
The server’s main job is to acquire the media content live from the camera or fetch
from a memory location in case of a stored video. The following modules represent the
workflow of streaming at the server side (Fig. 3.1).
a) Init: This module initializes the VLCJ player and identifies the media locator
required for transmission.
b) Stream: It is used to establish connection with the requesting client using sockets
while creating instance of player to stream at required quality.
c) Adapt: This module receives message from the client and uses this feedback to
adapt to the network prevailing conditions by interpreting the data from client to
make a strategic decision.
Figure 3.1. Server side modules
3.2.1.2 Receiver Sub-modules
The following modules illustrate how the client analyses (Fig. 3.2) the link instability
based on ABBA Algorithm.
a) Playback: The client requests the sender to start streaming and initiates
connection with the sender in an appropriate port using HTTP.
b) Analyze: The client analyzes the incoming bit rate of packets to ascertain how the
link will support stream in near future using ABBA algorithm.
c) Send Feedback: The client creates a message based on defined format of feedback
and makes an intelligent decision to alert the sender.
Capture video
Set the media player
locator
Init VLCJ Player and set
trans coding options Interpret the message after
continuous listening
Modify the parameters based
on decision
Set instance of ML
and stream
INIT ADAPT
STREAM
Instantiate the
media resource
locator
LibVlc objects are
created with Player
Factory
Stream in the linked port
with the requesting client
MAIN

21
Figure 3.2 Client side modules
3.3 SYSTEM MODEL
The client side of the proposed system has higher complexity than the server, and it
applies stream analysis algorithm to handle the non-linearity in the incoming traffic as
they may vary rapidly over time that is too complicated to fit into any specific predefined
classes. A heuristic based stochastic algorithm is formulated to overcome the existing
problems and ensure delivery of higher quality videos in the prevailing circumstances.
Based on the predicted link behavior the client identifies the trend of the series that is
labeled as i. Advancing, ii. Degrading, iii. Oscillating, and iv. Stable. The traffic load in
the network could momentary increase/decrease or prolong to increase/decrease. The
projected incoming flow rate is then sent to the server as a feedback for it to adapt
effectively and modify its parameters instantaneously.
3.3.1 Stochastic Prediction Model
There is need to explore a suitable statistical model which captures the dynamics
of incoming bit rate and maps to a time series model that can be used to predict the future
trend considering the current network conditions.
Request server
for video
Establish connection
using sockets
Create a new instance
of VLCJ to play
Synchronization of multi
threads Compute media
statistics using ABBA
Inspect the trend and
forecast the
succeeding changes
Create status
code for
transmission
Populate the message
based on strategic
decision
Send feedback in the
linked port
PLAYBACK SEND
ANALYSE
Inbound
measurement of
packet bitrate
Compute AIC
MAIN

22
3.3.1.1 Auto-regressive (AR) Component
The Auto-regressive (AR) part is used to establish the covariance between the bit
rates fluctuating over time [29] that can be used to foresee how the variations would take
place in the future.
Auto_Reg = Li
p
ii
1
1 (3.1)
Where ϕi represent covariance and Li lag operator for ith packet, and p denotes the number
of bit rate samples taken over time.
The covariance ϕi signifies a statistical relationship between bit rate and time that is used
for trend analysis and foresees the upcoming bit rates, which is expressed as:
stX sX tE ,
(3.2)
Where µt and µs represents the mean associated with the random variables Xt and Xs.
3.3.1.2 Auto Regressive Integrated Moving Average (ARIMA) Model
Considering Xtp to be predicted bit rate where ‘tp’ denotes the index number,
ARMA(p,q) model with the integration of correlation factors is defined as:
tLiq
iiX tpLi
p
ii
1
1'
1
1 (3.3)
Where Li is the lag operator, αi is the autoregressive part (Auto_Reg) and θi is the moving
average part (Mov_Avg) of the model linking the correlation between the successive time
windows under evaluation for the ith packet.
Now, the Auto_Reg polynomial would have a unitary root of multiplicity d when applied
to a non-linear stochastic process where the first order differencing of a characteristic
equation is non-stationary as
)1('
1
1'
1
1 L dLi
dp
iiLi
p
ii
(3.4)
The stationarity here refers to the time series bit rate based model whose variance and
auto correlation structures do not vary over time.

23
Integrating polynomial (3.4) with the Moving Average component (Mov_Avg) [30] to
determine the future sequence by factorization of p = p’ - d would give rise to ARIMA
model as
Liq
iiX tpL d
Lip
ii
1
1)1(1
1 (3.5)
The ARIMA in (3.5) can be generalized by adding a stochastic drift constant δ that
denotes the change of average of bit rates in a continuously changing process that is
modeled as a regression drift constant given by
Liq
iiX tpL d
Lip
ii
1
1)1(1
1 (3.6)
Now, the near future bit rates Xtp and trend of bandwidth fluctuations can be predicted to
notify the server so that it can adapt accordingly as in (3.7) that integrate the correlation
and variance into a form of regression.
)1(1
1/
1
1' L dLi
p
iiLi
q
iiX tp
(3.7)
Where )1(1
1/' L dLi
p
ii
(3.8)
3.4. ALGORITHM DEVELOPMENT
There is a need for a standard benchmark criterion to ascertain if the model
predicts relatively accurate value and in this context the Akaike Information Criteria
(AIC) [31-32], is embedded in the proposed ABBA algorithm which helps in fine-tuning
the quality of prediction model. The AIC act as a quality gauge in mathematical models
using statistical parameters that computes the quality of a single model which is used as
one of decision parameter.
To compare the performance of the ABBA algorithm, two existing approaches: (i) Buffer
Switching Rate (BSR) adaptation, and (ii) Heuristic Decision based Rate Adaptation
(HDR) method is formulated and presented here.
3.4.1 ARIMA Bitrate Based Adaptation (ABBA) Algorithm
The sliding window size used for analysis can be incremented using a constant
factor inc_fac that could be predefined to overcome the stationarity issues based on the
sample data points taken into consideration.

24
ABBA Algorithm:
Input: Bit Rates of packets for a Period of Time
Output: Forecasted Bit Rate for the next sequence of packets
1. Start streaming of video content
2. Sample the data rate by choosing a sequence of packets
3. Initialize N, inc_factor, p, q, d, k for AIC.
4. Compute µr, µs, µt. // Calculate mean
5. While (i<N) // Take N samples
6. If (µr = = µs) //Test for stationarity
7. If (Cxx(r,s) == Cxx(r-1, s-1)) // Cxx is the covariance
8. N = N + inc_factor // Increment window size
9. for i = 1 to m
𝑎(𝐿)𝑋𝑡 = 𝑋𝑡 − 𝑎𝑖𝑋𝑡−𝑖
𝑑
𝑖=1
10. Evaluate the Lag Operator
11. Evaluate the variance σs and σr
𝜎 = (𝑋𝑖− 𝑋𝑎𝑣𝑔 )2𝑛
𝑖=1
𝑛−1
12. Compute θ as stated in (3.1) // Moving Average
13. for j=1 to q // q is no of sample points chosen
14. Evaluate Auto_Corr = θ * L // Correlation
14. if (Auto_Corr!=0)
15. Compute Φ as shown in (3.2) // Auto Regression
16. for k=1 to p
17. Evaluate Auto_Var = Φ * L // Covariance
18. if (Auto_Var>0)
19. Compute the forecasted Xtp using (3.7)
20. Compute variance as shown
𝜎(𝐴𝐼𝐶) = (𝑋𝑖 − 𝑋𝑡𝑝 )2𝑛
𝑖=1
𝑛 − 1
21. Calculate the Akaike Information Criteria
𝐴𝐼𝐶 𝑖 = log 𝜎 +2𝐾
𝑁
22. else
23. N= N + inc_factor //Increment Window size
24. end for
25. Find the p,q,d that corresponds to the maximum {AIC [i]}max in the array
26. Designate the optimal values for p, q, d and repeat from Step 9.
27. Repeat from step 5 until streaming occurs.

25
3.4.2 Buffer Switching Rate (BSR) Adaptation Algorithm
Buffer based switching algorithm [33] considers the current buffer occupancy
level and number of segments of video to provide the best possible quality of streamed
video to the client. The harmonic mean is computed to measure the throughput for the
entire video session and to avoid instantaneous variation of throughputs.
BSR Algorithm:
Input: Segment information, Current buffer occupancy level Cur, Weighted Harmonic
mean download rate Hn
Output: The next predicted bit rate ln+1
1. Read the current buffer occupancy level Cur for nth segment while streaming
2. If (Cur ≤ E1) //Speedy start phase
3. ln+1 = r1 //Choose lowest quality
4. else
5. if
H n
scurn 1
> cur – E1
6.
Es
r curH n
lnn
cur 1
1,0max1
7. Set d = 0 //immediate download
8. else if (Cur ≤ E2) // progressive increase phase
9. if Es
curH n
n
2
1
10. ln+1 = rcur +1 //Increment resolution in steps
11. else
12. ln+1 = rcur // Maintain current level
13. Set d=0
14. else if (Cur ≤ E3 ) // Rapid Shift Phase
15.
E
sEr cur
H nln
n
cur 2
1
2,max1
16. Set d=cur-E2
17. elseif (Cur>E3) // Delayed download
18.
Es
Er curH n
lncur 2
1
3,max1
19. Set d = cur - E2
20. else
21. ln+1 = rcur // Maintain current level
22. Set d=0
23. Repeat the above steps until streaming terminates
26
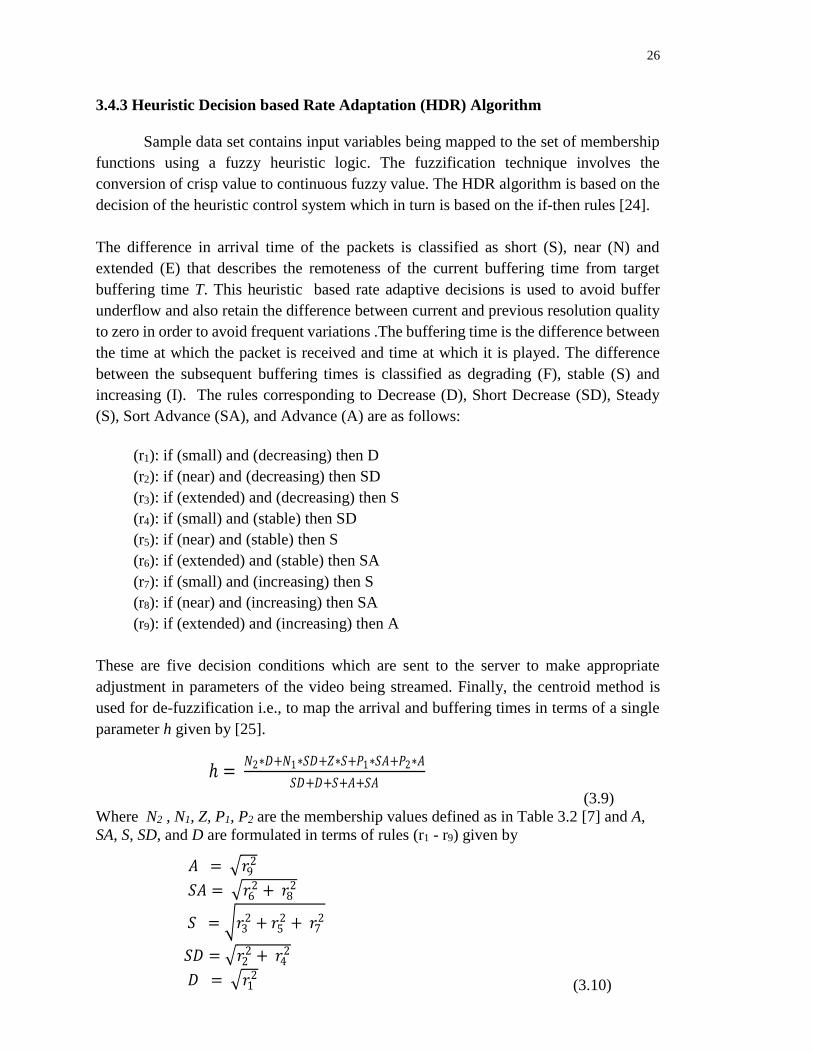
3.4.3 Heuristic Decision based Rate Adaptation (HDR) Algorithm
Sample data set contains input variables being mapped to the set of membership
functions using a fuzzy heuristic logic. The fuzzification technique involves the
conversion of crisp value to continuous fuzzy value. The HDR algorithm is based on the
decision of the heuristic control system which in turn is based on the if-then rules [24].
The difference in arrival time of the packets is classified as short (S), near (N) and
extended (E) that describes the remoteness of the current buffering time from target
buffering time T. This heuristic based rate adaptive decisions is used to avoid buffer
underflow and also retain the difference between current and previous resolution quality
to zero in order to avoid frequent variations .The buffering time is the difference between
the time at which the packet is received and time at which it is played. The difference
between the subsequent buffering times is classified as degrading (F), stable (S) and
increasing (I). The rules corresponding to Decrease (D), Short Decrease (SD), Steady
(S), Sort Advance (SA), and Advance (A) are as follows:
(r1): if (small) and (decreasing) then D
(r2): if (near) and (decreasing) then SD
(r3): if (extended) and (decreasing) then S
(r4): if (small) and (stable) then SD
(r5): if (near) and (stable) then S
(r6): if (extended) and (stable) then SA
(r7): if (small) and (increasing) then S
(r8): if (near) and (increasing) then SA
(r9): if (extended) and (increasing) then A
These are five decision conditions which are sent to the server to make appropriate
adjustment in parameters of the video being streamed. Finally, the centroid method is
used for de-fuzzification i.e., to map the arrival and buffering times in terms of a single
parameter h given by [25].
ℎ = 𝑁2∗𝐷+𝑁1∗𝑆𝐷+𝑍∗𝑆+𝑃1∗𝑆𝐴+𝑃2∗𝐴
𝑆𝐷+𝐷+𝑆+𝐴+𝑆𝐴
(3.9)
Where N2 , N1, Z, P1, P2 are the membership values defined as in Table 3.2 [7] and A,
SA, S, SD, and D are formulated in terms of rules (r1 - r9) given by
𝐴 = 𝑟92
𝑆𝐴 = 𝑟62 + 𝑟8
2
𝑆 = 𝑟32 + 𝑟5
2 + 𝑟72
𝑆𝐷 = 𝑟22 + 𝑟4
2
𝐷 = 𝑟12 (3.10)

27
Table 3.2. List of parameters in HDR [24]
Parameters Value Definition
T 35 sec Target Buffering Time
d 60 sec Time Period estimating
connection throughput
N2, N1, Z, P1,
P2
0.25, 0.5,
1, 1.5, 2
Factors of membership
functions
3.5. IMPLEMENTATION ENVIRONMENT
Different video resolutions namely SQCIF, QCIF, CIF, QVGA, and VGA were used
for the transcoding of the input video at the server side for every streaming instance. The
frames per second (fps) designated for the streaming are 10, 15, 25, 30 and 35 respectively
with the default value set to 25 fps. Java programming environment was used as it is
platform independent and supports VLCJ (VLC for Java). The VLCJ is an open source
framework that is used for video streaming that enables the media content to get
embedded in a Java Swing. Since this platform is completely open source there are many
customizable options available that are deployed for obtaining the media statistics.
Synchronization of multithreads is carried out for communication between the client and
server for transfer of data. Transcoding of input stream i.e., the process of converting
media object from one configuration to another, allows to switch between various
resolutions at the server side. Dshow [34] is the API that is used to capture the video and
process it for streaming in the appropriate format.
The wireless network for experimental set up was established through Airtel 4G LTE-
TDD Hotspot [9] that demonstrated an average of 3.7 Mbps in downlink during real time
testing although it is intended to support more than 8 Mbps as specified by the service
provider. For case study the end-to-end link bandwidth was estimated with the help of an
online tool Speedof.Me [19]. The client and server were implemented in Lenovo idea pad
laptop which has Intel Core i5 processor having 4 GB RAM and Windows 7 Professional
64 bit operating system. The streaming of video was implemented on top of the HTTP
with UDP as its underlying transport protocol.
3.5.1 Performance Evaluation Parameters
Since in our experimental set up original video sequence was readily available,
the Full Reference (FR) metrics were employed to evaluate the system performance.
Further, FR metrics provide the most accurate result as it is computed with direct
reference to the original sequence. The commonly used FR parameters are: Peak Signal
to Noise Ratio (PSNR), Structural Similarity (SSIM) index, Video Quality metric
(VQM), Aligned PSNR (A-PSNR) etc. Although the conventional PSNR is relatively
simple to compute it exhibits imprecise measurement when used to measure the quality
28
of streamed video over wireless network. Since the packet loss in the wireless mobile
network cannot be neglected, more complex metrics like A-PSNR, VQM, and different
types of SSIM are employed for the evaluation of system.
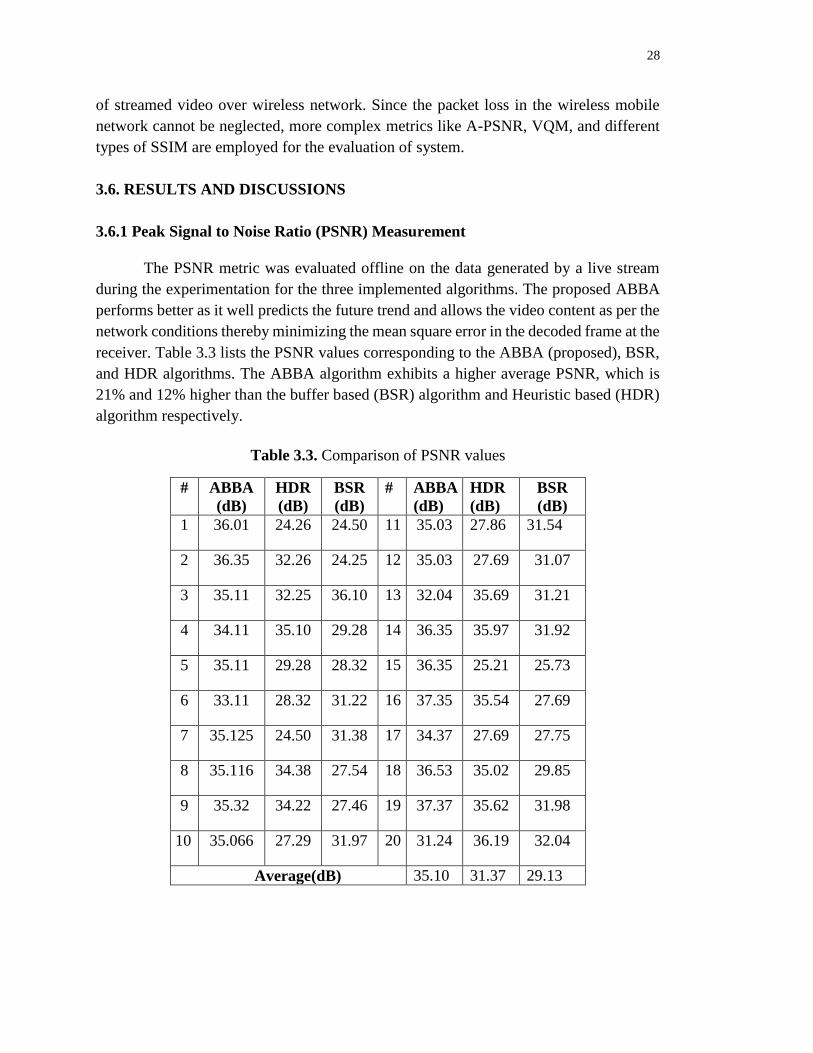
3.6. RESULTS AND DISCUSSIONS
3.6.1 Peak Signal to Noise Ratio (PSNR) Measurement
The PSNR metric was evaluated offline on the data generated by a live stream
during the experimentation for the three implemented algorithms. The proposed ABBA
performs better as it well predicts the future trend and allows the video content as per the
network conditions thereby minimizing the mean square error in the decoded frame at the
receiver. Table 3.3 lists the PSNR values corresponding to the ABBA (proposed), BSR,
and HDR algorithms. The ABBA algorithm exhibits a higher average PSNR, which is
21% and 12% higher than the buffer based (BSR) algorithm and Heuristic based (HDR)
algorithm respectively.
Table 3.3. Comparison of PSNR values
# ABBA
(dB)
HDR
(dB)
BSR
(dB)
# ABBA
(dB)
HDR
(dB)
BSR
(dB)
1 36.01 24.26 24.50 11 35.03 27.86 31.54
2 36.35 32.26 24.25 12 35.03 27.69 31.07
3 35.11 32.25 36.10 13 32.04 35.69 31.21
4 34.11 35.10 29.28 14 36.35 35.97 31.92
5 35.11 29.28 28.32 15 36.35 25.21 25.73
6 33.11 28.32 31.22 16 37.35 35.54 27.69
7 35.125 24.50 31.38 17 34.37 27.69 27.75
8 35.116 34.38 27.54 18 36.53 35.02 29.85
9 35.32 34.22 27.46 19 37.37 35.62 31.98
10 35.066 27.29 31.97 20 31.24 36.19 32.04
Average(dB) 35.10 31.37 29.13
29
3.6.2 Structural Similarity (SSIM) Measurement
The SSIM index was computed for the three algorithms (ABBA, BSR, and HDR),
and the proposed ABBA algorithm exhibited a higher value with an average of 0.9541
which is 9% higher than the buffer based algorithm 7% better than heuristic based
algorithm.
The SSIM index on few decoded consecutive frames at receiver corresponding to ABBA,
BSR, and HDR algorithms is plotted in Figure 3.3. The higher SSIM index for ABBA
algorithm is a reward for the perceived video quality as there is need for the perseverance
of luminance and contrast factors that are influenced by the distortions.
0.8
0.82
0.84
0.86
0.88
0.9
0.92
0.94
0.96
0.98
1 2 3 4 5 6 7 8 9 10
SSIM
FRAME #
ABBA
HDR
BSR
Figure 3.3. The SSIM index
3.6.3 Video Quality metric (VQM)
The VQM metric was employed to measure subjective quality assessment of the
streamed video at receiver. Since the VQM score is the sum of many weighted parameters
and its higher value represents the maximum loss of quality in the video, the lower values
observed by the ABBA, HDR, and BSR is desirable. The ABBA based method shows
13% lower than the HDR and 17% lesser than the BSR scheme (Fig. 3.4) for the VQM
measurement.
30
0
0.05
0.1
0.15
0.2
0.25
0.3
0.35
0.4
0.45
1 2 3 4 5 6 7 8 9 10
VQ
M
FRAME #
ABBA
FDR
BSR
Figure 3.4. The VQM index
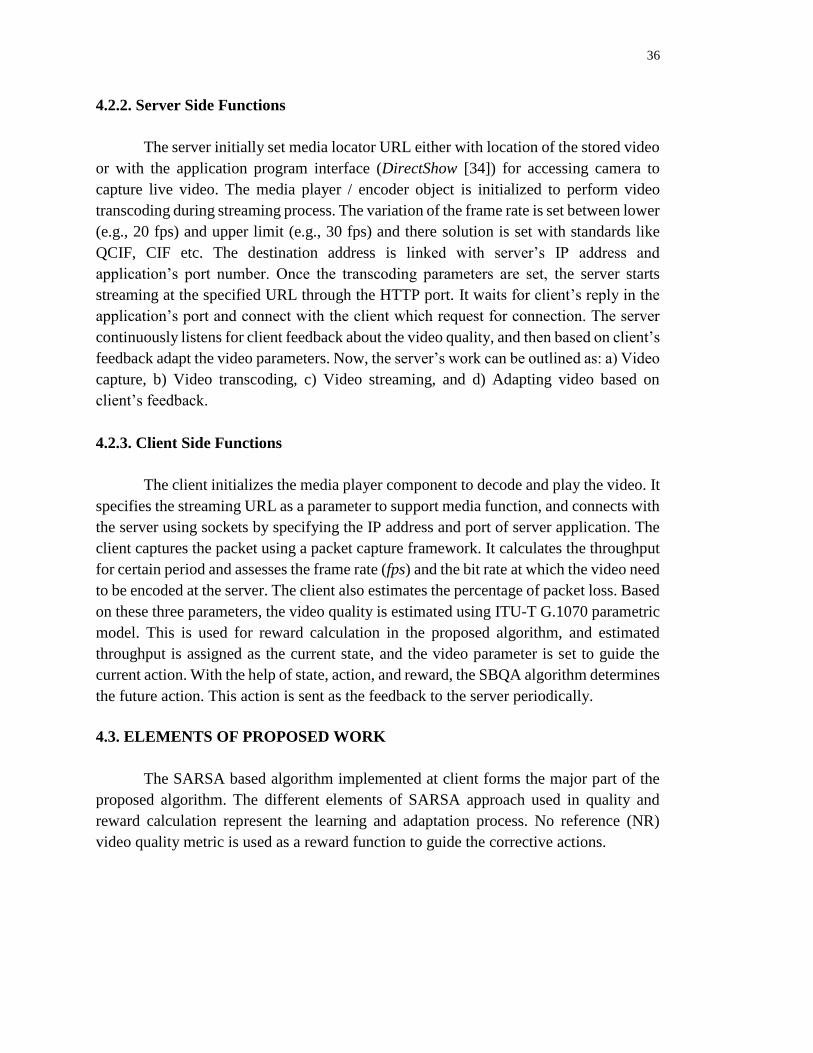
3.6.4 Aligned-Peak Signal to Noise Ratio (A-PSNR)
If there are multiple consecutive (say 5 and more) loss of frame in the wireless
network, the conventional techniques like PSNR fails miserably due to application of
fixed window model. This necessitates the adoption of new metric based on the dynamic
window size. The Aligned-PSNR (A-PSNR) of ABBA algorithm produces 11.26%
higher than the HDR, and 22.26% more than BSR algorithm (Fig. 3.5). The ABBA
algorithm achieves the A-PSNR more than 30 dB which shows its usefulness in
delivering high quality videos.
0
5
10
15
20
25
30
35
40
1 2 3 4 5 6 7 8 9 10
A-P
SNR
(dB
)
FRAME #
ABBA
FDR
BSR
Figure 3.5. Aligned-PSNR values

31
3.6.5 Multi Scale- Structural Similarity (MS-SSIM) Index
A multi scale SSIM being more flexible than single scale metric provides better
result with respect to correlations to human perceptions. On an average ABBA algorithm
produces 2% higher quality on MS-SSIM scale than HDR and 0.7% higher than BSR
method. Fig.3.6 shows the variation of MS-SSIM values on different consecutive frames.
Although the improvement in quality by ABBA algorithm over other two is marginal, it
still leads the pack.
0.76
0.78
0.8
0.82
0.84
0.86
0.88
1 2 3 4 5 6 7 8 9 10
MS-
SSIM
FRAME #
ABBA
BSR
HDR
Figure 3.6. The Multi Scale SSIM observation
3.6.6 Inter Arrival Packet Delay
The inter arrival packet delay was observed on the Airtel 4G LTE-TDD network
during live video streaming. As shown in Figure 3.7, an average delay of 45.2
milliseconds was observed during experimentation. Though the proposed algorithm does
not directly deal with delay profile of the packet stream, it indicates the characteristics of
the underlying network.
0
10
20
30
40
50
60
1 2 3 4 5 6 7 8 9 10 11 12 13 14 15 16 17 18 19
De
lay
(ms)
Packet #
Figure 3.7. Inter Packet Delay for 20 packets.

32
3.6.7 Visual Frames
The Figure 3.8 and 3.9, shows the few frames of the original and decoded
sequences of video during experimentation of the live streaming and stored video
streaming in the laboratory environment.
Original Frames
Decoded Frames
Figure 3.8. Live streaming from server to client
Original Frames
Decoded Frames
Figure 3.9. Stored Video Streaming for Entertainment

33
CHAPTER-4
MACHINE LEARNING BASED APPROACH
4.1 OVERVIEW
In the HTTP based Adaptive Streaming (HAS) based implementation, the
selection of chunk duration directly effects the bit rate adaptation process. For example,
a small chunk leads to a sub-optimal implementation, while a larger chunk will cause
lack of adaptation in the fast changing internet traffic. The adoption of TCP/HTTP leads
to an inefficient network bandwidth utilization, and a mismatch between the specified
quality of a chunk and the actual encoding rate further aggravate the problem [35].
The bit rate adaptation algorithm needs to deal with multi-dimensional aspects of
video streaming over HTTP through wireless networks. Most video codec, e.g., High
Efficiency Video Coding (HEVC), H.264/AVC etc., generates variable bit rate of
encoded video. However, the meta-data of MPEG-DASH does not carry this which can
be used by the client for adaptation process [36]. The existing HAS approach do not
provide control of transfer rate of video data. In fact, the TCP controls the transmission
rate of video chunk, which respond to the congestion in network connecting client and
server [37]. The fluctuation in received signal strength in wireless network further inflicts
the system capacity. In a typical multiple access cellular system, the data rate at user
equipment depends on prevailing channel conditions [38]. Most of the earlier work tries
to estimate the future bandwidth and hence the efficiency of this approach depends on
accuracy of prediction. However, it is inherently difficult to predict the receiving bit rate
based on past history [39].
A machine learning technique can be employed in adaptation process provided it
is incorporated into feedback quality loop. Reinforcement Learning (RL) [40] is an
efficient solution for environmental learning problem. In RL, rather than relying on a
fixed algorithm, learning agents can try different actions and gradually learn the best
strategy for each situation. By continuous learning the RL algorithms like Q-learning can
adapt to the changing conditions of the streaming system. However, the complexity of
the model based on Q-learning [41] could seriously downgrade the system performance
especially in dealing with the live streaming of video.
The Full Reference (FR) metrics [42] of video quality evaluation produces best
result as it compares the received signal with original at frame level. However using FR
metrics in dynamic adaptation of quality is not practical as the receiver does not have the
original video. If the learning technique can be incorporated into No Reference (NR)
metrics of video quality estimation, a dynamic streaming system can be designed and
developed to deal with the client’s terminal requirement. Although, the ITU-T G.1070

34
[43] recommendation is targeted towards quality of experience / service (QoE/QoS)
planners in video telephony, its parametric model is adapted here in supporting video
streaming system to meet the end to end service quality.
In this chapter, we propose a new algorithm based on RL approach called, State
Action Reward State Action (SARSA) Based Quality Adaptation using Softmax Policy
(SBQA-SP) algorithm to manage the adaptive streaming using NR metrics. SARSA is an
online policy approach of RL [44], which doesn’t require a separate learning and
deployment phase. In SBQA-SP, the system is characterised by a set of states and the
algorithm decides the suitable action to be taken based on the current state. The SBQA-
SP identifies the current state of the system and based on the state chooses an action to
perform. It calculates the reward as a result of the action performed and determines the
resulting state of the system after the action. Next, the SBQA-SP determines the future
action to be performed based on the Softmax exploration policy and update the Q-matrix.
The chosen action is sent as feedback to the server.
To analyse the performance of the proposed approach, it is compared with other
two approaches, namely (i) Q-Learning Based Quality Adaptation (QBQA) [41], and (ii)
SBQA using ε-Greedy Policy (SBQA-GP). In QBQA, Q-learning method is used for
controlling video quality adaptation. The Q-Learning approach is similar to SARSA,
expect for the fact that it is an off-line policy algorithm which requires a learning and
deployment phase. Also, the formula to update Q-matrix varies for SARSA and Q-
learning. SBQA-GP is a variant of SBQA-SP approach in which ε-Greedy policy is used
in selecting the best possible future action.
The proposed algorithms were implemented in accordance with the ITU-T J.247
recommendation (Table 1) which describes about “objective perceptual video quality
measurement” [20].
4.2. PROPOSED SYSTEM
4.2.1. System Architecture
The architecture diagram of the proposed system is illustrated in Fig 4.1. It works
on the top of HTTP in a typical internet environment where the last mile connectivity
between client and server is supported on a 4G wireless network. Initially, the client
requests the Media Descriptor file from the server, and the server replies with the Media
Descriptor Sidecar file containing default settings and video parameters. Once the server
streams the video to the client, the client continuously monitors the streaming quality
using proposed SARSA based quality adaptation algorithm to determine the corrective
action to be taken by the server in the near future and send this decision as feedback to

35
the server. The server adapts the streaming video quality accordingly to match the client’s
requirement. The Test Parameters for ITU-T J.247 is given in Table 4.1.
Figure 4.1. Architecture of the proposed work
Table 4.1.Test Parameters as per ITU-T J.247
S.No Parameters Values
1. Transmission Errors with packet loss
2. Frame Rate 5 fps to 30 fps
3. Video Codec H.264/AVC (MPEG-4 part10),VC-
1,Windows Media9, Real Video (RV
10),MPEG-4 Part 2
4. Video
Resolutions and
bit rates
QCIF: 16 - 320 kbps
CIF: 64 - 2000 kbps
VGA: 128 - 4000 kbps
5. Temporal errors
(pausing with
skipping)
Maximum of 2 seconds
Media Presentation
Descriptor (MPD)
Decode and play video
SARSA Based Quality
Adaptation
Algorithm Video Segment
Current state
SERVER CLIENT
Transcoded Video
Reward estimation
Video Streaming
Dispatch feedback
New state and action
identification Adapt video quality
based on feedback
Request MPD
Response MPD
HTTP
36
4.2.2. Server Side Functions
The server initially set media locator URL either with location of the stored video
or with the application program interface (DirectShow [34]) for accessing camera to
capture live video. The media player / encoder object is initialized to perform video
transcoding during streaming process. The variation of the frame rate is set between lower
(e.g., 20 fps) and upper limit (e.g., 30 fps) and there solution is set with standards like
QCIF, CIF etc. The destination address is linked with server’s IP address and
application’s port number. Once the transcoding parameters are set, the server starts
streaming at the specified URL through the HTTP port. It waits for client’s reply in the
application’s port and connect with the client which request for connection. The server
continuously listens for client feedback about the video quality, and then based on client’s
feedback adapt the video parameters. Now, the server’s work can be outlined as: a) Video
capture, b) Video transcoding, c) Video streaming, and d) Adapting video based on
client’s feedback.
4.2.3. Client Side Functions
The client initializes the media player component to decode and play the video. It
specifies the streaming URL as a parameter to support media function, and connects with
the server using sockets by specifying the IP address and port of server application. The
client captures the packet using a packet capture framework. It calculates the throughput
for certain period and assesses the frame rate (fps) and the bit rate at which the video need
to be encoded at the server. The client also estimates the percentage of packet loss. Based
on these three parameters, the video quality is estimated using ITU-T G.1070 parametric
model. This is used for reward calculation in the proposed algorithm, and estimated
throughput is assigned as the current state, and the video parameter is set to guide the
current action. With the help of state, action, and reward, the SBQA algorithm determines
the future action. This action is sent as the feedback to the server periodically.
4.3. ELEMENTS OF PROPOSED WORK
The SARSA based algorithm implemented at client forms the major part of the
proposed algorithm. The different elements of SARSA approach used in quality and
reward calculation represent the learning and adaptation process. No reference (NR)
video quality metric is used as a reward function to guide the corrective actions.
37
4.3.1 Elements of SARSA Approach
a) State: It contains pertinent data about the environment conditions in a given time
instance. In particular, the proposed model characterizes the state vector as Scur= {Th}
where Th is the estimated throughput. The throughput values are mapped to different
discrete finite state.
b) Action: Qualities are defined on the basis of analyzed data segment, and the quality
segments are mapped to actions.
c) Reward Function: This function evaluates the fitness of the choice. The quality
measurements through NR video metrics provide as the main input in reward
calculation.
d) Q-Table, Q(S, A): The rows of this matrix represent the states of the system and each
column contains one of the possible actions (the segment qualities). For a given pair
(s, a), Q(·) indicates the learned benefit that the system will get in taking action a in
states. In order to formulate the client’s learning and corresponding actions procedure,
the SARSA approach updates Q-matrix after each quality decision as follows.
𝑄 𝑠𝑐𝑢𝑟 , 𝑎𝑐𝑢𝑟 ← 𝑄 𝑠𝑐𝑢𝑟 , 𝑎𝑐𝑢𝑟 + 𝛼 [ 𝑉𝑞 + 𝛾 𝑄(𝑠𝑛𝑒𝑤, 𝑎𝑛𝑒𝑤) − 𝑄(𝑠𝑐𝑢𝑟 , 𝑎𝑐𝑢𝑟)] 4.1
Where scur is the current state, acur is the selected action, vqis the associated immediate
reward, snew is the next state after action acur, anew is the action from state snew. The
learning rate (α) indicates how much the acquired information will affect to the old
value of Q(·) in its updating, and the discount factor (γ) weighs the contribution of the
immediate and future rewards (0 ≤ γ ≤ 1).
e) Exploration Policy: Two exploration policies are taken into consideration here
namely, Softmax and ε-Greedy.
Softmax policy chooses action by converting the action’s expected reward to a
probability. The action is chosen according to the resulting distribution, which is the
Boltzmann distribution given by
𝑃(𝑎𝑗) =𝑒
−𝑄(𝑠,𝑎𝑗)
𝑟
𝑒−
𝑄(𝑠,𝑎𝑖)𝑟
|𝑎𝑠|𝑖=1
(4.2)
Where r is a positive parameter called temperature, and 𝑎𝑠is number of state of the
system. High temperatures causeall actions to be nearly equiprobable, whereas low
temperatures cause greedyaction selection.
With ε-greedy, the agent selects at each time step a random action with a fixed
probability, 0 <ε<1, instead of selecting greedily one ofthe learned optimal actions with
respect to the Q-function:
𝐴𝑐𝑡𝑖𝑜𝑛 = {𝑟𝑎𝑛𝑑𝑜𝑚_𝑎𝑐𝑡𝑖𝑜𝑛_𝑓𝑟𝑜𝑚_𝐴(𝑠) , 𝑖𝑓 𝑟 < 𝜀
𝑎𝑟𝑔𝑚𝑎𝑥𝑎 ℰ 𝐴(𝑠)𝑄(𝑠, 𝑎), 𝑜𝑡ℎ𝑒𝑟𝑤𝑖𝑠𝑒} (4.3)

38
Where 0 < r <1 is a uniform random number drawn at each time step.
The SBQA approach is differentiated as two methods based on two exploration policies:
SBQA using Softmax Policy (SBQA-SP), and SBQA using ε-Greedy Policy (SBQA-
GP).
4.3.2 Video Quality Estimation using No-reference Metric
The ITU-T G.1070 defines a model [43] for estimating the video quality based on
measurable parameters of IP network. The video quality (Vq) is represented as,
𝑉𝑞 = 1 + 𝐼𝑐𝐼𝑡 (4.4)
Where 𝐼𝑐 represents the basic video quality resulting from the encoding distortion due to
the combined effect of bit rate and frame rate, 𝐼𝑡 is the factor governed by degree of
robustness due to packet loss.
𝐼𝑐 is expressed in terms of bit rate (b) and frame rate (f) according to equations (4.5 – 4.8)
as follows.
𝐼𝑐 = 𝐼0 𝑒−
(ln(𝑓)−ln (𝑓0 ))2
2𝐷𝐹𝑟2
(4.5)
𝑓0 = 𝑣1 + 𝑣2 𝑏 (4.6)
𝐷𝐹𝑟 = 𝑣6 + 𝑣7 𝑏 (4.7)
𝐼0 = 𝑣3 (1 −1
1+(𝑏
𝑣4)𝑣5) (4.8)
Where 𝐼0 represents the maximum video quality (0 <I0< 4) at each video bit rate, f0 is
optimal frame rate (1 <f0< 30) maximizing the video quality at bit rate b,𝐷𝐹𝑟 isthe degree
of video quality robustness due to frame rate.
𝐼𝑡 depends on packet loss robustness factor (𝐷𝑃𝑝𝑙𝑣)and rate of packet loss (p) given by
𝐼𝑡 = 𝑒−
𝑝
𝐷𝑃𝑝𝑙𝑣 (4.9)
𝐷𝑃𝑝𝑙𝑣= 𝑣10 + 𝑣11𝑒
− 𝑓
𝑣8 + 𝑣12𝑒−
𝑏
𝑣9 (4.10)
Here 𝐷𝑃𝑝𝑙𝑣represents the degree of video quality robustness against packet loss. The value
of coefficients v1, v2, v3,….v12 depends on type of codec, video format, interval between
key frame, and size of video displayas mentioned in ITU-T G.1070.
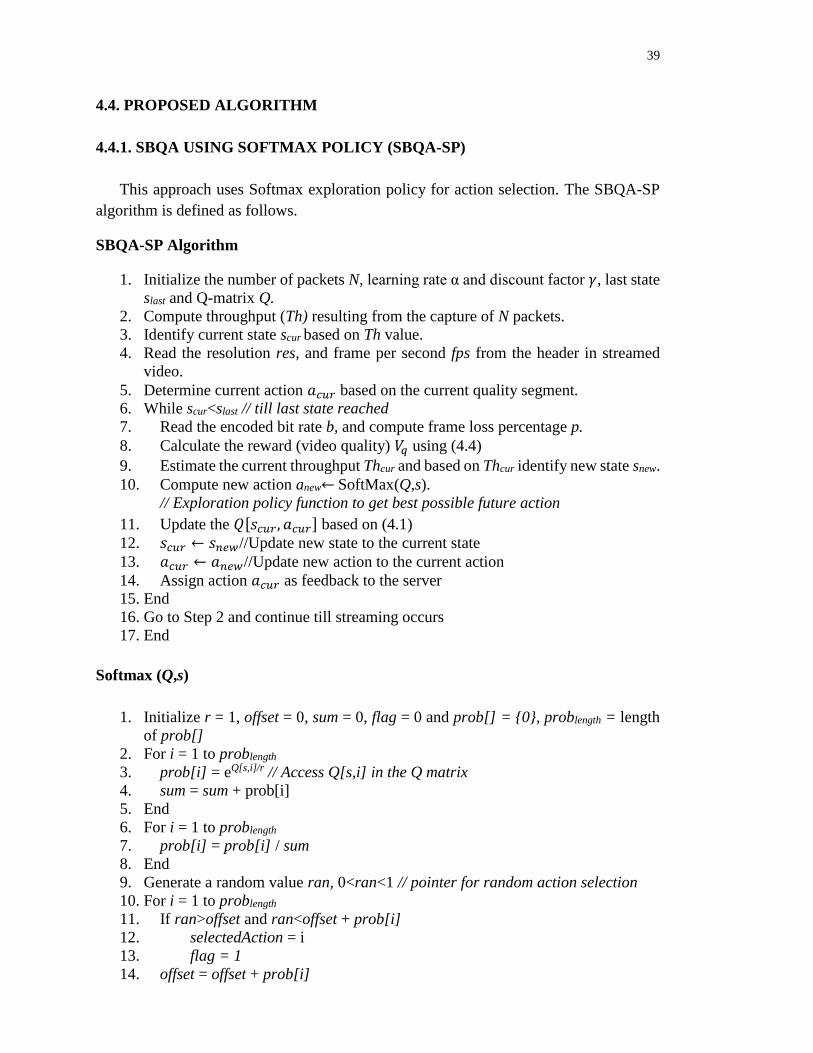
39
4.4. PROPOSED ALGORITHM
4.4.1. SBQA USING SOFTMAX POLICY (SBQA-SP)
This approach uses Softmax exploration policy for action selection. The SBQA-SP
algorithm is defined as follows.
SBQA-SP Algorithm
1. Initialize the number of packets N, learning rate α and discount factor 𝛾, last state
slast and Q-matrix Q.
2. Compute throughput (Th) resulting from the capture of N packets.
3. Identify current state scur based on Th value.
4. Read the resolution res, and frame per second fps from the header in streamed
video.
5. Determine current action 𝑎𝑐𝑢𝑟 based on the current quality segment.
6. While scur<slast // till last state reached
7. Read the encoded bit rate b, and compute frame loss percentage p.
8. Calculate the reward (video quality) 𝑉𝑞 using (4.4)
9. Estimate the current throughput Thcur and based on Thcur identify new state snew.
10. Compute new action anew← SoftMax(Q,s).
// Exploration policy function to get best possible future action
11. Update the 𝑄 𝑠𝑐𝑢𝑟 , 𝑎𝑐𝑢𝑟 based on (4.1)
12. 𝑠𝑐𝑢𝑟 ← 𝑠𝑛𝑒𝑤//Update new state to the current state
13. 𝑎𝑐𝑢𝑟 ← 𝑎𝑛𝑒𝑤//Update new action to the current action
14. Assign action 𝑎𝑐𝑢𝑟 as feedback to the server
15. End
16. Go to Step 2 and continue till streaming occurs
17. End
Softmax (Q,s)
1. Initialize r = 1, offset = 0, sum = 0, flag = 0 and prob[] = {0}, problength = length
of prob[]
2. For i = 1 to problength
3. prob[i] = eQ[s,i]/r // Access Q[s,i] in the Q matrix
4. sum = sum + prob[i]
5. End
6. For i = 1 to problength
7. prob[i] = prob[i] / sum
8. End
9. Generate a random value ran, 0<ran<1 // pointer for random action selection
10. For i = 1 to problength
11. If ran>offset and ran<offset + prob[i]
12. selectedAction = i
13. flag = 1
14. offset = offset + prob[i]
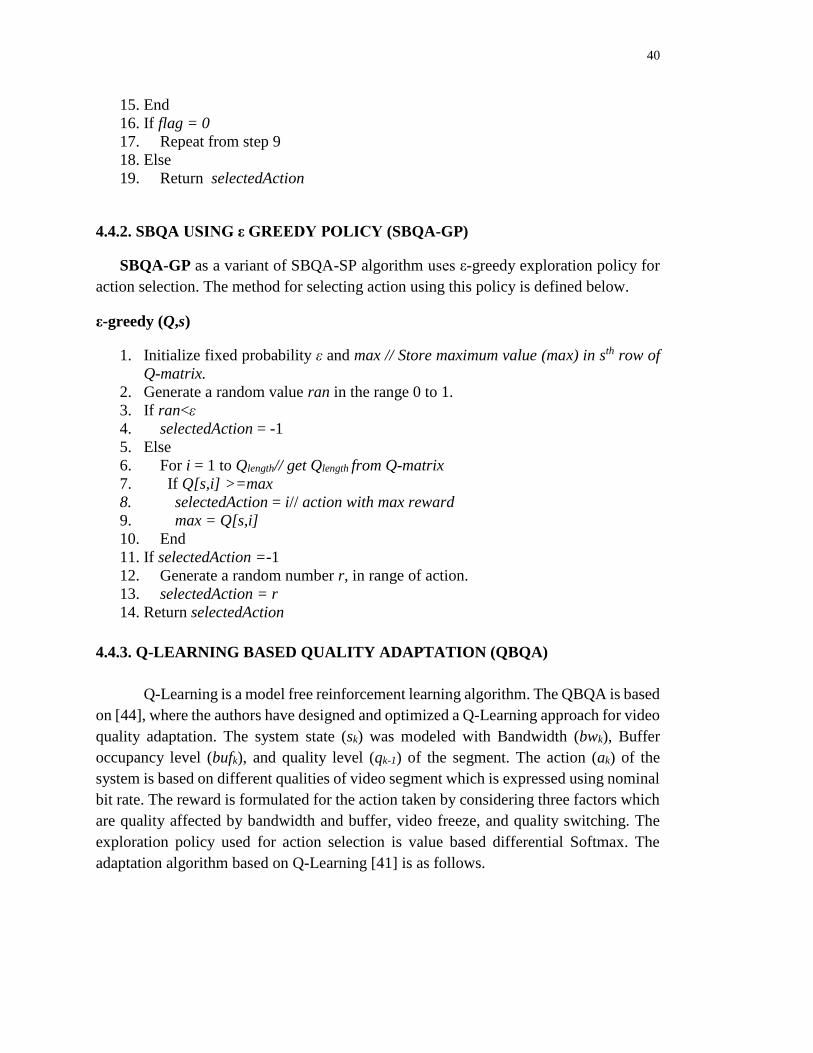
40
15. End
16. If flag = 0
17. Repeat from step 9
18. Else
19. Return selectedAction
4.4.2. SBQA USING ε GREEDY POLICY (SBQA-GP)
SBQA-GP as a variant of SBQA-SP algorithm uses ε-greedy exploration policy for
action selection. The method for selecting action using this policy is defined below.
ε-greedy (Q,s)
1. Initialize fixed probability ε and max // Store maximum value (max) in sth row of
Q-matrix.
2. Generate a random value ran in the range 0 to 1.
3. If ran<ε
4. selectedAction = -1
5. Else
6. For i = 1 to Qlength// get Qlength from Q-matrix
7. If Q[s,i] >=max
8. selectedAction = i// action with max reward
9. max = Q[s,i]
10. End
11. If selectedAction =-1
12. Generate a random number r, in range of action.
13. selectedAction = r
14. Return selectedAction
4.4.3. Q-LEARNING BASED QUALITY ADAPTATION (QBQA)
Q-Learning is a model free reinforcement learning algorithm. The QBQA is based
on [44], where the authors have designed and optimized a Q-Learning approach for video
quality adaptation. The system state (sk) was modeled with Bandwidth (bwk), Buffer
occupancy level (bufk), and quality level (qk-1) of the segment. The action (ak) of the
system is based on different qualities of video segment which is expressed using nominal
bit rate. The reward is formulated for the action taken by considering three factors which
are quality affected by bandwidth and buffer, video freeze, and quality switching. The
exploration policy used for action selection is value based differential Softmax. The
adaptation algorithm based on Q-Learning [41] is as follows.

41
QBQA Algorithm
1. Initialize the learning rate α, discount factor𝛾, Q-matrix, and optimal bandwidth
value 𝐵𝑜𝑝𝑡.
2. Read the current buffer occupancy level bufk for kth segment and quality level qk-1 for
segment k-1 while streaming
3. For i = 1 to t //Training Phase
4. Estimate the bandwidth bwk
5. Assign sk= { bwk , bufk, qk-1 } // Current State
6. ak= Softmax(Q, sk ) // Exploration policy function to get best possible action.
7. Calculate the quality factor related to bandwidth and buffer occupancy level using
the equation
𝑅𝑞𝑢𝑎𝑙𝑖𝑡𝑦 = −1.5 . |𝑏𝑤𝑘.1+(𝑏𝑢𝑓𝑘/𝐵𝑜𝑝𝑡)
3−(𝑏𝑤1/𝑎1)− 𝑎𝑘| (4.11)
8. Calculate the quality factor related to switch in quality using the equation
𝑅𝑠𝑤𝑖𝑡𝑐ℎ𝑒𝑠 = −|𝑞𝑘−1 − 𝑎𝑘| (4.12)
9. Read the duration of video freeze𝑡𝑠𝑡𝑎𝑙𝑙 , time elapsed from the last freeze 𝑡𝑝𝑙𝑎𝑦
and number of freezes n
10. Calculate the quality factor related to video freezing using the equation
𝑅𝑓𝑟𝑒𝑒𝑧𝑒𝑠 =
{
−100 . |
𝑎𝑘
𝑏𝑤𝑘 .
𝑒𝑡𝑠𝑡𝑎𝑙𝑙
10
ln(𝑡𝑝𝑙𝑎𝑦+1)| 𝑎𝑘 = 𝑎1
−100 . |𝑎𝑘
𝑏𝑤𝑘 .
𝑒𝑛+
𝑡𝑠𝑡𝑎𝑙𝑙10
ln(𝑡𝑝𝑙𝑎𝑦+1)| 𝑎𝑘 ≠ 𝑎1
(4.13)
11. Calculate
𝑅𝑡𝑜𝑡𝑎𝑙 = 𝑅𝑞𝑢𝑎𝑙𝑖𝑡𝑦 + 𝑅𝑠𝑤𝑖𝑡𝑐ℎ𝑒𝑠 + 𝑅𝑓𝑟𝑒𝑒𝑧𝑒𝑠 (4.14)
12. End
13. Determine the resultant state, sk +1 using{ bwk+1 , bufk+1, qk}
14. Update the Q-matrix using
𝑄 𝑠𝑘, 𝑎𝑘 ← (1 − 𝛼) 𝑄 𝑠𝑘, 𝑎𝑘 + 𝛼[ 𝑅𝑡𝑜𝑡𝑎𝑙 + 𝛾 𝑚𝑎𝑥𝑏𝑄(𝑠𝑘+1, 𝑏)] (4.15)
15. Estimate the bandwidth bwk//Testing Phase begins
16. Assign sk= { bwk , bufk, qk-1 }
17. ak= maxa (Q(sk, a))
18. Send ak as feedback to the server.
19. Repeat from Step 15 until streaming occurs.
4.5. IMPLEMENTATION ENVIRONMENT
The Java programming environment based on 64bit JDK Version 7 was chosen
for implementation purpose and the code was developed using Eclipse IDE. The 64 bit
VLC media player was used for playing the media, as VLC can be easily manipulated
using java with the help of VLCJ framework. Dshow API [34] was used for capturing
live video for streaming, but for packet capturing Jnetpcap [45] framework was used.
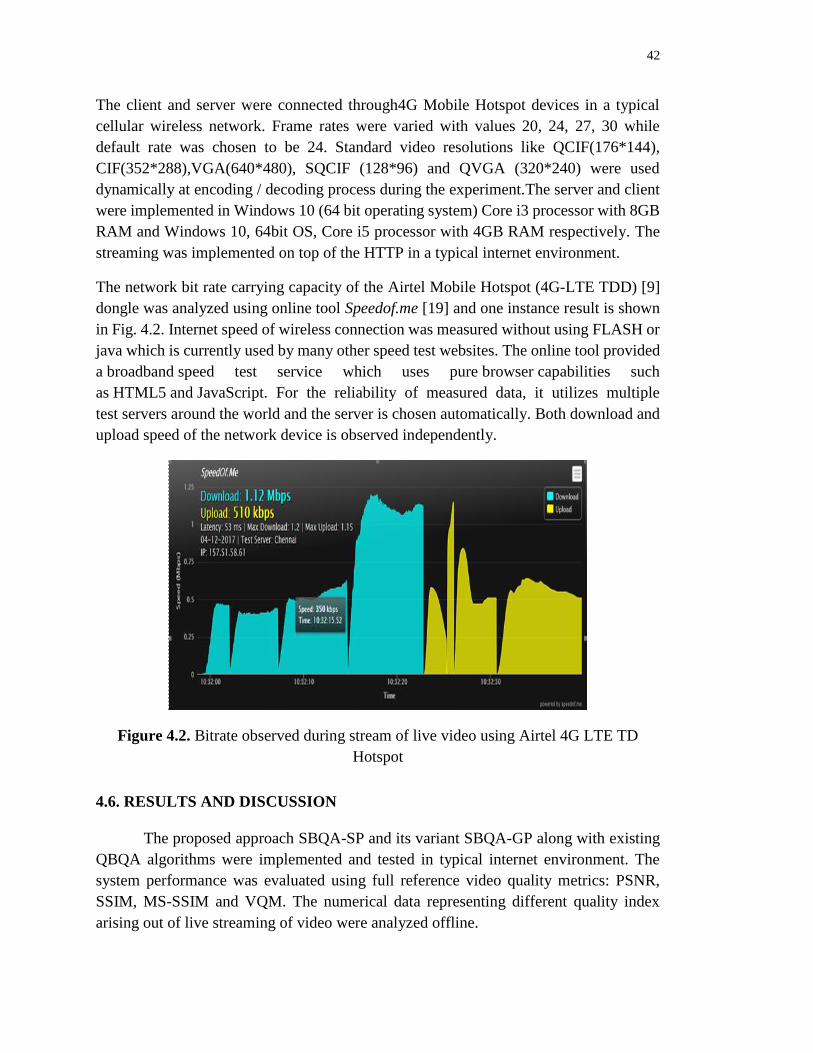
42
The client and server were connected through4G Mobile Hotspot devices in a typical
cellular wireless network. Frame rates were varied with values 20, 24, 27, 30 while
default rate was chosen to be 24. Standard video resolutions like QCIF(176*144),
CIF(352*288),VGA(640*480), SQCIF (128*96) and QVGA (320*240) were used
dynamically at encoding / decoding process during the experiment.The server and client
were implemented in Windows 10 (64 bit operating system) Core i3 processor with 8GB
RAM and Windows 10, 64bit OS, Core i5 processor with 4GB RAM respectively. The
streaming was implemented on top of the HTTP in a typical internet environment.
The network bit rate carrying capacity of the Airtel Mobile Hotspot (4G-LTE TDD) [9]
dongle was analyzed using online tool Speedof.me [19] and one instance result is shown
in Fig. 4.2. Internet speed of wireless connection was measured without using FLASH or
java which is currently used by many other speed test websites. The online tool provided
a broadband speed test service which uses pure browser capabilities such
as HTML5 and JavaScript. For the reliability of measured data, it utilizes multiple
test servers around the world and the server is chosen automatically. Both download and
upload speed of the network device is observed independently.
Figure 4.2. Bitrate observed during stream of live video using Airtel 4G LTE TD
Hotspot
4.6. RESULTS AND DISCUSSION
The proposed approach SBQA-SP and its variant SBQA-GP along with existing
QBQA algorithms were implemented and tested in typical internet environment. The
system performance was evaluated using full reference video quality metrics: PSNR,
SSIM, MS-SSIM and VQM. The numerical data representing different quality index
arising out of live streaming of video were analyzed offline.

43
4.6.1. Peak Signal to Noise Ratio (PSNR)
The commonly used video / image quality metric PSNR is used here because it is
fast and simple to implement. Fig. 4.3 depicts the PSNR values corresponding to the
SBQA-SP, SBQA-GP and QBQA algorithms. The SBQA-SP algorithm exhibits a higher
average PSNR, which is 8% and 5% higher than the SBQA-GP and QBQA algorithm
respectively. The SBQA-SP performs better compared to other two approaches as it
learns the environment conditions without any pre learning phase and adapts the video
quality as data arrives. Also, the exploration policy used helps to convergence at a faster
rate.
Figure 4.3. The PSNR observation
4.6.2. Structural Similarity Measurement (SSIM)
The SSIM index was computed for the three algorithms (SBQA-SP, SBQA-GP
and QBQA), and the proposed SBQA-SP algorithm exhibited a higher value with an
average index of 0.9940 which is 2% higher than the QBQA algorithm 3% better than
SBQA-GP. The SSIM index on few decoded consecutive frames at receiver
corresponding to three algorithms is plotted in Figure 4.4. The higher SSIM index for the
proposed algorithm is a reward for the perceived video quality as there is need for the
perseverance of luminance and contrast factors that are influenced by the distortions.
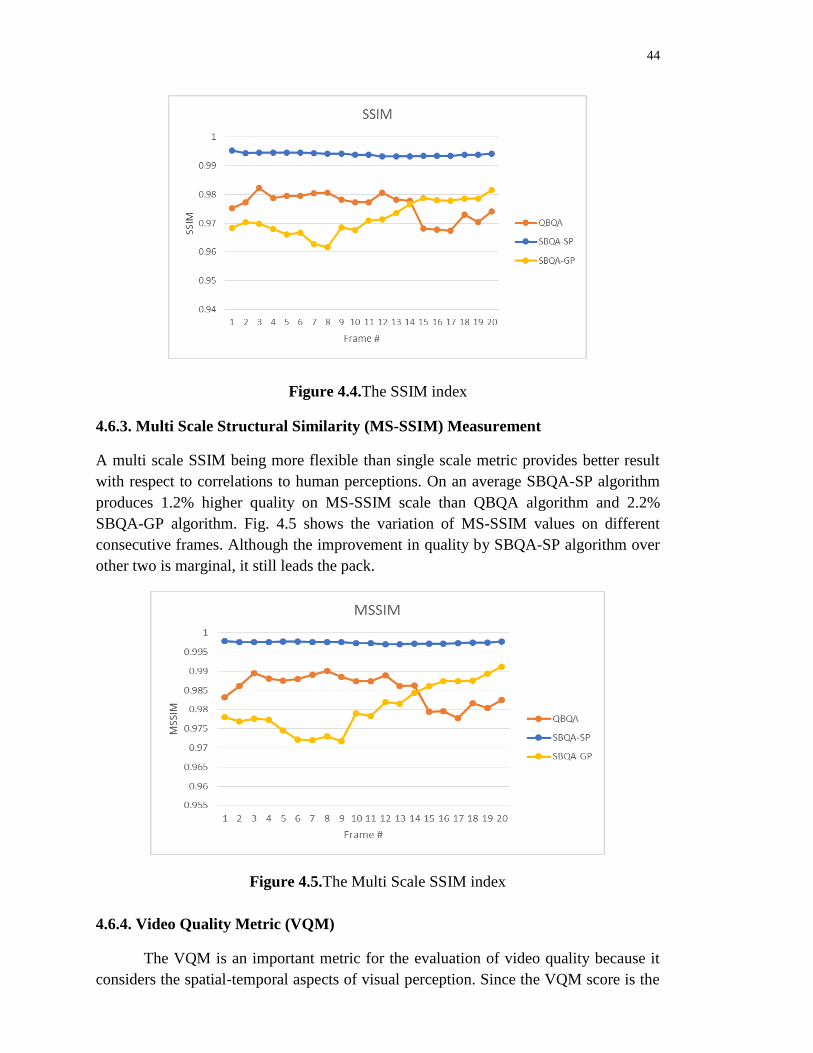
44
Figure 4.4.The SSIM index
4.6.3. Multi Scale Structural Similarity (MS-SSIM) Measurement
A multi scale SSIM being more flexible than single scale metric provides better result
with respect to correlations to human perceptions. On an average SBQA-SP algorithm
produces 1.2% higher quality on MS-SSIM scale than QBQA algorithm and 2.2%
SBQA-GP algorithm. Fig. 4.5 shows the variation of MS-SSIM values on different
consecutive frames. Although the improvement in quality by SBQA-SP algorithm over
other two is marginal, it still leads the pack.
Figure 4.5.The Multi Scale SSIM index
4.6.4. Video Quality Metric (VQM)
The VQM is an important metric for the evaluation of video quality because it
considers the spatial-temporal aspects of visual perception. Since the VQM score is the

45
sum of many weighted parameters and its higher value represents the maximum loss of
quality in the video, the lower values observed by the SBQA-SP, SBQA-GP and QBQA
algorithms are desirable. The SBQA-SP based method shows 15% lower than the
SBVQA-GP and 23% lesser than the QBQA algorithm. The VQM values for 20 Frames
are depicted in Fig. 4.6.
Figure 4.6. The VQM observation
4.6.5. Three-component Structural Similarity (3-SSIM) Measurement
The 3-SSIM is a form of SSIM that is calculated as a weighted average of SSIM
for three categories of regions: edges, textures, and smooth regions. From Fig. 4.7, it is
evident that the proposed SBQA-SP approach shows a higher 3-SSIM value compared to
other approaches. The average values shows that SBQA-SP approach provides quality
which is 0.4% higher than QBQA approach and 1.04% higher than SBQA-GP approach
with respect to 3-SSIM scale.
Figure 4.7. The 3-SSIMindex

46
4.6.6. Inter Arrival Packet Delay
The Fig. 4.8 shows the observed inter arrival packet delay on the Airtel 4G LTE-
TD network during live video streaming. An average delay of 7.6 milliseconds was
observed during the experimentation process.
Figure 4.8. Inter packet delay
4.6.7. Experimental Original and Decoded Sequence of Frames
The Fig. 4.9 shows the few original and decoded video sequences captured during
live streaming experiment at the server and client respectively. The display resolution is
640*480 with the frame rate of 24. The live video streaming was carried out in a class
room environment. The codec used for encoding and decoding process is H.264 for live
as well as stored video.
(a) Original
(b) Decoded
Figure 4.9. Live Streaming (few selected original and decoded frames)

47
CHAPTER-5
CONCLUSION & FUTURE WORK
5.1 CONCLUSION
The dynamic adaptive streaming over HTTP in a wireless paradigm was
implemented for live and stored video scenarios considering the vulnerabilities of the
medium, to withstand the fluctuations of widely varying link bit rates. This technology is
found to have great potential to be used in the tele-medical video streaming. In one of the
approaches, we used maxima minima concept and RMS approximation which tries to
estimate the bit rate pattern in real-time which includes the fluctuation time in the network
for dynamic adaptive streaming over HTTP. In another approach, the strategic decisions
in real-time adaptation of video stream were based on the time series analysis of the
streamed data, with an objective to achieve maximum obtainable quality. The ABBA
algorithm implemented to achieve real-time adaptation of video stream was tested on
different standard video quality metrics and the result showed an improvement over other
two existing approaches (HDR and BSR algorithm) with acceptable quality index.
Although the system is targeted towards cinematic video, it can also support tele-
medicine applications where doctors can communicate to their peers. The concept of
HTTP adaptive streaming through 4G wireless network implemented using Q-learning
with NR metrics for live video considering the challenges due to varying wireless link
condition and internet traffic achieved maximum obtainable quality. The decisions that
are made to adapt video quality in a real time video streaming were based on the current
state of the system and the action to be taken in that state maximizes the reward. The
proposed SBQA-SP algorithm using Softmax policy was formulated and implemented
using ITU-T G.1070 model for no-reference metrics quality evaluation. All these
techniques are client server based networks, so it can be easily implemented as it runs on
the top of the http.
5.2 FUTURE WORK
The work can be extended further by incorporating other aspects like sudden
network congestion, as it may cause extra delay on streaming packets, which is
undesirable in real-time tele-medical application. The ITU-T G.1070 standard employed
in the project, is targeted at QoE / QoS in video telephony, which constrains in achieving
higher quality of streaming video in an IP network, so a suitable mechanism is required
to enhance the system performance. Further, the proposed works was implemented and
tested in one way communication, which can be extended to two-way video streaming.
48
REFERENCES
[1]. 3GPP Specification, “3GPP, Transparent End-To-End Packet-switched
Streaming Service (PSS): Progressive Download and Dynamic Adaptive
Streaming over HTTP (3GP-DASH)”, Release 12, Document # TS 26.247, 2015.
[2]. Mincheng Zhao, Xiangyang Gong, Jie Liang, Wendong Wang, Xirong Que, and
Shiduan Cheng, “QoE-Driven Cross-Layer Optimization for Wireless Dynamic
Adaptive Streaming of Scalable Videos Over HTTP”, IEEE Transactions on
Circuits and Systems for Video Technology, Vol. 25, No. 3, March 2015, pp.451-
465.
[3]. Stefano Petrangeli, Tim Wauters, Rafael Huysegemsy, Tom Bostoeny, and Filip
De Turck, “Network-based Dynamic Prioritization of HTTP Adaptive Streams to
Avoid Video Freezes”, IEEE/IFIP International Workshop on Quality of
Experience Centric Management, May 11-15, 2015.
[4]. Shuangwu Chen, Jian Yang, Member, Yongyi Ran, and Enzhong Yang,
“Adaptive Layer Switching Algorithm Based on Buffer Underflow Probability
for Scalable Video Streaming Over Wireless Networks”, IEEE Transactions on
Circuits and Systems for Video Technology, Year 2015.
[5]. Cisco Visual Networking Index: Global Mobile Data Traffic Forecast Update,
2015–2020, February 3, 2016.
[6]. Luca De Cicco, "An Adaptive Video Streaming Control System: Modeling,
Validation, and Performance Evaluation", IEEE/ACM Transactions on
Networking, Volume 22, Issue 2, pp.526-539, April 2014.
[7]. Jan Willem Kleinrouweler, “Modeling Stability and Bitrate of Network-Assisted
HTTP Adaptive Streaming Players”, International Tele traffic Congress (ITC 27),
Ghent, pp-177–184, 2015.
[8]. Dhananjay Kumar, Nandha Kishore, Easwaran, A. Srinivasan, A. J. Manoj
Shankar L., Arun Raj, "Adaptive Video Streaming Over Http Through 3g/4g
Wireless Networks Employing Dynamic On The Fly Bitrate Analysis", ITU
Kaleidoscope: Trust in the Information Society, Barcelona, December 2015.
[9]. “Airtel 4G Wi-Fi Hotspot”. [Online]. Available at: http://www.airtel.in/4g/index.
[10]. ITU-T Recommendation Series J, “Objective Perceptual Multimedia Video
Quality Measurement in the Presence of a Full Reference”, document # J.247,
August 2008.
[11]. Junchen Jiang, Vyas Sekar, and Hui Zhang, “Improving Fairness, Efficiency,
and Stability in HTTP-Based Adaptive Video Streaming With FESTIVE”,
IEEE/ACM Transactions on Networking, Vol.22, No.1, February 2014, pp.326-
340.

49
[12]. Yuedong Xu, Yipeng Zhou, and Dah-Ming Chiu, “Analytical QoE Models for
Bit-Rate Switching in Dynamic Adaptive Streaming Systems”, IEEE
Transaction on Mobile Computing, Vol.13, No.12, December 2014, pp. 2734-
2748.
[13]. Hung T. Le, Duc V. Nguyen, Nam Pham Ngoc, Anh T. Pham, and Truong
Cong Thang, “Buffer-based Bitrate Adaptation for Adaptive HTTP
Streaming”, The 2013 International Conference on Advanced Technologies for
Communications (ATC'13), 16 - 18 Oct. 2013, pp. 33 – 38.
[14]. Min Xing, Siyuan Xiang, and Lin Cai, “A Real-Time Adaptive Algorithm for
Video Streaming over Multiple Wireless Access Networks”, IEEE Journal on
Selected Areas in Communications, Vol.32, No.4, April 2014, pp.795-805.
[15]. Yunmin Go, Oh Chan Kwon, and Hwangjun Song, “An Energy-efficient
HTTP Adaptive Video Streaming with Networking Cost Constraint over
Heterogeneous Wireless Networks”, IEEE Transaction on Multimedia, Year
2015.
[16]. Zhi Li, Xiaoqing Zhu, Joshua Gahm, Rong Pan, Hao Hu, Ali C. Begen, and
David Oran, “Probe and Adapt: Rate Adaptation for HTTP Video Streaming
At Scale”, IEEE Journal on Selected Areas in Communications, Vol.32, No. 4,
April 2014.
[17]. Maxim Claeys, Steven Latr´e, Jeroen Famaey, and Filip De Turck “Design and
Evaluation of a Self-Learning HTTP Adaptive Video Streaming Client” in
IEEE Communication Letters, Vol.18, No.4, April 2014, pp.716-719.
[18]. http://www.rcom.co.in/Rcom/personal/internet/wireless_internet.html
[19]. “HTML5 Speed Test”. [Online]. Available at: http://speedof.me/.
[20]. ITU-T Recommendation Series J, “Objective Perceptual Multimedia Video
Quality Measurement in the Presence of a Full Reference”, document # J.247,
August 2008.
[21]. ISO/IEC JTC1/SC29/WG11 and ITU-T SG16 Q.6, “New Video Quality
Metrics in the H.264 Reference Software”, document # JVT-AB031, July,
2008.
[22]. Anush K. Moorthy and Alan C. Bovik, “Efficient Motion Weighted Spatio-
Temporal Video SSIM Index”, Proc. SPIE 7527, Human Vision and Electronic
Imaging XV, 75271I, February 17, 2010.
[23]. https://media.xiph.org/video/derf/
[24]. Angelos Michalas, Aggeliki Sgora, Dimitrios D. Vergados,"FDASH: A Fuzzy-
Based MPEG/DASH Adaptation Algorithm”, IEEE Systems Journal, Volume
10, Number 2, pp.859-868, June 2016.

50
[25]. Parikshit Juluri, Venkatesh Tamarapalli, “SARA: Segment aware rate
adaptation algorithm for dynamic adaptive streaming over HTTP”, IEEE
International Conference on Communication Workshop (ICCW), pp 1765-
1770, June 2015.
[26]. ITU-T Recommendation Series Y, “Global Information Infrastructure, Internet
Protocol Aspects and Next generation Networks”, document # Y.1540, March
2011.
[27]. ITU-T Recommendation Series J, “Reference algorithm for computing peak
signal to noise ratio of a processed video sequence with compensation for
constant spatial shifts, constant temporal shift, and constant luminance gain
and offset”, document # J.340, June 2010.
[28]. ITU-T Recommendation Series J,” Method for specifying accuracy and cross-
calibration of Video Quality Metrics (VQM) ”, document # J.149, March 2004.
[29]. Huda M. A. El Hag, Sami M. Sharif, "An adjusted ARIMA model for internet
traffic", IEEE Africon, Windhoek, pp.1-6, September 2007.
[30]. Tano, Subanar, "New procedure for determining order of subset autoregressive
integrated moving average (ARIMA) based on over-fitting concept",
International Conference on Statistics in Science, Business, and Engineering
(ICSSBE), Langkawi, pp 1-5, Sep 2012.
[31]. Liang Wang and Gaetan A. Libert, "Combining Pattern Recognition
Techniques with Akaike’s Information Criteria for Identifying ARMA
Models", IEEE Transactions On Signal Processing, Vol. 42, No. 6, June 1994.
[32]. Seghouane, Canberra Res, “The Akaike Information Criterion With Parameter
Uncertainty”, Fourth IEEE Workshop on Sensor Array and Multichannel
Processing, Waltham, pp.430-434, July 2006.
[33]. Parikshit Juluri, Venkatesh Tamarapalli, “SARA: Segment aware rate
adaptation algorithm for dynamic adaptive streaming over HTTP”, IEEE
International Conference on Communication Workshop (ICCW), pp 1765-
1770, June 2015.
[34]. “DirectShow (Windows)”. [Online]. Available
at:https://msdn.microsoft.com/enus/library/windows/desktop/dd375454(v=vs.
85).aspx
[35]. Sangwook Bae, Dahyun Jang, and KyoungSoo Park, “Why Is HTTP Adaptive
Streaming So Hard?”, Proc. of the 6thAsia- Pacific Workshop on Systems
(APSys '15), Tokyo, July 27-28, 2015.
[36]. Li Yu, TammamTillo, and Jimin Xiao, “QoE-Driven Dynamic Adaptive Video
Streaming Strategy With Future Information”, IEEE Transactions on
Broadcasting, Issue 99, pp 1-12, April 2017.

51
[37]. Guibin Tian and Yong Liu (2015), “Towards Agile and Smooth Video
Adaptation in HTTP AdaptiveStreaming”, IEEE/ACM Transactions On
Networking, Sept 2015.
[38]. Sergio Cicalò, NesrineChanguel, VelioTralli,
BessemSayadi,FrédéricFaucheux, and SylvaineKerboeuf “Improving QoEand
Fairness in HTTP Adaptive Streaming Over LTE Network”, IEEE Trans. on
Circuits and Systems for Video Technology, Vol. 26, Issue: 12, pp. 2284 –
2298, Dec. 2016
[39]. Yu-Lin Chient, Kate Ching-Ju Lin, and Ming-Syan Chen, “Machine Learning
Based Rate Adaptation with Elastic Feature Selection For Http-Based
Streaming”, Proc. of IEEE International Conference on Multimedia and Expo
(ICME), Turin, Italy, 29 June-3 July 2015.
[40]. Richard S. Sutton and Andrew G. Barto, “Reinforcement Learning:An
Introduction”, MIT PressCambridge, Massachusetts, 2012.
[41]. Virginia Martín, Julián Cabrera, and NarcisoGarcía,“Design, optimization and
evaluation of a Q-Learning HTTP Adaptive Video Streaming Client”,IEEE
Trans on Consumer Electronics, Vol. 62, No. 4, pp.380-388, Nov. 2016.
[42]. Stefan Winkler, “Video Quality Measurement Standards–Current Status and
Trends”, Proc. of 7th International Conference on Information,
Communications and Signal Processing (ICICS), Macau, China, 8-10 Dec.
2009.
[43]. ITU-T Recommendation series G, “Transmission systems and media, digital
systems and networks”, G.1070, 2012.
[44]. http://www.cse.unsw.edu.au/~cs9417ml/RL1/algorithms.html
[45]. http://jnetpcap.com/