Video Shakes Up IP Edge en Whitepaper
16
VIDE O SHA KES UP THE IP EDGE A BELL LABS STUDY ON RISING VIDEO DEMAND AND IT S IMPACT ON BROADBAND IP NETWORKS STRATEGIC WHITE PAPER As consumers demand ever more video and video consumption methods, the broadband IP networks used by many service providers to offer residential services will be overwhelmed by the sheer volume of data. The problem will be most acute at the IP edge of a triple-play provider’s network, where video traffic will grow 2.5 times faster than traffic on subscriber links. To thrive in this new era of high bandwidth services, service providers will need to delight their customers with compelling new video on demand (VoD) services while keeping unicast video transport costs in check and controlling the bandwidth consumed by over- the-top (OTT ) video. To accomplish their goals, providers need to move away from broadband architectures based on legacy Broadband Network Gatewa y /Broadband Remote Access Server (BNG/BRA S) routers and adopt a distributed network architecture based on enhanced, terabit -speed BNGs and content delive ry network (CDN) caches. This document provides a detailed forecast of video consumption to 2020, determines the impact of video growth on IP service networks, and outlines strategies for rising above these challenges. A detailed Bell Labs case study quantifi es the total cost of ownership ( TCO) savings of moving from a centralized to a distributed IP edge with CDN caching.
-
date post
03-Jun-2018 -
Category
Documents
-
view
224 -
download
0
Transcript of Video Shakes Up IP Edge en Whitepaper
8/11/2019 Video Shakes Up IP Edge en Whitepaper
http://slidepdf.com/reader/full/video-shakes-up-ip-edge-en-whitepaper 1/16
VIDEO SHAKESUP THE IP EDGEA BELL LABS STUDY ON RISINGVIDEO DEMAND AND ITS IMPACTON BROADBAND IP NETWORKSSTRATEGIC WHITE PAPER
As consumers demand ever more video and video consumption methods, the
broadband IP networks used by many service providers to offer residential
services will be overwhelmed by the sheer volume of data. The problem will
be most acute at the IP edge of a triple-play provider’s network, where video
trafc will grow 2.5 times faster than trafc on subscriber links. To thrive in
this new era of high bandwidth services, service providers will need to delight
their customers with compelling new video on demand (VoD) services while
keeping unicast video transport costs in check and controlling the bandwidth
consumed by over-the-top (OTT) video.
To accomplish their goals, providers need to move away from broadband
architectures based on legacy Broadband Network Gateway/Broadband
Remote Access Server (BNG/BRAS) routers and adopt a distributed networkarchitecture based on enhanced, terabit-speed BNGs and content delivery
network (CDN) caches.
This document provides a detailed forecast of video consumption to 2020,
determines the impact of video growth on IP service networks, and outlines
strategies for rising above these challenges. A detailed Bell Labs case study
quanties the total cost of ownership (TCO) savings of moving from a
centralized to a distributed IP edge with CDN caching.
8/11/2019 Video Shakes Up IP Edge en Whitepaper
http://slidepdf.com/reader/full/video-shakes-up-ip-edge-en-whitepaper 2/16
8/11/2019 Video Shakes Up IP Edge en Whitepaper
http://slidepdf.com/reader/full/video-shakes-up-ip-edge-en-whitepaper 3/16
Video shakes up the IP edge: Extended – A Bell Labs study on rising video demand and its impact on broadband IP networksALCATEL LUCENT WHITE PAPER
1
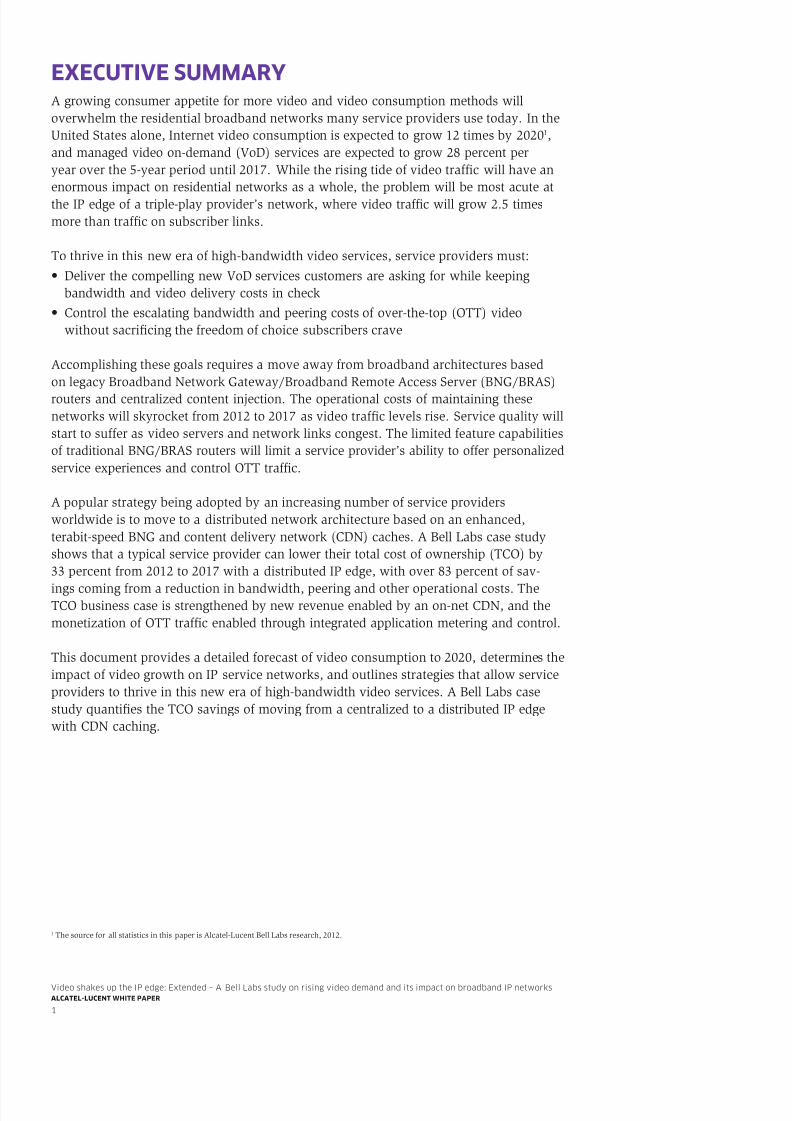
EXECUTIVE SUMMARYA growing consumer appetite for more video and video consumption methods willoverwhelm the residential broadband networks many service providers use today. In theUnited States alone, Internet video consumption is expected to grow 12 times by 2020 1,and managed video on-demand (VoD) services are expected to grow 28 percent peryear over the 5-year period until 2017. While the rising tide of video trafc will have anenormous impact on residential networks as a whole, the problem will be most acute atthe IP edge of a triple-play provider’s network, where video trafc will grow 2.5 timesmore than trafc on subscriber links.
To thrive in this new era of high-bandwidth video services, service providers must:• Deliver the compelling new VoD services customers are asking for while keeping
bandwidth and video delivery costs in check• Control the escalating bandwidth and peering costs of over-the-top (OTT) video
without sacricing the freedom of choice subscribers crave
Accomplishing these goals requires a move away from broadband architectures basedon legacy Broadband Network Gateway/Broadband Remote Access Server (BNG/BRAS)routers and centralized content injection. The operational costs of maintaining thesenetworks will skyrocket from 2012 to 2017 as video trafc levels rise. Service quality willstart to suffer as video servers and network links congest. The limited feature capabilitiesof traditional BNG/BRAS routers will limit a service provider’s ability to offer personalizedservice experiences and control OTT traf c.
A popular strategy being adopted by an increasing number of service providersworldwide is to move to a distributed network architecture based on an enhanced,terabit-speed BNG and content delivery network (CDN) caches. A Bell Labs case studyshows that a typical service provider can lower their total cost of ownership (TCO) by33 percent from 2012 to 2017 with a distributed IP edge, with over 83 percent of sav-
ings coming from a reduction in bandwidth, peering and other operational costs. TheTCO business case is strengthened by new revenue enabled by an on-net CDN, and themonetization of OTT traf c enabled through integrated application metering and control.
This document provides a detailed forecast of video consumption to 2020, determines theimpact of video growth on IP service networks, and outlines strategies that allow serviceproviders to thrive in this new era of high-bandwidth video services. A Bell Labs casestudy quanti es the TCO savings of moving from a centralized to a distributed IP edgewith CDN caching.
1 The source for all statistics in this paper is Alcatel-Lucent Bell Labs research, 2012.
8/11/2019 Video Shakes Up IP Edge en Whitepaper
http://slidepdf.com/reader/full/video-shakes-up-ip-edge-en-whitepaper 4/16
Video shakes up the IP edge: Extended – A Bell Labs study on rising video demand and its impact on broadband IP networksALCATEL LUCENT WHITE PAPER
2
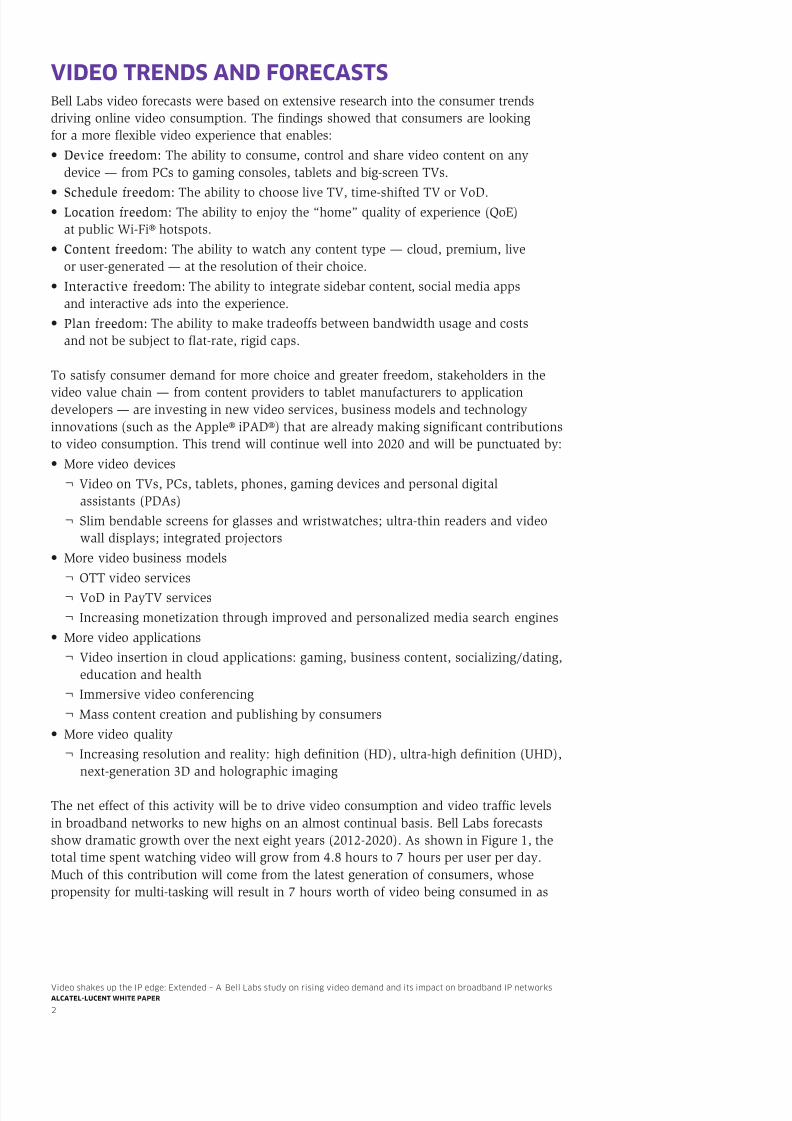
VIDEO TRENDS AND FORECASTSBell Labs video forecasts were based on extensive research into the consumer trendsdriving online video consumption. The ndings showed that consumers are lookingfor a more exible video experience that enables:• Device freedom: The ability to consume, control and share video content on any
device — from PCs to gaming consoles, tablets and big-screen TVs.
• Schedule freedom: The ability to choose live TV, time-shifted TV or VoD.• Location freedom: The ability to enjoy the “home” quality of experience (QoE)
at public Wi-Fi® hotspots.• Content freedom: The ability to watch any content type — cloud, premium, live
or user-generated — at the resolution of their choice.• Interactive freedom: The ability to integrate sidebar content, social media apps
and interactive ads into the experience.• Plan freedom: The ability to make tradeoffs between bandwidth usage and costs
and not be subject to at-rate, rigid caps.
To satisfy consumer demand for more choice and greater freedom, stakeholders in the
video value chain — from content providers to tablet manufacturers to applicationdevelopers — are investing in new video services, business models and technologyinnovations (such as the Apple® iPAD®) that are already making signicant contributionsto video consumption. This trend will continue well into 2020 and will be punctuated by:• More video devices
¬ Video on TVs, PCs, tablets, phones, gaming devices and personal digitalassistants (PDAs)
¬ Slim bendable screens for glasses and wristwatches; ultra-thin readers and videowall displays; integrated projectors
• More video business models¬ OTT video services¬ VoD in PayTV services¬ Increasing monetization through improved and personalized media search engines
• More video applications¬ Video insertion in cloud applications: gaming, business content, socializing/dating,
education and health¬ Immersive video conferencing¬ Mass content creation and publishing by consumers
• More video quality¬ Increasing resolution and reality: high denition (HD), ultra-high denition (UHD),
next-generation 3D and holographic imaging
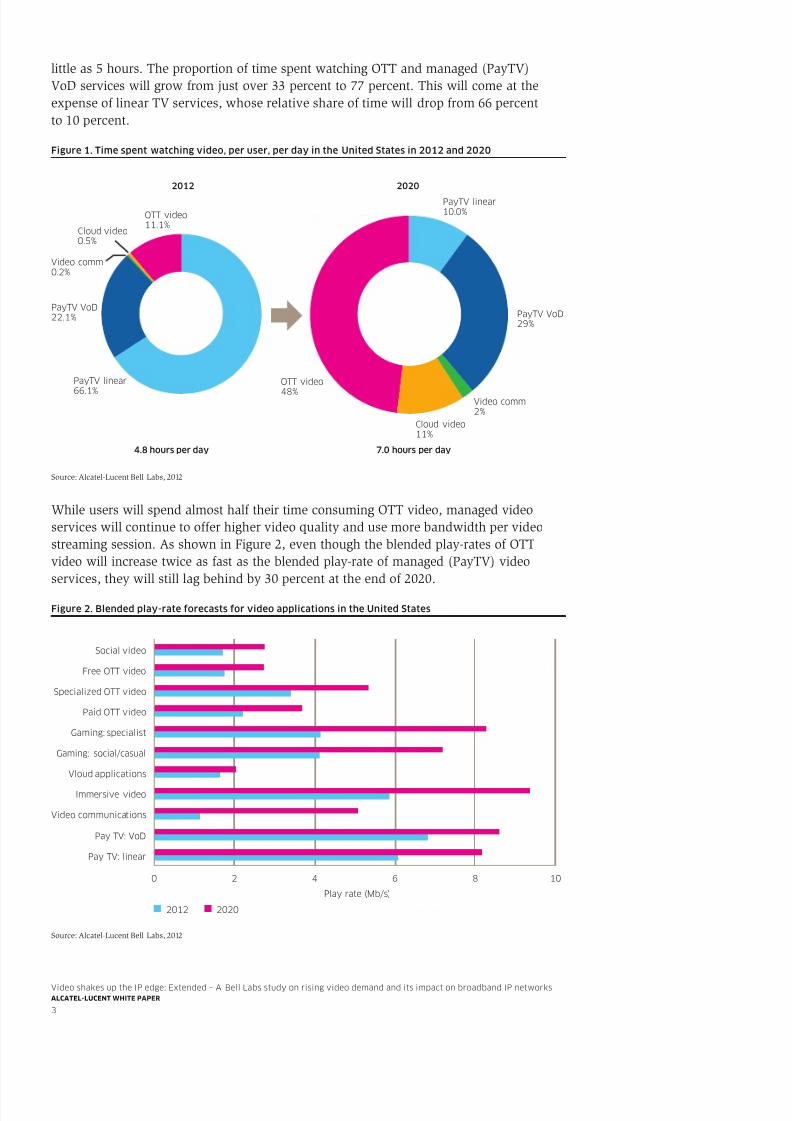
The net effect of this activity will be to drive video consumption and video trafc levelsin broadband networks to new highs on an almost continual basis. Bell Labs forecastsshow dramatic growth over the next eight years (2012-2020). As shown in Figure 1, thetotal time spent watching video will grow from 4.8 hours to 7 hours per user per day.Much of this contribution will come from the latest generation of consumers, whosepropensity for multi-tasking will result in 7 hours worth of video being consumed in as
8/11/2019 Video Shakes Up IP Edge en Whitepaper
http://slidepdf.com/reader/full/video-shakes-up-ip-edge-en-whitepaper 5/16
Video shakes up the IP edge: Extended – A Bell Labs study on rising video demand and its impact on broadband IP networksALCATEL LUCENT WHITE PAPER
3
little as 5 hours. The proportion of time spent watching OTT and managed (PayTV)VoD services will grow from just over 33 percent to 77 percent. This will come at theexpense of linear TV services, whose relative share of time will drop from 66 percentto 10 percent. Figure 1. Time spent watching video, per user, per day in the United States in 2012 and 2020
Source: Alcatel-Lucent Bell Labs, 2012
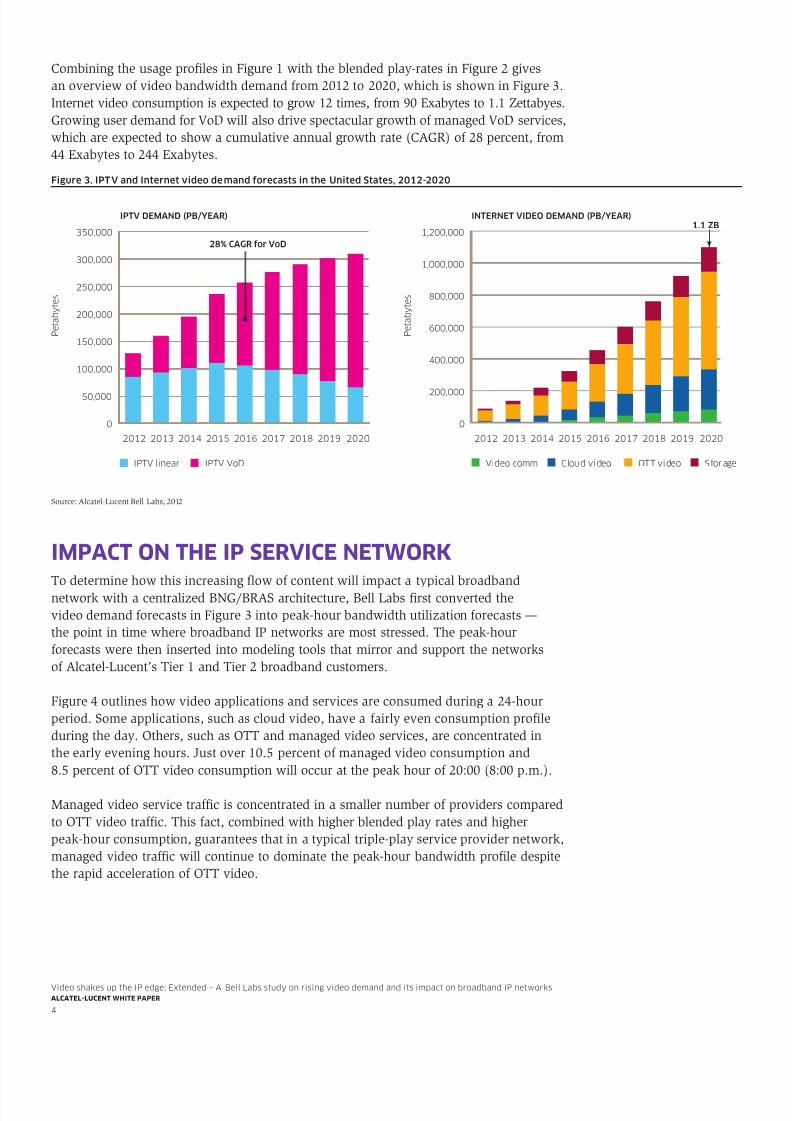
While users will spend almost half their time consuming OTT video, managed videoservices will continue to offer higher video quality and use more bandwidth per videostreaming session. As shown in Figure 2, even though the blended play-rates of OTTvideo will increase twice as fast as the blended play-rate of managed (PayTV) videoservices, they will still lag behind by 30 percent at the end of 2020.
Figure 2. Blended play-rate forecasts for video applications in the United States
Source: Alcatel-Lucent Bell Labs, 2012
PayTV linear10.0%
PayTV VoD29%
PayTV VoD22.1%
PayTV linear
66.1%
Video comm0.2%
Cloud video0.5%
OTT video11.1%
OTT video
48% Video comm2%
Cloud video11%
20202012
7.0 hours per day4.8 hours per day
Video communications
Pay TV: VoD
Pay TV: linear
Play rate (Mb/s)
2012
0 2 4 6 8 10
Immersive video
Vloud applications
Gaming: social/casual
Gaming: specialist
Paid OTT video
Specialized OTT video
Free OTT video
Social video
2020
8/11/2019 Video Shakes Up IP Edge en Whitepaper
http://slidepdf.com/reader/full/video-shakes-up-ip-edge-en-whitepaper 6/16
Video shakes up the IP edge: Extended – A Bell Labs study on rising video demand and its impact on broadband IP networksALCATEL LUCENT WHITE PAPER
4
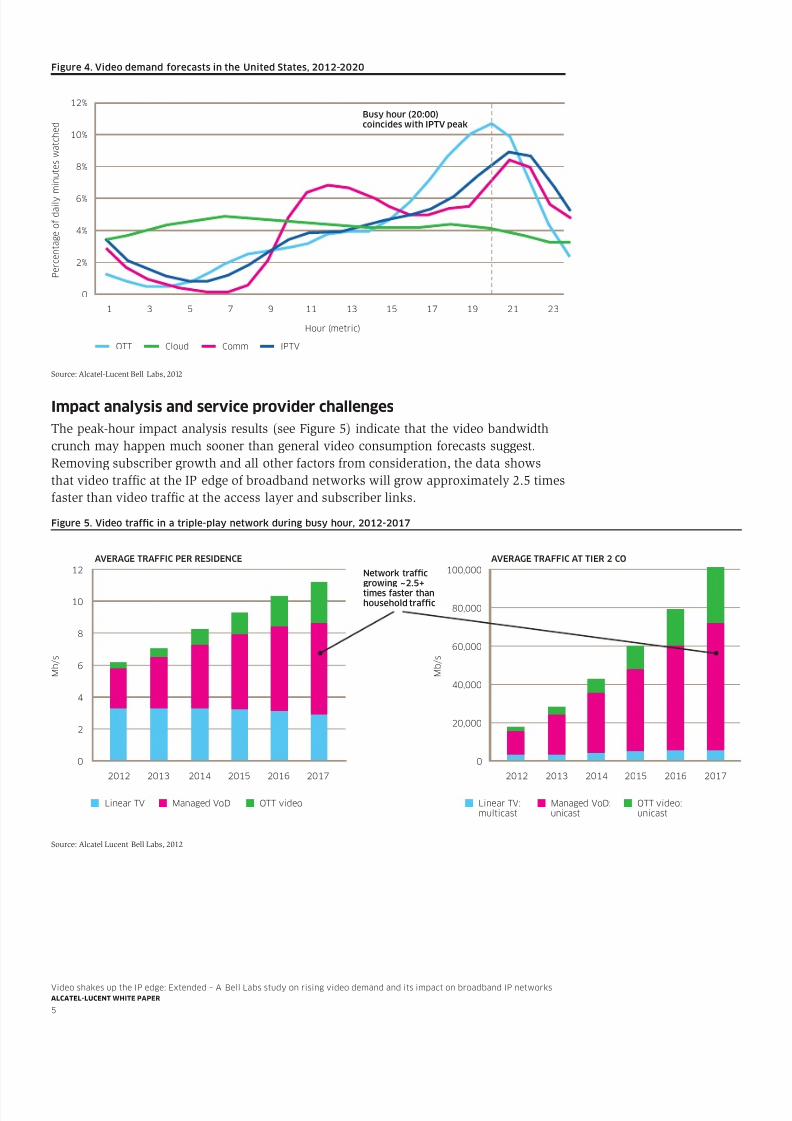
Combining the usage pro les in Figure 1 with the blended play-rates in Figure 2 givesan overview of video bandwidth demand from 2012 to 2020, which is shown in Figure 3.Internet video consumption is expected to grow 12 times, from 90 Exabytes to 1.1 Zettabyes.Growing user demand for VoD will also drive spectacular growth of managed VoD services,which are expected to show a cumulative annual growth rate (CAGR) of 28 percent, from44 Exabytes to 244 Exabytes.
Source: Alcatel-Lucent Bell Labs, 2012
IMPACT ON THE IP SERVICE NETWORKTo determine how this increasing ow of content will impact a typical broadbandnetwork with a centralized BNG/BRAS architecture, Bell Labs rst converted thevideo demand forecasts in Figure 3 into peak-hour bandwidth utilization forecasts —the point in time where broadband IP networks are most stressed. The peak-hourforecasts were then inserted into modeling tools that mirror and support the networksof Alcatel-Lucent’s Tier 1 and Tier 2 broadband customers.
Figure 4 outlines how video applications and services are consumed during a 24-hourperiod. Some applications, such as cloud video, have a fairly even consumption proleduring the day. Others, such as OTT and managed video services, are concentrated inthe early evening hours. Just over 10.5 percent of managed video consumption and8.5 percent of OTT video consumption will occur at the peak hour of 20:00 (8:00 p.m.).
Managed video service traf c is concentrated in a smaller number of providers comparedto OTT video traf c. This fact, combined with higher blended play rates and higherpeak-hour consumption, guarantees that in a typical triple-play service provider network,managed video trafc will continue to dominate the peak-hour bandwidth prole despitethe rapid acceleration of OTT video.
Figure 3. IPT V and Internet video de mand forecasts in the United States, 2012-2020
IPTV linear
350,000
P e t a
b y t e s
300,000
250,000
200,000
2012 2013 2014 2015 2016 2017 2018 2019 2020
150,000
100,000
50,000
0
IPTV VoD Video comm
IPTV DEMAND (PB/YEAR)
28% CAGR for VoD
INTERNET VIDEO DEMAND (PB/YEAR)
1,200,000
P e t a
b y t e s
1,000,000
800,000
600,000
2012 2013 2014 2015 2016 2017 2018 2019 2020
400,000
200,000
0
Cloud video OTT video Storage
1.1 ZB
8/11/2019 Video Shakes Up IP Edge en Whitepaper
http://slidepdf.com/reader/full/video-shakes-up-ip-edge-en-whitepaper 7/16
Video shakes up the IP edge: Extended – A Bell Labs study on rising video demand and its impact on broadband IP networksALCATEL LUCENT WHITE PAPER
5
Figure 4. Video demand forecasts in the United States, 2012-2020
Source: Alcatel-Lucent Bell Labs, 2012
Impact analysis and service provider challengesThe peak-hour impact analysis results (see Figure 5) indicate that the video bandwidthcrunch may happen much sooner than general video consumption forecasts suggest.Removing subscriber growth and all other factors from consideration, the data showsthat video trafc at the IP edge of broadband networks will grow approximately 2.5 timesfaster than video trafc at the access layer and subscriber links.
Source: Alcatel Lucent Bell Labs, 2012
OTT
12%
P e r c e n
t a g e o
f d a
i l y m
i n u
t e s w a
t c h e
d
10%
8%
6%
1 3 5 7 9 11 13
Hour (metric)
Busy hour (20:00)coincides with IPTV peak
15 17 19 21 23
4%
2%
0
Cloud Comm IPTV
Figure 5. Video trafc in a triple-play network during busy hour, 2012-2017
Linear TV Managed VoD OTT video Linear TV:multicast
12
M b / s
10
8
6
4
2
0
2012 2013 2014 2015 2016 2017
AVERAGE TRAFFIC PER RESIDENCE AVERAGE TRAFFIC AT TIER 2 CO
Network trafcgrowing
~2.5+
times faster thanhousehold trafc
100,000
M b / s
80,000
60,000
40,000
20,000
0
2012 2013 2014 2015 2016 2017
Managed VoD:unicast
OTT video:unicast
8/11/2019 Video Shakes Up IP Edge en Whitepaper
http://slidepdf.com/reader/full/video-shakes-up-ip-edge-en-whitepaper 8/16
Video shakes up the IP edge: Extended – A Bell Labs study on rising video demand and its impact on broadband IP networksALCATEL LUCENT WHITE PAPER
6
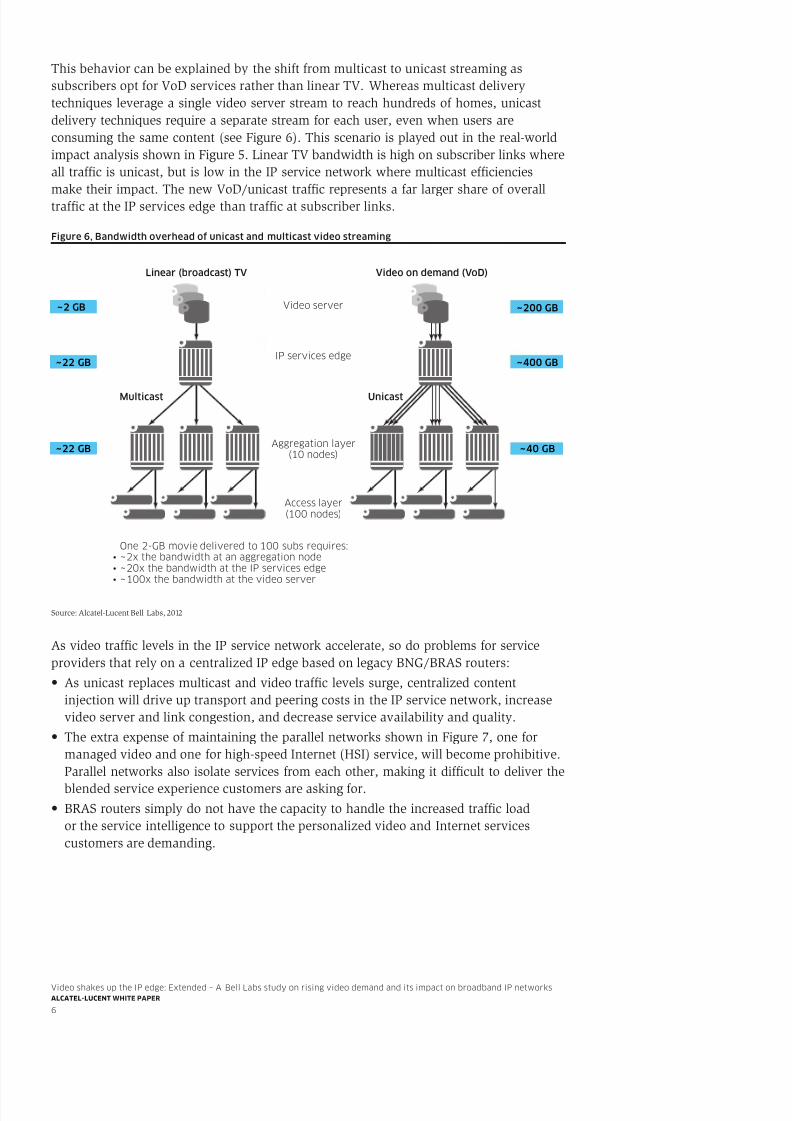
This behavior can be explained by the shift from multicast to unicast streaming assubscribers opt for VoD services rather than linear TV. Whereas multicast deliverytechniques leverage a single video server stream to reach hundreds of homes, unicastdelivery techniques require a separate stream for each user, even when users areconsuming the same content (see Figure 6). This scenario is played out in the real-worldimpact analysis shown in Figure 5. Linear TV bandwidth is high on subscriber links whereall trafc is unicast, but is low in the IP service network where multicast efciencies
make their impact. The new VoD/unicast trafc represents a far larger share of overalltrafc at the IP services edge than trafc at subscriber links.
Figure 6, Bandwidth overhead of unicast and multicast video streaming
Source: Alcatel-Lucent Bell Labs, 2012
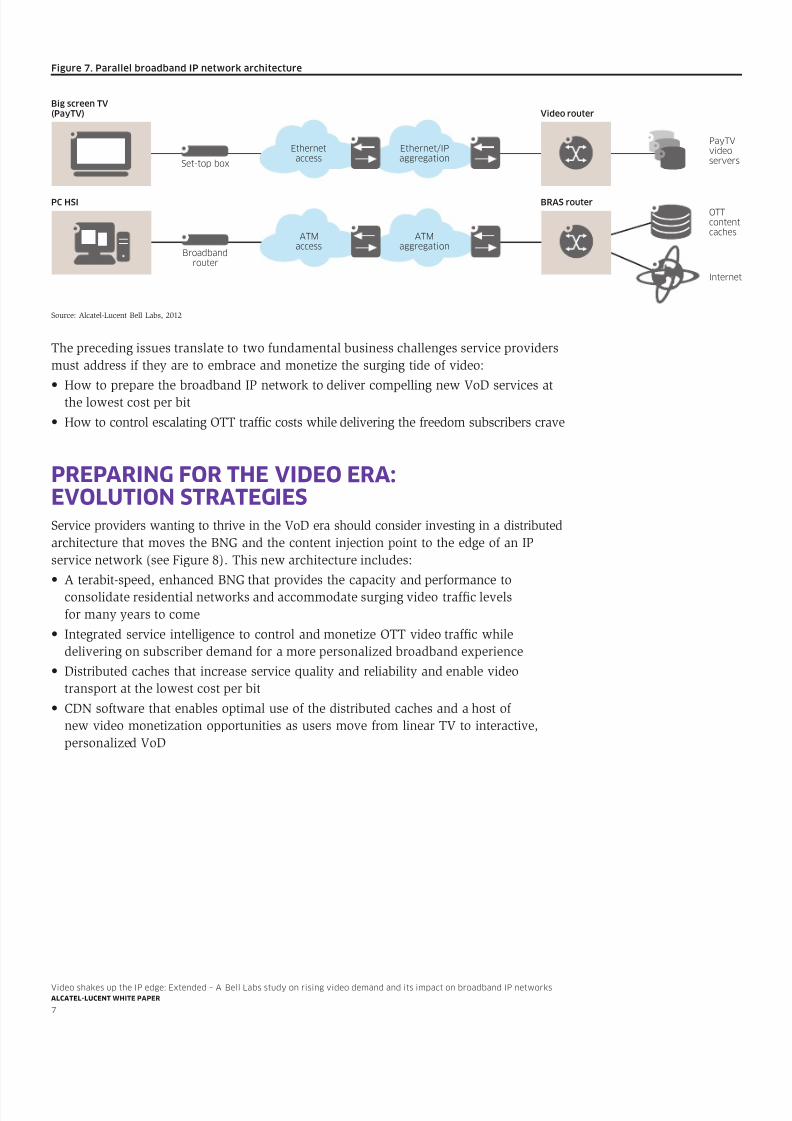
As video trafc levels in the IP service network accelerate, so do problems for serviceproviders that rely on a centralized IP edge based on legacy BNG/BRAS routers:• As unicast replaces multicast and video traf c levels surge, centralized content
injection will drive up transport and peering costs in the IP service network, increasevideo server and link congestion, and decrease service availability and quality.
• The extra expense of maintaining the parallel networks shown in Figure 7, one formanaged video and one for high-speed Internet (HSI) service, will become prohibitive.Parallel networks also isolate services from each other, making it difcult to deliver theblended service experience customers are asking for.
• BRAS routers simply do not have the capacity to handle the increased traf c loador the service intelligence to support the personalized video and Internet servicescustomers are demanding.
Aggregation layer(10 nodes)
IP services edge
One 2-GB movie delivered to 100 subs requires:• ~ 2x the bandwidth at an aggregation node• ~ 20x the bandwidth at the IP services edge• ~ 100x the bandwidth at the video server
Video server
Linear (broadcast) TV Video on demand (VoD)
UnicastMulticast
Access layer(100 nodes)
~ 2 GB
~ 22 GB
~ 22 GB
~ 200 GB
~ 400 GB
~ 40 GB
8/11/2019 Video Shakes Up IP Edge en Whitepaper
http://slidepdf.com/reader/full/video-shakes-up-ip-edge-en-whitepaper 9/16
Video shakes up the IP edge: Extended – A Bell Labs study on rising video demand and its impact on broadband IP networksALCATEL LUCENT WHITE PAPER
7
Source: Alcatel-Lucent Bell Labs, 2012
The preceding issues translate to two fundamental business challenges service providersmust address if they are to embrace and monetize the surging tide of video:• How to prepare the broadband IP network to deliver compelling new VoD services at
the lowest cost per bit• How to control escalating OTT traf c costs while delivering the freedom subscribers crave
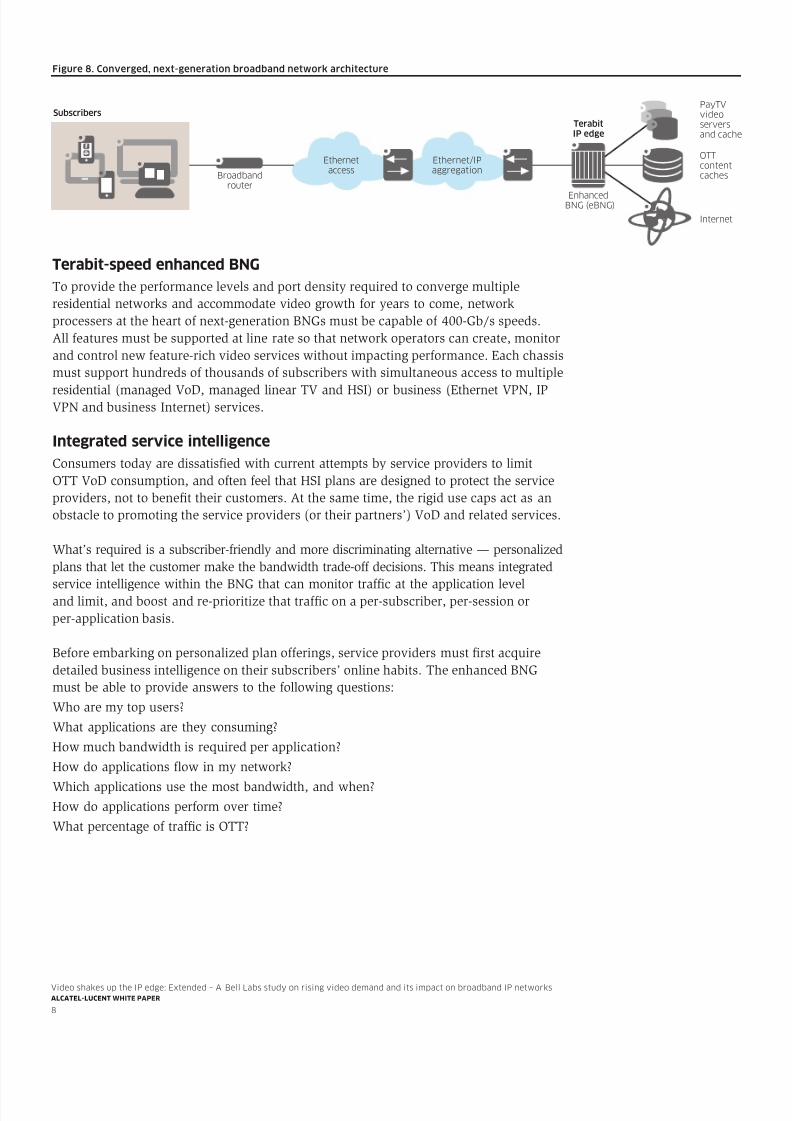
PREPARING FOR THE VIDEO ERA:EVOLUTION STRATEGIESService providers wanting to thrive in the VoD era should consider investing in a distributedarchitecture that moves the BNG and the content injection point to the edge of an IPservice network (see Figure 8). This new architecture includes:• A terabit-speed, enhanced BNG that provides the capacity and performance to
consolidate residential networks and accommodate surging video trafc levelsfor many years to come
• Integrated service intelligence to control and monetize OTT video traf c whiledelivering on subscriber demand for a more personalized broadband experience
• Distributed caches that increase service quality and reliability and enable videotransport at the lowest cost per bit
• CDN software that enables optimal use of the distributed caches and a host ofnew video monetization opportunities as users move from linear TV to interactive,personalized VoD
Figure 7. Parallel broadband IP network architecture
Big screen TV(PayTV)
PayTVvideoservers
Ethernet/IPaggregation
EthernetaccessSet-top box
PC HSI
Video router
BRAS routerOTTcontentcaches
Internet
ATMaggregation
ATMaccess
Broadbandrouter
8/11/2019 Video Shakes Up IP Edge en Whitepaper
http://slidepdf.com/reader/full/video-shakes-up-ip-edge-en-whitepaper 10/16
Video shakes up the IP edge: Extended – A Bell Labs study on rising video demand and its impact on broadband IP networksALCATEL LUCENT WHITE PAPER
8
Terabit-speed enhanced BNGTo provide the performance levels and port density required to converge multipleresidential networks and accommodate video growth for years to come, networkprocessers at the heart of next-generation BNGs must be capable of 400-Gb/s speeds.All features must be supported at line rate so that network operators can create, monitorand control new feature-rich video services without impacting performance. Each chassismust support hundreds of thousands of subscribers with simultaneous access to multiple
residential (managed VoD, managed linear TV and HSI) or business (Ethernet VPN, IPVPN and business Internet) services.
Integrated service intelligenceConsumers today are dissatis ed with current attempts by service providers to limitOTT VoD consumption, and often feel that HSI plans are designed to protect the serviceproviders, not to benet their customers. At the same time, the rigid use caps act as anobstacle to promoting the service providers (or their partners’) VoD and related services.
What’s required is a subscriber-friendly and more discriminating alternative — personalizedplans that let the customer make the bandwidth trade-off decisions. This means integrated
service intelligence within the BNG that can monitor trafc at the application leveland limit, and boost and re-prioritize that trafc on a per-subscriber, per-session orper-application basis.
Before embarking on personalized plan offerings, service providers must rst acquiredetailed business intelligence on their subscribers’ online habits. The enhanced BNGmust be able to provide answers to the following questions:Who are my top users?What applications are they consuming?How much bandwidth is required per application?How do applications ow in my network?
Which applications use the most bandwidth, and when?How do applications perform over time?What percentage of traf c is OTT?
Figure 8. Converged, next-generation broadband network architecture
SubscribersPayTVvideoserversand cache
Ethernet/IPaggregation
EthernetaccessBroadband
router
OTTcontentcaches
Internet
EnhancedBNG (eBNG)
TerabitIP edge
8/11/2019 Video Shakes Up IP Edge en Whitepaper
http://slidepdf.com/reader/full/video-shakes-up-ip-edge-en-whitepaper 11/16
Video shakes up the IP edge: Extended – A Bell Labs study on rising video demand and its impact on broadband IP networksALCATEL LUCENT WHITE PAPER
9
Armed with this information, service providers can begin offering personalized plans toensure fair-share usage in a manner that satises each subscriber’s unique needs. Anexample of a specialized plan is shown in Figure 9.
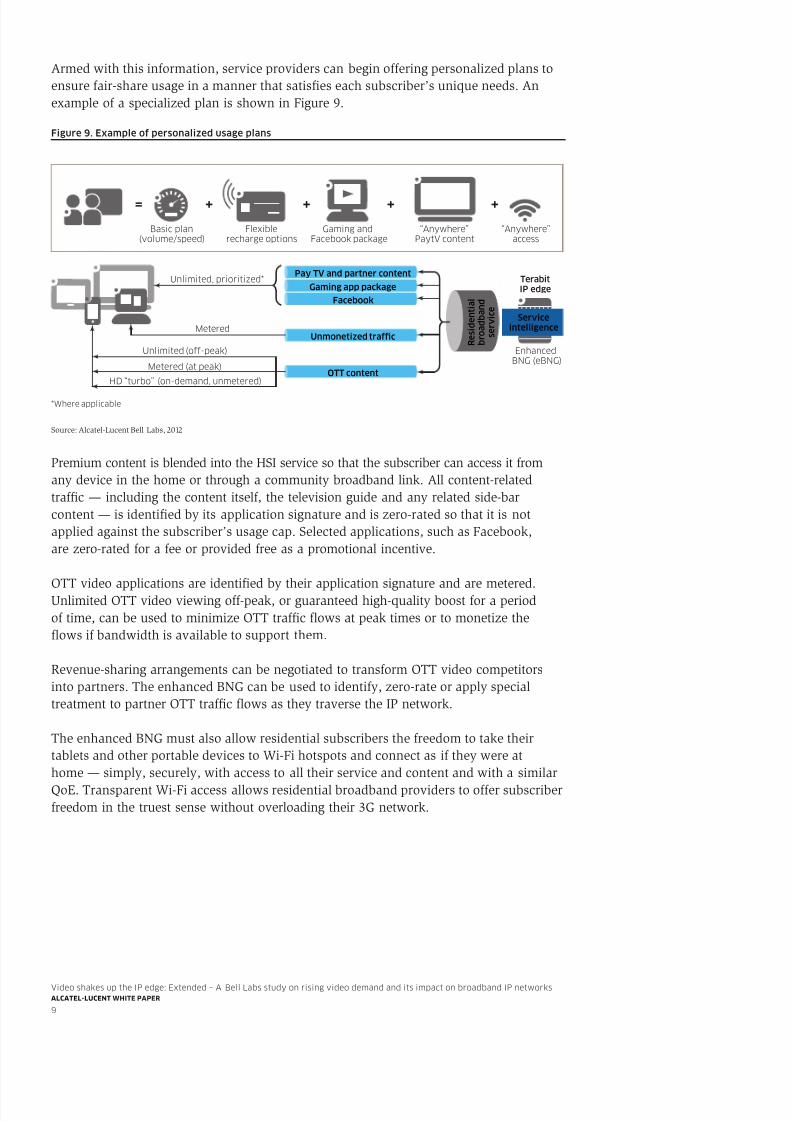
Figure 9. Example of personalized usage plans
Source: Alcatel-Lucent Bell Labs, 2012
Premium content is blended into the HSI service so that the subscriber can access it fromany device in the home or through a community broadband link. All content-relatedtrafc — including the content itself, the television guide and any related side-barcontent — is identied by its application signature and is zero-rated so that it is notapplied against the subscriber’s usage cap. Selected applications, such as Facebook,are zero-rated for a fee or provided free as a promotional incentive.
OTT video applications are identi ed by their application signature and are metered.Unlimited OTT video viewing off-peak, or guaranteed high-quality boost for a periodof time, can be used to minimize OTT traf c ows at peak times or to monetize theows if bandwidth is available to support them.
Revenue-sharing arrangements can be negotiated to transform OTT video competitorsinto partners. The enhanced BNG can be used to identify, zero-rate or apply specialtreatment to partner OTT traf c ows as they traverse the IP network.
The enhanced BNG must also allow residential subscribers the freedom to take theirtablets and other portable devices to Wi-Fi hotspots and connect as if they were athome — simply, securely, with access to all their service and content and with a similarQoE. Transparent Wi-Fi access allows residential broadband providers to offer subscriberfreedom in the truest sense without overloading their 3G network.
EnhancedBNG (eBNG)
Unlimited, prioritized*
*Where applicable
Metered
Unlimited (off-peak)
Metered (at peak)
HD “turbo” (on-demand, unmetered)
Basic plan(volume/speed)
Flexiblerecharge options
Gaming andFacebook package
“Anywhere”PaytV content
“Anywhere”access
TerabitIP edge
= + + + +
Pay TV and partner content
OTT content
Gaming app packageFacebook
Unmonetized trafc R e s
i d e n t i a l
b r o a
d b a n
d
s e r v
i c e
Serviceintelligence
8/11/2019 Video Shakes Up IP Edge en Whitepaper
http://slidepdf.com/reader/full/video-shakes-up-ip-edge-en-whitepaper 12/16
Video shakes up the IP edge: Extended – A Bell Labs study on rising video demand and its impact on broadband IP networksALCATEL LUCENT WHITE PAPER
10
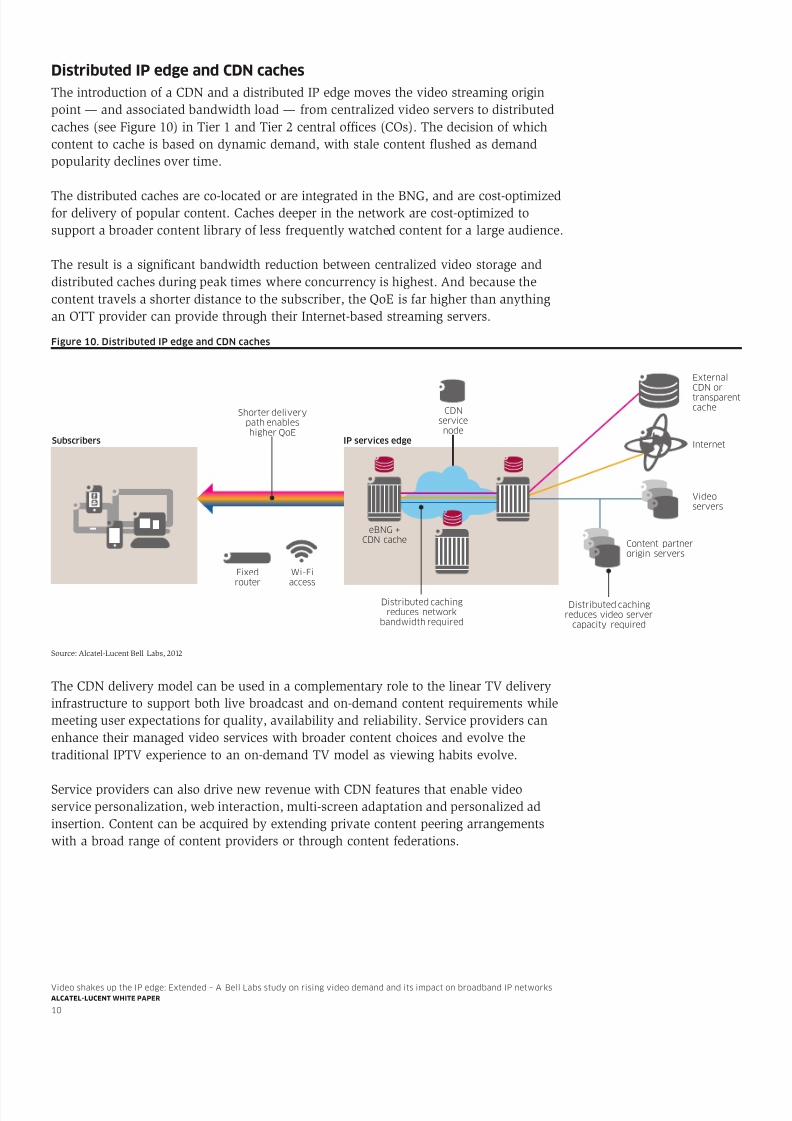
Distributed IP edge and CDN cachesThe introduction of a CDN and a distributed IP edge moves the video streaming originpoint — and associated bandwidth load — from centralized video servers to distributedcaches (see Figure 10) in Tier 1 and Tier 2 central of ces (COs). The decision of whichcontent to cache is based on dynamic demand, with stale content ushed as demandpopularity declines over time.
The distributed caches are co-located or are integrated in the BNG, and are cost-optimizedfor delivery of popular content. Caches deeper in the network are cost-optimized tosupport a broader content library of less frequently watched content for a large audience.
The result is a signicant bandwidth reduction between centralized video storage anddistributed caches during peak times where concurrency is highest. And because thecontent travels a shorter distance to the subscriber, the QoE is far higher than anythingan OTT provider can provide through their Internet-based streaming servers.
Source: Alcatel-Lucent Bell Labs, 2012
The CDN delivery model can be used in a complementary role to the linear TV deliveryinfrastructure to support both live broadcast and on-demand content requirements whilemeeting user expectations for quality, availability and reliability. Service providers canenhance their managed video services with broader content choices and evolve thetraditional IPTV experience to an on-demand TV model as viewing habits evolve.
Service providers can also drive new revenue with CDN features that enable videoservice personalization, web interaction, multi-screen adaptation and personalized adinsertion. Content can be acquired by extending private content peering arrangementswith a broad range of content providers or through content federations.
Figure 10. Distributed IP edge and CDN caches
Subscribers IP services edge
Videoservers
Content partnerorigin servers
Fixedrouter
ExternalCDN ortransparentcacheCDN
servicenode
Shorter deliverypath enableshigher QoE
Distributed cachingreduces network
bandwidth required
Distributed cachingreduces video server
capacity required
eBNG +CDN cache
Internet
Wi-Fiaccess
8/11/2019 Video Shakes Up IP Edge en Whitepaper
http://slidepdf.com/reader/full/video-shakes-up-ip-edge-en-whitepaper 13/16
Video shakes up the IP edge: Extended – A Bell Labs study on rising video demand and its impact on broadband IP networksALCATEL LUCENT WHITE PAPER
11
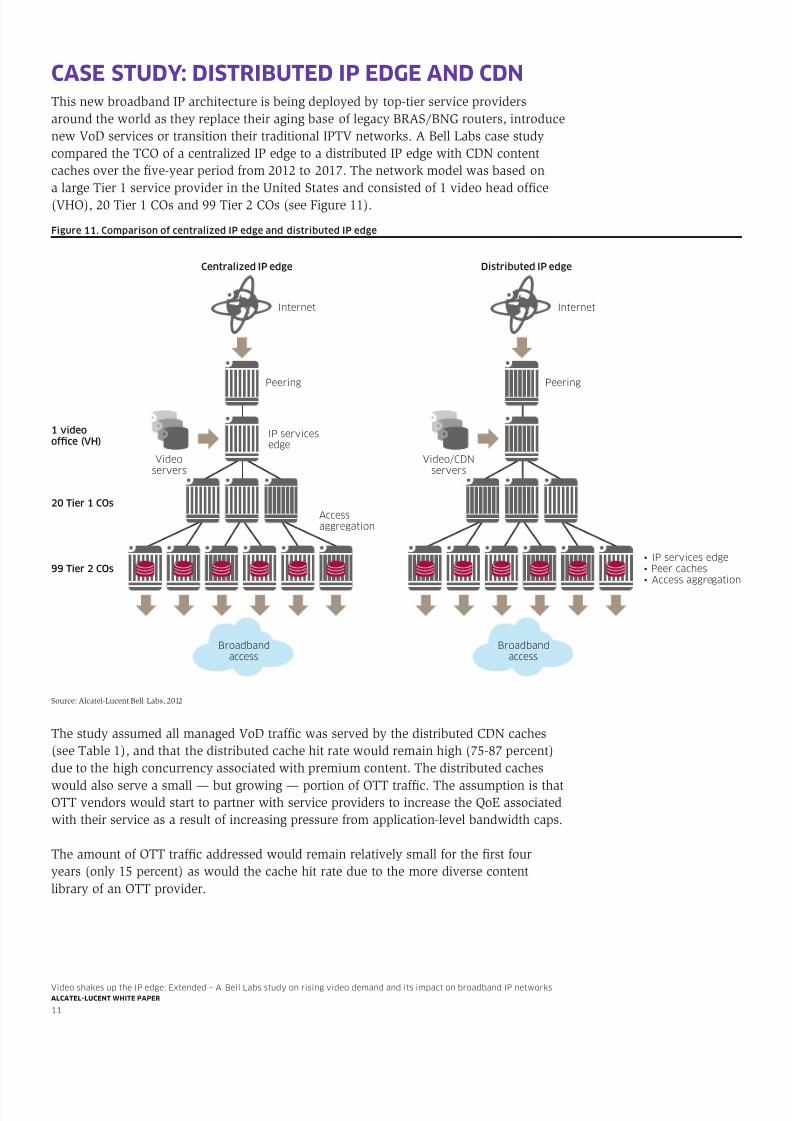
CASE STUDY: DISTRIBUTED IP EDGE AND CDNThis new broadband IP architecture is being deployed by top-tier service providersaround the world as they replace their aging base of legacy BRAS/BNG routers, introducenew VoD services or transition their traditional IPTV networks. A Bell Labs case studycompared the TCO of a centralized IP edge to a distributed IP edge with CDN contentcaches over the ve-year period from 2012 to 2017. The network model was based ona large Tier 1 service provider in the United States and consisted of 1 video head ofce(VHO), 20 Tier 1 COs and 99 Tier 2 COs (see Figure 11).
Source: Alcatel-Lucent Bell Labs, 2012
The study assumed all managed VoD traf c was served by the distributed CDN caches(see Table 1), and that the distributed cache hit rate would remain high (75-87 percent)due to the high concurrency associated with premium content. The distributed caches
would also serve a small — but growing — portion of OTT traf c. The assumption is thatOTT vendors would start to partner with service providers to increase the QoE associatedwith their service as a result of increasing pressure from application-level bandwidth caps.
The amount of OTT traf c addressed would remain relatively small for the rst fouryears (only 15 percent) as would the cache hit rate due to the more diverse contentlibrary of an OTT provider.
Figure 11. Comparison of centralized IP edge and distributed IP edge
Distributed IP edge
• IP services edge• Peer caches• Access aggregation
IP servicesedge
Accessaggregation
Peerin g Peering
Video/CDNservers
Internet
Broadbandaccess
Centralized IP edge
Videoservers
99 Tier 2 COs
1 videoofce (VH)
20 Tier 1 COs
Internet
Broadbandaccess
8/11/2019 Video Shakes Up IP Edge en Whitepaper
http://slidepdf.com/reader/full/video-shakes-up-ip-edge-en-whitepaper 14/16
Video shakes up the IP edge: Extended – A Bell Labs study on rising video demand and its impact on broadband IP networksALCATEL LUCENT WHITE PAPER
12
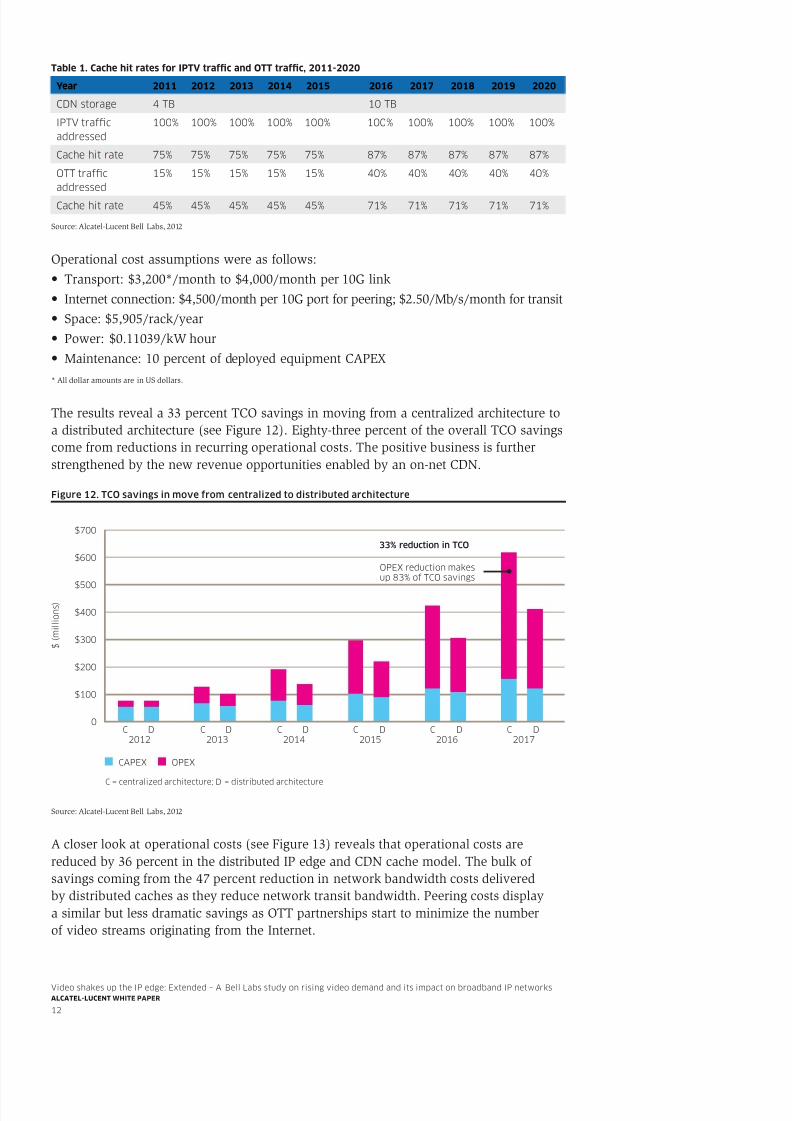
Table 1. Cache hit rates for IPTV trafc and OTT trafc, 2011-2020
Year 2011 2012 2013 2014 2015 2016 2017 2018 2019 2020
CDN storage 4 TB 10 TB
IPTV trafcaddressed
100% 100% 100% 100% 100% 100% 100% 100% 100% 100%
Cache hit rate 75% 75% 75% 75% 75% 87% 87% 87% 87% 87%
OTT trafcaddressed
15% 15% 15% 15% 15% 40% 40% 40% 40% 40%
Cache hit rate 45% 45% 45% 45% 45% 71% 71% 71% 71% 71%
Source: Alcatel-Lucent Bell Labs, 2012
Operational cost assumptions were as follows:• Transport: $3,200*/month to $4,000/month per 10G link• Internet connection: $4,500/month per 10G port for peering; $2.50/Mb/s/month for transit• Space: $5,905/rack/year• Power: $0.11039/kW hour• Maintenance: 10 percent of deployed equipment CAPEX* All dollar amounts are in US dollars.
The results reveal a 33 percent TCO savings in moving from a centralized architecture toa distributed architecture (see Figure 12). Eighty-three percent of the overall TCO savingscome from reductions in recurring operational costs. The positive business is furtherstrengthened by the new revenue opportunities enabled by an on-net CDN.
Figure 12. TCO savings in move from centralized to distributed architecture
Source: Alcatel-Lucent Bell Labs, 2012
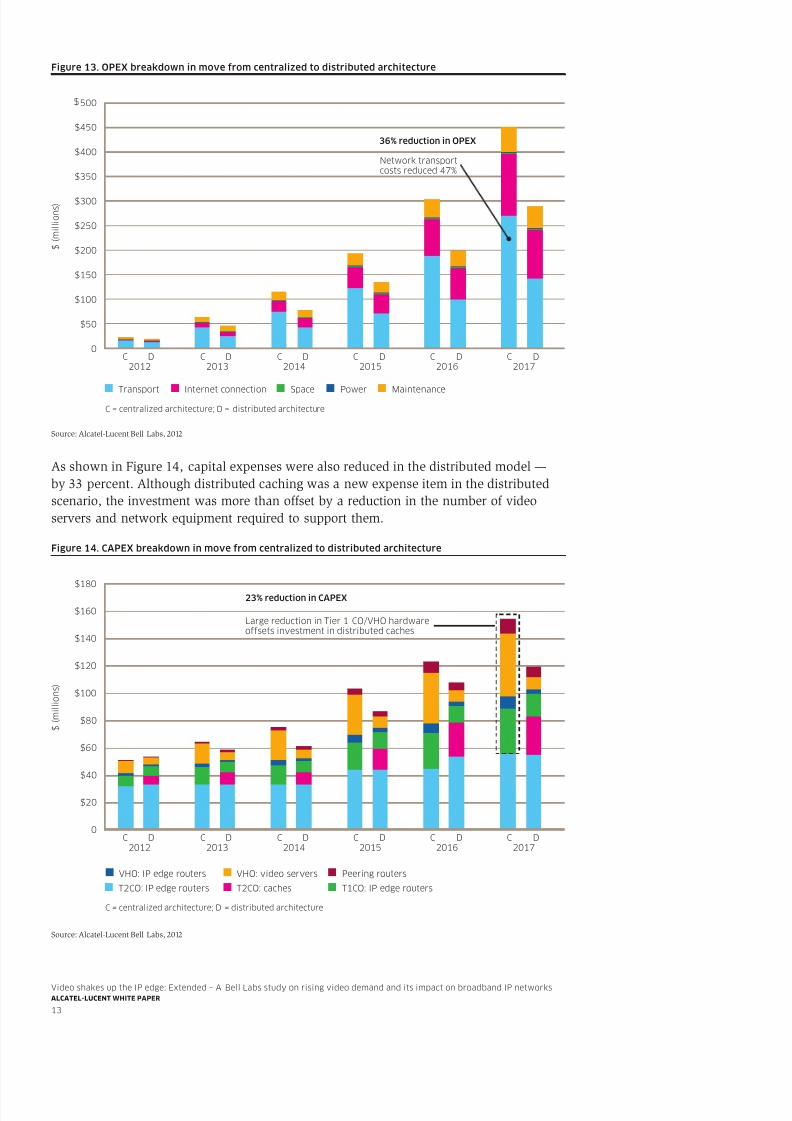
A closer look at operational costs (see Figure 13) reveals that operational costs arereduced by 36 percent in the distributed IP edge and CDN cache model. The bulk ofsavings coming from the 47 percent reduction in network bandwidth costs deliveredby distributed caches as they reduce network transit bandwidth. Peering costs displaya similar but less dramatic savings as OTT partnerships start to minimize the numberof video streams originating from the Internet.
CAPEX
C = centralized architecture; D = distributed architecture
$700
$ ( m i l l i o n s )
$600
$500
$400
2012C D
2013C D
2014C D
2015C D
2016C D
2017C D
$300
$200
$100
0
OPEX
OPEX reduction makesup 83% of TCO savings
33% reduction in TCO
8/11/2019 Video Shakes Up IP Edge en Whitepaper
http://slidepdf.com/reader/full/video-shakes-up-ip-edge-en-whitepaper 15/16
Video shakes up the IP edge: Extended – A Bell Labs study on rising video demand and its impact on broadband IP networksALCATEL LUCENT WHITE PAPER
13
Figure 13. OPEX breakdown in move from centralized to distributed architecture
Source: Alcatel-Lucent Bell Labs, 2012
As shown in Figure 14, capital expenses were also reduced in the distributed model —by 33 percent. Although distributed caching was a new expense item in the distributedscenario, the investment was more than offset by a reduction in the number of videoservers and network equipment required to support them. Figure 14. CAPEX breakdown in move from centralized to distributed architecture
Source: Alcatel-Lucent Bell Labs, 2012
TransportC = centralized architecture; D = distributed architecture
$400
$ ( m i l l i o n s )
$350
$300
$250
2012C D
2013C D
2014C D
2015C D
2016C D
2017C D
$200
$150
$50
$100
0
500
$450
Internet connection Space Power Maintenance
Network transportcosts reduced 47%
36% reduction in OPEX
T2CO: IP edge routers
C = centralized architecture; D = distributed architecture
$140
$ ( m i l l i o n s )
$120
$100
$80
2012C D
2013C D
2014C D
2015
23% reduction in CAPEX
Large reduction in Tier 1 CO/VHO hardwareoffsets investment in distributed caches
C D2016
C D2017
C D
$60
$40
$20
0
$180
$160
T2CO: caches T1CO: IP edge routers
VHO: IP edge routers VHO: video servers Peering routers
8/11/2019 Video Shakes Up IP Edge en Whitepaper
http://slidepdf.com/reader/full/video-shakes-up-ip-edge-en-whitepaper 16/16
www.alcatel-lucent.com Alcatel, Lucent, Alcatel-Lucent and the Alcatel-Lucent logo are trademarks ofAlcatel-Lucent. All other trademarks are the property of their respective owners. The information presentedis subject to change without notice. Alcatel-Lucent assumes no responsibility for inaccuracies contained herein.Copyright © 2012 Alcatel-Lucent. All rights reserved. M2012115052 (November)
CONCLUSIONVideo in all forms is driving revitalization in the IP edge of residential networks. LegacyBNG/BRAS routers deployed in a centralized architecture cannot scale to meet growingbandwidth demands, nor do they have the modern features required to deliver a morecompelling and personalized residential broadband service experience.
By shifting to a distributed IP edge architecture — and employing modern high-perfor-mance, intelligent service routers and CDN caches — service providers can meet futureresidential bandwidth and services demand while realizing signicant network savings.
Alcatel-Lucent is ideally positioned to help service providers through this necessarytransition. Our extensive experience with residential service networks is anchored by theindustry-leading service router platform, the Alcatel-Lucent 7750 Service Router (SR).
As a key element of the Alcatel-Lucent comprehensive residential network architecture,the 7750 SR is optimized for delivery of high-bandwidth, high-quality and highly exibleresidential broadband services. It can be used as an enhanced BNG, which allowshigh-quality VoD, personalization and Wi-Fi access to be incorporated into the service
provider’s existing base of IPTV, HSI and voice services. These capabilities can playa key role in helping service providers capitalize on subscriber demands for a richeronline experience.
ACRONYMSBNG Broadband Network Gateway
BRAS Broadband Remote Access Server
CAGR compound annual growth rate
CDN content delivery network
HD high denition
HSI high-speed Internet
OTT over-the-top
PDA personal digital assistant
QoE quality of experience
TCO total cost of ownership
UHD ultra-high denition
VoD video on demand