VIDEO GAMES - Entertainment Software Association€¦ · 2 The ENTertainment SOFTWARE ASSOCIATION...
37
www.theESA.com © 2017 Entertainment Soſtware Associaon VIDEO GAMES in the 21 ST CENTURY THE 2017 REPORT BY STEPHEN E. SIWEK
Transcript of VIDEO GAMES - Entertainment Software Association€¦ · 2 The ENTertainment SOFTWARE ASSOCIATION...

www.theESA.com © 2017 Entertainment Software Association
VIDEO GAMES in the 21st CENTURYTHE 2017 REPORT BY STEPHEN E. SIWEK

2 The ENTertainment SOFTWARE ASSOCIATION — www.theESA.com
EXECUTIVE SUMMARYVideo Games in the 21st Century: The 2017 Report measures the economic contributions made by the U.S. entertainment software industry to the American economy. The 2017 Report updates and expands upon earlier studies that quantified the economic benefits provided by the entertainment software industry to the U.S economy as a whole12. The 2017 Report concludes that:
• Total video game software sales exceeded $24.5 billion in 2016.
• In 2015, there were 2,457 video game companies operating at 2,858 locations in all 50 states.
• The total direct employment by the U.S. game industry now exceeds 65,000 employees.
• The total employment that depends on the game software industry now exceeds 220,000.
• Between 2012 and 2014, the number of game company locations grew at an annual rate of 14.1%.
• Between 2013 and 2015, direct employment in the U.S. game company industry grew at an annual rate of 2.9%.
• In 2015, the average annual compensation per employee (wages, salaries and employer contributions for pensions, insurance and government social insurance) was about $97,000.
• The U.S. game company industry’s value added to U.S. GDP was more than $11.7 billion in 2015.
• The real annual growth rate of the U.S. game software industry’s value added was 3.7% for the period 2013-2015.
1 Siwek, Stephen E., Video Games in the 21st Century: Economic Contributions of the U.S. Entertainment Software Industry, Entertainment Software Association (2007). 2 Siwek, Stephen E., Video Games in the 21st Century: The 2010 Report, Entertainment Software Association (2010).

3 The ENTertainment SOFTWARE ASSOCIATION — www.theESA.com
INTRODUCTIONThe U.S. industry that develops and publishes video game software continues to create wholly new forms of entertainment for consumers worldwide. The industry also generates sales in the billions of dollars and creates thousands of American jobs.
This publication, Video Games in the 21st Century: The 2017 Report, presents a number of statistical measures that quantify the economic contributions of the video game industry. This report is the third economic impact study prepared for the Entertainment Software Association (“ESA”), the trade association that represents the U.S. video game industry.3 The basic methods used in this report were originally described in one or both of the previous ESA studies. In this study however, there is a significant change in the underlying data used to measure the economic impact of the video game industry. Unlike previous ESA studies, the source references used in this analysis were compiled directly from game company data bases and social media websites. While the basic structure of the economic impact study has not materially changed, the inclusion of data from the ESA Geographic Impact Report has had more dramatic effects on the overall estimates presented here. ESA obtained this information from multiple different data bases/websites, including Steam, Kickstarter, International Game Developers Association, Giant Bomb, and LinkedIn.
ESA’s reliance on multiple research sources is commendable. Since its origin, the video game industry has not been subject to extensive regulation of its companies or its employees. With less regulation, there have been fewer demands for the industry to gather and publish industry data and studies. For these reasons, neither the federal government nor the industry itself has invested in creating a comprehensive data base of video game companies. However, with the publication of the ESA’s Geographic Impact Report, that condition has changed.
ESA’s Geographic Impact Report quantifies industry statistics on geographic volume, employment and growth. The study identifies 2,457 game companies that function at 2,858 locations. Approximately 80% of these companies were game developers while nearly 95% were founded in the United States. Significantly, video game companies are located in all 50 states.
3 The previous studies were: Siwek, Stephen E., Video Games in the 21st Century: Economic Contributions of the U.S. Entertainment Software Industry, Entertainment Software Association (2007) and Siwek, Stephen E., Video Games in the 21st Century: The 2010 Report, Entertainment Software Association.

4 The ENTertainment SOFTWARE ASSOCIATION — www.theESA.com
In addition to the data collected by ESA, many of the statistical measures included in this report either were taken directly from U.S. government sources, such as the U.S. Census Bureau or Bureau of Economic Analysis, or were derived using public data from those sources. A basic difficulty that continues to arise when using U.S. government data is that many (but not all) of the most relevant statistics measure only aggregated industry groupings such as software publishing. Largely for this reason, certain estimates presented in this report were derived using statistical data for broader industry groupings than video game publishing. Subsequently, where possible, these broader measures were adjusted to better reflect the known characteristics of the video game industry.
5 The ENTertainment SOFTWARE ASSOCIATION — www.theESA.com
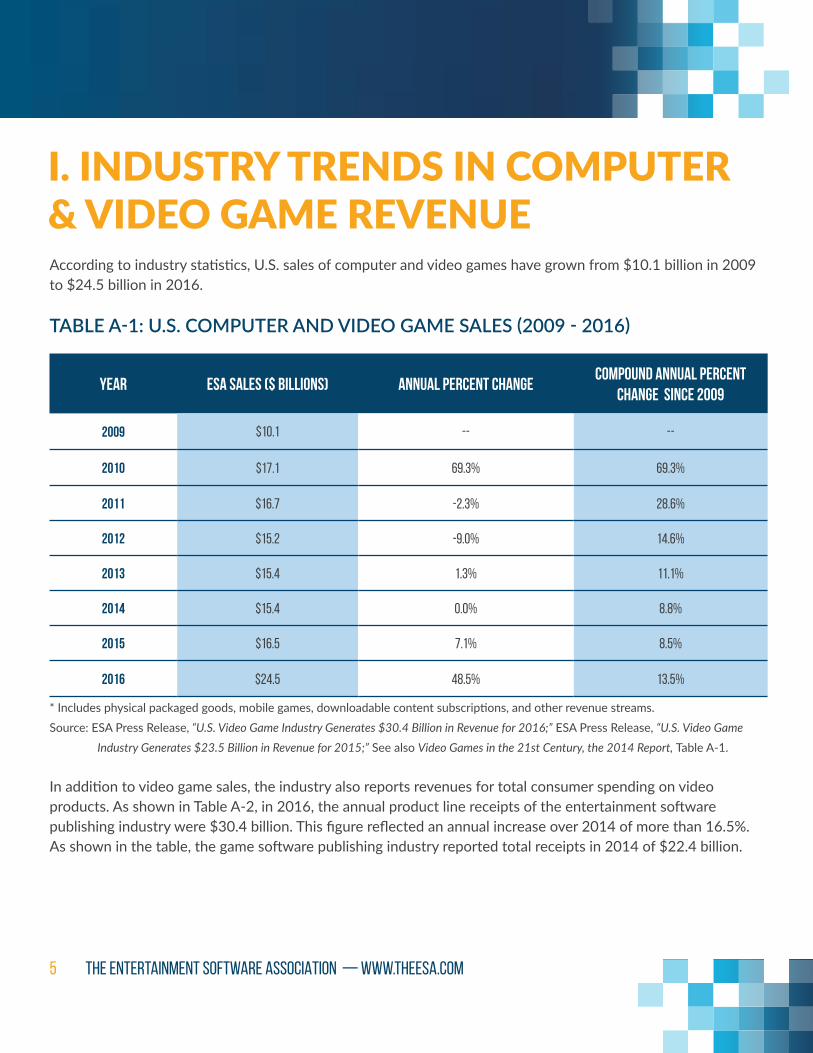
I. INDUSTRY TRENDS IN COMPUTER & VIDEO GAME REVENUEAccording to industry statistics, U.S. sales of computer and video games have grown from $10.1 billion in 2009 to $24.5 billion in 2016.
TABLE A-1: U.S. COMPUTER AND VIDEO GAME SALES (2009 - 2016)
YEAR ESA Sales ($ Billions) Annual Percent ChangeCompound Annual Percent
Change Since 2009
2009 $10.1 -- --
2010 $17.1 69.3% 69.3%
2011 $16.7 -2.3% 28.6%
2012 $15.2 -9.0% 14.6%
2013 $15.4 1.3% 11.1%
2014 $15.4 0.0% 8.8%
2015 $16.5 7.1% 8.5%
2016 $24.5 48.5% 13.5%
* Includes physical packaged goods, mobile games, downloadable content subscriptions, and other revenue streams. Source: ESA Press Release, “U.S. Video Game Industry Generates $30.4 Billion in Revenue for 2016;” ESA Press Release, “U.S. Video Game Industry Generates $23.5 Billion in Revenue for 2015;” See also Video Games in the 21st Century, the 2014 Report, Table A-1.
In addition to video game sales, the industry also reports revenues for total consumer spending on video products. As shown in Table A-2, in 2016, the annual product line receipts of the entertainment software publishing industry were $30.4 billion. This figure reflected an annual increase over 2014 of more than 16.5%. As shown in the table, the game software publishing industry reported total receipts in 2014 of $22.4 billion.

6 The ENTertainment SOFTWARE ASSOCIATION — www.theESA.com
TABLE A-2: U.S. VIDEO GAME INDUSTRY REVENUE (2014-2016)
YearTotal ESA Revenue
($ Billions)*Annual Percent Change
Compound Annual Percent Change Since 2014
2014 22.4 -- --
2015 23.5 4.9% 4.9%
2016 30.4 29.4% 16.5%
* Includes revenues from all hardware, software, peripherals, and in-game purchases. Source: ESA Press Release, “U.S. Video Game Industry Generates $30.4 Billion in Revenue for 2016;” ESA Press Release, “U.S. Video Game Industry Generates $23.5 Billion in Revenue for 2015.”
While the growth of the industry can be clearly seen in private source data, most government statistical references in the United States do not report video game publishing as a separate U.S. industry. In U.S. statistics, video game publishing is typically included within the broader industry category of software publishing. In the North American Industry Classification System (“NAICS”), the software publishing industry (NAICS 511210) “comprises establishments primarily engaged in computer software publishing or publishing and reproduction. Establishments in this industry carry out operations necessary for producing and distributing computer software, such as designing, providing documentation, assisting in installation, and providing support services to software publishers. These establishments may design, develop, and publish, or publish only.”4
4 U.S. Office of Management and Budget, North American Industry Classification System, United States, 2002, 511210 – Software Publishing, page 657.

7 The ENTertainment SOFTWARE ASSOCIATION — www.theESA.com
II. TRENDS IN SOFTWARE PUBLISHING AS A WHOLE In this analysis, more current estimates of video game publishing employment and value added are developed by combining government and industry source references. U.S. Census data for the broader software publishing industry represent one of the more important of these sources.
Table B-1 provides information on trends in the U.S. software publishing industry for the years 2010-2015. Annual revenues for the U.S. software industry have grown from $150.5 billion in 2010 to $198.3 billion in 2015. Gross annual payroll for the U.S. software publishing industry was $45 billion in 2010 rising to $60.2 billion in 2015.
TABLE B-1: U.S. SOFTWARE PUBLISHING INDUSTRY (2010-2015)
YEAREstimated revenue
($ Billions)Compound Annual Percent
Change Since 2010Gross Annual Payroll
($ Billions) PERcent of Revenue
2010 $150.5 -- $45.0 29.9%
2011 $164.8 9.5% $48.5 29.4%
2012 $171.1 6.6% $53.1 31.1%
2013 $181.7 6.5% $55.9 30.7%
2014 $193.8 6.5% $58.9 30.4%
2015 $198.3 5.7% $60.2 30.3%
Source: U.S. Cencus Bureau, 2015 Service Annual Survey.

8 The ENTertainment SOFTWARE ASSOCIATION — www.theESA.com
More detailed information on software publishing employment is reported in Table B-2. As shown in Table B-2, total industry employment stood at 397,145 in 2012. In the same year, the software publishing industry reported 8,302 total establishments and 47.8 total employees per establishment. Total software industry employment increased by 5.5% between 2012 and 2015, and industry payroll increased by 9.5% in the same period. Payroll per employee in the software publishing industry rose from $136,086 in 2012 to $146,603 in 2015.
TABLE B-2: U.S. SOFTWARE PUBLISHING INDUSTRY (2012-2014)
2012 2013 2014Compound Annual
Percent Change (2012 - 2014)
Number of Employees 397,145 428,030 442,246 5.5%
Number of establishments 8,302 8,912 9,185 5.2%
Employees Per Establishment 47.8 48 48.1 0.3%
Payroll ($000) $54,046,050 $58,877,528 $64,834,598 9.5%
Payroll/Employee $136,086 $137,555 $146,603 3.8%
Source: U.S. Cencus Bureau SUSB Annual Datasets by Establishment Industry.

9 The ENTertainment SOFTWARE ASSOCIATION — www.theESA.com
In Table B-3, the software publishing employment data from Table B-2 is disaggregated to illustrate the subset of software industry workers who are employed at firms with 500 or more employees. The data show that for this sub-category, the average number of employees per establishment in firms of 500 or more employees was 121.7 in 2015. For firms with less than 500 employees, the average number of employees per establishment stood at was 18.8.
TABLE B-3: U.S. SOFTWARE PUBLISHING INDUSTRY (2012-2014)
2012 2013 2014
Firms with 500+ Employees
Firms with <500 Employees
Firms with 500+ Employees
Firms with <500 Employees
Firms with 500+ Employees
Firms with <500 Employees
Number of Employees 280,968 116,777 307,421 120,609 318,602 123,644
Percentage of Employees
70.7% 29.3% 71.8% 28.2% 72% 28.0%
Number Of Establishments
2,319 5,983 2,578 6,334 2,618 6,567
Percentage of Establishments
27.9% 72.1% 28.9% 71.1% 28.5% 71.5%
Employees Per Establishment
121.2 19.4 119.2 19.0 121.7 18.8
Source: U.S. Cencus Bureau SUSB Annual Datasets by Establishment Industry.
In Tables B-4, we make one further adjustment to estimate the number of software industry employees who work at firms with 0-4 employees. It is necessary to make this adjustment in order to estimate the number of game developers and publishers who similarly work at such firms. The data source used in the next part of this report does not capture game software locations with less than five employees.
In Table B-4, we identify the number of software publishing industry employees at firms with 0-4 employees. In 2014, there were 4,476 such employees. These employees are then removed from the overall employee counts. In the lower half of the table, a similar calculation is made for software publishing industry establishments at these very small firms. The adjusted counts for software industry employees and establishments are then combined to produce a revised estimate of software employees per establishment at firms with less than 1,000 employees. That estimate is 32.8 employees.

10 The ENTertainment SOFTWARE ASSOCIATION — www.theESA.com
TABLE B-4: U.S. SOFTWARE PUBLISHING INDUSTRY: ADJUSTMENT FOR FIRMS WITH 0-4 EMPLOYEES (2012-2014)
2012 2013 2014
TOTAL SOFTWAREINDUSTRY
Firms with <500 Employees
TOTAL SOFTWAREINDUSTRY
Firms with <500 Employees
TOTAL SOFTWAREINDUSTRY
Firms with <500 Employees
Employees 397,145 116,777 428,030 120,609 442,246 123,644
LESS EMPLOYEES IN FIRMS WITH 0-4 EMPLOYEES
4,006 4,006 4,122 4,122 4,476 4,476
ADJUSTED EMPLOYEES 393,139 112,171 423,908 116,487 437,770 119,168
ESTABLISHMENTs 8,302 5,983 8,912 6,334 9,185 6,567
LESS EMPLOYEES IN FIRMS WITH 0-4 EMPLOYEES
2,438 2,438 2,716 2,716 2,934 2,934
ADJUSTED ESTABLISHMENTS
5,864 3,545 6,196 3,618 6,251 3,633
ADJUsted employees per establishment
31.6 32.2 32.8
Source: U.S. Cencus Bureau SUSB Annual Datasets by Establishment Industry.
As these calculations indicate, in the U.S. software publishing industry, the average number of employees per establishment has remained quite stable in recent years.

11 The ENTertainment SOFTWARE ASSOCIATION — www.theESA.com
III. U.S. EMPLOYMENT IN GAME PUBLISHING AND DEVELOPMENT Employees in the U.S. video game industry may work in small game developer shops or in large game publishing companies with thousands of employees. They may be employed as programmers, arts and animation specialists, game designers, game production experts, quality assurance personnel, audio specialists, legal staff members or business and marketing personnel. Developers may specialize in games for specific types of platforms including mobile, handheld and online media.
In the video game industry, online company data bases and social media sites are available to researchers seeking to access or create their own data compilations. In this analysis, ESA used a variety of such tools to compile its own data base of video game companies. Within that data base, ESA collected data that focused on industry companies and employment. ESA’s video game statistics were also collected at the levels of U.S. states, congressional districts and Metropolitan Statistical Areas (“MSAs”).
The video game data compiled in the ESA Geographic Impact Report proved to be an important resource for the measurement of video game contributions to the U.S. economy. Data on U.S.-based publisher and developer locations from ESA’s Geographic Impact Report data bases were used to estimate the number of workers now employed in the industry.
As shown in Table C-1, in the United States, there are at least 2,332 game developer locations across all 50 states plus the District of Columbia. There are also 526 publisher locations across 44 states. In total, there are at least 2,858 game company locations.
TABLE C-1: U.S. GAME COMPANY DEVELOPERS AND PUBLISHERS
TYPE OF COMPANY LOCATIONs STATES
DEVELOPER 2,322 51
PUBLISHER* 526 44
ALL COMPANIES 2,858 51
* Publishers also include Hardware/Software Manufacturers, Service Providers, and Distributors.Source: ESA Mapping Project Data.

12 The ENTertainment SOFTWARE ASSOCIATION — www.theESA.com
Table C-2 shows the number of workers employed by these companies. As reported in Table C-2, there are now at least 65,678 workers directly employed at game software publisher and developer locations in the United States.5 Of this total, 28,556 workers are directly employed at game publishing companies while 37,122 people now work directly for U.S.-located game developer firms.
TABLE C-2: U.S. GAME COMPANY DIRECT EMPLOYMENT BY TYPE OF COMPANY
TYPE OF COMPANY LOCATIONs STATES
DEVELOPER 37,122 1,331
PUBLISHER** 28,556 351
ALL COMPANIES 65,678 1,682
* 1,176 locations do not report employment data.** Publishers also include Hardware/Software Manufacturers, Service Providers, and Distributors.Source: ESA Mapping Project Data. The employee data shown in Table C-2 can also be disaggregated on a state-by-state basis. The total number of workers directly employed at game software publisher and developer firms in the industries’ top seven states are shown in Table C-3. The states of California, Washington, Texas, New York, Illinois, Florida, and Massachusetts collectively employ 55,915 workers, or 85% of the total direct employment for the U.S. game software industry as a whole.
5 Of the 2,858 game company locations included in the ESA data reported in Table C-1, 1,176 locations do not report employment data. This leaves 1,682 locations, as reported in Table C-2.

13 The ENTertainment SOFTWARE ASSOCIATION — www.theESA.com
TABLE C-3: U.S. GAME COMPANY EMPLOYMENT BY STATE TOP SEVEN STATES
State Reported Employment*Percentage of All Employees
California 35,325 54%
Washington 6,166 9%
Texas 4,883 7%
New York 4,675 7%
Illinois 1,727 3%
Florida 1,676 3%
Massachusetts 1,463 2%
Top 7 States 55,915 85%
All Other States 9,763 15%
All States 65,678 100%
*1,176 locations do not report employment data.Source: ESA Mapping Project Data.
The employment figures presented in these tables refer to employees who work directly for entertainment software developers and publishers. However, any estimate of the number of workers who are directly employed in a given industry will not capture the full impact of that industry on the economy as a whole. The U.S. economy functions as an interlocking system where changes in supply and demand for one industry affect supply and demand in other industries as well.

14 The ENTertainment SOFTWARE ASSOCIATION — www.theESA.com
The U.S. video game industry creates products that combine the skills of the industry’s employees with other inputs of goods and services purchased from other industries. For example, a game developer may need to acquire a specific type of graphic design software from another firm in order to produce the game under development. Revenue from that purchase can be used to compensate employees at the firm that makes the graphic design software product. There would also be similar linkages to suppliers of the graphic design software firm and further linkages to those suppliers and on through the economy.
The U.S. government has developed a widely accepted mathematical model, known as the Regional Input-Output Modeling System (“RIMS II”) that uses input-output relationships throughout the economy to capture these interlocking affects. The input-output relationships are industry specific and take the form of “multipliers.” In this analysis, employment multipliers for the software publishing industry were obtained from the U.S. Bureau of Economic Analysis (“BEA”) for all states where game software publishing employment had been located. These multipliers were applied to the direct game industry employee counts on a state-by-state basis. The weighted average multiplier across all states was 3.355. As shown in Table C-4, in 2015 the total direct and indirect employment for the U.S. video game industry as a whole was 220,332 people. 190,706 of these people were located in the top seven states shown in Table C-4, including 123,408 employees in California alone.

15 The ENTertainment SOFTWARE ASSOCIATION — www.theESA.com
TABLE C-4: U.S. GAME COMPANY DIRECT AND INDIRECT EMPLOYMENT BY STATE
StateReported Developer
EmploymentReported Publisher
Employment**Reported Direct
Employment*Direct + Indirect
Employment
California 16,719 18,606 35,325 123,408
Washington 3,960 2,206 6,166 19,815
Texas 4,159 724 4,883 17,867
New York 1,916 2,759 4,675 13,522
Illinois 1,547 180 1,727 5,917
Florida 646 1,030 1,676 5,607
Massachusetts 1,270 193 1,463 4,570
Top 7 States 30,217 25,698 55,915 190,706
All Other States 6,905 2,858 9,763 29,626
All States 37,122 28,556 65,678 220,332
* 1,176 locations do not report employment data.** Publishers also include Hardware/Software Manufacturers, Service Providers, and Distributors.Source: ESA Mapping Project Data.

16 The ENTertainment SOFTWARE ASSOCIATION — www.theESA.com
IV. GROWTH IN GAME COMPANY LOCATIONS The video game industry’s growth in recent years has been significant. As shown in Table D-1, 1,762 game company locations existed in 2012. This figure has steadily increased since then. In 2014, there were 2,295 video game companies, resulting in a compound annual growth rate of more than 14% over this period.
TABLE D-1: U.S. GAME COMPANY LOCATIONS (2012-2014)
Year Locations*
2012 1,762
2013 2,042
2014 2,295
Compound Annual Growth Rate 14.13%
* 425 locations do not report year founded. Source: ESA Mapping Project Data. In order to put the video game industry’s growth rate in terms of locations into perspective, it can be compared to the growth in company locations across the U.S. economy broadly. According to the U.S. Census Bureau Statistics of U.S. Businesses, the number of establishments has increased at an annual rate of just 0.88% between 2012 and 2014, as shown in Table D-2.

17 The ENTertainment SOFTWARE ASSOCIATION — www.theESA.com
TABLE D-2: U.S. GAME COMPANY LOCATIONS COMPARISON TO U.S. ECONOMY (2012-2014)
Year Game Company Locations* U.S. Establishments**
2012 1,762 7,431,808
2013 2,042 7,488,353
2014 2,295 7,563,084
Compound Annual Growth Rate
14.13% 0.88%
* Table D-1** Number of Establishments from US Census Bureau SUSB Annual Datasets by Establishment Industry. Source: ESA Mapping Project Data.
In Table D-3, we compare the growth rate of video game locations to the entire U.S. information sector as a whole. The U.S. information sector (NAICS 51) includes US publishing industries (including software publishing) plus the US motion picture, recorded music, broadcasting, Internet publishing, telecommunications and web search portal industries. The growth in the number of video game company locations has also outpaced the growth in establishments the information sector. As shown in Table D-3, the growth in the number of locations in the video game industry was more than 12 times the growth rate in the number of locations in the information sector between 2012 and 2014.
TABLE D-3: U.S. GAME COMPANY LOCATIONS COMPARISON TO INFORMATION SECTOR (2012-2014)
Year Game Company Locations* Information Sector Establishments**
2012 1,762 135,185
2013 2,042 135,627
2014 2,295 138,347
Compound Annual Growth Rate
14.13% 1.16%
* Table D-1** Number of Establishments from US Census Bureau SUSB Annual Datasets by Establishment Industry. Source: ESA Mapping Project Data.

18 The ENTertainment SOFTWARE ASSOCIATION — www.theESA.com
The growth rate observed in locations for the video game industry can also be compared to trends in other U.S. industries. For example, as shown in Table D-4, the number of locations in a variety of U.S. industries either declined or increased somewhat during the period 2012-2014. Growth in the following U.S. industries was negative in this time frame: Advertising and Related Services, Computer and Electronic Product Manufacturing, Newspaper Publishers, Textile Mills, and Chemical Manufacturing.
TABLE D-4: U.S. GAME COMPANY LOCATIONS COMPARISON TO OTHER INDUSTRIES (2012-2014)
Industry NAICS 2012 Establishments 2014 Establishments Annual Growth Rate
Video Game Industry* -- 1,762 2,295 14.13%
Advertising and Related Services 5418 38,033 37,482 -0.73%
Custom Computer Programming Services
541511 64,694 66,226 1.18%
Computer and Electronic Product Manufacturing
334 13,248 12,825 -1.61%
Aerospace Product and Parts Manufacturing
3364 1,751 1,772 0.60%
Newspaper Publishers 51111 7,624 7,385 -1.58%
Food Manufacturing 311 25,798 26,947 2.20%
Textile Mills 313 2,358 2,302 -1.19%
Chemical Manufacturing 325 13,309 13,079 -0.87%
* Table D-1Source: Number of Establishments from US Census Bureau SUSB Annual Datasets by Establishment Industry

19 The ENTertainment SOFTWARE ASSOCIATION — www.theESA.com
V. GROWTH IN GAME COMPANY EMPLOYMENT In addition to the growth in the number of locations within the video game industry, there has also been steady growth in the number of workers directly employed by the industry. Table E-1 shows this increase in employment, again using data collected by ESA from a variety of sources. In 2013, 56,712 individuals were directly employed by the video game industry. In 2016, this figure rose to 65,678.
TABLE E-1: U.S. GAME COMPANY EMPLOYMENT (2013-2015)
2013 2015
Employment 56,712 60,031
Locations Reporting Employment* 1,296 1,522
Average Employees Per Location 43.8 39.4
* 1,176 locations do not report employment data and 151 locations do not report year founded.Source: ESA Mapping Project Data.
The employment figures presented in Table E-1 were then used to calculate the compound annual growth rate between 2013 and 2015 for employment in the video game industry — 2.88%. This growth rate is compared to the growth rate in U.S. employment as a whole during this same period, as shown in Table E-2, according to employment data published by the U.S. Bureau of Labor Statistics.
TABLE E-2: U.S. GAME COMPANY EMPLOYMENT (2013-2015)
YearGame Company Reported
Direct Employment*U.S. Employment**
2013 56,712 136,381,417
2014 58,963 138,958,083
2015 60,031 141,865,250
Compound Annual Growth Rate 2.88% 1.99%
* Table E-1.** Total U.S. Employment from Bureau of Labor Statistics, Employment, Hours, and EarningsSource: ESA Mapping Project Data.

20 The ENTertainment SOFTWARE ASSOCIATION — www.theESA.com
The growth rate observed in direct employment for the video game industry can also be compared to employment trends in other U.S. industries. Table E-3 shows that direct employment in a variety of U.S. industries either declined or increased slightly during the period 2013-2015. Employment growth in the following U.S. industries was negative in this time frame: Computer and related manufacturing, aerospace products and parts, newspaper publishing, and textile manufacturing. During the same period, the following industries experienced employment growth at a rate of less than 2.0% per year: chemical manufacturing and food manufacturing.
TABLE E-3: U.S. GAME COMPANY EMPLOYMENT COMPARISON TO OTHER INDUSTRIES (2013-2015)
Industry NAICS2013 Employment**
(000)2015 Employment**
(000)Annual
Growth Rate
Video Game Industry* -- 57 60 2.88%
Advertising and Related Services 5418 452 484 3.46%
Custom Computer Programming Services
541511 739 829 5.95%
Computer and Electronic Product Manufacturing
334 1,066 1,050 -0.74%
Aerospace Product and Parts Manufacturing
3364 495 488 -0.78%
Newspaper Publishers 51111 213 191 -5.27%
Food Manufacturing 311 1,474 1,505 1.05%
Textile Mills 313 117 116 -0.34%
Chemical Manufacturing 325 793 810 1.06%
* Table E-1** Bureau of Labor Statistics, Employment, Hours, and Earnings from the Current Employment Statistics Survey (National)

21 The ENTertainment SOFTWARE ASSOCIATION — www.theESA.com
VI. WAGES AND SUPPLEMENTAL COMPENSATION PER EMPLOYEE For purposes of measuring the game software publishing industry’s contributions to the U.S. economy, it is important to consider measures in addition to the industry’s proven ability to create companies and jobs. One such measure is employment compensation. In Table F-1, we report the annual value added and compensation levels achieved for all publishing industries in the U.S. economy for the years 2012-2015. This industry grouping (NAICS 511) incorporates all forms of publishing in the U.S. including software publishing (NAICS 5112).
As shown in Table F-1, an industry’s value added has three basic components. These are compensation, taxes and gross operating surplus (“GOS”). In 2015, the value added for the entire U.S. publishing industry group (including software publishing) was $205.2 billion. Of this total, approximately $114.7 billion (56%) consisted of employee compensation.
Employee compensation in turn can be divided into two separate categories. These categories are wages and salaries and supplements. For the U.S. publishing industries in 2015, about 83% ($98.6 billion) of total compensation was paid in the form of wages and salaries. The remaining 17% ($16.0 billion) of the total publishing industries’ compensation payments came in the form of supplements. Supplements consist of employer contributions for employee pensions and insurance funds and employer contributions for government social insurance.6
6 U.S. Bureau of Economic Analysis, www.bea.gov.

22 The ENTertainment SOFTWARE ASSOCIATION — www.theESA.com
TABLE F-1: ALL PUBLISHING INDUSTRIES: VALUE ADDED AND COMPENSATION ($ BILLIONS)
2012 2013 2014 2015
Value Added $194,389 $197,633 $194,472 $205,243
Components of Value Added
Compensation $92.2 $99.5 $107.0 $114.7
Taxes (Various) $3.7 $3.6 $3.6 $3.7
Gross Operating Surplus $98.5 $94.6 $83.9 $86.9
Total Value Added $194.4 $197.6 $194.5 $205.2
Components of Compensation
W&S $78.0 $85.2 $91.2 $98.6
Supplements $14.2 $14.3 $15.8 $16.0
Total Compensation $92.2 $99.5 $107.0 $114.7
Suppl. as % of W&S 18.2% 16.8% 17.4% 16.3%
Source: U.S. Bureau of Economic Analysis, Annual Industry Accounts, GDP by Industry/COMP, TXPIS, GOS
The figures reported in Table F-1 reflect the total amount of wages and salaries and wage supplements paid to employees in the U.S. publishing industry for the years 2012-2015. In order to assess these figures on a per employee basis, it is necessary to divide these values by the number of workers employed in the U.S. publishing industries. The total number of employees in the U.S. publishing industries (including software publishing) is reported, by year in Table F-2. These employee totals are derived by the U.S. Bureau of Economic Analysis and they include both full-time and part time workers. As shown in Table F-2, the total number of U.S. publishing industry employees declined from 841,000 workers in 2012 to 862,000 in 2015.

23 The ENTertainment SOFTWARE ASSOCIATION — www.theESA.com
TABLE F-2: EMPLOYMENT IN ALL PUBLISHING INDUSTRIES
YEAR NUMBER OF EMPLOYESS (000)
2012 841
2013 842
2014 848
2015 862
Source: U.S. Bureau of Economic Analysis, Full-Time and Part-Time Employees by Industry, Publishing Industries (includes Software).
The industry values for employee wages and salaries from Table F-1 can be divided by the employee counts in Table F-2 in order to measure wages and salaries on a per employee basis. These calculations are provided in Table F-3. For the U.S. publishing industries as a whole, annual wages and salaries per employee rose from $92,753 in 2012 to $114,412 in 2015. The publishing industries’ wage increases in 2015 followed earlier increases in employee wages and salaries in previous years.
TABLE F-3: WAGES AND SALARIES PER EMPLOYEE IN ALL PUBLISHING INDUSTRIES
2012 2013 2014 2015
W&S ($ Billions)* $78.0 $85.2 $91.2 $98.6
Employees (000)** 841 842 848 862
(W&S)/Employees $92,753 $101,139 $107,508 $114,412
* Table F-1** Table F-2
The wage and salary estimates in Table F-3 reflect average wages for the entire U.S. publishing industry including software publishing. However the government sources used to compile these figures do not separately report wages and salaries solely for the U.S. game software publishing industry. Accordingly, in this study, an alternative source was used to measure the annual wages paid by game software developer firms. The wage data used in this study were derived from public information that was originally reported in Game Developer Salary Reports for the years 2010 through 2013. The Game Developer Salary Reports are compiled and published by Game Developer Research. For the year 2010, the national average game developer salary, as determined in the Game Developer Salary Reports, was reported as $75,984. In 2013, the average wage paid to game developers in the United States rose to $83,060 per year. These national averages are reported in Table F-4.

24 The ENTertainment SOFTWARE ASSOCIATION — www.theESA.com
In addition to the national average developer wage by year, Table F-4 also contains estimates of the annual wages that were paid to developers in the first, fifth and tenth highest paying states in each year studied. These data were developed by calculating the ratios of developer wages in each top ten state to the average developer wage nationally. These ratios were then applied to the national average developer wage for the years 2010, 2011, 2012, and 2013. It should be noted that these wage figures combine wage and salary data for seven separate video game disciplines. These disciplines are: visual arts, programming, game design, audio, production, quality assurance and business and legal.7 As shown in Table F-4, in 2013, the average annual wage paid to game developer employees in the top ranked U.S. state was $83,060. By contrast, in the tenth ranked state, the average annual wage paid to game developer employees was only $73,354.
TABLE F-4: APPROXIMATE WAGES AND SALARIES FOR GAME DEVELOPER EMPLOYEES
RANKED STATE 2010 2011 2012 2013
1st $86,772 $93,696 $90,907 $91,602
5th $71,288 $78,567 $82,000 $79,286
10th $69,891 $67,136 $76,136 $73,354
Simple Average $75,984* $81,192 $84,337 $83,060
* Reported Average for 2010 was unavailable. Stated value is simple average of reported values by state ranking.Source: Game Developer Research, Press Releases, Game Developer Salary Reports 2011, 2012, 2013 and 2014.
The data in Table F-4 reflects average wages and salaries only. These data do not include the various forms of earnings supplements that are also used to measure total compensation in the U.S. national accounts. For that reason, it is necessary in this study to estimate the supplements that should be added to the average industry wage and salary figures that were shown in Table F-4. This calculation is provided in Table F-5.
7 Game Developer Research, The Game Developer Salary Report 2004-2007, page 44-47.

25 The ENTertainment SOFTWARE ASSOCIATION — www.theESA.com
In Table F-5, the average game developer wage figures from Table F-4 are adjusted to reflect the estimated payment of employee supplements beyond wages and salaries. As noted earlier in this report, supplements consist of employer contributions for employee pensions and insurance funds and employer contributions for government social insurance.8
The estimated supplement payments shown in Table F-5 are based on the reported supplements that are paid to employees in all U.S. publishing industries including the software publishing industry. The supplement percentages that are used in Table F-5 were originally derived in Table F-1.
TABLE F-5: TOTAL COMPENSATION PER EMPLOYEE FOR GAME DEVELOPER EMPLOYEES
2010 2011 2012 2013
Average Wages & Salaries* $75,984 $81,192 $84,337 $83,060
Supplement Percentage** 18.8% 19.0% 18.2% 16.8%
Supplement to Wages & Salaries $14,307 $15,433 $15,372 $13,941
Total Compensation per Employee $90,292 $96,625 $99,709 $97,001
* Table F-4** Table F-1
As shown in Table F-5, in 2010, the average compensation paid to employees in the U.S. game software development industry in was estimated at $90,292. By 2013, average compensation (including supplements) paid to game developers had risen to $97,001.
8 U.S. Bureau of Economic Analysis, www.bea.gov.

26 The ENTertainment SOFTWARE ASSOCIATION — www.theESA.com
VII. INDUSTRY COMPENSATION AND VALUE ADDED TO U.S. GDP In this section of the report, the estimated number of video game publishing employees from Table E-1 is combined with the figures for compensation per employee from Table F-5 in order to derive total compensation for the U.S. video game industry as a whole. These calculations are reported in Table G-1.
As shown in Table G-1, the total compensation paid out by the U.S. video game industry in 2013 was $5.50 billion. By 2015 however, the total compensation paid out by the U.S. entertainment software industry had increased to $5.82 billion, an increase of 6% since 2013.
TABLE G-1: U.S. GAME INDUSTRY COMPENSATION BY YEAR
YEAR Reported Employment* Compensation Per Employee** Total Compensation
2013 56,712 $97,001 $5,501,113,556
2014 58,963 $97,001 $5,719,462,523
2015 60,031 $97,001 $5,823,059,456
* Table E-1** Table F-5Source: ESA Mapping Project Data
In earlier sections of this study, employee counts for the game software publishing industry were derived separately for game “publishing” and game “development” groups. As noted in Table C-2, these estimates were 28,556 “direct” employees in the U.S. publisher group and 37,122 “direct” employees in the U.S. developer group. In this study, it is assumed that U.S. employees in these two groups do not receive equal compensation for their work. In Table G-2, weighting factors taken from the broader U.S. software publishing industry are used to derive average employee compensation levels for game software employees in each of these two employee groups. We assume that in the game software publishing industry, game publisher firms would typically employ at least 500 U.S. workers in total, while game developer firms would generally employ fewer than 500 U.S. employees.

27 The ENTertainment SOFTWARE ASSOCIATION — www.theESA.com
In Table G-2, the average compensation levels for employees in the game software publishing and developer groups are estimated using two equations with two unknown values. The first equation uses employee counts for the two groups to weight the unknown values of P for publisher and D for developer. These two unknowns, as weighted, are then set equal to $5.82 billion, the total game software employee compensation estimated for 2015. The second equation uses data for the software publishing industry as a whole to measure the relationship between the publishing group payroll per employee and the developer group payroll per employee. As shown in Section III of Table G-2, these two equations can then be solved for P and D.
The solutions for the equations in Table G-2 are as follows: average compensation per employee – game software publishing group = $109,432 per employee. Average compensation per employee – game software developer group = $72,682 per employee. These values are used in the subsequent tables in this section of the report.
TABLE G-2: US GAME INDUSTRY COMPENSATION PER EMPLOYEE BY GROUP
(Pub) (Dev)I. Reported Employment* 28,556 37,122 II. Software Publishing: Payroll (000)** $51,574,830 $13,286,768 Employees*** 318,602 123,644 Payroll Per Employee $161,794 $107,460
Pub = $161,794 Dev
$107,460
Pub = 1.506 Dev
III. 28,556 (P) + 37,122 (D) = $5,823,059,455
1. (P) = 1.506 (D)
2. (P) = $109,432
(D) = $72,682
* Table C-2** U.S. Census Bureau SUSB Annual Datasets by Establishment Industry, 2013*** Tables B-2 and B-3

28 The ENTertainment SOFTWARE ASSOCIATION — www.theESA.com
According to ESA data, 28,556 workers were employed by the publisher group firms in the U.S. video game industry.9 Using the employee compensation data from Table G-2, we now can estimate that the total compensation paid to these “direct” workers was $3.12 billion in 2015 (See Table G-3A).
TABLE G-3A: U.S. GAME INDUSTRY DIRECT COMPENSATION BY GROUP: PUBLISHER GROUP
States Reported Employment* Compensation Per Employee** Total Direct Compensation
44 28,556 $109,432 $3,124,943,606.71
* Table C-2** Table G-2
We also estimated that 37,122 workers were employed by the developer group firms in the U.S. video game industry in 2015.10 Using the employee compensation data from Table G-2, we now can estimate that the compensation paid to these “direct” workers was $2.70 billion in 2015 (See Table F-3B).
TABLE G-3B: U.S. GAME INDUSTRY DIRECT COMPENSATION BY GROUP: DEVELOPER GROUP
States Reported Employment* Compensation Per Employee** Total Direct Compensation
51 37,122 $72,682 $2,698,115,849.13
* Table C-3** Table G-2
In Table G-4, the estimates for the publishing and developer groups are combined into a single value to reflect the total compensation paid to all direct employees of the U.S. video game industry. As shown in Table G-4, that value was $5.82 billion.
9 See Table C-2. 10 See Table C-3.

29 The ENTertainment SOFTWARE ASSOCIATION — www.theESA.com
TABLE G-4: U.S. GAME INDUSTRY DIRECT COMPENSATION FOR ALL EMPLOYEES
StatesTotal Direct Compensation:
Publishers*Total Direct Compensation:
Developers**Total Direct Compensation:
Combined
51 $3,124,943,607 $2,698,115,849 $5,823,059,456
* Table G-3A** Table G-3B
The direct compensation value of $5.82 billion shown in Table G-4 does not reflect the total compensation paid to all U.S. workers in the U.S. video game industry. As noted earlier in this report, an industry’s “direct” employment does not capture the full impact of that industry on the U.S. economy as a whole. Direct employment counts omit any recognition that other “input” industries labored to make and sell intermediate products and services that ultimately were used to create the basic product at issue.
Earlier in this report, in Table C-4, a mathematical model that is developed and maintained by the U.S. Bureau of Economic Analysis was used to measure the number of “indirect” employees that benefit from the demand for U.S. entertainment software products. That model suggested that the total number of U.S. entertainment software publishing employees (both direct plus indirect) was in excess of 220,332 workers in 2015.
In Table G-5, the same model is used to estimate the total compensation paid to both direct and indirect employees of the U.S. entertainment software industry in 2015. As shown in Table G-5, that figure was $11.56 billion.
TABLE G-5: U.S. GAME INDUSTRY TOTAL (DIRECT & INDIRECT) COMPENSATION
States Total Direct Compensation* Total (Direct & Indirect) Compensation**
51 $5,823,059,456 $11,556,443,796
* Table G-4** Reflects a weighted average direct effects multiplier of 1.9846.

30 The ENTertainment SOFTWARE ASSOCIATION — www.theESA.com
Recall that, as shown previously in Table F-1, employee compensation is one of three components that make up an industry’s value-added. An industry’s value-added is the “contribution of industries to the Nation’s output, or gross domestic product (“GDP”).” An industry’s value added is equal to its gross output (which consists of sales or receipts and other operating income, commodity taxes, and inventory change) minus its intermediate inputs (which consist of energy, raw materials, semi-finished goods, and services that are purchased from domestic industries or from foreign sources).
The three primary components of value added are an industry’s return to domestic labor (compensation of employees), its return to government (taxes on production and imports less subsidies), and its return to domestic capital (gross operating surplus).11
In this study, we seek to measure the value added to the U.S. economy by the U.S. game software publishing industry. The first component of value added is employee compensation. As shown in Table G-1, the total compensation paid to employees of the U.S. game software publishing industry was $5.82 billion in 2015. In Table G-6, we measure the other two components of value added for the U.S. game software publishing industry.
In Table G-6, we estimate the production taxes and gross operating surplus (“GOS”) for the U.S. entertainment software industry for the years 2012 and 2014. The estimates rely on total U.S. publishing industry values that were previously reported in Table F-1. The values from Table F-1 are used to derive ratios of tax to compensation and GOS to compensation for the U.S. publishing industries as a whole. These ratios are shown as percentages in Table G-6. The total compensation figures for the video game industry in 2013 and 2015 are then multiplied by these ratios for the same years. These calculations yield estimates by year of the production taxes and gross operating surplus earned in the entertainment software industry in each year studied.12
11 U.S. Bureau of Economic Analysis, Gross Domestic Product by Industry Accounts, Guide, Value Added by Industry 12 Note, the production tax and GOS comparison ratios shown in Table F-6 have been revised in the current report. As compared to previous reports, the revised ratios increase the tax and GOS components of U.S. value added for the video game industry as a whole.

31 The ENTertainment SOFTWARE ASSOCIATION — www.theESA.com
TABLE G-6: U.S. GAME INDUSTRY OTHER COMPONENTS OF VALUE ADDED
2013 2015
Taxes on Production and Imports (All Subsidies)
Compensation* $5,501,113,556 $5,823,059,456
Tax as Percent of Compensation** 3.63% 3.63%
Taxes on Production and Imports $199,518,527 $211,195,104
Gross Operating Surplus
Compensation $5,501,113,556 $5,823,059,456
GOS as Percent of Compensation 95.10% 95.10%
Gross Operation Surplus $5,231,290,607 $5,537,445,451
* Table G-1** Table F-1
In Table G-7, we combine the results from Table G-6 with the industry compensation figures first reported in Table G-1. These figures are combined in order to derive the value added by the game software publishing industry to U.S. GDP for the years 2013 and 2015. As shown in Table G-7, the total game industry value added rose from $10.93 billion in 2013 to $11.57 billion in 2015.
TABLE G-7: U.S. GAME INDUSTRY DIRECT VALUE ADDED TO GDP ($ MILLIONS)
2013 2015
Compensation* $5,501,113,556 $5,823,059,456
Taxes** $199,518,527 $211,195,104
Gross Operating Surplus** $5,231,290,607 $5,537,445,451
Value Added $10,931,922,690 $11,571,700,010
* Table G-1** Table G-6

32 The ENTertainment SOFTWARE ASSOCIATION — www.theESA.com
In Table G-8, we report the value asses for the entire U.S. information sector as a whole. The U.S. information sector (NAICS 51) includes all U.S. publishing industries (including software publishing) plus the U.S. motion picture, recorded music, broadcasting, Internet publishing, telecommunications and web search portal industries. As shown in Table G-8, these industries, in aggregate, generated $854.6 billion in current dollar value added to the U.S. economy in 2015.
In Table G-8, we also provide the value added by the U.S. information sector in “real” terms. These data are converted to real terms because time trends that are reported using current dollar figures are frequently misleading. Current dollar figures track value added in nominal terms. Over time, these figures combine changes in real economic growth with changes driven solely by inflation-induced price increases. Accordingly, economists generally prefer to review trend data on value added in “real” or inflation adjusted terms. As shown in Table G-8, this conversion slightly increases the value added for the game software publishing industry for the U.S. information sector for period 2013 - 2015. The ratio of real to current dollar value added shown in Table G-8 are used subsequently in this report to estimate value added for the U.S. entertainment software industry in real terms.
TABLE G-8: U.S. GAME INDUSTRY VALUE ADDED AND ANNUAL GROWTH RATE (2012-2014)
2013 2014 2015
Value Added - Current Dollar $791,496 $793,165 $839,919
Value Added - Real 2009 Dollars $793,071 $794,672 $854,584
RATIO of REAL VA to Current VA 1.002 1.002 1.017
Value added data for U.S. Information Sector, NAICS 51. Source: U.S. Bureau of Economic Analysis, Value Added by Industry.
In Table G-9, we report employee compensation figures for the U.S. information sector for the years 2013 and 2015. We show that in this sector, the ratio of employee compensation in 2013 to employee compensation in 2014 was 0.90.

33 The ENTertainment SOFTWARE ASSOCIATION — www.theESA.com
TABLE G-9: U.S. INFORMATION SECTOR COMPENSATION OF EMPLOYEES ($ BILLION)
2013 Compensation 286.1
2015 Compensation 317.9
Ratio of 2013 Over 2015 0.900
Source: U.S. Bureau of Economic Analysis, Annual Industry Accounts, GDP by Industry/COMP, TXPIXS, GOS.
In Table G-10, we present value added figures for the U.S. game software industry for the years 2013 and 2015. These estimates are shown in both current dollar and real 2009 dollar terms. The current dollar figures for 2009 and 2012 were reported previously in Table F-7. The real 2009 dollar values for the game industry in Table G-10 were calculated on the basis of the ratios reported in Table G-8.
As shown in Table G-10, real value added for the entertainment software publishing industry grew at a rate of 3.7% for the years 2013-2015.
TABLE G-10: U.S. GAME INDUSTRY VALUE ADDED AND ANNUAL GROWTH RATE (2013-2015)
2013 2015
Value Added - Current Dollars* $10,931,922,690 $11,571,700,010
Value Added - Real 2009 Dollars** $10,953,676,152 $11,773,742,089
Real Annual Growth Rate 3.68%
* Table G-7** Table G-8
In Table G-11, we compare the video game industry to the U.S. Information Sector as a whole. The value added growth rate by the game industry between 2013 and 2015 was roughly on par with the growth rate seen by the entire Information Sector during this period.

34 The ENTertainment SOFTWARE ASSOCIATION — www.theESA.com
TABLE G-11: U.S. GAME INDUSTRY COMPARISON TO INFORMATION SECTOR (2013-2015)
YearGame Industry
(Real (2009) Dollars)*Information Sector
($ Millions - Real (2009) Dollars)**
2013 $10,953,676,152 $793,071
2015 $11,773,742,089 $854,584
Real Annual Growth Rate 3.68% 3.81%
* Table G-10** U.S. Bureau of Economic Analysis, Value Added by Industry (Nov. 3, 2016)
In Table G-12, we compare real growth in the video game software industry to real annual growth for the U.S. economy as a whole. The video game industry’s growth rate was 0.8% higher than the growth rate observed by the U.S. economy as a whole during this period.
TABLE G-12: U.S. GAME INDUSTRY TOTAL (DIRECT & INDIRECT) COMPENSATION
Real Annual Growth Game Company Value Added*
Real Annual Growth U.S. GDP**
3.68% 2.48%
* Table G-11** U.S. Bureau of Economic Analysis, Value Added by Industry (Nov. 3, 2016)

35 The ENTertainment SOFTWARE ASSOCIATION — www.theESA.com
Finally, in Table G-13, we compare the real growth of the video game industry value added between 2013 and 2015 to the growth of a variety of other industries using data from the Bureau of Economic Analysis. As can be seen, the video game industry’s growth significantly outpaced the growth rates seen by other industries during this period.
TABLE G-13: U.S. GAME COMPANY EMPLOYMENT COMPARISON TO OTHER INDUSTRIES (2013-2015)
IndustryReal Annual Growth in Value Added
(2013-2015)
Video Game Industry* 3.68%
Manufacturing 1.25%
Retail Trade 3.24%
Finance and Insurance 2.32%
Agriculture, Forestry, Fishing, and Hunting 0.90%
Food and Beverage and Tobacco Products Manufacturing -0.95%
Textile Mills and Textile Product Mills 1.50%
Construction 3.28%
Real Estate 1.84%
* Table G-11Source: U.S. Bureau of Economic Analysis, Value Added by Industry (Nov. 3, 2016)

36 The ENTertainment SOFTWARE ASSOCIATION — www.theESA.com
VIII. CONCLUSIONSUsing a combination of publically available data, data collected by the U.S. government, private industry data, and data collected by ESA, this report provided estimates of the economic contributions of the video game industry through 2016. In 2016, the U.S. computer and video game industry earned revenue of over $30.4 billion, a 16.5% compound annual increase over 2014. This included $24.5 billion in software sales. These were distributed across an estimated 2,858 company locations, which directly employed more than 65,000 people in 50 states and the District of Columbia. Of these 65,000, approximately 28,000 were employed by larger publishing firms while approximately 37,000 were employed by smaller developer firms. We estimate that the total U.S. employment, both direct and indirect, that depends on game software publishing now exceeds 220,000 workers.
Approximately 85% of the employees in the U.S. game software publishing industry are located in one of the seven states of California, Washington, Texas, New York, Illinois, Florida, and Massachusetts. California is the largest employer of video game publishing personnel accounting for approximately 54% of the total number of employees in the U.S. as a whole.
In 2012, there were fewer than 1,800 game company locations. By 2014, this number rose to more than 2,200, resulting in a compound annual growth rate of more than 14%. In 2013, the U.S. video game industry directly employed fewer than 57,000 people. By 2015, with the industry’s direct employment at approximately 60,000, industry employment increased at an annual rate of 2.9%.
For the industry as a whole, average compensation per employee from wages, salaries and employer contributions for pensions, insurance and government social insurance was about $97,001. In game publisher or publisher /developer firms, the average compensation per employee was approximately $109,000. In game developer firms, the average compensation per employee was about $73,000. In 2015, U.S. video game publishing employees received total compensation (including supplements) of $5.8 billion. When including the indirect compensation, this figure rises to more than $11.5 billion. Finally, in 2015, the U.S. video game industry’s value added to U.S. GDP was $11.8 billion, resulting in a 3.7% annual growth rate over the 2013 value added.

www.theESA.com © 2017 Entertainment Software Association