
Vibration Analysis Guide
128
GE Measurement & Control Beginner's Guide Machine Vibration Revision 28/06/2013
-
Upload
juan-jose-jimenez-gamez -
Category
Documents
-
view
165 -
download
18
Transcript of Vibration Analysis Guide

GE Measurement & Control
Beginner's Guide
Machine Vibration
Revision 28/06/2013

Beginner’s Guide to Machine Vibration
GE Measurement & Control
COPYRIGHT © 2013 GE Energy (New Zealand) Ltd.
All rights reserved. No part of this book may be reproduced, stored in a retrieval system, or transmitted, in any form or by any means, electronic, mechanical, photocopying, recording, or otherwise, without the prior written permission of GE Energy (New Zealand) Ltd. For information, contact:
GE Energy
Level 2, 22 Moorhouse Avenue
Christchurch
New Zealand
E-mail [email protected]
Disclaimer
Information in this document is subject to change without notice. Names and data used in examples are fictitious unless otherwise noted. This document is distributed as is, without warranty of any kind, either expressed or implied, respecting the contents of this document, including but not limited to implied warranties for the document’s quality, performance, merchantability, or fitness for any particular purpose. Neither GE Energy (New Zealand) Ltd nor its employees, dealers, or distributors shall be liable to the user of this document or any other person or entity with respect to any liability, loss, or damage caused or alleged to be caused directly or indirectly by this document.
Trademark Notice
vb™, Commtest™, PROFLASH™ are trademarks of GE Energy (New Zealand) Ltd.
vbSeries® and Ascent® are registered trademarks of GE Energy (New Zealand) Ltd. Other trademarks and registered trademarks belong to their respective owners.

Beginner’s Guide to Machine Vibration
GE Measurement & Control
Contents
Foreword........................................................................................................... 1
Section 1: Why is Monitoring Vibration Important? ................................. 1 What is Machine Vibration? ..............................................................................1 What Causes Machine Vibration? .................................................................3
(a) Repeating Forces ........................................................................................ 3 (b) Looseness ...................................................................................................... 6 (c) Resonance ..................................................................................................... 6
Why Monitor Machine Vibration? ..................................................................8 (a) Severe Machine Damage ......................................................................... 9 (b) High Power Consumption...................................................................... 10 (c) Machine Unavailability ........................................................................... 11 (d) Delayed Shipments .................................................................................. 11 (e) Accumulation of Unfinished Goods .................................................... 12 (f) Unnecessary Maintenance .................................................................... 12 (g) Quality Problems ...................................................................................... 13 (h) Bad Company Image .............................................................................. 13 (i) Occupational Hazards ............................................................................. 14
Summary ................................................................................................................. 14
Section 2: How is Machine Vibration Described? .................................... 15 How is Vibration Described? ......................................................................... 15 What is Amplitude? ............................................................................................ 17 What is Frequency? ........................................................................................... 21 What is A Waveform? ....................................................................................... 22 What is A Spectrum? ......................................................................................... 23 Summary ................................................................................................................. 25
Section 3: How is Machine Vibration Measured? .................................... 26
Which Machines Need Monitoring? .......................................................... 26 How Does the Instrument Work? ............................................................... 28 How is the Accelerometer Mounted? ....................................................... 29
(a) Mount as Close as Possible to the Bearing ...................................... 30 (b) Make Sure the Accelerometer is Firmly Attached ......................... 31 (c) Make Sure the Accelerometer is Oriented Correctly ..................... 32 (d) Mount the Same Accelerometer in the Same Location ............... 34 (e) Mount the Accelerometer on Something Substantial .................. 35 (f) Take Care of the Accelerometer ........................................................... 35 (g) Take Care of Personal Safety ............................................................... 37
How are Parameters Set? ............................................................................... 38 (a) How Data is Collected ............................................................................ 39
Beginner’s Guide to Machine Vibration
GE Measurement & Control
(b) How Much or How Fast Data is Collected ........................................ 40 (c) How Data is Processed ........................................................................... 44 (d) How Data is Displayed ........................................................................... 46
How is Data Collected? .................................................................................... 49 Summary ................................................................................................................. 54
Appendix: List of Symbols ............................................................................ 55
Glossary Abbreviations Guide .................................................................... 58
Glossary of Terms ......................................................................................... 59

Beginner’s Guide to Machine Vibration
GE Measurement & Control
Foreword
At GE Energy we know that vibration monitoring can be an easy and painless task – not a mysterious art. We have written Beginner’s Guide to Machine Vibration to give you the key information you need to increase your profits using a Commtest vbSeries vibration monitoring instrument.
Engineers, technicians, machine operators, and accountants will be able to quickly grasp the concepts presented in this book. We have avoided complicated mathematics and physics formulae, focusing on just the principle concepts necessary for performing basic vibration monitoring. The text is interspersed with simple diagrams, and care has been taken to use everyday language wherever possible.
We are confident that once you are armed with a vbSeries vibration monitoring instrument and after a few readings of Beginner’s Guide to Machine Vibration, you will be able to perform basic vibration monitoring. We welcome any comments you may have.
The symbols, units, and abbreviations used in this book are explained in the Appendix (page 55).

Section 1: Why is Monitoring Vibration Important? 1
GE Measurement & Control
Section 1: Why is Monitoring Vibration Important?
Monitoring machine vibration and using the information you obtain saves money!
How is this possible?
We will answer this question in the following pages.
After reading this section you will: • Understand the term 'machine vibration' • Cite some common causes of machine vibration • Explain the reasons for monitoring machine vibration • Understand how monitoring machine vibration saves money
What is Machine Vibration?
Most of us are familiar with vibration; a vibrating object moves to and fro, back and forth. A vibrating object oscillates.
We experience many examples of vibration in our daily lives. A pendulum set in motion vibrates. A plucked guitar string vibrates. Vehicles driven on rough terrain vibrate, and geological activity can cause massive vibrations in the form of earthquakes.
There are various ways we can tell that something is vibrating. We can touch a vibrating object and feel the vibration. We may also see the back-and-forth movement of a vibrating object. Sometimes vibration creates sounds that we can hear or heat that we can sense1.
1 To observe how vibration can create sound and heat, rub your feet back and forth on a carpet.

Section 1: Why is Monitoring Vibration Important? 2
GE Measurement & Control
In industrial plants there is the kind of vibration we are concerned about: machine vibration.
What is machine vibration? Machine vibration is simply the back-and-forth movement of machines or machine components. Any component that moves back and forth or oscillates is vibrating.
Machine vibration can take various forms. A machine component may vibrate over large or small distances, quickly or slowly, and with or without perceptible sound or heat. Machine vibration can often be intentionally designed and so have a functional purpose2. At other times machine vibration can be unintended and lead to machine damage.
Most times machine vibration is unintended and undesirable. This book is about the monitoring of undesirable machine vibration. Shown below are some examples of undesirable machine vibration.
2 Not all kinds of machine vibration are undesirable. For example, vibratory feeders, conveyors, hoppers, sieves, surface finishers and compactors are often used in industry.

Section 1: Why is Monitoring Vibration Important? 3
GE Measurement & Control
What Causes Machine Vibration?
Almost all machine vibration is due to one or more of these causes:
(a) Repeating forces (b) Looseness (c) Resonance
(a) Repeating Forces
Imagine a boat anchored in a bay. Waves are slapping the sides of the boat, and as long as the waves continue to act on the boat we would expect the boat to rock.
The boat would be rocking because the waves would be exerting a repeating force on the boat - a force of a pattern repeated over and over again.

Section 1: Why is Monitoring Vibration Important? 4
GE Measurement & Control
Most machine vibration is due to repeating forces similar to those causing the boat to rock. Repeating forces such as these act on machine components and cause the machine to vibrate.
Where do the repeating forces that cause machine vibration come from?
Repeating forces in machines are mostly due to the rotation of imbalanced, misaligned, worn, or improperly driven machine components. Examples of these four types of repeating forces are shown below.

Section 1: Why is Monitoring Vibration Important? 5
GE Measurement & Control

Section 1: Why is Monitoring Vibration Important? 6
GE Measurement & Control
(b) Looseness
Looseness of machine parts causes a machine to vibrate. If parts become loose, vibration that is normally of tolerable levels may become unrestrained and excessive.
(c) Resonance
Imagine a child swinging freely on a swing, that is, without the child propelling himself or anyone pushing him. If we observe the motion closely we will see the child swinging at a particular rate. For example, we may see that it consistently takes him three seconds to complete one cycle of swinging.
The rate of the child’s free-swinging is in fact a physical property of the child-swing system - much as the weight of the child is a physical property of the child. It is the rate at which the child will tend to swing while seated on that particular swing. It is the child’s most natural swinging rate on the swing, and the only way he can change it is to interfere with the natural swinging by propelling himself with his feet, changing his posture, rubbing his feet on the ground and so on.

Section 1: Why is Monitoring Vibration Important? 7
GE Measurement & Control
Machines also tend to vibrate at certain oscillation rates. The oscillation rate at which a machine tends to vibrate is called its natural oscillation rate. The natural oscillation rate of a machine is the vibration rate most natural to the machine, that is, the rate at which the machine 'prefers' to vibrate. A machine left to vibrate freely will tend to vibrate at its natural oscillation rate.
Most machines have more than one natural oscillation rate. For example, a machine comprising two substructures of different natural oscillation rates will exhibit at least two natural oscillation rates. In general, the more complex the machine, the more natural oscillation rates it has.
Now consider again the child on the swing. If we aided the swinging motion by repeatedly pushing the child, we would expect the child to swing higher and higher over time.
We would however only cause the child to swing higher and higher if we pushed with the right rhythm. If our pushing rhythm is such that he is sometimes pushed down while he is ascending, we would not expect him to swing properly. To make him swing higher and higher, our pushing rhythm would in fact need to be in harmony with his natural oscillation rate. For example, we could push him every time - or every alternate time - he reaches his highest point. Only by pushing the child at a rate which is in harmony with his natural or preferred oscillation rate can we cause him to quickly swing higher and higher.
What happens if a machine is 'pushed' by a repeating force with a rhythm matching the natural oscillation rate of the machine?
A similar situation will arise – the machine will vibrate more and more strongly due to the repeating force encouraging the machine to vibrate at a rate it is most natural with. The machine will vibrate vigorously and excessively, not only because it is doing so at a rate it 'prefers' but also because it is receiving external aid to do so. A machine vibrating in such a manner is said to be experiencing resonance.

Section 1: Why is Monitoring Vibration Important? 8
GE Measurement & Control
A repeating force causing resonance may be small and may originate from the motion of a good machine component. Such a mild repeating force would not be a problem until it begins to cause resonance. Resonance, however, should always be avoided as it causes rapid and severe damage. For example, whole bridges have collapsed due to their natural oscillation rates being excited by the mere rhythm of soldiers marching in unison across the bridges.
Why Monitor Machine Vibration?
To do a good job of monitoring machine vibration and to fully reap the benefits, we must understand the answers to the above question.
Monitoring the vibration characteristics of a machine gives us an understanding of the 'health' condition of the machine. We can use this information to detect problems that might be developing.
Why be concerned about the condition of a machine? Why not just continue to run the machine until it breaks down and then repair it?
Operating a machine until it breaks down might be acceptable if the machine were a 'disposable' one. Most machines, however, are not 'disposable' due to their cost.
If we regularly monitor the conditions of machines we will find any problems that might be developing, therefore we can correct the problems even as they arise.
In contrast, if we do not monitor machines to detect unwanted vibration the machines are more likely to be operated until they break down.
Because machine vibration monitoring finds potentially damaging vibration, we can prevent problems arising and this saves a lot of time, money, and frustration. How?

Section 1: Why is Monitoring Vibration Important? 9
GE Measurement & Control
Below we discuss some common problems that can be avoided by monitoring machine vibration. These problems are worth avoiding as the costs of dealing with them are large and far exceed the cost of reasonably priced machine vibration monitoring programs.
(a) Severe Machine Damage
Machine vibration that is not detected early enough will often lead to severe machine damage requiring costly repairs or even total machine replacement. However, if the condition of a machine is monitored regularly, potential problems can be detected - and corrected - at an early stage when the repair required is simpler, faster, and cheaper. This is similar to our own health. Regular visits to a doctor help us to detect problems early and so avoid the large costs of remedying severe health damage.

Section 1: Why is Monitoring Vibration Important? 10
GE Measurement & Control
(b) High Power Consumption
A machine that is vibrating consumes more power. As well as the power required for the machine to perform its intended function, additional power is also required to sustain the vibration. We can minimize this problem by regularly monitoring and maintaining the machine.

Section 1: Why is Monitoring Vibration Important? 11
GE Measurement & Control
(c) Machine Unavailability
Because an unmonitored machine is more likely to break down, it is more often out of action. However, the cost of procuring and operating a machine is normally justified by its availability to process goods efficiently, or by its availability to convert raw material into cash. A machine should be consistently available to generate the money to justify its investment. Regular monitoring helps ensure that a machine is always available to generate money.
(d) Delayed Shipments
Because an unmonitored machine is more likely to break down, it is also more likely to cause delays in the shipping of goods. Customers have to wait and their payment is delayed. Customers could also cancel their order and stop doing business with us.
Section 1: Why is Monitoring Vibration Important? 12
GE Measurement & Control
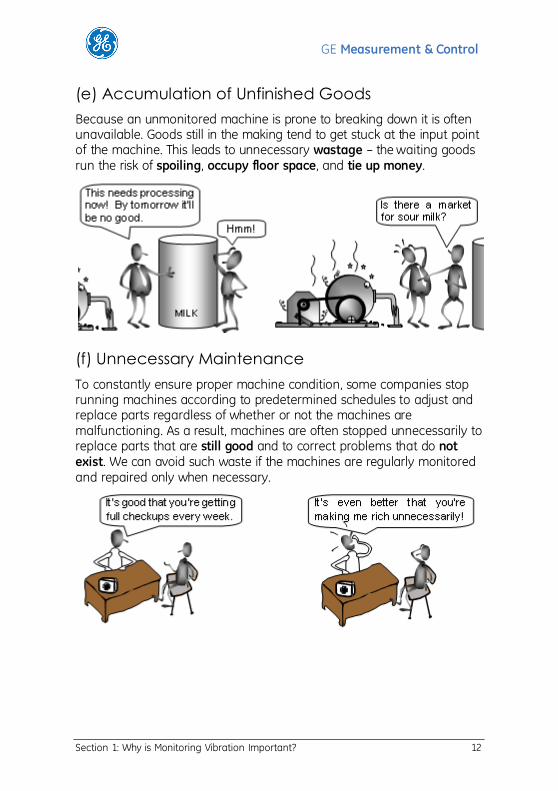
(e) Accumulation of Unfinished Goods
Because an unmonitored machine is prone to breaking down it is often unavailable. Goods still in the making tend to get stuck at the input point of the machine. This leads to unnecessary wastage – the waiting goods run the risk of spoiling, occupy floor space, and tie up money.
(f) Unnecessary Maintenance
To constantly ensure proper machine condition, some companies stop running machines according to predetermined schedules to adjust and replace parts regardless of whether or not the machines are malfunctioning. As a result, machines are often stopped unnecessarily to replace parts that are still good and to correct problems that do not exist. We can avoid such waste if the machines are regularly monitored and repaired only when necessary.
Section 1: Why is Monitoring Vibration Important? 13
GE Measurement & Control
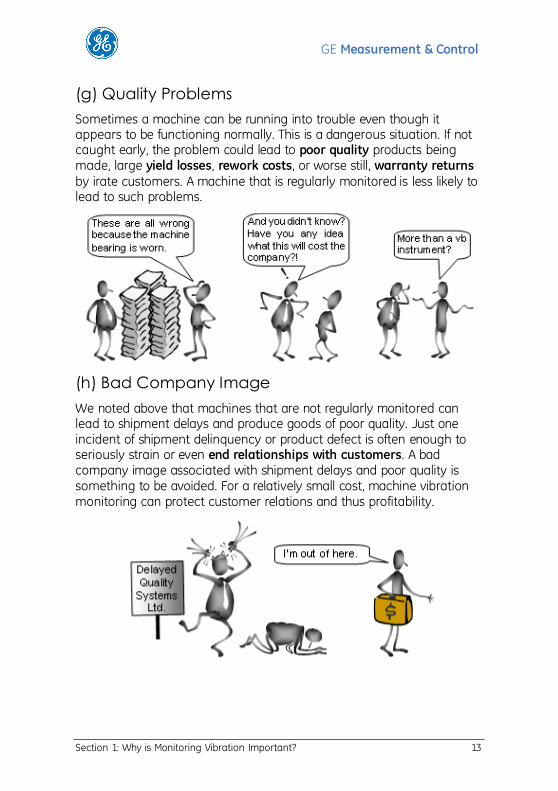
(g) Quality Problems
Sometimes a machine can be running into trouble even though it appears to be functioning normally. This is a dangerous situation. If not caught early, the problem could lead to poor quality products being made, large yield losses, rework costs, or worse still, warranty returns by irate customers. A machine that is regularly monitored is less likely to lead to such problems.
(h) Bad Company Image
We noted above that machines that are not regularly monitored can lead to shipment delays and produce goods of poor quality. Just one incident of shipment delinquency or product defect is often enough to seriously strain or even end relationships with customers. A bad company image associated with shipment delays and poor quality is something to be avoided. For a relatively small cost, machine vibration monitoring can protect customer relations and thus profitability.

Section 1: Why is Monitoring Vibration Important? 14
GE Measurement & Control
(i) Occupational Hazards
Due to the noise and shaking they create, vibrating machines can cause occupational hazards and human discomfort. Human discomfort results in a loss to the company as workers who feel unwell will not be fully productive. Also, unexpected machine breakdowns leave workers with no work, and production planners with frustration.
Summary
In this section we described machine vibration and discussed the benefits of monitoring machines on a regular basis.
Machine vibration is simply the back-and-forth movement of any machine or machine component, and is generally caused by repeating forces acting on the machine, loose machine parts, or resonance (a repeating force with a rhythm matching the natural oscillation rate of the machine).
We identified the reasons for monitoring machine vibration regularly, as well as the consequences of not doing so. By regularly monitoring the vibration characteristics of a machine we can detect and correct machine problems as they arise. By correcting machine problems early we avoid many unpleasant and costly problems, some of which involve customers. The cost of failing to monitor machine vibration far exceeds the cost of implementing a vibration monitoring program.
To find out how to set up your own machine vibration monitoring program, contact us or one of our resellers for a demonstration of a vbSeries vibration monitoring system. For the address of your nearest reseller please visit our website at www.commtest.com.

Section 2: How is Machine Vibration Described? 15
GE Measurement & Control
Section 2: How is Machine Vibration Described?
To analyze the condition of a machine you first need to accurately describe the behavior or symptoms of the machine.
How can vibration symptoms be described accurately?
How do vibration analysts describe the condition of a machine?
In this section we present the basic methods of describing machine vibration.
After reading this section you will: • Know the two most important methods of describing machine
vibration • Understand the term 'amplitude' • Understand the term 'frequency' • Understand what a spectrum or waveform is
How is Vibration Described?
By watching, feeling, and listening to machine vibration, we can sometimes roughly determine the severity of the vibration. We may observe that certain kinds of machine vibration appear 'rough', others 'noticeable', and yet others 'negligible'. We can also touch a vibrating bearing and feel that it is 'hot', or hear that it is 'noisy', and so conclude that something is wrong.
Describing machine vibration with these general terms is, however, imprecise and depends on the person making the assessment. What appears 'rough' to one person may appear acceptable to another. Verbal description is usually unreliable.

Section 2: How is Machine Vibration Described? 16
GE Measurement & Control
To accurately analyze a vibration problem it is necessary to describe the vibration in a consistent and reliable manner. Vibration analysts rely primarily on numerical descriptions, rather than on verbal descriptions, to analyze vibration accurately, and to communicate effectively.
The two most important numerical descriptors of machine vibration are amplitude and frequency.
Amplitude describes the severity of vibration, and frequency describes the oscillation rate of vibration (how frequently an object vibrates). Together, amplitude and frequency of vibration provide a basis for identifying the root cause of vibration.
Section 2: How is Machine Vibration Described? 17
GE Measurement & Control
What is Amplitude?
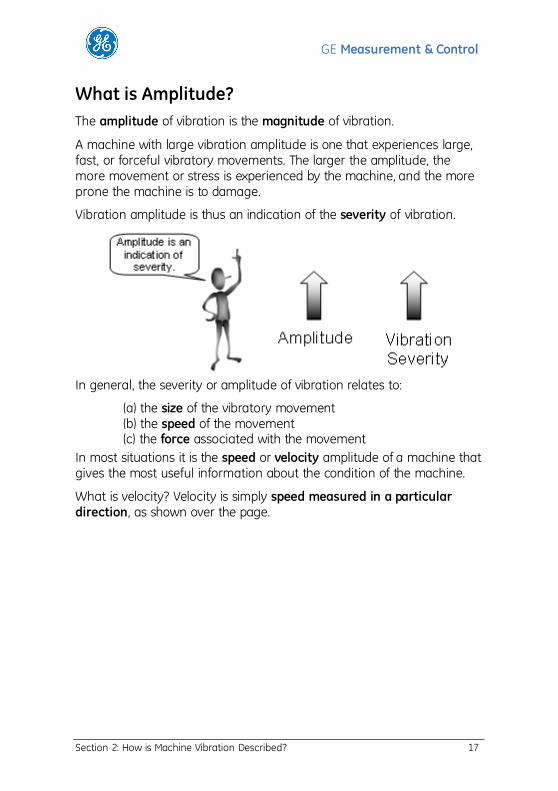
The amplitude of vibration is the magnitude of vibration.
A machine with large vibration amplitude is one that experiences large, fast, or forceful vibratory movements. The larger the amplitude, the more movement or stress is experienced by the machine, and the more prone the machine is to damage.
Vibration amplitude is thus an indication of the severity of vibration.
In general, the severity or amplitude of vibration relates to:
(a) the size of the vibratory movement (b) the speed of the movement (c) the force associated with the movement
In most situations it is the speed or velocity amplitude of a machine that gives the most useful information about the condition of the machine.
What is velocity? Velocity is simply speed measured in a particular direction, as shown over the page.

Section 2: How is Machine Vibration Described? 18
GE Measurement & Control

Section 2: How is Machine Vibration Described? 19
GE Measurement & Control
Velocity amplitude can be expressed in terms of its peak value, or what is known as its root-mean-square value.
The peak velocity amplitude of a vibrating machine is simply the maximum (peak) vibration speed attained by the machine in a given time period, as shown below.
In contrast to the peak velocity amplitude, the root-mean-square velocity amplitude of a vibrating machine tells us the vibration energy in the machine. The higher the vibration energy, the higher the root-mean-square velocity amplitude.
The term 'root-mean-square' is often shortened to 'rms'. It is useful to remember that the rms amplitude is always lower than the peak amplitude.

Section 2: How is Machine Vibration Described? 20
GE Measurement & Control
How do we decide whether the peak amplitude or the rms amplitude is to be used? It is really a matter of personal choice. However, it is essential to always use the same amplitude type when making comparisons.
Velocity amplitude, whether peak or rms, is always expressed with a unit. Listed below are two commonly used velocity amplitude units3.
3 Some vibration analysts prefer the logarithmic amplitude unit adB. However, discussion on logarithmic scales and units is beyond the scope of this book.

Section 2: How is Machine Vibration Described? 21
GE Measurement & Control
What is Frequency?
A vibrating machine component oscillates, that is, it goes through repeated cycles of movement. Depending on the force causing the vibration, a machine component may oscillate rapidly or slowly.
The rate at which a machine component oscillates is called its oscillation or vibration frequency. The higher the vibration frequency, the faster the oscillation.
You can determine the frequency of a vibrating component by counting the number of oscillation cycles that are completed every second. For example, a component going through 5 vibration cycles every second is said to be vibrating at a frequency of 5 cycles per second. As shown below, one cycle of a signal is simply one complete sequence of the shortest pattern that characterizes the signal.
Just as a person’s pulse rate or frequency indicates the person’s state of excitement or general health condition, the vibration rate or frequency of a machine component is often a useful indicator of the condition of the machine.
Frequency, as with amplitude, is always expressed with a unit. Commonly used frequency units are cps (cycles per second), Hz (Hertz), and cpm (cycles per minute). Hertz is a unit equivalent to 'cycles per second'. One Hz is equal to one cps (one cycle per second), or 60 cpm (60 cycles per minute).

Section 2: How is Machine Vibration Described? 22
GE Measurement & Control
What is A Waveform?
The graphical display of electrical signals from a person’s heart (electrocardiogram or ECG) is useful for analyzing the medical condition of the person’s heart. In a similar way, graphical displays of vibratory motion are useful tools for analyzing the nature of vibration. We can often find clues to the cause and severity of vibration in the graphical display of vibratory motion.
One display commonly used by vibration analysts is the waveform. A waveform is a graphical representation of how the vibration level changes with time. Shown below is an example of a velocity waveform. A velocity waveform is simply a chart that shows how the velocity of a vibrating component changes with time.
The amount of information a waveform contains depends on the duration and resolution of the waveform. The duration of a waveform is the total time period over which information may be obtained from the waveform. In most cases, a few seconds are sufficient. The resolution of a waveform is a measure of the level of detail in the waveform and is determined by the number of data points or samples characterizing the shape of the waveform. The more samples there are, the more detailed the waveform is.

Section 2: How is Machine Vibration Described? 23
GE Measurement & Control
What is A Spectrum?
Another kind of display commonly used by vibration analysts is the spectrum. A spectrum is a graphical display of the frequencies at which a machine component is vibrating, together with the amplitudes of the component at these frequencies. Shown below is an example of a velocity spectrum.
But how can a single machine component be simultaneously vibrating at more than one frequency?
The answer lies in the fact that machine vibration, as opposed to the simple oscillatory motion of a pendulum, does not usually consist of just one simple vibratory motion. Usually, it consists of many vibratory motions taking place simultaneously.
For example, the velocity spectrum of a vibrating bearing usually shows that the bearing is vibrating at not just one frequency but at various frequencies. Vibration at some frequencies may be due to the movement of bearing elements, at other frequencies due to the interaction of gear teeth, and at yet other frequencies due to the rotation of motor windings.
Because a spectrum shows the frequencies at which vibration occurs, it is a very useful analytical tool. By studying the individual frequencies at which a machine component vibrates, as well as the amplitudes corresponding to those frequencies, we can infer a great deal about the cause of the vibration and the condition of the machine.

Section 2: How is Machine Vibration Described? 24
GE Measurement & Control
In contrast, a waveform does not clearly display the individual frequencies at which vibration occurs. A waveform instead displays only the overall effect. It is thus not as easy to diagnose machine problems using waveforms. With the exception of a few specialized cases, spectra4 (and not waveforms) are usually the primary tool for analyzing machine vibration.
The information a spectrum contains depends on the Fmax and resolution of the spectrum. The Fmax of a spectrum is the frequency range over which information may be obtained from the spectrum. How high Fmax needs to be is dependent on the operating speed of the machine. The higher the operating speed, the higher Fmax needs to be. The resolution of a spectrum is a measure of the level of detail in the spectrum, and is determined by the number of spectral lines characterizing the shape of the spectrum. The more spectral lines, the more detailed the spectrum.
4 Spectra is the plural of spectrum.

Section 2: How is Machine Vibration Described? 25
GE Measurement & Control
Summary
In this section we described machine vibration using methods that are useful for analysis purposes.
We defined the terms 'amplitude' and 'frequency', and described the physical significance of these terms. Amplitude is a measure of vibration severity while frequency is a measure of oscillation rate. Together, the amplitude and frequency of a vibrating machine component provide us with an understanding of the condition of the machine as well as the cause of the vibration.
We noted that machine vibration is much easier to analyze when it is graphically displayed, and we presented the two most common displays: waveforms and spectra. Usually, spectra are more useful for analysis purposes.
Section 3: How is Machine Vibration Measured? 26
GE Measurement & Control
Section 3: How is Machine Vibration Measured?
In the last section we identified the most important vibration analysis tool as the spectrum. When we measure machine vibration we usually measure vibration spectra, since the spectrum of a vibrating component tells us a great deal about the condition of the component as well as about the cause of vibration. Naturally it is vital that the spectrum, which gives such valuable information, be obtained accurately.
What guidelines must be observed to ensure measurements are accurate?
How should measurements be taken and for which machines should they be taken?
In this section we will answer these questions.
After reading this section you will be able to: • Recognize which machines should be monitored • Understand how vibration sensors should be mounted • Determine how measurement parameters should be set • Take measurements in a systematic way
Which Machines Need Monitoring?
When deciding which machines to monitor, critical machines should be given priority over other machines. This is much the same as monitoring the health of people. It is inappropriate to closely monitor the health of perfectly healthy people, and then to forsake the monitoring of others who genuinely need it. The same applies when monitoring the condition of machines.

Section 3: How is Machine Vibration Measured? 27
GE Measurement & Control
In general, the following critical types of machines should be monitored on a regular basis in order to avoid unexpected and costly problems:
(a) Machines that require expensive, lengthy, or difficult repairs if broken down (b) Machines that are critical to production or general plant operations (c) Machines that are known to frequently suffer damage (d) Machines that are being evaluated for their reliability (e) Machines that affect human or environmental safety

Section 3: How is Machine Vibration Measured? 28
GE Measurement & Control
How Does the Instrument Work?
Before taking a vibration measurement, you need to attach a sensor that can detect vibration behavior to the machine that is being measured. Various types of vibration sensors are available, but a type called accelerometer is normally used as it offers advantages over other sensors. An accelerometer is a sensor that produces an electrical signal that is proportional to the acceleration of the vibrating component to which the accelerometer is attached.
What is the acceleration of a vibrating component? It is a measure of how quickly the velocity of the component is changing.
The acceleration signal produced by the accelerometer is passed on to the instrument that in turn converts the signal to a velocity signal. Depending on the user’s choice, the signal can be displayed as either a velocity waveform or a velocity spectrum. A velocity spectrum is derived from a velocity waveform by means of a mathematical calculation known as the Fast Fourier Transform or FFT.
The diagram below is a very simplistic explanation of how vibration data is acquired. You may wish to consult other literature such as the vbSeries Instrument Reference Guide for further information.

Section 3: How is Machine Vibration Measured? 29
GE Measurement & Control
How is the Accelerometer Mounted?
Most machines involve rotary mechanisms. Motors, pumps, compressors, fans, belt conveyors, gearboxes, all involve rotary mechanisms and are frequently used in machines.
Most rotary mechanisms in turn have bearings that support the weight of rotating parts and bear the forces associated with rotary motion and vibration. In general, large amounts of force are borne by bearings. It is not surprising that bearings are often the place where damage occurs and where symptoms first develop.
Vibration measurements are thus usually taken at the bearings of machines, with accelerometers mounted at or near the bearings.
Since conclusions regarding machine condition - and hence whether or not money and human safety are risked - depend on the accuracy of measurements, we must be very careful how measurements are taken. It is important to always remember that the way in which we mount the accelerometer very much determines the accuracy of measurements.
How should accelerometers be mounted to ensure measurements are accurate and how can we do so safely? Here are some guidelines:

Section 3: How is Machine Vibration Measured? 30
GE Measurement & Control
(a) Mount as Close as Possible to the Bearing
Imagine a doctor who listened to your heart through thick clothing and placed the stethoscope closer to your kidney than to your heart. You would likely doubt his diagnosis as he would be basing it on sounds distorted by undue obstruction and noise from other organs.
When measuring vibration we must always attach the accelerometer as close as possible to the bearing. More specifically, we must attach it as close as possible to the centerline of the bearing to avoid picking up distorted signals.

Section 3: How is Machine Vibration Measured? 31
GE Measurement & Control
(b) Make Sure the Accelerometer is Firmly Attached
For the accelerometer to detect true vibration behavior, it needs to undergo exactly the same vibratory movement as the vibrating component. An accelerometer must therefore be attached firmly to the vibrating component so that it does not rock or move independently of the component. A loosely mounted accelerometer produces signals distorted by its own independent movements and therefore gives the wrong message.
Various mounting methods exist, but mounting by means of a magnet is the most popular as it offers a balance between measurement reliability and convenience to the user. The magnetic mounting supplied in the Commtest vb kit can be attached very firmly5, while allowing the user to measure multiple machines using the same accelerometer, with minimum time spent on attaching and detaching the accelerometer.
To ensure that the accelerometer is firmly attached, it must be stuck to a magnetic mounting surface this is even. The magnetic mount must sit securely on the surface with the accelerometer positioned in the prescribed orientation.
For the surface to be even, it must be free of debris, rust, and flaking paint.
5 When pulled perpendicularly away from the mounting surface, the vb accelerometer's magnetic mounting resists with a force of 22 kgf (48.4 lbf).

Section 3: How is Machine Vibration Measured? 32
GE Measurement & Control
The mounting surface must be truly magnetic (iron, nickel, or cobalt alloys). The magnetic mounting must not, for example, be attached to an aluminum surface by virtue of iron beneath the aluminum surface.
To avoid loss of magnetism, the magnetic mounting must not be dropped or heated. Care must also be taken not to strip the screw thread on the accelerometer and magnetic mounting.
(c) Make Sure the Accelerometer is Oriented
Correctly
Different situations require the accelerometer to be oriented differently. For example, to detect parallel misalignment the accelerometer is usually mounted in the radial direction of the bearings, but to detect angular misalignment the accelerometer needs to be mounted in the axial direction.

Section 3: How is Machine Vibration Measured? 33
GE Measurement & Control
The signal produced by the accelerometer is dependent on the orientation in which the accelerometer is mounted, since the amplitude (amount) of vibration varies in different directions.

Section 3: How is Machine Vibration Measured? 34
GE Measurement & Control
(d) Mount the Same Accelerometer in the Same
Location
For a particular measurement point it is important to always mount the accelerometer at the same location to minimize measurement inconsistencies that may lead to wrong conclusions. Where possible, always use the same accelerometer for a particular measurement point.

Section 3: How is Machine Vibration Measured? 35
GE Measurement & Control
(e) Mount the Accelerometer on Something
Substantial
The accelerometer must never be mounted on a very flexible part of the machine as the spectrum will be distorted by the flapping of the flexible part.
The accelerometer must never be used on structures that are very light as the weight of the accelerometer and magnetic mounting will distort the vibration behavior of the structure. In general, the combined weight of the accelerometer and magnetic mounting should be less than 10% of the weight of the vibrating structure.
(f) Take Care of the Accelerometer
If the accelerometer is treated roughly it may produce unreliable signals. Because of the strength of the magnetic mount, you must take care when attaching the accelerometer to a mounting surface. You can achieve this by approaching the mounting surface with the magnetic mounting tilted at an angle. When detaching the magnetic mounting, you must not use the accelerometer as a lever for breaking contact. Instead, the magnetic mounting should be gripped tightly and then tilted sideways to break the contact.
Section 3: How is Machine Vibration Measured? 36
GE Measurement & Control
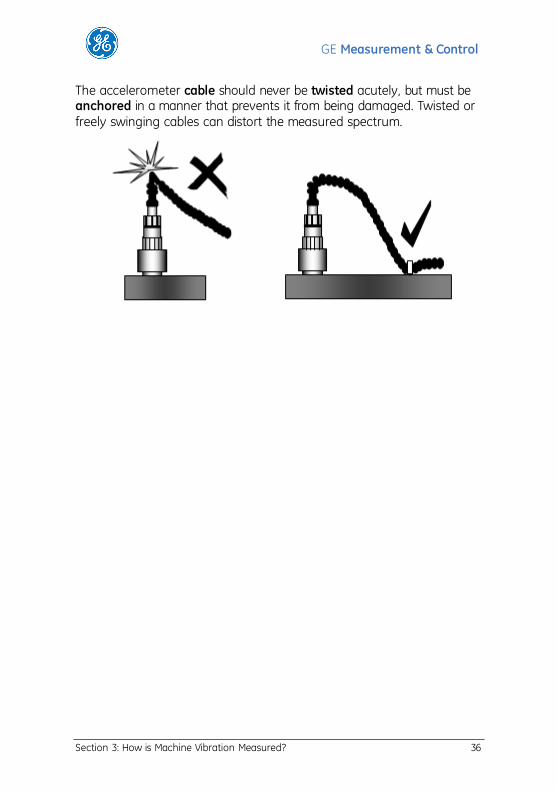
The accelerometer cable should never be twisted acutely, but must be anchored in a manner that prevents it from being damaged. Twisted or freely swinging cables can distort the measured spectrum.

Section 3: How is Machine Vibration Measured? 37
GE Measurement & Control
(g) Take Care of Personal Safety
You must manage hazards at all times. When taking vibration measurements, three kinds of hazards stand out in likelihood or severity: injury by moving parts, electrical shock, and magnet-induced damage.
Firstly, when mounting the accelerometer, you must take care to prevent the cable from becoming entangled with moving machinery. While the quick-release connector minimizes this danger it should not be relied on as a substitute for correct installation.
Other things that could tangle with moving machinery include loose clothing, long hair, data transfer cables and straps.
Secondly, you must never attach the accelerometer to any high voltage surface as this may cause electrical shock.
Thirdly, you must never bring the magnetic mounting near any magnet-sensitive objects such as pacemakers, credit cards, floppy disks, video tapes, cassette tapes and watches since these items can be damaged by magnetic fields.
There are other possible hazards. You should read and thoroughly understand the vbSeries Instrument Reference Guide before using the instrument or its accompanying accessories.

Section 3: How is Machine Vibration Measured? 38
GE Measurement & Control
How are Parameters Set?
What are measurement parameters?
Measurement parameters are the details that specify how a measurement is to be taken. By specifying measurement parameters, we specify how data is to be collected and processed before it is presented to us. Before taking a vibration measurement we need to specify what parameters will be used.
The parameters for vibration measurement may be likened to the 'what and how' details that a doctor must specify before a medical test is performed.
We will now look at how measurement parameters are set when we measure a spectrum. For the rest of this section, we will use the Commtest vb instrument as an example vibration monitoring instrument for our discussions, as it is a particularly simple instrument to use. For example, the default measurement parameter values (except for the default Fmax value) are suitable for taking most vibration measurements, so that in most situations few or none of the default parameter values requires adjusting. These parameters are those displayed in the Set Parameters screen of the vb instrument, with 'domain' set to 'frequency'.
What are some of these measurement parameter values and what do they mean?
The parameters used for measuring vibration spectra may be divided into four classes; namely, parameters that determine:
(a) How data is collected (b) How much or how fast data is collected (c) How data is processed

Section 3: How is Machine Vibration Measured? 39
GE Measurement & Control
(d) How data is displayed
(a) How Data is Collected
The parameters that determine how data is collected are 'Trigger type' and the parameters listed under 'Sensor setup'.
'Trigger type' is the parameter that tells the instrument how to begin measuring. If set to 'Free run', the instrument will take measurements continuously. If set to 'Single', only one measurement cycle will take place. In most cases the instrument can be set to 'Free run'.
The parameters under 'Sensor setup' inform the instrument what type of accelerometer is being used to take measurements. If the IEPE/ICP® -type accelerometer supplied in the vb kit is used, the 'Drive current' needs to be turned 'ON', and the 'Sensitivity' of the accelerometer needs to match that specified on the vbSeries instrument's Quality Assurance Card. 'Settling time' is the time required for the accelerometer and instrument to settle before measurements can be taken accurately. You should use the default 'Settling time' value (which varies with the Fmax value) to ensure measurement accuracy.

Section 3: How is Machine Vibration Measured? 40
GE Measurement & Control
(b) How Much or How Fast Data is Collected
The parameters that determine how much or how fast data is collected are the parameters 'Fmax', 'Spectral lines', and 'Overlap percentage'.
In Section 2, we noted that the higher the Fmax, the larger the frequency range over which information6 may be obtained from the spectrum.
Thus, if the Fmax value is high, data is displayed up to high vibration frequencies. To acquire information regarding high vibration frequencies, the measurement frequency - or rate of sampling data - needs to be high as well. As a result, the higher the Fmax, the faster the measurement will be.
The more spectral lines a spectrum has, the more information can be obtained from it. This means that the more spectral lines there are, the more data needs to be collected to generate the additional information, and therefore the longer the measurement will take.
6 A higher Fmax does not cause more data to be collected but causes the data to span across a wider range of frequencies.

Section 3: How is Machine Vibration Measured? 41
GE Measurement & Control
What Fmax Value Should be Used?
The higher the operating speed of the machine, the higher its frequencies of vibration will be, and the higher the Fmax will need to be in order to capture vibration behavior at those high frequencies.
For vibration that does not involve rotary fingers such as gear teeth, fan blades, pump vanes, and bearing elements, an Fmax value equal to 10 times the operating speed is usually sufficient to capture all crucial information.
For example, if the operating speed is 10 000 rpm, then an Fmax value of 100 000 cpm (100 kcpm) is most likely sufficient.
For vibration that does involve fingered elements such as gears, fans, pumps, and roller bearings, an Fmax value equal to 3 times the number of fingers multiplied by the operating speed is usually sufficient to capture all crucial information.

Section 3: How is Machine Vibration Measured? 42
GE Measurement & Control
For example, for a gear driven by a 12-toothed pinion rotating at 10 000 rpm, an Fmax value of 360 000 cpm (360 kcpm) is most likely sufficient.
If the Fmax value required is very large the resolution of the spectrum will be low, and information pertaining to low vibration frequencies may be lost. It may be necessary to take some low Fmax measurements in addition to the high Fmax measurement.
How Many Spectral Lines Should be Used?
In most cases 400 lines of resolution are sufficient. However, if a large Fmax value is used, the lines will be spread out over a large frequency range, leaving wide gaps between lines. Thus, for large Fmax values, more spectral lines may be needed to avoid loss of detail.
It should, however, be noted that the more spectral lines are used the longer the measurement will take and the more instrument memory space will be occupied. A high Fmax value or a high number of spectral lines should therefore be used only where necessary.
How Much Overlap Should I use?
Overlapping data is a means of reusing a percentage of a previously measured waveform to calculate a new spectrum. The higher the 'Overlap percentage', the less newly acquired data is needed to generate a spectrum, and thus the faster the spectrum can be displayed. 50% overlap is ideal for most cases.

Section 3: How is Machine Vibration Measured? 43
GE Measurement & Control

Section 3: How is Machine Vibration Measured? 44
GE Measurement & Control
(c) How Data is Processed
The parameters that determine how data is processed are the parameters 'Average type', 'Number of averages', and 'Window type'.
Imagine you had to accurately measure the width of the pages in this book. Because the width may vary slightly from page to page, you would probably measure not just the width of one page but rather that of a few pages and then take the average.
Similarly, when vibration is measured several spectra are usually measured and then averaged to produce an average spectrum. The average spectrum better represents vibration behavior as the averaging process minimizes the effect of random variations or noise spikes that are inherent in machine vibration.
The parameter 'Average type' determines how spectra are averaged. 'Linear' averaging is recommended for most cases. 'Exponential' averaging is usually used only if vibration behavior varies significantly over time. 'Peak hold' does not really involve averaging but causes the worst-case (largest) amplitude for each spectral line to be displayed.

Section 3: How is Machine Vibration Measured? 45
GE Measurement & Control
The parameter 'Number of averages' determines the number of consecutive spectra used for averaging. The larger the number of spectra used for averaging, the more noise spikes are smoothed out and the more accurately true spectral peaks are represented.
However, the larger the number of averages, the more data needs to be collected, and therefore the longer it takes to obtain the 'average spectrum'. A 'Number of averages' of 4 is sufficient for most cases.
The collected data is usually not directly used to generate a spectrum, but is often modified beforehand to cater for certain limitations of the FFT process (the process that transforms the data into a spectrum). Data is usually modified by multiplication with a correction window. This prevents spectral lines from 'smearing' or 'leaking' into one another.
'Window type' is the parameter that determines the kind of window that is used. The 'Hanning' window is usually used. If the 'rectangular' window is used, the data will effectively not be modified.

Section 3: How is Machine Vibration Measured? 46
GE Measurement & Control
(d) How Data is Displayed
The parameters that determine how the spectrum is to be displayed are listed under 'Display units'.
To specify how the spectrum is to be displayed, the scale of the spectrum needs to be specified. The scale of the spectrum determines how easily spectral details can be seen, and is defined by the parameters 'Amplitude scale', 'vdB reference', 'Log range', and 'Velocity max.
In most cases, the 'Amplitude scale' can be 'Linear'. If a linear amplitude scale is used, then the parameters 'vdB reference' and 'Log range' are of no consequence (and therefore need not be set).
In general, you should set 'Velocity max' to 'Automatic' to allow the instrument to automatically select an ideal amplitude scale that allows spectral peaks to be clearly seen.

Section 3: How is Machine Vibration Measured? 47
GE Measurement & Control
To specify how the spectrum is to be displayed, the 'amplitude type' to be used also needs to be specified. In Section 2 (page 16), we defined two amplitude types - peak amplitude and rms amplitude.
If the 'Ø-peak' (or 'peak') amplitude is used, the spectrum will display the maximum speed achieved by the vibrating component at the various vibration frequencies.
On the other hand, if the 'rms' amplitude is used, a quantity indicative of vibration energy at the various frequencies will be displayed instead.
For vibration spectra, the peak amplitude at a particular frequency is exactly √2 times (roughly 1.4 times) the rms amplitude at that frequency. Thus which amplitude type is used is not really important since amplitude conversions7 may be readily done.
We recommend that you always use the same amplitude type for a particular measurement point to avoid misinterpretations. A switchover from the rms amplitude to the peak amplitude causes an apparent rise in vibration amplitude that might be mistakenly interpreted as machine deterioration. On the other hand, a switchover from the peak amplitude to the rms amplitude might hide a genuine rise in vibration amplitude.
Finally, the amplitude and frequency units to be used in the spectrum also need to be specified. Which units should be used is really a matter of personal choice, or more often, geographic location.
7 For a spectrum, the peak amplitude is times the rms amplitude. This relationship is generally not valid for waveforms.

Section 3: How is Machine Vibration Measured? 48
GE Measurement & Control
In North America, the velocity unit usually used (for linear velocity scales8) is in/s, and a commonly used frequency unit is kcpm (kilocycles per minute).
In other parts of the world, the velocity unit and frequency unit usually used are mm/s and Hz respectively. Shown below are the relationships between the units9:
8 Many vibration analysts prefer the logarithmic velocity unit vdB. However, discussion on logarithmic scales and units is beyond the scope of this book. 9 We have rounded the in/s ø-peak, mm/s rms conversion to 18. The correct ratio is 17.96.

Section 3: How is Machine Vibration Measured? 49
GE Measurement & Control
How is Data Collected?
As machine surroundings are often hazardous and uncomfortable, vibration analysis is normally performed away from the machine. To do this, measurements are usually recorded with the instrument then transported to an office where the recorded data can be analyzed in a quiet and safe environment. In the office, the data can be transferred to a computer for more detailed analysis.
In most factories there are usually numerous critical machines that need to be monitored. Furthermore, to enable thorough analysis, each machine usually needs to be monitored at various points. Each point in turn often requires monitoring using different accelerometer orientations, and occasionally, using different measurement parameters as well. Thus, on every round of data collection a large number of recordings usually need to be taken.
To avoid having to repeatedly travel between the office and machines, recordings are usually taken of all machines before the recordings are brought to the office for analysis.

Section 3: How is Machine Vibration Measured? 50
GE Measurement & Control
It is important that recordings be taken both accurately and systematically. When you have an organized method of taking recordings there is less chance of confusing the spectra of different machines. If recorded spectra get mixed up they would most likely lead to wrong conclusions and perhaps to very costly consequences as well.
In view of the large matrix of recordings that need to be taken, how do we ensure that recordings are always taken of the locations intended, that the recordings that are taken are not confused with one another, and that no recordings are left out? A recording list is used.
A recording list shows all the recordings that need to be taken on a given round of data collection. It is like a detailed shopping list that shows us exactly what to buy during a shopping mission. From a recording list, we can see which recordings need to be taken on which machines, at which points on the machines, in which orientations, and using which measurement parameters.
Section 3: How is Machine Vibration Measured? 51
GE Measurement & Control
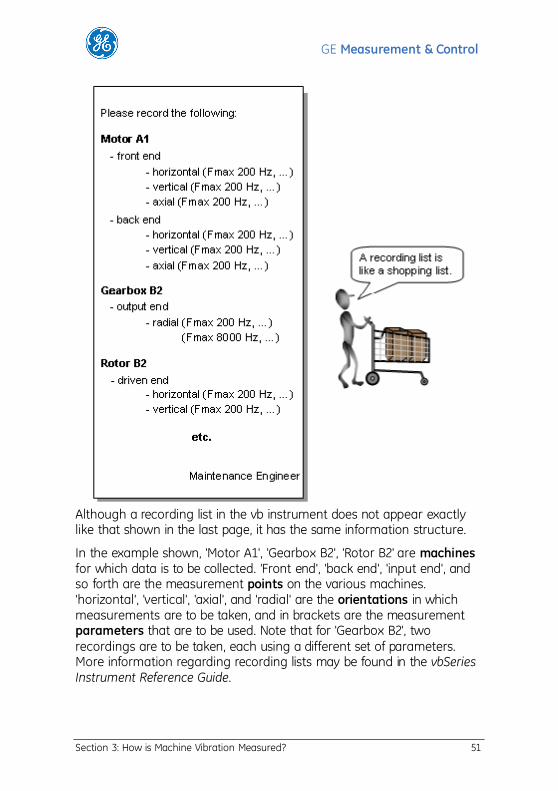
Although a recording list in the vb instrument does not appear exactly like that shown in the last page, it has the same information structure.
In the example shown, 'Motor A1', 'Gearbox B2', 'Rotor B2' are machines for which data is to be collected. 'Front end', 'back end', 'input end', and so forth are the measurement points on the various machines. 'horizontal', 'vertical', 'axial', and 'radial' are the orientations in which measurements are to be taken, and in brackets are the measurement parameters that are to be used. Note that for 'Gearbox B2', two recordings are to be taken, each using a different set of parameters. More information regarding recording lists may be found in the vbSeries Instrument Reference Guide.

Section 3: How is Machine Vibration Measured? 52
GE Measurement & Control
To avoid confusion, you must give machines and measurement points unique and meaningful names in the recording list. To rule out misidentifications, you must clearly label machines and measurement points with names that match those adopted in the recording list. When taking recordings, you must take care to ensure that the mounting orientation of the accelerometer matches that described in the recording list.
Not all machines on the recording list may be equally critical. Less critical machines can be monitored less frequently. If only certain machines or measurement points from the recording list need to be monitored during a particular round of data collection, you can tag those machines that need to be monitored so that recordings are only taken for items that are tagged. The tagging of items in a recording list is further explained in the vbSeries Instrument Reference Guide.
To help ensure data collection is done regularly, you should create a schedule showing when data collection will be carried out.
For most machines, data should be collected every month. For critical machines, data may need to be collected every week, and for less important machines, every alternate month. We advise you to begin with a rigorous schedule then adjust it later as more experience is gained.

Section 3: How is Machine Vibration Measured? 53
GE Measurement & Control
Imagine going shopping with a shopping list but without enough money to buy what is needed, and without the means to transport things bought back home. We would expect such a shopping mission to fail.
Similarly, with machine vibration monitoring, we need sufficient battery and memory capacity in the vb instrument to complete a round of data collection. Before beginning to collect data, you must ensure that there is sufficient battery and memory capacity in the instrument (see the vbSeries Instrument Reference Guide for further details).
Most kinds of vibration problems are detected while the machine is running steadily and exhibiting a steady vibration pattern.
If a machine has just started up, or if its operating speed has just been changed, you need to ensure that the machine is given time to settle into a steady state before taking spectrum recordings, otherwise, the recorded spectra will not reflect the true steady-state behavior of the vibrating machine.

Section 3: How is Machine Vibration Measured? 54
GE Measurement & Control
When a round of data collection is complete, you should transfer the recorded data to a computer with Ascent™ software for analysis and archiving. Once the recorded data has been archived, you can erase the data from the vb instrument, thus freeing up memory space on the instrument for another round of data collection.
Summary
In this section we studied how machine vibration is measured.
We discussed methods for deciding which machines to monitor, and what factors determine which machines are critical. We also examined how the measuring instrument works, and described the function of accelerometers. We emphasized the importance of mounting the accelerometer carefully, since the accuracy of a measurement is largely dependent on accelerometer mounting.
We provided guidance on how to set measurement parameters; setting the parameters for a measurement simply means specifying the details on how the measurement is to be carried out. This includes specifying how, how much and how fast data is to be collected, as well as how the collected data is to be processed and displayed.
We also emphasized the importance of collecting and storing data in a systematic way. For a given round of data collection, data is usually recorded for each machine with the aid of a recording list before the data is transferred to a computer for detailed analysis and archiving. To help ensure data collection is done regularly, you should have a clear schedule detailing when data collection is to be carried out.

Section 3: How is Machine Vibration Measured? 55
GE Measurement & Control
Appendix: List of Symbols

Section 3: How is Machine Vibration Measured? 56
GE Measurement & Control
Symbol Meaning
adj. adjective
Ascent™ software Commtest vibration analysis software
cos x the cosine of x
cpm cycles per minute
cps cycles per second
dB decibel(s)
FFT fast Fourier transform
Fmax the maximum frequency value on a spectrum
ft foot (or feet)
ft/s feet per second
ft/s² feet per second per second
g acceleration due to gravity (9.80665 m/s²)
Hz Hertz
in inch(es)
in/s inches per second
kcpm kilocycles per minute (1000 cpm)
kg kilogram
kgf kilogram force
kHz kiloHertz (1000 Hz)
lb pound(s)
lbf pound force
Ibf/in pound force per inch
log x the logarithm of x

Section 3: How is Machine Vibration Measured? 57
GE Measurement & Control
Symbol Meaning
log10 x the base-10 logarithm of x
m meter(s)
mil 0.001 inch
mm millimeter(s)
mm/s millimeters per second
m/s meters per second
m/s² meters per second per second
mV/g milliVolts per g
n. noun
pref. prefix
rad radian(s)
rad/s radians per second
rms root-mean-square
RPM revolutions per minute
s second(s)
sec second(s)
sin x the sine of x
t time
vb instrument Commtest vibration analyzer
vdB decibel unit for velocity
w.r.t. with reference to
the average value of x
x² the square of x (x times x)
1X fundamental frequency
° degree(s)
the square root of x
angle
phase angle
the constant pi (roughly equal to 3.14)
the sum of x values
angular frequency (expressed in rad/s)

Glossary Abbreviations Guide 58
GE Measurement & Control
Glossary Abbreviations Guide

Glossary of Terms 59
GE Measurement & Control
Glossary of Terms
A
A/D converter
The electronic hardware that converts analog signals to digital values by way of data sampling.
Acceleration
The rate of change of velocity. The acceleration of an object is the rate at which it is gaining or losing speed in a particular direction. The acceleration of an object is proportional to the force causing it to accelerate. Commonly used acceleration units are mm/s2 (metric), m/s2 (SI), in/s2 (imperial), ft/s2 (imperial), and g. See also Accelerometer and Triaxial accelerometer.
Acceleration due to gravity
See g.
Accelerometer
A transducer with an electrical output directly proportional to the acceleration of the vibrating point in the direction in which the transducer is attached. The acceleration of a vibrating component is usually measured using an accelerometer. See also Triaxial accelerometer.
Alarm envelope
A chart that specifies the maximum allowable amplitude for each frequency value in a spectrum or group of spectra. An alarm envelope is usually based on a reference spectrum that is 'ideal' or 'normal' for the measurement point.
Algorithm
The procedure for performing a task e.g. the procedure for calculating a spectrum from a waveform - the Fast Fourier transform - is an algorithm.

Glossary of Terms 60
GE Measurement & Control
Aliasing
The illusion of high frequency signals appearing as low frequency signals due to the sampling frequency being less than twice the highest frequency component in the signal. Vibration measurement instruments avoid aliasing by filtering out frequency components above the specified Fmax (by way of a 'low pass' or 'anti-aliasing' filter) and sampling the filtered signal at a rate at least twice the Fmax.
Alignment
The process where the axes of machine components are positioned and oriented correctly and accurately with respect to one another. See also Misalignment.
Amplitude
The magnitude of a signal or periodic motion e.g. the magnitude of the velocity of a vibrating body. Amplitude can be expressed in a variety of ways, the most common amplitude types being peak, peak-peak, and root-mean-square (rms).
Amplitude modulation
The fluctuation in the amplitude of a signal due to the influence of another signal that is of a different frequency. In rotating machinery, high frequency signals, such as bearing inner race defect signals, are often amplitude-modulated by the lower frequency signal of the rotating shaft, due to the defect passing in and out of the load zone once every revolution. The spectrum corresponding to a sinusoid, amplitude-modulated by another is characterized by a peak located at the frequency of the sinusoid, and a sideband on either side of the peak, each sideband distanced from the peak by the frequency of the modulating sinusoid. The term 'amplitude modulation' is sometimes abbreviated as 'AM'. See also Frequency modulation.

Glossary of Terms 61
GE Measurement & Control
Analog (w.r.t. signals)
Having a continuous relationship with the physical quantity being measured e.g. an accelerometer outputs an analog signal that bears continuous similarity to the vibration being measured. Due to the continuity with which an analog signal describes the physical quantity being measured, information regarding the physical quantity can be obtained from the analog signal at any instant in time. See also A/D converter and Digital.
Analog-to-digital converter
See A/D converter.
Analysis parameters
See Measurement parameters.
Analysis software (w.r.t. vibration monitoring)
Computer software for the detailed analysis of collected data. See also Ascent™ software.
Angular contact bearing
A bearing that supports both radial and axial shaft loads. The rolling elements in an angular contact bearing are usually oriented at an angle to the shaft axis. See also Thrust bearing.
Angular frequency
The oscillation rate of a signal or periodic motion expressed as the angular distance traversed per unit time e.g. an object vibrating at one cycle per second has an angular frequency of 2 radians per second (since one cycle, or an angle of 2 radians, is traversed every second). Angular frequency is usually denoted by the symbol and measured in rad/s (radians per second). See also Frequency and Radian.
Angular misalignment
See Misalignment.
Anti-aliasing filter
A low pass filter that removes all signal components of frequencies higher than the specified Fmax. See also Aliasing.

Glossary of Terms 62
GE Measurement & Control
Ascent software
Our Windows-based analysis software that facilitates the archiving and analysis of vb data on a PC. The Ascent software allows vibration data to be charted, analyzed, and printed.
Asynchronous peak
See Non-synchronous peak.
Attenuation
Reduction in the level of a signal. As a vibration signal travels through a mechanical structure its level decreases. In general, high frequency components decrease in level more than low frequency components.
Auto-correlation
The level of similarity between two 'snapshots' of the same waveform. Two snapshots that are identical have an auto-correlation of one, and if they are entirely different, the auto-correlation is zero.
Averaging
A mathematical operation aimed at reducing spectral or waveform distortions arising from random noise signals. An 'average' spectrum or waveform is derived from a series of individual spectra or time-synchronized waveforms. The amplitude at each frequency or time value of an average spectrum or waveform, is the average of amplitudes of the individual spectra or waveforms at that frequency or time value. The two most common methods of amplitude averaging are linear averaging and exponential averaging. See also Peak hold.
Axes
Plural of Axis.
Axial direction
The direction of the centerline of a shaft or rotor.
Axial force
A force acting in the direction of the centerline of a shaft or rotor. Axial force is sometimes called 'thrust'. An overhung rotor vibrates in the axial
Glossary of Terms 63
GE Measurement & Control
direction because the movement caused by the weight of the rotor causes an axial excitation force.
Axial vibration
Vibration in the direction of the centerline of a shaft or rotor. Axial vibration is seen in overhung rotors. See also Radial vibration.
Axis (w.r.t. charts)
See x axis and y axis.
Axis (w.r.t. motion)
An imaginary line around or along which motion takes place e.g. the lengthwise centerline of a shaft is the axis of rotation of the shaft.
Axis (w.r.t. the vb instrument)
A data group in the vb instrument data structure, namely, a data group for grouping recordings taken in the same orientation at a particular measurement point. See also Data structure.
Axis (w.r.t. vibration measurements)
The orientation or 'direction' in which the accelerometer is mounted when a vibration measurement is taken. The accelerometer is usually mounted in the axial, radial, horizontal, vertical, or tangential direction of a rotating part.
B
Background noise
See Noise.
Backlash
A condition where a machine part can move independently of the part driving it e.g. a gear that can rotate freely a slight distance without being obstructed by the pinion, or a pulley that can rotate slightly to take up slackness in a belt. Backlash is caused by looseness in a drive train and leads to motion inaccuracy.
Balance weights
See Correction weights.

Glossary of Terms 64
GE Measurement & Control
Balanced
The condition where the axis of rotation and mass centerline of a rotating part are coincident. See also Imbalance.
Balancing
The adjustment of the mass distribution in a rotating part so that the axis of rotation and mass centerline of the rotating part are coincident. See also Correction weights and Imbalance.
Ball pass frequency
The speed at which bearing rolling elements pass a certain point on the inner or outer race of the bearing. The ball pass frequencies for the inner and outer races are often abbreviated as 'BPFI' and 'BPFO' respectively. The vibration spectrum of a defective bearing often has peaks at the BPFI and BPFO frequencies. The BPFI is usually about 0.6 times the operating speed multiplied by the number of rolling elements, and the BPFO is usually about 0.4 times the same quantity.
Ball spin frequency
The speed at which a rolling element revolves around its own axis in a bearing. The term 'ball spin frequency' is often abbreviated as 'BSF'. The vibration spectrum of a defective bearing often has a peak at the ball spin frequency. The ball spin frequency is usually not a whole number multiple of the fundamental frequency.
Band pass filter
A filter that allows only signal components of frequencies between two cut-off frequency values to pass through. Band pass filters are used when only a certain frequency range is of interest.
Bandwidth
The difference between the upper and the lower cut-off frequency values of a band pass filter, or the range of frequencies over which an instrument will measure.
Baseline spectrum
See Reference spectrum.

Glossary of Terms 65
GE Measurement & Control
Baud rate
The rate at which data is transferred between a computer and the vb instrument. Baud rate is measured in 'bits per second' or 'kilobits per second'.
Bearing tones
The frequencies of rotation of the elements of a rolling element bearing. The bearing tones of a rolling element bearing include the frequency of rotation of the cage (FTF), the frequency of rolling elements making contact with a certain point on the inner race (BPFI), the frequency of rolling elements making contact with a certain point on the outer race (BPFO), and the frequency of rolling elements spinning around their own axes (BSF). See also Ball pass frequency, Ball spin frequency, and Fundamental train frequency.
Beating
A phenomenon where a signal pulsates periodically because the signal comprises two signals of nearly the same frequency. The frequency of pulsation or beating is equal to the difference between the frequencies of the two signals. Beating can occur when there are identical machines operating at about the same speed, or when the frequency of the excitation force is close to the natural frequency.
Bending moment
The cause of bending and shear stress. A force applied perpendicularly to the tip of a cantilever causes a bending moment at every position of the cantilever. The higher the bending moment, the higher the shear stress, and the more the bending.
Bin
See Spectral line.
Bit
Binary digit. The binary number system uses only two digits, '0' and '1' (as opposed to the decimal number system which uses ten digits, '0' to '9'). Each '0' or '1' appearing in a binary number is a 'bit'.

Glossary of Terms 66
GE Measurement & Control
Blade pass frequency
The speed at which fan blades rotate past a fixed reference point. This is equal to the operating speed of the fan multiplied by the number of fan blades. The vibration spectrum of a fan shows a peak at the blade pass frequency. The term 'blade pass frequency' is often abbreviated as 'BPF'.
Bode plot
A set of two graphs, one showing how amplitude varies with frequency and the other showing how phase varies with frequency. A Bode plot is used to show the frequency response of a system. See also Nyquist plot.
BPFI
Abbreviation for ball pass frequency inner. See Ball pass frequency.
BPFO
Abbreviation for ball pass frequency outer. See Ball pass frequency.
Brinneling
Indentation of the races of a bearing by its rolling elements. The indentation is usually caused by vibration of the shaft while the shaft is not rotating. The indentation could also be due to large static forces being applied to the shaft while it is not rotating. Brinneling causes spectral peaks at the ball pass frequencies.
Broad band analysis
See Broad band measurement.
Broad band measurement
The measurement of the overall vibration level over a large frequency range. A broad band measurement indicates any change to the overall vibration energy of the system but cannot indicate specifically at what frequencies energy change is taking place. See also Narrow band measurement.
BSF
Abbreviation for ball spin frequency. See Ball spin frequency.

Glossary of Terms 67
GE Measurement & Control
Bump test
A test for determining the natural frequencies of a system. The system is struck with an impulsive force, e.g. by a hammer, and allowed to vibrate freely. The frequencies corresponding to spectral peaks in the free vibration spectrum of the system are the natural frequencies of the system.
C
Cage defect frequency
See Fundamental train frequency.
Calibration
The verification and/or correction of the accuracy of an instrument, using a known standard as the reference.
Carrier frequency
The frequency of a signal that is being modulated by another signal e.g. the rotor bar pass frequency of a motor is often a carrier frequency that is modulated by the shaft rotation frequency. See also Amplitude modulation, Frequency modulation and Modulation.
Cascade plot
See Waterfall chart.
Cavitation
A condition where the inlet pressure of a pump or water turbine is too low and therefore causes a mixed flow of fluid and vapor. Cavitation causes random high frequency vibration.
Center of mass
The center point of mass concentration in a body. The weight of the body acts through the center of mass of the body. The imaginary line connecting the center of mass at every cross-section of a rotor is the mass centerline of the rotor. See also Principal inertia axis and Imbalance.

Glossary of Terms 68
GE Measurement & Control
Centrifugal force
The force that keeps a rotating object in a circular path. The centrifugal force acts through the center of mass of the object and towards the center of rotation. The magnitude of the centrifugal force is proportional to the mass and the square of the speed of the rotating object, and inversely proportional to the radius of rotation.
Cepstrum
A chart that shows the Fourier transform of a spectrum i.e. the spectrum of a spectrum. A cepstrum extracts periodic patterns from a spectrum in the same way a spectrum extracts periodic patterns from a waveform. A cepstrum is useful for analyzing spectra containing many harmonics and sidebands just as a spectrum is useful for analyzing waveforms made up of many sinusoids. Cepstrum analysis is particularly useful for gearboxes and rolling element bearings as the vibration spectra often contain many harmonics and sidebands. A series of equally spaced harmonics or sidebands on a spectrum appears as a single peak on a cepstrum.
Coherence
A measure of the level of proportionality between two signals. For example, there is coherence between the response and the excitation force in a linear system. On the other hand, there is no coherence between an excitation force and random noise. Coherence is rated on a scale ranging from zero to one. A directly proportional relationship is given a coherence of one, and where there is no relationship whatsoever between the two signals, the coherence is zero. See also Cross-correlation.
COM port
Communications port of a computer, which allows data transfer to or from the computer.
Continuous (w.r.t. signals)
Having data corresponding to all time values, all frequency values, or all values on the x axis. The analog signal output by an accelerometer is a continuous signal. See also Discrete.

Glossary of Terms 69
GE Measurement & Control
Correction weights
Weights that are attached to a rotating part in order to adjust the mass distribution of the rotating part such that the axis of rotation and mass centerline of the rotating part are coincident. See also Imbalance.
Cosine wave
The sine wave phase-shifted by 90° i.e.
cos = sin ( + 90°)
where 'cos' and 'sin' denotes 'cosine' and 'sine' respectively, and is the angle.
Coulomb damping
The dissipation of vibration energy due to friction between dry surfaces. Friction in movable joints and hinges is a common source of Coulomb damping. The quantity of energy dissipated is dependent on the texture of the sliding surfaces, the force pressing the sliding surfaces together, and the distance over which friction occurs. The French physicist, Charles A. de Coulomb first expounded the proportionality of friction to applied pressure. See also Hysteretic damping and Viscous damping.
Couple
A pair of forces distanced apart and acting in opposite directions. A couple acting on a body causes the body to rotate. See also Couple imbalance.
Couple imbalance
An imbalance condition where the mass centerline of a rotor is not parallel to the axis of rotation but intersects it. This is caused by two heavy spots one located at each end of the rotor and which are on opposite sides of the rotor surface. When rotated, the centripetal forces associated with the oppositely positioned heavy spots give rise to a couple that rotates at the rotational speed of the rotor. The rotating couple in turn causes out-of-phase repeating forces to act on the support bearings i.e. the force acting on one bearing is always pointing in a direction opposite to that acting on the other bearing. As a result, the rotor rocks from side to side. Couple imbalance can be corrected by adding two correction weights to the appropriate locations on the rotor. See also Dynamic imbalance and Static imbalance.

Glossary of Terms 70
GE Measurement & Control
cpm
A measurement unit for the frequency of periodic motion. cpm stands for 'cycles per minute'. One cpm is equal to one sixtieth of a Hertz (1/60 Hz). See also cps.
cps
A frequency unit equivalent to 60 times the frequency unit, cpm i.e. one cps (cycles per second) is equal to 60 cpm (cycles per minute). See also Hertz.

Glossary of Terms 71
GE Measurement & Control
Crest factor
The ratio of the peak amplitude of a waveform to the rms amplitude of the waveform. The crest factor of a vibration waveform provides information regarding the nature of the vibration. For example, the waveform from an imbalanced rotor is roughly the same as a sinusoidal waveform and has a crest factor roughly equal to (approximately 1.4). If the dominant cause of vibration is misalignment, the crest factor will usually be less than and if there is impacting in gear teeth or bearing rolling elements, the crest factor will generally be higher than .
Critical damping
The quantity of damping just enough to stop a system from vibrating. A critically damped system that is momentarily excited will complete only part of an oscillation before returning to and remaining at its equilibrium position. If the damping is more than the critical amount, the system will return to its equilibrium position more slowly, though without vibrating. Large guns are usually critically damped to ensure they return to their original position after recoil in the minimum time without vibrating. Over-damping a gun would cause delays between firings. See also Over-damped system and Under-damped system.
Critical frequency
See Critical speed.
Critical speed
A machine operating speed that matches one of the natural frequencies of the machine. A machine operated at any of its critical speeds will vibrate excessively due to resonance. To avoid machine damage, the operating speed of the machine should be increased or decreased rapidly past its critical speeds.
Cross-correlation
A measure of how similar a waveform is to another waveform. The cross-correlation of two identical waveforms is one, and of two completely dissimilar waveforms is zero. See also Coherence.
cyc/sec
See cps.

Glossary of Terms 72
GE Measurement & Control
Cycle
One complete sequence of the shortest signal pattern that characterizes a periodic waveform or motion.
D
Damped natural frequency
The natural frequency of a damped system. In practice, all machines are damped to a certain extent. When a machine is undergoing free vibration it will vibrate at its damped natural frequencies. If all damping were removed from the machine (something impossible in practice), the free vibration of the machine would occur at its undamped natural frequencies or resonant frequencies. Damped natural frequencies are always slightly lower than their corresponding resonant frequencies.
Damping
The dissipation of vibration energy as heat and/or sound. The gradual decrease in amplitude of a freely vibrating object is evidence of the presence of damping. See also Coulomb damping, Hysteretic damping, and Viscous damping.
Data block
A collection of instantaneous amplitude values derived from sampling a continuous time domain signal (using an A/D converter). FFT calculations are performed on time domain data blocks to produce frequency domain spectra.
Data structure
The hierarchical structure of data storage in a vibration measurement instruments. In the vb instrument, there are six levels in the hierarchy: Folder, machine, point, axis, parameter set, and recording.
dB
See decibel.
Decibel
A dimensionless logarithmic unit for amplitude often abbreviated as 'dB' and defined as follows:

Glossary of Terms 73
GE Measurement & Control
Amplitude dB = 20 log10 (Amplitude / Reference Amplitude)
dB units can be used for displacement, velocity, or acceleration amplitude. Due to the use of the logarithm function, dB units are useful for displaying signals with both very large and very small amplitudes. A 6 dB increase, for instance, represents a 100% increase in amplitude on the linear scale. See also vdB.
Degree
A measurement unit for angle, often denoted by the symbol °. One complete rotation is equal to 360°; half a rotation is equal to 180°; a quarter rotation is equal to 90°, etc. See also Radian.
Degrees of freedom
The minimum number of independent coordinates required to determine completely the positions of all parts of a system at any instant of time. The motion of a simple pendulum can be described by one coordinate: its angle around the axis of rotation. It is thus a single degree-of-freedom system. In comparison, a shaft has an infinite number of mass points and an infinite number of coordinates is required to specify its deflected configuration. Thus, it has an infinite number of degrees of freedom. The larger the number of degrees of freedom, the more complex the system. See also Natural frequency and Natural mode shape.
Demodulation
The process of extracting the modulating signal from a modulated signal. Shaft rotation signals sometimes modulate higher frequency signals such as rotor bar pass frequencies and gear mesh frequencies. A demodulator can be used to recover the shaft rotation signals. See also Amplitude modulation, Frequency modulation, and Modulation.
Deterministic
Not random and the value of which can be determined at any given time. Deterministic signals can be non-periodic. As most machine vibration is deterministic as well as periodic, their spectra show well-defined harmonics.
DFT
See Discrete Fourier transform.

Glossary of Terms 74
GE Measurement & Control
Differentiation
A mathematical operation which yields the rate at which a variable is changing with respect to another variable. For example, acceleration is the rate at which velocity is changing with respect to time, and may be derived from velocity by way of differentiation (with respect to time). In vibration analyzers, differentiation can be performed on analog signals by means of hardware or it can be calculated from a discrete signal by means of software. Differentiation however amplifies noise signals and is seldom performed in vibration analyzers. See also Integration.
Digital (w.r.t. signals)
That which has quantized signal values. Digital signals are obtained from analog signals and may or may not be continuous. Digital signals are easier to manipulate than analog signals. Most vibration measurement instruments display digital rather than analog signals. See also A/D converter and Quantization.
Discrete
Finite, discontinuous, that can be counted. A discrete waveform does not have data corresponding to all time values, but has data corresponding to certain time values only. Similarly, a discrete spectrum does not have amplitude data corresponding to all frequency values, but to certain frequency values only. See also Continuous.
Discrete Fourier transform
A mathematical operation which calculates a discrete spectrum from a discrete waveform. The term “discrete Fourier transform” is often abbreviated as “DFT”. The FFT algorithm is a method of performing the DFT operation in an efficient manner typically on a computer.
Displacement
The position of an object relative to a fixed reference point, measured in a particular direction. Two objects positioned at equal distance but in opposite directions from the reference point have displacements of equal magnitude but of opposite signs. Displacement units commonly used in the field of vibration analysis are mm (metric) and mil (imperial).

Glossary of Terms 75
GE Measurement & Control
Displacement transducer
A transducer with an electrical output directly proportional to the displacement of the vibrating point to which the transducer is attached. An example of a displacement transducer is the proximity probe.
Domain
A set of values to which is mapped another set of values. The x axis of a chart is often the domain. See also Frequency domain and Time domain.
Drive current
The constant electric current supplied to an accelerometer. ICP® accelerometers require this constant current. When using an ICP® accelerometer with the vb instrument the drive current should be turned ON.
Dynamic imbalance
An imbalance condition involving both static and couple imbalance. The mass centerline is both offset from and not parallel to the axis of rotation. Most cases of imbalance in machines are dynamic imbalance.
Dynamic range
The difference between the highest and the lowest amplitude an instrument can measure, with the amplitudes expressed in dB.
E
Eccentricity
The distance between the center of mass and the center of rotation. The larger the eccentricity, the larger the imbalance force.
Elastic
That which can be easily distorted, and which tends to revert to an original shape after being distorted e.g. a guitar string is elastic. In an engineering sense, an 'elastic' material is one that exhibits linear proportionality between mechanical stress and strain e.g. a steel rod is elastic when deflected slightly i.e. the amount by which the steel rod deflects is linearly proportional to the force applied to it.

Glossary of Terms 76
GE Measurement & Control
Engineering units
See Unit.
Equilibrium
The state of a body where either no force is acting on the body or the resultant force acting on the body is zero (i.e. the forces acting on the body cancel out one another).
Equilibrium position
The position of lowest potential energy or the position a freely oscillating object will come to rest.
EU
Abbreviation for Engineering units. See Unit.
Excitation force
A force that initiates free vibration or sustains forced vibration. Excitation forces may be periodic, non-periodic, or random in nature. Machine vibration is usually caused by excitation forces originating from imbalanced, misaligned, loose, or defective parts. See also Repeating force.

Glossary of Terms 77
GE Measurement & Control
Excitation function
See Excitation force.
Exponential averaging
A method of spectra or waveform averaging where more weighting is given to the most recent spectrum or waveform than to preceding ones. This allows the average to better reflect time-varying vibration patterns while maintaining a measure of noise suppression. Exponential averaging is a continuously running average and for a spectrum, is given by:
Average i,k = Average i,k-1 + (Amplitude i,k – Average i,k-1) / n
where i = spectral line number
k = average number
(in the sequence of averages done for spectral line i)
n = number of spectra used for averaging
F
Fast Fourier transform
An algorithm for performing the DFT operation efficiently i.e. an algorithm for calculating a discrete spectrum from a discrete waveform. The term 'fast Fourier transform' is often abbreviated as 'FFT'. The FFT algorithm determines the frequencies and the amplitudes corresponding to the frequencies that are present in the waveform. Jean B. J. Fourier was a French mathematician who developed a means of expanding periodic functions in terms of harmonic functions, thereby contributing much to the fields of heat flow and vibration analysis. See also Fourier transform.
Fatigue
The progressive development of the size of cracks in a material due to the action of cyclic forces. Vibration is a cause of fatigue. The rate of growth of a fatigue crack is proportional to the size of the crack. Fatigue can be minimized by grinding the surfaces to remove surface imperfections, and by minimizing stress spots in the design.

Glossary of Terms 78
GE Measurement & Control
Fault frequency
The frequency of repeating forces caused by faulty machine components. Usually, the vibration spectrum shows spectral peaks at the fault frequencies and their harmonics. Some examples of fault frequencies are blade pass frequencies, rotor bar pass frequencies, ball pass frequencies, gear mesh frequencies, and the operating speed of the machine.
FFT
See Fast Fourier transform.
FFT analyzer
A spectrum analyzer that uses the FFT algorithm to calculate spectra from waveforms. Most spectrum analyzers are FFT analyzers.
File
A collection of data in a computer.
Filter
A device that allows certain frequency components of a signal to pass through, but blocks other frequency components. See also Band pass filter, High pass filter, and Low pass filter.
Firmware
The operating system of an electronic instrument e.g. that of the vb instrument. The firmware of the vb instrument can be upgraded with a newer version by means of PROFLASHING.
First harmonic
See Fundamental frequency.
First natural frequency
See Fundamental natural frequency.
Flat top window
The window that gives the best amplitude accuracy at spectral peaks, at the expense of more signal leakage. The flat top window does not

Glossary of Terms 79
GE Measurement & Control
separate closely spaced spectral peaks as well as the Hanning window. See also Windowing.
Fluid-film bearing
See Journal bearing.
Fmax
The maximum frequency displayed on a vibration spectrum i.e. the frequency range over which amplitudes are displayed. Increasing the Fmax (while keeping other parameters the same) reduces the measurement duration required, but also reduces the resolution of the spectrum.
Folder
An Ascent software file that contains the data transferred to it from the vb instrument.
Force
The cause of acceleration or mechanical stress. The higher the force applied to an object, the higher the acceleration of the object, or the higher the stress in the object.
Forced response
Response of a system to an excitation force. See also Free response.
Forced vibration
The vibration of an object due to an excitation force acting on the object. Most kinds of machine vibration are due to periodic excitation forces. Forced vibration due to a periodic excitation force typically occurs at the frequency of the excitation force, but can also occur at other frequencies, especially at integral multiples of the frequency of the excitation force. See also Free vibration.
Forcing frequency
The frequency of an excitation force. Several forcing frequencies may be simultaneously present in a vibrating system.

Glossary of Terms 80
GE Measurement & Control
Forcing function
See Excitation force.
Fourier transform
A mathematical operation that transforms a time domain function into an equivalent frequency domain function. The fast Fourier transform, a computational version of the Fourier transform, is used to calculate discrete frequency domain spectra from discrete time domain waveforms. See also Discrete Fourier transform.
Free response
Response of a system that is left to vibrate by itself without the influence of an excitation force. See also Forced response.
Free run
The measurement mode of an instrument where measurements are taken continually until manually stopped by the user.
Free vibration
The natural vibration of an object i.e. vibration without the influence of an excitation force. The free vibration of an object can be initiated by exciting the object with a force and then leaving it to vibrate freely by itself. In practice, a freely vibrating object will eventually stop due to damping. See also Forced vibration, Natural frequency, and Natural mode shape.
Frequency
The number of periodic cycles or oscillations completed per unit time. Frequency is the reciprocal of period, and is usually expressed in Hz (which is equivalent to cps or cycles per second), cpm (cycles per minute), rad/s (radians per second), or derivatives of these units. See also Angular frequency.
Frequency band
A portion of the frequency range of a spectrum.

Glossary of Terms 81
GE Measurement & Control
Frequency domain
That which has a frequency axis as its x axis, or a set of frequency values to which are mapped a set of other values e.g. amplitude. A spectrum is a frequency domain chart i.e. a spectrum has a frequency axis as its x axis (and an amplitude axis as its y axis).
Frequency modulation
The fluctuation in the frequency of a signal due to the influence of another signal, often of lower frequency. In rotating machinery, gear mesh signals are often frequency-modulated by the lower frequency signals of rotating shafts. The spectrum corresponding to a sinusoid frequency-modulated by another is characterized by a peak located at the frequency of the sinusoid, and many sidebands located symmetrically on either side of the peak, with the spacing between the sidebands equal to the frequency of the modulating sinusoid. The term 'frequency modulation' is often abbreviated as 'FM'.
Frequency range
See Fmax.
Frequency response
The vibration amplitude and phase of a system at various vibration frequencies in response to a particular force. The frequency response of a system can be plotted on a Bode plot or on a Nyquist plot. The response amplitude is usually normalized through division by the amplitude of the input force, and expressed as a dimensionless quantity.
FTF
See Fundamental train frequency.
Fundamental frequency
The rotational speed of the shaft or rotor, known also as the '1X' or 'first harmonic'. A machine usually vibrates at more than one frequency, but the dominant frequency is often the fundamental frequency, or a multiple of it. See also Harmonic (n.).

Glossary of Terms 82
GE Measurement & Control
Fundamental natural frequency
The first or lowest natural frequency of a system. When a system vibrates freely, it vibrates at all its natural frequencies, but the first natural frequency will be the dominant vibration frequency.
Fundamental train frequency
The frequency of rotation of the cage of a rolling element bearing. The term 'fundamental train frequency' is often abbreviated as 'FTF'. A spectral peak at the FTF is rare as the inertia of the cage is relatively small. The FTF usually modulates other bearing tones so that sidebands appear at those bearing tones. If a spectral peak appears at the FTF, damage to one of the rolling elements should be suspected.
G
g
The acceleration due to gravity i.e. the acceleration of an object towards the center of the earth when the object is allowed to fall freely in vacuum at sea level. One g is taken to be 9.80665 m/s2 or 32.1740 ft/s2. The acceleration of a vibrating body is sometimes measured in terms of gs.
Gear mesh frequency
The rate at which gear teeth contact. This is equal to the number of teeth on the gear multiplied by the rotation speed of the gear. A machine with gears will potentially vibrate at the gear mesh frequency.
Ghost frequency
A gearbox vibration frequency which does not relate to the geometry of the gearbox. 'Ghost' frequencies are caused by irregularities in gears and usually disappear as the gears wear.
H
Hamming Window
A mathematical function named after its inventor and defined as follows:
Hamming window = 0.54 - 0.46 cos for 0 ≤ ≤ 2
Glossary of Terms 83
GE Measurement & Control
The Hamming window is used to reduce signal leakage but because it is not as effective as some other windows, it is rarely used. See also Windowing.
Hanning Window
A mathematical function named after its inventor and defined as follows:
Hanning window = ½ (1 - cos ) for 0 ≤ ≤ 2
When multiplied with a data block, the Hanning window suppresses amplitude values at the beginning and end of the data block while preserving those in the middle. Multiplying a data block by the Hanning window makes the data block appear like a complete wave, thereby reducing signal leakage associated with limitations of the FFT algorithm. See also Windowing.
Harmonic (adj.)
Sinusoidal. See also Harmonic function and Harmonic motion.
Harmonic (n.)
A spectral peak at a frequency that is a whole number multiple of the fundamental frequency or of the frequency of any excitation force present. A harmonic of a frequency 'n' times that of the fundamental frequency is called 'nX'. The frequency at which a harmonic occurs may or may not be a whole number multiple of the fundamental frequency e.g. the frequencies of harmonics of the ball pass and ball spin frequencies are not whole number multiples of the fundamental frequency. Most kinds of machine vibration are periodic and can be described as the sum of a series of sinusoids. The harmonics in a spectrum correspond to these sinusoids. See also Synchronous peak.
Harmonic excitation
Excitation by a harmonic force.
Harmonic force
An excitation force that is sinusoidal in nature i.e. of the form:
F(t) = Fo sin (t - )
where F(t) = the instantaneous force magnitude

Glossary of Terms 84
GE Measurement & Control
= angular frequency
t = time
= phase angle
Harmonic function
Sinusoidal function. See also Sinusoid.
Harmonic motion
Sinusoidal motion i.e. motion that can be described by a sinusoid. The free vibration of an undamped single degree-of-freedom system is harmonic motion e.g. the swinging of a simple pendulum, in the absence of friction, is harmonic motion. Harmonic motion is often called 'simple harmonic motion' or 'SHM'.
Harmonic response
The response of a system to harmonic excitation. The response is dependent on the number of degrees of freedom and the damping in the system.
Hertz
A frequency unit equivalent to cps (cycles per second) and often abbreviated as 'Hz'. One Hz is equal to one cps or 60 cpm. Heinrich R. Hertz was a German physicist famous for his works on radio waves.
High pass filter
A filter that allows only signal components of frequencies higher than a particular cut-off frequency value to pass through. A high pass filter may be used to remove low frequency noise and to reduce ski slope distortions.
HTF
See Hunting tooth frequency.

Glossary of Terms 85
GE Measurement & Control
Hunting tooth frequency
The frequency at which a particular tooth on a gear makes contact with a particular tooth on a mating gear. The hunting tooth frequency is equal to the gear mesh frequency divided by the least common multiple of the numbers of teeth on the gears. For example, if a 24-toothed gear is driven by a 12-toothed pinion rotating at 1000 RPM, then the hunting tooth frequency is equal to 500 cpm. The term 'hunting tooth frequency' is often abbreviated as 'HTF'. Spectral peaks will appear at the HTF and multiples of the HTF if both the gear and pinion have defective teeth.
Hysteretic damping
The dissipation of vibration energy by materials that convert energy to heat when deformed. Hysteretic behavior is exhibited by most materials but is most prevalent in viscoelastic materials such as rubbers and plastics. A car tire that feels hot following a long journey is in part due to hysteretic damping. The quantity of energy dissipated is dependent on the volume of the material undergoing deformation, the amount of deformation, the hardness of the material, and the ability of the material to dissipate energy. See also Coulomb damping and Viscous damping.
Hz
See Hertz.
I
ICP® accelerometer
A piezoelectric accelerometer with a built-in charge amplifier (an integrated circuit) which performs signal conditioning. When supplied with a constant current of typically 2 mA to 6 mA, the voltage across the accelerometer varies with acceleration with a sensitivity of typically 100 mV/g. ICP® stands for 'integrated circuit piezoelectric' and is a registered trademark of PCB Piezotronics, Inc. See also Piezoelectric transducer.
Imbalance
The condition where the axis of rotation and mass centerline of a rotating part do not coincide. This condition causes a centripetal force to act on the bearings on every cycle of rotation. With the presence of such a 'repeating force', vibration occurs. Imbalance is one of the most

Glossary of Terms 86
GE Measurement & Control
common causes of vibration in machines. See also Couple imbalance, Dynamic imbalance, and Static imbalance.
Impact test
See Bump test.
Imperial units
A system of measurement units based on measurement units used in England in the past. Imperial units are sometimes called English units. Common imperial units include 'foot', 'inch', 'pound', and 'ounce'. Unlike metric units, imperial units are not decimally related, and are no longer commonly used in most parts of the world except in North America. See also Metric units and S.I.
Inertia
Resistance to motion change. Mass is a measure of inertia. The larger the inertia of an object, the more force it takes to move or stop the object.
In-phase signals
See Phase.
Instantaneous
That which pertains to an infinitesimal moment e.g. the instantaneous velocity of a vibrating object is the velocity of the object at a particular instant in time.
Integration
A mathematical operation that yields the area under a chart. For example, velocity is derived from acceleration by calculating the area under the acceleration waveform. Integration is the inverse operation of differentiation.
Integrator
A piece of electronic hardware that integrates an analog signal over time. An integrator is often used to integrate accelerometer signals over time to produce velocity signals.
Glossary of Terms 87
GE Measurement & Control
Interpolation
The mathematical process of estimating or inserting values between known or measured values. Various interpolation methods exist, the simplest being linear interpolation. For example, if a discrete spectrum contains amplitude information at 1000 Hz and 1002 Hz but not at 1001 Hz, then linear interpolation can be used to estimate the amplitude at 1001 Hz by taking the average of the amplitudes at 1000 Hz and 1002 Hz.
Isolation
A method of reducing machine vibration by means of placing a flexible member between the machine and its supporting structure. The flexible member, known as the 'isolator', is made of materials such as rubber, cork, felt, or metallic springs. The isolator reduces the magnitude of the force transmitted from the machine to its supporting structure, and from the supporting structure to the machine.
J
Jerk
The rate of change of acceleration. A rapid change in acceleration is apparent as 'jerking'. Jerk can be derived by differentiating the acceleration signal with respect to time.
Journal
The part of a shaft that spins within a bearing. The load is imparted to the bearing by the journal.
Journal bearing
A bearing without rolling elements but which depends on a fluid film to enable the smooth spinning of the journal. See also Oil whirl and Oil whip.
K
k (pref.)
1000 times. The prefix 'k' stands for 'kilo'. 1 kHz (kiloHertz) is equivalent to 1000 Hz, 1 kg (kilogram) to 1000 grams, 1 kcpm (kilocycles per minute) to 1000 cpm.
Glossary of Terms 88
GE Measurement & Control
k (w.r.t. springs)
See Spring constant.
kcpm
A frequency unit equivalent to 1000 times the frequency unit, cpm i.e. 1 kcpm (kilocycles per minute) is equal to 1000 cpm (cycles per minute).
kgf
A measurement unit for force. 'kgf' is short for 'kilogram force'. 1 kgf is equivalent to the weight of a 1 kg mass.
Kinetic energy
The energy associated with motion. The vibratory motion of an object involves a continual interchange of kinetic energy and potential energy. When the object is moving, it possesses kinetic energy, and when it attains maximum displacement (during which time it is momentarily stationary), it possesses potential energy but zero kinetic energy.
L
lbf
A measurement unit for force. 'lbf' is short for 'pound force'. 1 lbf is equivalent to the weight of a one pound (1lb) mass.
Leakage
See Signal leakage.
Linear averaging
A commonly used method of averaging spectra or time-synchronized waveforms. The amplitude at each frequency or time value of the 'average' spectrum or waveform is the arithmetic mean of amplitudes of the individual spectra or waveforms at that frequency or time value i.e. for an average spectrum:
where i = spectral line number
j = spectrum number
Glossary of Terms 89
GE Measurement & Control
n = number of spectra used for averaging
Linear motion
Motion along an axis i.e. motion along a straight line.
Linear relationship
A relationship governed by direct proportionality. See also Proportional, directly.
Linear scale
A scale with uniformly spaced marks, the distance between adjacent marks representing a fixed quantity. See also Logarithmic scale.
Linear system
A system which, when excited by a composite excitation force, outputs a response that is the sum of its responses to the individual components of the excitation force i.e. if the response to excitation force F1 is x1 and to F2 is x2, then the response to the composite excitation force F1 + F2 is x1 + x2 if the system is linear. At small vibration amplitudes, most mechanical systems are linear systems.
Lines
See Spectral lines.
Load zone (w.r.t. bearings)
The part of a bearing that is subject to the greatest load e.g. load associated with the weight of the rotor it is supporting.

Glossary of Terms 90
GE Measurement & Control
Logarithm function, base-10
A mathematical function that yields the base-10 exponent of a number e.g. the base-10 logarithm of the number 100 is equal to 2 (since 100 = 102). The logarithm function is a useful tool for working with numbers that vary greatly in magnitude e.g. the base-10 logarithm of a thousand is 3 and of a million is 6 (which is not much bigger than 3 and therefore easily displayed together on a chart). The symbol for 'base-10 logarithm' is 'log10'.
Logarithmic scale
A scale with marks representing the logarithm of a value rather than the actual value. Logarithmic scales are useful for displaying values of greatly varying magnitudes. See also Linear scale.
Looseness
The condition where there are undesired gaps between mating parts. Looseness is usually caused by excessive bearing clearances, loose mounting bolts, mismatched parts, and cracked structures. Depending on the type of looseness, the vibration spectrum can appear different. Bearing looseness is the most common form of looseness and produces a vibration spectrum that contains many harmonics.
Low pass filter
A filter that allows only signal components of frequencies lower than a particular cut-off frequency value to pass through. See also Aliasing.
M
Machine (w.r.t. the vb instrument)
A data group of the vb data structure, for grouping recordings taken of the same physical machine. See also Data structure.
Machine vibration
The reciprocating or back-and-forth movement of a machine or machine component involving a continual interchange of kinetic energy and potential energy. The most common cause of machine vibration is the rotation of imbalanced or misaligned parts. See also Free vibration and Forced vibration.

Glossary of Terms 91
GE Measurement & Control
Magnetostriction
The distortion of magnetic materials in the presence of magnetic fields. Magnetostriction worsens the vibration caused by the reciprocation of motor magnetic poles (which occurs at twice the line frequency).
Main unit (w.r.t. the vb instrument)
The part of the vb instrument which houses the LCD, keypad, RS232 COM port, battery pack and charger circuitry.
Mask
See Alarm envelope.
Measurement parameters
The details about a measurement that must be specified before the measurement is taken e.g. before a spectrum is taken, the Fmax, number of spectral lines to be used, averaging type, windowing type etc need to be specified. The way in which parameters are set can and often does affect measurement results.
Measurement unit
See Unit.
Mechanical looseness
See Looseness.
Mechanical runout
See Runout.
Metric units
A decimal system of measurement units based on S.I. units. For example, the metric units for length, 'kilometer', 'centimeter', 'millimeter', 'micrometer', etc are related by factors of 10, 100, 1000, etc, and are based on the S.I. unit for length 'meter'. See also Imperial units and S.I.
Micrometer
A measurement unit for small distances, known also as 'micron'. 1 micrometer (µm) equals one millionth of a meter i.e. 10-6 meter.

Glossary of Terms 92
GE Measurement & Control
Micron
See Micrometer.
mil
A measurement unit for small distances. 1 mil is equal to 0.001 inch.
Misalignment
The condition where the axes of machine components are not positioned or oriented accurately with respect to one another. Angular misalignment is the situation where the axes of mating parts are tilted with respect to one another, and parallel misalignment is where the axes are parallel but do not coincide. Usually, both kinds of misalignment are involved. Misalignment is one of the most common causes of vibration in machines.
Modal analysis
The process of developing a mathematical model for the vibration of a system so that the mode shapes of the system can be determined for different excitation forces.
Mode of vibration
See Mode shape.
Mode shape
The collection of vibration amplitudes at all points of a system, or the 'shape' of a system, when it is subjected to a particular excitation force. The mode shape of a vibrating system is a mixture of all the natural mode shapes of the system, the dominant mode being that which corresponds to the natural frequency closest to the frequency of vibration.
Modulation
The varying or fluctuation of a signal due to the influence of another signal. The signal that is being modulated is called the 'carrier' and the signal causing the modulation of the carrier is called the 'modulating signal'. See also Amplitude modulation and Frequency modulation.

Glossary of Terms 93
GE Measurement & Control
Module
A hardware unit within the vb instrument that performs most of the calculations and stores most of the data associated with recordings. The module has the accelerometer port attached to it.
Moment
The cause of rotation or bending. The moment about a point on a body is caused by a force being applied on the body at a distance away from the point. The greater the force, or the greater the distance, the greater the moment about the point. If motion of the body is unobstructed, the body will rotate because of the moment, but if the body is restrained, the moment will cause the body to bend. See also Bending moment.
Momentum
The product of mass and velocity. Momentum is a measure of the tendency of a moving object to continue moving.
N
Narrow band analysis
See Narrow band measurement.
Narrow band measurement
The measurement of the vibration spectrum of a system i.e. the measurement of the vibration amplitude at individual frequency values or for small frequency bands. See also Broad band measurement.
Natural frequency
The frequency at which a system will vibrate when it is vibrating freely by itself without the influence of an excitation force. An n degrees-of-freedom system has n natural frequencies. A shaft (which has an infinite number of degrees of freedom) has an infinite number of natural frequencies. See also Fundamental natural frequency and Natural mode shape.
Natural mode shape
The collection of vibration amplitudes at all points of a system, or the 'shape' of a system, when the system is vibrating at a particular natural frequency. Each natural frequency has a corresponding natural mode

Glossary of Terms 94
GE Measurement & Control
shape e.g. a simply-supported shaft vibrating at its first natural frequency will have the shape of a bow, but when vibrated at its second natural frequency will have an 's' shape. The natural mode shape corresponding to the nth natural frequency is called the nth natural mode shape. See also Mode shape and Nodal points.
Natural vibration
See Free vibration.
Navigator
The navigator is a display area in the Ascent software that allows you to navigate through the data in a machine database.
The top half of the navigator (the navigator tree) shows the structure of your machines i.e. their points and axes.
The bottom half of the navigator (the navigator list) lists any items that belong to whichever item is currently selected in the navigator tree e.g. if a point is selected the navigator list will display all the axes around that point.
Nodal points
The points in a mode shape where there is no motion e.g. the second natural mode shape of a simply-supported shaft is an 's' shape that has a nodal point at the center of the shaft and one at each end of the shaft. The nth natural mode shape of a shaft has n+1 nodal points.
Noise
Unwanted signal, often of a random nature, caused by electrical and/or mechanical effects.
Noise floor
The amplitude level below which amplitude peaks cannot be distinguished from noise.
Non-synchronous peak
A spectral peak occurring at a frequency that is not a whole number multiple of the fundamental frequency. See also Harmonic (n.).

Glossary of Terms 95
GE Measurement & Control
Normal mode shape
See Natural mode shape.
Normalization
The dividing of all values by the largest value e.g. amplitude normalization involves dividing all amplitude values by the largest amplitude, so that all amplitude values are expressed as a fraction of the largest amplitude. See also Order normalization.
Nyquist frequency
The maximum frequency that can be sampled correctly i.e. without aliasing occurring. The Nyquist frequency is half the sampling rate. The vb instrument uses a sampling rate 2.56 times the Fmax, thus ensuring that the Nyquist frequency is greater than the Fmax.
Nyquist plot
A complex numbers chart used to show the frequency response of a system. The amplitude and phase of a system vibrating at a particular frequency can be represented by a complex number (i.e. a number consisting of a real part and an imaginary part). By plotting the imaginary part against the real part for a range of frequencies, the Nyquist plot is obtained.
O
Octave
A frequency interval over which the frequency value is doubled. For example, the 2X frequency is one octave above the fundamental frequency. Vibration frequency is seldom expressed in octaves. It is a term used in the fields of music and sound measurement.
Oil whip
An oil whirl condition where the journal orbits around the bearing at one of the resonant frequencies of the shaft. Oil whip causes the shaft to vibrate at large amplitudes.
Oil whirl
A condition in a journal bearing where the oil film whirls and orbits the journal around the bearing at about 40% to 49% of the shaft rotation

Glossary of Terms 96
GE Measurement & Control
speed. Oil whirl is undesirable and is caused by excessive clearance in the journal bearing or insufficient radial loading on the bearing. See also Oil whip.
Operating speed
The shaft speed of the motor or engine in a rotating machine.
Orbit (w.r.t. journal bearings)
The circular path of the journal within the bearing. A large orbit indicates the presence of oil whirl.
Order
The frequency of a spectral peak expressed as a proportion or multiple of the fundamental frequency e.g. a spectral peak at twice the fundamental frequency has an order of 2X.
Order analysis
See Order normalization.
Order normalization
The division of all frequency values on the frequency axis of a spectrum by the fundamental frequency. Spectral peak frequencies are thus expressed as multiples or fractions of the fundamental frequency. This helps the analyst to identify the root cause of vibration.
Order tracking
See Order normalization.
Oscillation
To-and-fro, back-and-forth, or reciprocating motion. Vibration is mechanical oscillation. 'One oscillation' means one cycle of reciprocating motion.
Out-of-phase signals
See Phase.
Overall level
See Root-mean-square.

Glossary of Terms 97
GE Measurement & Control
Overall rms level
See Root-mean-square.
Over-damped system
A system with a quantity of damping that is more than necessary to prevent the system from vibrating. An over-damped system does not vibrate but has a slow response. See also Critical damping and Under-damped system.
Overlap processing
The combining or overlapping of data from adjacent time domain data blocks for FFT calculations. A percentage of data from the most recently collected data block is combined with a portion of data of the preceding data block, and the resultant data block is fed to the FFT algorithm to obtain a spectrum more quickly than if no overlapping is done. 50% overlap processing, as shown below, is ideal in most situations.
P
Parallel misalignment
See Misalignment.
Parameter set (w.r.t. the vb instrument)
A data group of the vb instrument data structure, for grouping recordings taken at a particular location using the same measurement parameter values. See also Data structure.
Parameters
See Measurement parameters.
Glossary of Terms 98
GE Measurement & Control
Peak (w.r.t. a spectrum)
The highest amplitude value in a spectrum.
Peak (w.r.t. a wave)
The highest point in a wave. See also Trough.
Peak amplitude
The maximum amplitude attained by a vibrating object in a given time period e.g. the peak velocity amplitude of a vibrating object during a given time period is the maximum velocity achieved by the object during that time period. The terms 'peak amplitude' and 'zero-to-peak amplitude' (Ø-peak) are synonymous.
Peak hold
A mathematical operation resulting in the 'largest-so-far' amplitude of each line of a spectrum to be always displayed. This is done by comparing each line of the most recent spectrum with the corresponding line in the preceding spectrum and displaying the larger of the two amplitudes. Although sometimes regarded as a form of averaging, 'peak hold' does not involve averaging.
Peak-to-peak amplitude
The difference between the highest positive value and the lowest negative value in a waveform. Displacement amplitudes are usually expressed in terms of the peak-peak amplitude.
Period
The time taken to complete one oscillation or one cycle. Period is usually expressed in s (seconds) or ms (milliseconds). See also Frequency.
Periodic
Having a pattern that is repeated over and over again, each cycle taking a fixed amount of time. See also Period and Repeating force.
Periodic force
See Repeating force.

Glossary of Terms 99
GE Measurement & Control
Periodic motion
Motion of a pattern repeated over and over again, each cycle or oscillation taking a fixed amount of time. Examples of periodic motion are circular motion, simple harmonic motion, and most kinds of steady-state vibration. Periodic motion can be mathematically described by the arithmetic sum of a series of sinusoids. See also Period and Repeating force.
Phase
The time relation of a signal to another signal of the same frequency, or the time relation of a vibrating object to another object vibrating at the same frequency. The vibratory motion of an object is 'in phase' with that of another object if they oscillate at the same frequency in a synchronized manner e.g. the two objects attain maximum positive displacement simultaneously and zero displacement simultaneously. If the motions of the objects are not synchronized e.g. if one object attains maximum displacement when the other attains the minimum, and vice versa, the vibratory motions are said to be 'out of phase'.
Phase angle
A quantity that indicates the phase of a waveform or vibratory motion in relation to another waveform or vibratory motion. Phase angle can be expressed in degrees or radians. For example, a waveform that leads a reference waveform by half a cycle, is ascribed a phase angle of 180°.
Phase difference
The difference between the phase of a vibratory motion and that of another vibratory motion occurring at the same frequency. Phase difference is measured in terms of cycles, degrees, or radians. The phase difference between two objects vibrating in phase is zero cycles or zero degrees. If an object attains maximum positive displacement when another object (vibrating at the same frequency) attains minimum negative displacement, the phase difference between the two vibratory motions is 180°. A phase difference of 360° i.e. a phase difference of one complete cycle, is equivalent to no phase difference or zero degrees phase difference.

Glossary of Terms 100
GE Measurement & Control
Phase shift
The number of cycles, degrees, or radians a waveform or vibratory motion leads or lags another waveform or vibratory motion of the same frequency. A sine waveform phase-shifted forward a quarter cycle (90°) is equivalent to a cosine waveform.
Pi
A constant value roughly equal to 3.14 and often denoted by the symbol, π. The circumference-to-radius ratio of a circle is equal to 2π. See also Radian.
Picket fence effect
A lack of accurate representation of peaks and troughs by a discrete spectrum. Since amplitude data is not available for frequencies between spectral lines, peaks generally appear too low and troughs, too high. This effect may be reduced by increasing the sampling duration (thereby increasing the number of spectral lines) and/or by interpolating between spectral values.
Piezoelectric transducer
A transducer in which a crystal converts mechanical force to electricity. Most accelerometers are piezoelectric transducers and often have an in-built mass – called the seismic mass – which exerts a force on the piezoelectric crystal when vibrated. Due to the force exerted on it, the piezoelectric crystal, typically a quartz crystal, generates an electrical signal that is proportional to the force. See also ICP® accelerometer.
Pink noise
Noise of which the level decreases with increasing frequency at the rate 3 dB per octave. It is a term used in the field of sound measurement.
Point (w.r.t. the vb instrument)
A data group of the vb instrument data structure, for grouping recordings taken of the same physical location on a particular machine. See also Data structure.
Potential energy
The energy associated with the state of an object e.g. a pendulum at its highest point possesses gravitational potential energy (that will cause it

Glossary of Terms 101
GE Measurement & Control
to continue swinging), and a compressed spring possesses strain potential energy (that will cause it to return to its equilibrium state).
Preload
Static force applied to a bearing to ensure that the rolling elements roll (and not slide) within the bearing and that the shaft makes proper contact with the bearing. Too little or too much preload can cause bearing damage.
Principal inertia axis (w.r.t. rotors)
The mass centerline of a rotor, constructed by joining the centers of mass at every cross-section of the rotor. To avoid imbalance, the axis of rotation must coincide with the principal inertia axis.
PROFLASH
A way by which the firmware in the vb instrument can be upgraded to later versions without hardware changes.
Proportional
See Proportional, directly.
Proportional, directly
Increases or decreases along with another value, in a linear way e.g. the acceleration of an object (with a constant mass) is directly proportional to the force causing it to accelerate i.e. if the force increases by 10%, then the acceleration will also increase by 10%.
Proportional, inversely
Increases or decreases linearly in an opposite way in relation to another value e.g. for a given applied force, the acceleration of an object is inversely proportional to the mass of the object i.e. if the mass increases by 10%, then the acceleration will decrease by 10%.
Proportional, linearly
See Proportional, directly.

Glossary of Terms 102
GE Measurement & Control
Proximity probe
A transducer that measures displacement e.g. the displacement of a shaft. Proximity probes are normally used to measure low frequency signals only.
Q
Quantization (w.r.t. signals)
The process of assigning values from a discrete and finite range to represent the signal values of an analog signal. Quantization is inherent in the sampling and digitization of analog signals using an A/D converter. See also Digital.
Quasi-periodic waveform
A waveform with a period that varies over time but which has sufficient periodicity to have a corresponding spectrum that shows clear peaks. Spectral peaks corresponding to quasi-periodic motion occur at frequencies that are not whole number multiples of the fundamental frequency. Loose or worn rotating belts often cause quasi-periodic vibration.
R
Radial direction
A direction perpendicular to the centerline of a shaft or rotor.
Radial vibration
Vibration in a direction perpendicular to the centerline of a shaft or rotor. Radial vibration is seen in imbalanced rotors. See also Axial vibration.
Radian
A measurement unit for angle. 2π radians (2π being the circumference-to-radius ratio of a circle) is equivalent to a full circle of rotation, or 360°. Thus one radian is roughly equal to 57°. Mathematical calculations are often more conveniently done in radians than in degrees. See also Angular frequency.

Glossary of Terms 103
GE Measurement & Control
Random
Non-deterministic or not having a specific pattern. Random signals can only be described in terms of statistical quantities. Vibration caused by turbulent fluid flow is usually random in nature. The spectrum of random vibration shows no clear peaks but shows energy spread over a range of frequencies.
Recording (w.r.t. the vb instrument)
The data collected for a particular location during a single recording session. See also Data structure.
Rectangular window
A mathematical function with a constant value of one throughout. All values of a data block multiplied by a rectangular window are multiplied by one i.e. the values are preserved. This is equivalent to not using a window. See also Signal leakage and Windowing.
Reference spectrum
A spectrum that is the basis for an alarm envelope. A reference spectrum should be 'ideal' or 'normal' for the measurement point and axis for which it is used as a reference. See also Alarm envelope.
Repeating force
A periodic force i.e. a force with a pattern repeated over and over again, each cycle taking a fixed amount of time. Machine vibration is most often due to repeating forces originating from the rotation of imbalanced or misaligned parts. A repeating force may or may not be harmonic, and can be mathematically described by the arithmetic sum of a series of sinusoids. See also Excitation force.
Resolution (w.r.t. waveforms and spectra)
The finest frequency or time 'step' possible on the horizontal axis of a discrete spectrum or waveform. The resolution of a spectrum improves with the number of spectral lines used i.e. the more spectral lines used, the better the spectrum represents the true spectrum. However, the more spectral lines used, the more instrument memory is used up to store the spectrum, and the longer the data collection time. Likewise, for waveforms the larger the number of samples used (for a given

Glossary of Terms 104
GE Measurement & Control
measurement duration) the better the resolution of the waveform is, but the more instrument memory space is used to store the waveform.
Resolution bias error
See Picket fence effect.
Resonance
The situation where the vibration amplitude increases rapidly due to the natural frequency of the system being excited by a periodic force that has a frequency similar to the natural frequency. A machine should never be operated continuously at its natural frequency. If it is necessary for a machine to operate at a frequency higher than its first natural frequency, the speed of the machine should be increased past the natural frequency as quickly as possible.
Resonant frequency
The natural frequency of a system when there is no damping in the system. An n degree-of-freedom system has n resonant frequencies. See also Damped natural frequency.
Response spectrum
See Frequency response.
Rest position
See Equilibrium position.
Rigid
Infinitely stiff and does not deform. There are no truly 'rigid' objects in the real world. The concept of 'rigid' objects is invented by engineers for the purpose of simplifying mathematical modeling. In practice, a rotor is considered 'rigid' if it does not bend significantly at its rotating speed.
Rigid body motion
Movement of a body as a unit with no relative movement or deformation within the body.
rms
See Root-mean-square.

Glossary of Terms 105
GE Measurement & Control
Rolling element bearing
A bearing with rolling elements to enable smooth shaft rotation. The shape of a rolling element is usually cylindrical, conical, or spherical. See also Angular contact bearing and Thrust bearing.
Root-mean-square
An amplitude expression defined as the square root of the arithmetic mean of a set of squared instantaneous signal values. The term 'root-mean-square' is often abbreviated as 'rms'. For a discrete waveform with n instantaneous values, the overall rms amplitude is given by:
where xi = the ith instantaneous signal value in the set of n instantaneous signal values.
For a discrete spectrum with n spectral lines, the overall rms amplitude (with no windowing) is given by:
where xi = the amplitude of the ith spectral line in the set of n spectral lines.
For true sinusoidal waves (only), the rms amplitude is times (i.e. approximately 0.7 times) the peak amplitude.
Rotary motion
Motion around an axis i.e. circular motion.
Rotor
A machine part that rotates. See also Rigid.
Rotor bar pass frequency
The speed at which the rotor bars of an AC induction motor rotate past a fixed reference point. This is equal to the operating speed of the motor multiplied by the number of rotor bars. The vibration spectrum of an induction motor usually shows a peak at the rotor bar pass frequency.

Glossary of Terms 106
GE Measurement & Control
Running speed
See Operating speed.
Runout
The error that is indicated by a displacement probe when it is used to measure the position of the centerline of a shaft. Runout can be caused by the axis of rotation not coinciding with the shaft centerline, or a lack of roundness. Runout is sometimes called 'TIR' or 'total indicator reading'. The larger the runout, the larger the excitation force generated when the shaft is rotated.
S
S.I.
Abbreviation of 'Systeme Internationale', the international system of measurement units. The primary S.I. units, from which all other units can be derived, are 'meter', 'kilogram', 'second', 'Kelvin', 'Ampere', 'mol', and 'candela'. S.I. units are widely used throughout the world except in North America. See also Imperial units and Metric units.
Sampling
The extracting of discrete, instantaneous data, usually at regular intervals, from a continuous signal e.g. from the output signal of an accelerometer. In a sampled time domain signal, data is not available for all time values, but only for time values corresponding to when data was sampled. See also Aliasing.
Sampling duration
The total time period data is sampled from a continuous signal. Increasing the number of spectral lines or the number of averages for a spectrum increases the sampling duration. On the contrary, increasing the Fmax or the overlap percentage reduces the sampling duration.
Sampling frequency
See Sampling rate.

Glossary of Terms 107
GE Measurement & Control
Sampling rate
The rate at which data is sampled from a continuous signal e.g. from the output signal of an accelerometer. See also Aliasing.
Scalar
A quantity that denotes magnitude but not direction e.g. speed is a scalar quantity: it is the magnitude of velocity. See also Vector.
Seismic
Caused by the movement of a mass. The output of a seismic transducer are signals originating from the movement of a mass within the transducer.
Sensitivity (w.r.t. accelerometers)
The change in the magnitude of the output signal per unit change in the acceleration sensed. The sensitivity of an accelerometer is usually expressed in mV/g (where 'mV' stands for 'milliVolts', and 'g' is 'acceleration due to gravity').
Settling time (w.r.t. the vb instrument)
The period of time that must be allowed for the electrical hardware in the vb instrument and accelerometer to stabilize before accurate measurements can be taken. The settling time required for the accelerometer is a value specified by the manufacturer of the accelerometer and typically ranges from 1 second to 3 seconds. The settling time required for the vb instrument is dependent on the frequency range (Fmax) or duration of the measurement, and ranges from 4 to 13 seconds. The lower the Fmax or the longer the duration of the measurement, the longer the settling time required for the vb instrument. The total settling time i.e. the sum of the settling time required for the accelerometer and that for the vb instrument is automatically calculated by the instrument.
SHM
Abbreviation for simple harmonic motion. See Harmonic motion.
Shock
A suddenly applied force that results in the transient response of a system. The force experienced by a system struck with a hammer is an

Glossary of Terms 108
GE Measurement & Control
example of shock. The severity of the shock can be measured in terms of the maximum value of the response of the system.
Sidebands
Minor peaks, caused by amplitude or frequency modulation, located symmetrically on either side of spectral peaks. The distance between adjacent sidebands is equal to the frequency of the modulating signal. Sidebands are often seen in the spectra of faulty gearboxes and electrical motors with faulty rotor bars.
Signal
An electrical voltage or current that is proportional to the magnitude of a physical quantity. The output signal of an accelerometer is a continuous voltage that is proportional to the acceleration of the point being measured. A signal may be analog or digital, and continuous or discrete.
Signal conditioning
The modification of a signal by devices such as attenuators, filters, and amplifiers, before the signal is processed or displayed. The main purposes of signal conditioning are to alter signal amplitude to a suitable level for sampling, and to remove noise and other errors from the signal.
Signal leakage
A spectral distortion where the amplitude of a spectral line affects or 'leaks' to adjacent spectral lines. If FFT calculations are performed on a data block not consisting of an integral number of waves, signal leakage will be evident in the resulting spectrum. Signal leakage can be minimized by multiplying data blocks with a suitable 'window' prior to performing FFT calculations on the data blocks. See also Windowing.
Signature
The vibration spectrum of a system, from which much can be inferred regarding the vibration behavior of the system.
Simple harmonic motion
See Harmonic motion.
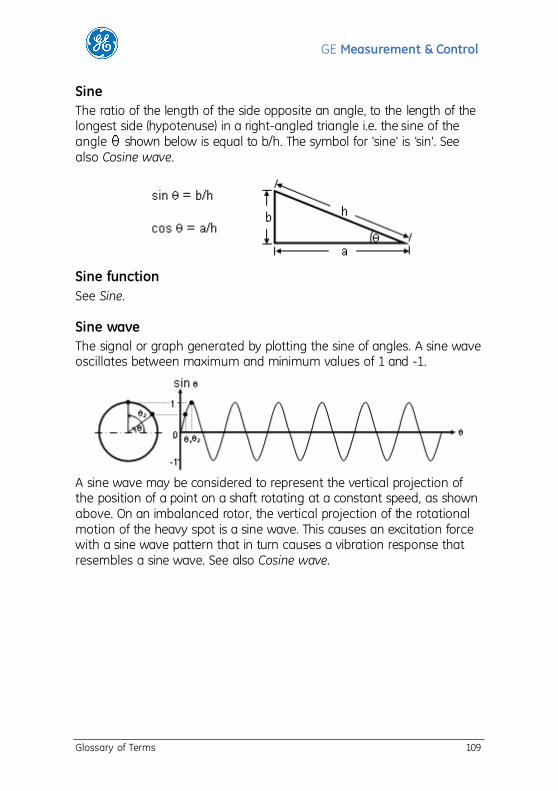
Glossary of Terms 109
GE Measurement & Control
Sine
The ratio of the length of the side opposite an angle, to the length of the longest side (hypotenuse) in a right-angled triangle i.e. the sine of the angle shown below is equal to b/h. The symbol for 'sine' is 'sin'. See also Cosine wave.
Sine function
See Sine.
Sine wave
The signal or graph generated by plotting the sine of angles. A sine wave oscillates between maximum and minimum values of 1 and -1.
A sine wave may be considered to represent the vertical projection of the position of a point on a shaft rotating at a constant speed, as shown above. On an imbalanced rotor, the vertical projection of the rotational motion of the heavy spot is a sine wave. This causes an excitation force with a sine wave pattern that in turn causes a vibration response that resembles a sine wave. See also Cosine wave.

Glossary of Terms 110
GE Measurement & Control
Sine waveform
A time domain signal described by the function:
f(t) = sin ( t - )
where f(t) = the instantaneous value at time t
= angular frequency
t = time
= phase angle
See also Sine.
Sinusoid
A mathematical function of the form:
(t) = A sin ( t - )
where x(t) = the instantaneous value of x at time t
A = maximum x value (zero-to-peak amplitude of x)
= angular frequency
t = time
= phase angle
See also Sine.
Sinusoidal
That can be described by a sinusoid. The free vibration of an undamped single degree-of-freedom system is sinusoidal e.g. the undamped free vibration of a mass suspended on a spring is sinusoidal. In practice, true sinusoidal behavior is not observed - the amplitude will decay exponentially due to damping present in the system.
Ski slope
An amplitude distortion that resembles the shape of a 'ski slope' at the low frequency end of a spectrum. The distortion is due to the integration of a signal containing low frequency noise. Because integrating sinusoids (of which periodic signals comprise) causes their amplitudes to be multiplied by the inverse of their frequencies, low frequency noise is accentuated. Hence the increased amplitude values at the low
Glossary of Terms 111
GE Measurement & Control
frequency end of the spectrum. The distortion will become worse if the settling time allowed for the accelerometer is not long enough.
Slip
The difference between the rotation speed of an induction motor and the synchronous speed e.g. if the rotation speed is 2900 RPM and the synchronous speed is 3000 RPM, then the slip is 100 RPM and the slip percentage is 3.3% (100 RPM/3000 RPM). The greater the load on the motor, the higher the slip will be.
Slow roll speed
Low operating speed that makes excitation forces negligible. The amplitude of excitation forces associated with imbalance is proportional to the square of the operating speed. At low operating speeds the amplitude of the excitation force becomes very small.
Soft foot
A condition where the feet of a machine do not lie on a level plane, and structural distortion occurs when the hold-down bolts are tightened. Soft foot can also be caused by some bolts being fastened more tightly or more loosely than other bolts. The resulting structural distortion causes misalignment in machine parts, thereby causing vibration.
Spectra
Plural of Spectrum.
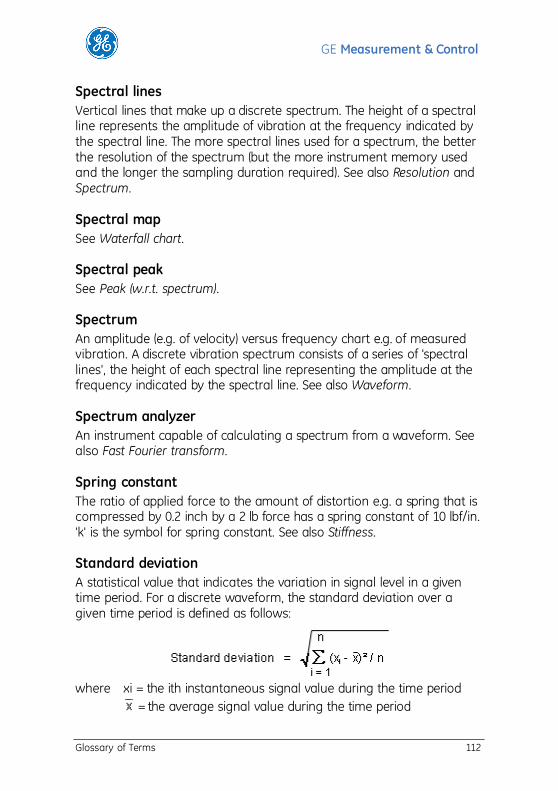
Glossary of Terms 112
GE Measurement & Control
Spectral lines
Vertical lines that make up a discrete spectrum. The height of a spectral line represents the amplitude of vibration at the frequency indicated by the spectral line. The more spectral lines used for a spectrum, the better the resolution of the spectrum (but the more instrument memory used and the longer the sampling duration required). See also Resolution and Spectrum.
Spectral map
See Waterfall chart.
Spectral peak
See Peak (w.r.t. spectrum).
Spectrum
An amplitude (e.g. of velocity) versus frequency chart e.g. of measured vibration. A discrete vibration spectrum consists of a series of 'spectral lines', the height of each spectral line representing the amplitude at the frequency indicated by the spectral line. See also Waveform.
Spectrum analyzer
An instrument capable of calculating a spectrum from a waveform. See also Fast Fourier transform.
Spring constant
The ratio of applied force to the amount of distortion e.g. a spring that is compressed by 0.2 inch by a 2 lb force has a spring constant of 10 lbf/in. 'k' is the symbol for spring constant. See also Stiffness.
Standard deviation
A statistical value that indicates the variation in signal level in a given time period. For a discrete waveform, the standard deviation over a given time period is defined as follows:
where xi = the ith instantaneous signal value during the time period
= the average signal value during the time period

Glossary of Terms 113
GE Measurement & Control
n = total number of instantaneous signal values for the time period
Because the average vibration signal value is zero or close to zero, the standard deviation may be written as:
Thus the standard deviation is simply equal to the rms amplitude. The larger the standard deviation, the larger the vibration amplitude.
Static imbalance
An imbalance condition where the mass centerline of a rotating part is parallel to the axis of rotation but offset from it. This causes 'in-phase' repeating forces to act on the support bearings i.e. the force acting on one bearing is always pointing in the same direction as that acting on the other bearing. As a result, all points on the rotating part vibrate in a synchronized manner. Static imbalance can be corrected by adding one correction weight to the appropriate location on the rotating part. See also Couple imbalance and Dynamic imbalance.
Steady-state response
See Steady-state vibration.
Steady-state vibration
The vibration behavior of a system after it has stabilized. Most kinds of machine vibration settle into a steady state. See also Transient response.
Stiffness
Resistance against deformation. The stiffness of a spring is quantified by the spring constant, k. The stiffness of a component is dependent on the material it is made of and its physical dimensions.
Strain
The ratio of elongation to original length e.g. a shaft, of length L, that is being elongated lengthwise by an amount x, is said to experience an axial strain of x/L.

Glossary of Terms 114
GE Measurement & Control
Strain gage
A transducer that measures strain. A strain gage is usually glued on the surface being measured and outputs a voltage proportional to the strain.
Stress
The force experienced per unit area e.g. a shaft, of cross-sectional area A, that is being stretched lengthwise by a force, F, is said to experience an axial stress of F/A.
Subharmonic
A spectral peak that occurs at a frequency that is a whole number fraction of the fundamental frequency e.g. at 1/2, 1/3, 1/4, 1/5, or 1/6 times the fundamental frequency. The spectrum of shaft rubbing the surface of a journal bearing exhibits a subharmonic at 1/2 the fundamental frequency.
Subsynchronous peak
A spectral peak that occurs at any frequency below the fundamental frequency. A subsynchronous peak may or may not be a subharmonic. The spectrum of a journal bearing subjected to an oil whirl condition usually has a subsynchronous peak at roughly 0.45 times the fundamental frequency.
Synchronous averaging
See Time-synchronous averaging.
Synchronous peak
A spectral peak at a frequency that is an integer multiple of the fundamental frequency. The gear mesh frequency, blade pass frequency, vane pass frequency, rotor bar pass frequency, and their multiples, are synchronous with the fundamental frequency and have synchronous peaks corresponding to them in the spectrum. In contrast, spectral peaks corresponding to ball pass and ball spin frequencies are not synchronous peaks. See also Harmonic (n.).
Synchronous speed
The speed at which the magnetic field in the stator of an AC motor is rotated. The synchronous speed is usually the same as the AC line

Glossary of Terms 115
GE Measurement & Control
frequency i.e. if the line frequency is 50 Hz, then the synchronous speed is 50 cycles per second or 3000 RPM.
System (w.r.t. vibration)
A mechanism or machine which has a means of storing potential and kinetic energy, and a means by which energy is dissipated. In most vibratory systems, potential energy is stored in elastic members, kinetic energy is stored in moving masses and energy is dissipated through friction or other damping devices.
T
Tagging (w.r.t. the vb instrument)
The identifying of data to be collected or transferred to a computer. Tagging is a means of creating a 'plan' for data collection, and a means of mass-transferring data automatically to a computer.
Tangential direction
A direction perpendicular to the axial and radial directions. The tangential direction of a shaft is a direction perpendicular to the centerline of the shaft and at a tangent to the surface of the shaft.
Thrust
See Axial force.
Thrust bearing
A bearing that supports loads that act in the axial direction of the shaft. Thrust bearings usually have rolling elements, and are used to support vertical rotors. See also Angular contact bearing.
Time averaging
See Time-synchronous averaging.
Time domain
That which has a time axis as its x axis, or a set of time values to which are mapped a set of other values e.g. amplitude. A waveform is a time domain chart i.e. a waveform has a time axis as its x axis (and an amplitude axis as its y axis).

Glossary of Terms 116
GE Measurement & Control
Time-synchronous averaging
The averaging of waveforms to produce a relatively noise-free average waveform. To obtain an accurate average spectrum, the phases of the waveforms used in the averaging process must be the same. This is achieved by taking the waveforms by means of a common reference trigger e.g. by means of a tachometer sensing the key way on a shaft. Since noise values are equally likely to be positive or negative, they cancel one another when they are averaged. The average spectrum is thus relatively free of noise. The higher the number of waveforms used in the averaging process, the more accurately the average waveform represents true vibration behavior.
TIR
See Runout.
Tolerance
The maximum allowable variation from a specified quantity e.g. if a dimension is specified as '20.0 ± 0.2 inches', then the tolerance for the dimension is '± 0.2 inch', and the maximum and minimum allowable dimensions are 20.2 inches and 19.8 inches.
Tone
A sharp distinct peak at a specific frequency. Bearing tones are spectral peaks that correspond to the motion of moving elements in the bearing.
Torque
The rotational force that causes rotational acceleration or stress. The higher the torque applied to an object, the higher the rotational acceleration of the object, or the higher the stress in the object.
Torsion
Twisting of a body about an axis. The quantity of torsion is measured by the angle of twist
Torsional vibration
Oscillation of a body about an axis. The displacement of the body is measured by an angular coordinate. An example of torsional vibration is the oscillation of a heavy rotor about its axis when the rotor is suddenly stopped.

Glossary of Terms 117
GE Measurement & Control
Total indicator reading
See Runout.
Transducer
A device that translates the magnitude of one quantity into another quantity e.g. an accelerometer is a transducer that translates acceleration into voltage.
Transient
See Transient response.

Glossary of Terms 118
GE Measurement & Control
Transient response
The temporary behavior of a system immediately after a change in the excitation to the system e.g. the transient response of a machine can be observed while it is being powered up, or just after it has been struck by a hammer. When analyzing a transient response, windowing and averaging are not normally used. See also Steady-state vibration.
Trend chart
A cross-sectional view of a waterfall chart at a particular frequency or time value. If the recordings plotted in the waterfall chart are arranged chronologically and pertain to the same physical point, the cross-sectional view depicts the 'trend' of vibration pattern at that point for the particular frequency or time value. See also Trending and Waterfall chart.
Trending
The analyzing, usually by way of waterfall and trend charts, of vibration data taken on a particular physical point and collected regularly over a period of time so that changes in spectrum or time-synchronized waveform characteristics can be detected, physical explanations assigned, and corrective actions taken accordingly. See also Trend chart and Waterfall chart.
Trial weight
A weight that is used during the process of balancing a rotor. By noting the change in vibration amplitude and phase after a trial weight (of known mass) is attached to the rotor, the size and location of the correction weight required to balance the rotor can be determined.
Triaxial accelerometer
An accelerometer that is capable of measuring vibration in three orthogonal directions simultaneously at a particular point.
Trigger
A signal that is used as a timing reference or to initiate a process e.g. a tachometer signal can be used to derive phase angles and/or to start a measurement.

Glossary of Terms 119
GE Measurement & Control
Triggering Mode
The method by which measurements are started on the vb instrument. Measurements can be triggered 'manually' one-by-one, or using the 'free run' mode whereby measurements are continuously taken and displayed (until manually stopped).
Trough (w.r.t. a wave)
The lowest point in a wave. See also Peak.
U
Unbalance
See Imbalance.
Undamped
Not having any means of dissipating energy. In practice, no vibrating system is truly undamped. See also Damping.
Under-damped system
A system with a quantity of damping that is insufficient to prevent the system from vibrating. A machine that vibrates is an under-damped system. See also Critical damping and Over-damped system.
Uniform window
See Rectangular window.
Unit
A standard quantity used as a measure e.g. 'inch' is a unit for quantifying length. In the engineering field, there are two generally accepted systems of units: S.I. units and imperial units. See also Metric units.
V
Vane pass frequency
The speed at which pump vanes rotate past a fixed reference point. This is equal to the operating speed of the pump multiplied by the number of pump vanes. The vibration spectrum of a pump usually shows a peak at the vane pass frequency.

Glossary of Terms 120
GE Measurement & Control
vdB
A dimensionless logarithmic unit for velocity amplitude, defined as 20 times the logarithm (base-10) of the ratio of velocity amplitude to a reference amplitude of 10-6 mm/s rms (or 10-5 mm/s rms as used by some US government departments) i.e.
Amplitude vdB = 20 log10 (Amplitude / 10-6 mm/s rms)
or for some US government departments,
Amplitude vdB = 20 log10 (Amplitude / 10-5 mm/s rms)
Due to the use of the logarithmic function, the vdB unit is useful for displaying signals with both very large and very small amplitudes. See also Decibel and Logarithm function, base-10.
Vector
A quantity that denotes magnitude as well as direction e.g. velocity is a vector quantity. Although two objects may be moving at the same speed, their velocities, depending on the direction of movement of the objects, may not be the same. See also Scalar.
Velocity
The rate of change of displacement, or the speed of an object in a particular direction e.g. if an object is moving Northward, the velocity of the object in the North direction is its speed, but its velocity in the East or West direction is zero, and its velocity in the South direction is the negative of its speed. Velocity units commonly used in the field of vibration analysis are mm/s (metric), in/s (imperial), and vdB (logarithmic).
Velocity transducer
A transducer that measures velocity. Compared to accelerometers, velocity transducers have many drawbacks e.g. they are subject to wear and require frequent calibration.
Vibration
A reciprocating or back-and-forth movement involving a continual interchange of kinetic energy and potential energy. The vibration of a mass supported by a spring is an up-and-down motion that involves continual interchange of kinetic energy associated with motion of the mass and potential energy associated with distortion of the spring.

Glossary of Terms 121
GE Measurement & Control
Vibration signature
See Signature.
Vibratory system
See System.
Viscous damping
The dissipation of vibration energy due to viscous fluid flowing through constricted gaps e.g. oil flowing around a piston in a cylinder (as in car shock absorbers) and lubricant circulating in a journal bearing. The quantity of energy dissipated is dependent on the viscosity of the fluid and the velocity of vibration. See also Coulomb damping and Hysteretic damping.
W
Waterfall chart
A three-dimensional graphical view of recordings laid out in succession on the third axis. Waterfall charts are useful for 'trending' vibration patterns i.e. recordings taken on the same physical point and collected over a period of time can all be displayed chronologically on a waterfall chart so that changes in spectrum or waveform characteristics can be detected. See also Trending and Trend chart.
Waterfall plot
See Waterfall chart.
Wave
A disturbance traveling through a medium. Throwing a stone into water causes ripples or waves to travel through the water. Vibrating a metal sheet causes waves to travel through it. As a result, each point of the metal sheet oscillates. See also Peak, Trough, and Wavelength.
Waveform
A signal level (e.g. of velocity) versus time chart e.g. of measured vibration.

Glossary of Terms 122
GE Measurement & Control
Wavelength
The distance between two adjacent peaks or troughs in a wave. The wavelength is equal to the speed of the wave divided by its frequency. The stiffer the material, the faster waves travel through it, and the longer the wavelength (for a given vibration frequency).
Weighting
See Windowing.
White noise
Noise that has the same magnitude for all frequency values.
Window
See Windowing.
Windowing
The multiplying of time domain data block values by a mathematical function (the window) before FFT calculations are performed on the data block. The purpose of windowing is to compensate for certain FFT algorithm limitations that cause signal leakage. 'Windowing' or multiplying data block values by a suitable mathematical function ensures that the data block begins and ends with zero amplitude, thereby making the data block appear like a complete wave, is a way of reducing signal leakage. The Hanning window is commonly used. See also Flat top window, Hamming window, and Rectangular window.
X
X
Operating speed. 1X, or one times the operating speed, is the Fundamental frequency. 2X is twice the fundamental frequency, 3X is three times the fundamental frequency etc.
x axis (w.r.t. graphs)
The horizontal line on which the horizontal scale of a graph is marked. The x axis of a vibration waveform represents the time elapsed since the beginning of the measurement, and that of a vibration spectrum represents the frequency of vibration.

Glossary of Terms 123
GE Measurement & Control
Y
y axis (w.r.t. graphs)
The vertical line on which the vertical scale of a graph is marked. The y axis of a vibration waveform represents the instantaneous vibration level, and that of a vibration spectrum represents the amplitude of vibration.
Z
Zero-to-peak amplitude
See Peak amplitude.
Zooming
Image enlargement or scale enlargement. Zooming into a particular part of a spectrum enlarges the view of that part of the spectrum.


