
VIBRATION ANALYSIS 101 - VibCloud
15
VIBRATION ANALYSIS 101 A simple guide to understanding vibraon www.vib.cloud
Transcript of VIBRATION ANALYSIS 101 - VibCloud

VIBRATION ANALYSIS 101A simple guide to understanding vibra�on
www.vib.cloud

Part 1
What is vibra�on, waveform and spectrum?Why we talk about vibra�on analysis?
What is vibra�on?
What is vibra�on amplitude?
What is vibra�on frequency?
What is vibra�on spectrum?
How the vibra�on of real machine may look like?
How to understand more complex vibra�on pa�erns?
How is complex vibra�on transformed in a simple spectrum?
Undertes�ng Vibra�on spectrum
A simple guide to understanding vibra�on

Why we talk about vibra�on analysis?
VIBRATION
Visual Inspec�on
Contamina�on
Ultrasound
Oil analysis
Motor Current Analysis
Non Destruc�ve Tes�ng
Thermography
Vibra�on provides informa�on about the health of the equipment so an ac�on can be taken to prevent unscheduled breakdown and costly repairs. It is the most common condi�on monitoring and diagnos�c method.
It is a technique capable of early detec�ng symptoms of many different equipment problems and failures.
The most common problems detected by vibra�on are unbalance, misalignment, looseness, bearing and gear problems, electrically induced vibra�ons, pipe vibra�on, pressure pulsa�on etc.
Vibra�on can detect bearing related problem months before we see detect the problem by our human senses.
Part 1

What is vibra�on?
Vibra�on in a simple terms is an oscillatory mo�on. Every machine or component subjected to rota�onal forces or impacts will vibrate.
The simplest vibra�on pa�ern will be an oscilla�on “up and down”. If we observe this mo�on over �me it will it will look like a wave.
The wave has amplitude (now much the object is moving from its rest posi�on) and period (how long takes to complete one cycle).
Graph above (amplitude vs �me) is called “�me waveform”
�me
1 period
amp
litu
de
vibra�on �me waveform
up
up
do
wn
Part 1

What is vibra�on amplitude?
If we measure from the bo�om to the top of the oscillatory mo�on, we call that Peak to Peak amplitude.
If we measure from the equilibrium posi�on, then we call that 0-Peak amplitude.
It is a common prac�ce to express the amplitude in RMS (root mean square). This is because it be�er relates to the vibra�on energy. In a simple oscillatory mo�on this amplitude is 0.707 of the 0-Peak amplitude.
It is very important to know what is the vibra�on amplitude expressed in (Peak to Peak, 0-Peak or RMS).
.
�me
1 period
amp
litu
de
vibra�on �me waveform
Pe
ak t
o P
eak
Pe
ak t
o P
eak
0 t
o P
eak
RM
S
Part 1
What is vibra�on frequency?
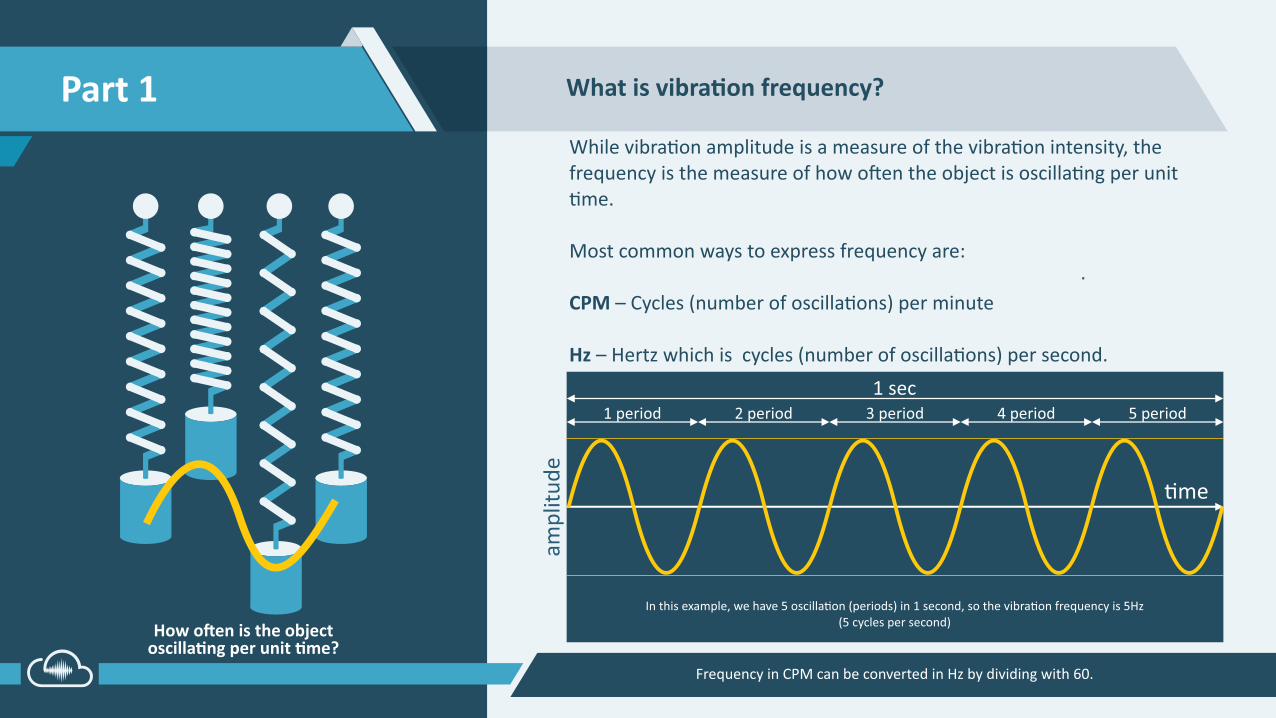
While vibra�on amplitude is a measure of the vibra�on intensity, the frequency is the measure of how o�en the object is oscilla�ng per unit �me.
Most common ways to express frequency are:
CPM – Cycles (number of oscilla�ons) per minute
Hz – Hertz which is cycles (number of oscilla�ons) per second.
Frequency in CPM can be converted in Hz by dividing with 60.
.
�me
1 sec1 period 2 period 3 period 4 period 5 period
amp
litu
de
How o�en is the object oscilla�ng per unit �me?
In this example, we have 5 oscilla�on (periods) in 1 second, so the vibra�on frequency is 5Hz (5 cycles per second)
Part 1

What is vibra�on spectrum?
We understood that vibra�on as a wave can be described with its amplitude and frequency. So, rather then looking the oscillatory mo�on in amplitude versus �me plot, we can express the same informa�on in amplitude versus frequency plot. This amplitude vs frequency plot is called vibra�on spectrum. Scale, we can simply.
In the spectrum, a simple �me waveform can be represented just with 2 numbers - amplitude and frequency
.
�me0 1 2 3 4 5 6 7 8 9
amp
litu
de
vibra�on �me waveform vibra�on spectrum
RM
S
amp
litu
de
Frequency (Hz)
Part 1
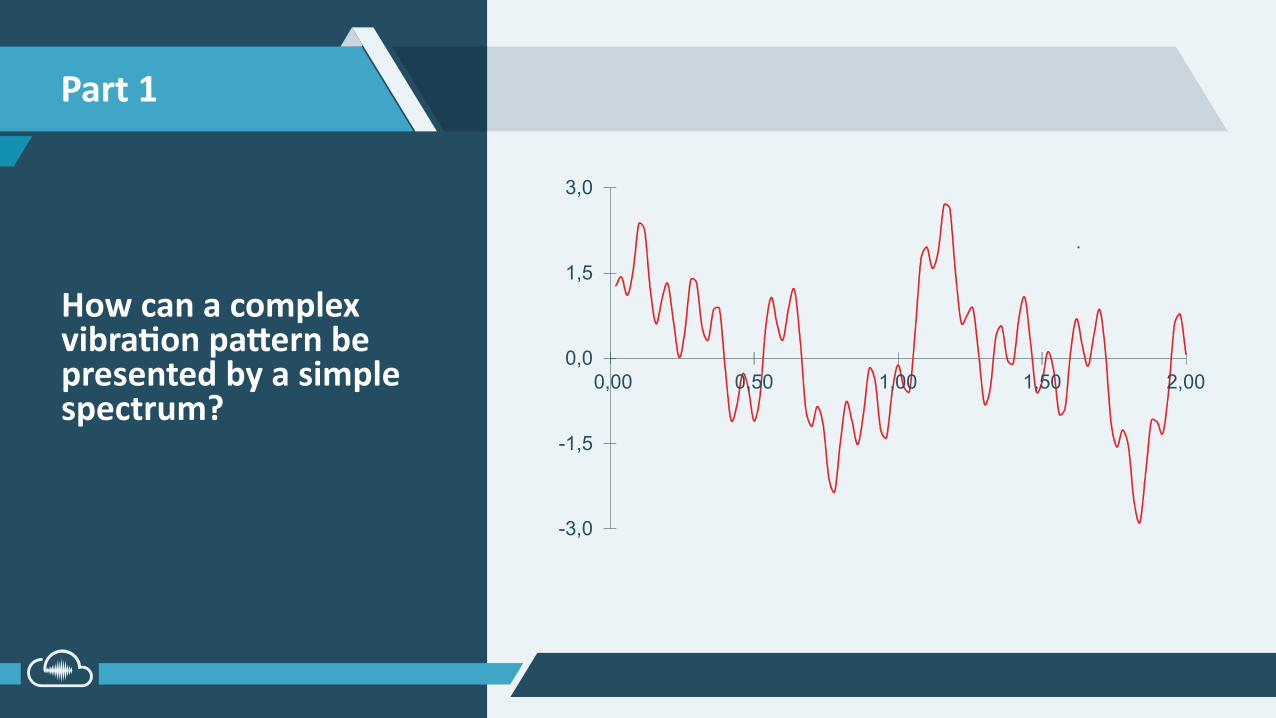
How can a complex vibra�on pa�ern be presented by a simple spectrum?
.
-3,0
-1,5
0,0
1,5
3,0
0,00 0,50 1,00 1,50 2,00
Part 1

How the vibra�on of real machine may look like?
Imagine if we can isolate each vibra�on source and Vibra�on of real machines is more complex. Real machines have different components and sha�s that may be rota�ng at different speeds genera�ng vibra�on with different amplitudes and frequencies. When all these vibra�on signals are added together, the resul�ng waveform looks much more complex then the wave we analyses so far.
Real machines have complex vibra�on waveform
.
-3,0
-1,5
0,0
1,5
3,0
0,00 0,50 1,00 1,50 2,00
amp
litu
de
Part 1

How to understand more complex vibra�on pa�erns?
To be able to iden�fy each vibra�on sources in amore complex vibra�on pa�ern, we will need to find out each individual simple wave that contributed to the final vibra�on signal.
Complex real vibra�on broken down in components
In this example, the pa�ern on the le� is a sum of the simple pa�erns on the right.
By breaking down complex vibra�on signal in its simple components, we can be�er understand what is causing the vibra�on
-1,5
0,0
1,5
0,00 0,50 1,00 1,50 2,00
-1,5
0,0
1,5
0,00 0,50 1,00 1,50 2,00
-1,5
0,0
1,5
0,00 0,50 1,00 1,50 2,00
-1,5
0,0
1,5
0,00 1,00 2,00
-3,0
-1,5
0,0
1,5
3,0
0,00 0,50 1,00 1,50 2,00
Complex, real vibra�on waveform
Part 1

How to understand more complex vibra�on pa�erns?
Complex real vibra�on broken down in components
Spectrum of each component
Each vibra�on component now can be easily converted in its spectrum. We can now see different amplitude at different frequencies.
Sim
ple
co
mp
on
ent
wav
es c
an n
ow
be
pre
sen
ted
w
ith
th
eir
spec
tru
m a
s w
e ex
pla
ined
ear
lier.
-1,5
0,0
1,5
0,00 0,50 1,00 1,50 2,00
-1,5
0,0
1,5
0,00 0,50 1,00 1,50 2,00
-1,5
0,0
1,5
0,00 0,50 1,00 1,50 2,00
-1,5
0,0
1,5
0,00 1,00 2,00
-3,0
-1,5
0,0
1,5
3,0
0,00 0,50 1,00 1,50 2,00
Complex, real vibra�on waveform
Part 1

How to understand more complex vibra�on pa�erns?
Each vibra�on component now can be easily converted in its spectrum. We can now see different amplitude at different frequencies.
Complex real vibra�on broken down in components
Spectrum of each component
Final spectrum with all
components on one
spectrum
Sim
ple
co
mp
on
ent
wav
es c
an n
ow
be
pre
sen
ted
w
ith
th
eir
spec
tru
m a
s w
e ex
pla
ined
ear
lier.
-1,5
0,0
1,5
0,00 0,50 1,00 1,50 2,00
-1,5
0,0
1,5
0,00 0,50 1,00 1,50 2,00
-1,5
0,0
1,5
0,00 0,50 1,00 1,50 2,00
-1,5
0,0
1,5
0,00 1,00 2,00
-3,0
-1,5
0,0
1,5
3,0
0,00 0,50 1,00 1,50 2,00
Complex, real vibra�on waveform
Part 1

How is complex vibra�on transformed in a simple spectrum?
A mathema�cal process called Fast Fourier Transform (FFT) is used to convert complex vibra�on pa�ern into a spectrum that shows all vibra�on components (amplitudes and frequencies). This process is cri�cal part in a modern vibra�on analyser.
The FFT is used to convert complex vibra�on pa�ern in a simple spectrum.
.
-3,0
-1,5
0,0
1,5
3,0
0,00 0,50 1,00 1,50 2,00
amp
litu
de
Complex, real vibra�on waveform Final vibra�on spectrum
Part 1

Undertes�ng Vibra�on spectrum
A�er the vibra�on of the real machine is presented in a spectrum, we can analyse the spectrum by looking each of the amplitude peaks and interpre�ng what may be casing them, are they high or low, are they changing over �me etc. In the most cases, problems present themselves in the vibra�on spectrum at characteris�c frequencies which makes diagnos�c easier.
Before we go dipper in understanding the characteris�c frequencies associated with common problems, we need understand bit more about units in which vibra�on is measured.
The FFT is used to convert complex vibra�on pa�ern in a simple spectrum.
vibra�on spectrum
Part 1


