Time of Use Base Interruptible Program (TOU-BIP) Aggregation

July 31, 2015 NWN OPUC Advice No. 15-12 / UG _____ (UM 1496) VIA ELECTRONIC FILING Public Utility Commission of Oregon Attention: Filing Center 201 High Street SE, Suite 100 Post Office Box 1088 Salem, Oregon 97308-1088 Re: Annual Purchased Gas Cost and Technical Rate Adjustments
UM 1496: Request for Amortization of Certain Deferred Accounts Relating to Gas Costs
Northwest Natural Gas Company, dba NW Natural (“NW Natural” or the “Company”), files herewith revisions to its Tariff, P.U.C. Or. 25, stated to become effective with service on and after November 1, 2015, as follows: Third Revision of Sheet P-2, Schedule P, “Purchased Gas Cost Adjustments (continued)’” Third Revision of Sheet P-3, Schedule P, “Purchased Gas Cost Adjustments (continued);” Third Revision of Sheet P-5, Schedule P, “Purchased Gas Cost Adjustments (continued);” Fifth Revision of Sheet 162-1, Schedule 162, “Temporary (Technical) Adjustments to Rates;”
Fifth Revision of Sheet 162-2, Schedule 162, “Temporary (Technical) Adjustments to Rates (continued);” Fourth Revision of Sheet 164-1, Schedule 164, “Purchased Gas Cost Adjustments to Rates;” First Revision of Sheet 187-1, Schedule 187, “Special Rate Adjustment for Mist Capacity Recall;” and
ONITA R. KING Rates & Regulatory Affairs Tel: 503.721.2452 Fax: 503.721.2516 Email: [email protected]
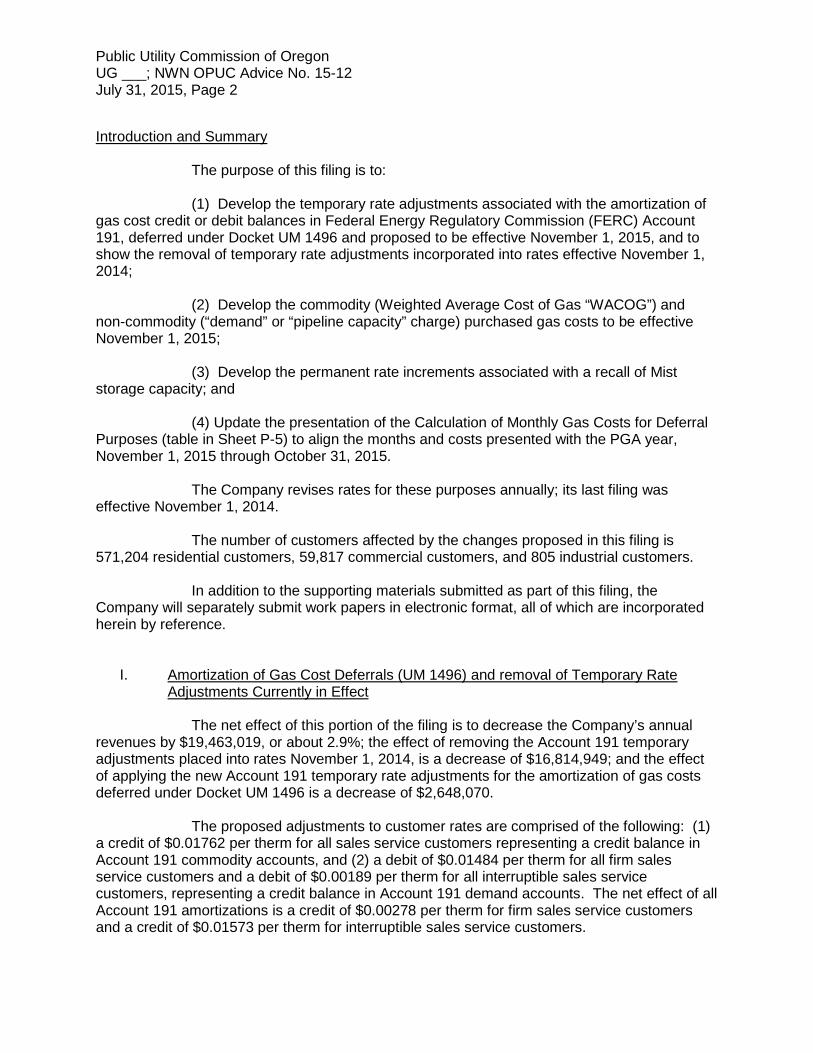
Public Utility Commission of Oregon UG ___; NWN OPUC Advice No. 15-12 July 31, 2015, Page 2 Introduction and Summary
The purpose of this filing is to: (1) Develop the temporary rate adjustments associated with the amortization of
gas cost credit or debit balances in Federal Energy Regulatory Commission (FERC) Account 191, deferred under Docket UM 1496 and proposed to be effective November 1, 2015, and to show the removal of temporary rate adjustments incorporated into rates effective November 1, 2014;
(2) Develop the commodity (Weighted Average Cost of Gas “WACOG”) and
non-commodity (“demand” or “pipeline capacity” charge) purchased gas costs to be effective November 1, 2015;
(3) Develop the permanent rate increments associated with a recall of Mist
storage capacity; and (4) Update the presentation of the Calculation of Monthly Gas Costs for Deferral
Purposes (table in Sheet P-5) to align the months and costs presented with the PGA year, November 1, 2015 through October 31, 2015.
The Company revises rates for these purposes annually; its last filing was
effective November 1, 2014. The number of customers affected by the changes proposed in this filing is
571,204 residential customers, 59,817 commercial customers, and 805 industrial customers. In addition to the supporting materials submitted as part of this filing, the
Company will separately submit work papers in electronic format, all of which are incorporated herein by reference.
I. Amortization of Gas Cost Deferrals (UM 1496) and removal of Temporary Rate Adjustments Currently in Effect
The net effect of this portion of the filing is to decrease the Company’s annual
revenues by $19,463,019, or about 2.9%; the effect of removing the Account 191 temporary adjustments placed into rates November 1, 2014, is a decrease of $16,814,949; and the effect of applying the new Account 191 temporary rate adjustments for the amortization of gas costs deferred under Docket UM 1496 is a decrease of $2,648,070.
The proposed adjustments to customer rates are comprised of the following: (1) a credit of $0.01762 per therm for all sales service customers representing a credit balance in Account 191 commodity accounts, and (2) a debit of $0.01484 per therm for all firm sales service customers and a debit of $0.00189 per therm for all interruptible sales service customers, representing a credit balance in Account 191 demand accounts. The net effect of all Account 191 amortizations is a credit of $0.00278 per therm for firm sales service customers and a credit of $0.01573 per therm for interruptible sales service customers.

Public Utility Commission of Oregon UG ___; NWN OPUC Advice No. 15-12 July 31, 2015, Page 3
The Company has developed the adjustments to rates proposed in this filing in accordance with the PGA Filing Guidelines as prescribed by the most recent Commission Order in Docket UM 1286.
This portion of the filing is in compliance with ORS 757.259 (2003), which authorizes deferred utility expenses or revenues to be allowed (amortized) in rates to the extent authorized by the Commission in a proceeding to change rates. All of the deferrals included in this filing occurred with appropriate application by Commission authorization, as rate orders or under approved tariffs.
II. Purchased Gas Cost Adjustment (PGA)
The net effect of the PGA portion of this filing is to decrease the Company’s annual revenues by about $64,382,583, or about 9.5%; the change in commodity cost is a decrease of $63,246,299 and the change in demand cost is a decrease of $1,136,284.
The change in gas costs results in a proposed Annual Sales WACOG of $0.33183 per therm, and a proposed Winter Sales WACOG of $0.34307. Revenue sensitive effects are applied for billing purposes, resulting in a proposed Annual Sales Billing WACOG of $0.34115 and a proposed Winter Sales Billing WACOG of $0.35271.
The change in demand costs results in a proposed firm service pipeline capacity
charge of $0.11609 per therm, or $1.73 per therm of MDDV, and a proposed interruptible service pipeline capacity charge of $0.01381 per therm. Revenue sensitive effects are applied for billing purposes, resulting in a proposed firm service pipeline capacity charge of $0.11935 per therm or $1.78 per therm of MDDV, and a proposed interruptible service pipeline capacity charge of $0.01420 per therm.
If there are material changes in the Company’s gas supply costs or costs associated with pipeline services and charges from the levels used to develop the purchased gas adjustments included in this filing, then the Company will reflect such changes to Oregon gas customers in a manner approved by the Commission.
This filing applies the method for calculating the proposed Annual Sales Weighted Average Cost of Gas (“WACOG”) that is set forth in a joint party stipulation approved by the Commission in OPUC Order No. 08-504, Docket UM 1286, as modified by the approval of a stipulation affirmed in OPUC Order No. 11-176, Dockets UM 1520/UG 204, and as further prescribed by the PGA Filing Guidelines, Section VI (1)(d) adopted in the most recent Commission Order No. 14-238 in Docket UM 1286.
III. Storage Recall This portion of the filing represents the permanent rate effects of the recall of 300,000 therms per day of Mist reservoir capacity and 300,000 therms per day of compression capacity from upstream market activities for use by the Company’s core customers. This adjustment is calculated in the same manner as all Mist expansion projects. The effect of this portion of the filing is to increase the Company’s annual revenues by $231,227.

Public Utility Commission of Oregon UG ___; NWN OPUC Advice No. 15-12 July 31, 2015, Page 4 The effect of applying the adjustment to customer rates is an increase on a percent of margin basis of $0.00044 on residential Schedule 2 customer rates, and an increase on a percent of margin basis of $0.00031 on commercial Schedule 3 rates. The adjustments for all other rate schedules can be found in Exhibit A, Page 12 to this filing.
IV. Combined Effect on Customer Bills The combined effects of this filing is to decrease the Company’s annual revenues by about $83,614,375, or about 12.32%; the change in purchased gas costs is an decrease of $64,382,583 and the change in temporary adjustments to rates is an increase of $19,463,019. The average monthly bill impact of the changes proposed in this filing is shown in the table below:
Class Rate Schedule
Average Monthly Bill Change ($)
Average Monthly Bill Change (%)
Residential Schedule 2 -$6.48 -10.5% Commercial Schedule 3 -$28.52 -12.0% Commercial Firm Sales Schedule 31 -$397.07 -15.2% Industrial Firm Sales Schedule 32 -$2,543.82 -20.2% Industrial Interruptible Sales Schedule 32 -$5,950.90 -24.3%
The monthly bill effects for all other rate classes can be found in the separately
provided workpapers. Please note that the monthly bill effects for Rate Schedule 31 and Rate Schedule
32 do not include the effect of changes in the pipeline capacity charge due to the customer option to elect either an MDDV-based capacity charge or a volumetric-based capacity charge. If a customer served under Rate Schedule 32 Industrial Firm Sales Service elected the volumetric pipeline capacity option, the change in the monthly bill effective November 1, 2015 would be $2,610.50, or 17.2%. UM 1286 Natural Gas Portfolio Development Guidelines In addition to the supporting materials submitted as part of this filing as Exhibit A and Exhibit B, the Company provides Exhibit C which contains the data required by the Natural Gas Portfolio Development Guidelines Sections IV and V as adopted by the Commission in OPUC Order No. 11-196 in Docket UM 1286 (“the OPUC Order”). Some of the information contained in Section V is confidential and highly confidential and is subject to the Modified Protective Order in Docket UM 1286, Order No. 10-337.
Commission Staff’s Attachment A through Attachment D, required by Section 5 of the PGA Filing Guidelines, are included in the Company’s work papers, incorporated herein by reference, which will be submitted under separate cover.
The Company requests that the tariff sheets filed herewith be permitted to become effective with service on and after November 1, 2015.

Public Utility Commission of Oregon UG ___; NWN OPUC Advice No. 15-12 July 31, 2015, Page 5 Copies of this letter and the filing made herewith are available in the Company's main office in Oregon and on its website at www.nwnatural.com. The Company waives paper service in this proceeding. Please address correspondence on this matter to Kyle Walker at [email protected], with copies to the following:
eFiling Rates & Regulatory Affairs NW Natural 220 NW Second Avenue Portland, Oregon 97209 Telecopier: (503) 721-2516 Telephone: (503) 226-4211, x3589 [email protected] and
Sincerely, NW NATURAL /s/ Onita R. King Onita R. King Rates & Regulatory Affairs
Attachments: Exhibit A – Purchased Gas Cost Deferral Amortizations Exhibit B – Purchased Gas Costs Exhibit C – PGA Portfolio Guidelines Sections IV and V

NORTHWEST NATURAL GAS COMPANY P.U.C. Or. 25 Third Revision of Sheet P-2 Cancels Second Revision of Sheet P-2
Issued July 31, 2015 Effective with service on NWN OPUC Advice No. 15-12 and after November 1, 2015
Issued by: NORTHWEST NATURAL GAS COMPANY d.b.a. NW Natural
220 N.W. Second Avenue Portland, Oregon 97209-3991
SCHEDULE P
PURCHASED GAS COST ADJUSTMENTS (continued)
DEFINITIONS (continued): 7. Estimated Annual Sales Weighted Average Cost of Gas (Annual Sales WACOG):
The estimated Annual Sales WACOG is the default Commodity Component for billing purposes, and is used for purposes of calculating the monthly gas cost deferral costs for entry into the Account 191 sub-accounts calculated by the following formula: (Forecasted Purchases at Adjusted Contract Prices) divided by forecasted sales volumes. a. “Forecasted Purchases” means November 1 – October 31 forecasted sales volumes,
“weather-normalized”, plus a percentage for distribution system LUFG. b. “Distribution system embedded LUFG” means the 5-year average of actual distribution
system LUFG, not to exceed 2%. c. “Adjusted contract prices” means actual and projected contract prices that are adjusted by
each associated Canadian pipeline’s published (closest to August 1) fuel use and line loss amount provided for by tariff, and by each associated U.S. pipeline’s tariffed rate.
Effective: November 1, 2015:
(T)
Estimated Annual Sales WACOG per therm (w/ revenue sensitive): $0.34115 (R)
Estimated Annual Sales WACOG per therm (w/o revenue sensitive): $0.33183 (R)
8. Estimated Winter Sales WACOG: The Company’s weighted average Commodity Cost of Gas
for the five-month period November through March. Effective: November 1, 2015:
(T)
Estimated Winter Sales WACOG per therm (w/ revenue sensitive): $0.35271 (R)
Estimated Winter Sales WACOG per therm (w/o revenue sensitive): $0.34307 (R)
9. Estimated Non-Commodity Cost: Estimated annual Non-Commodity gas costs shall be equal
to estimated annual Demand Costs, less estimated annual Capacity Release Benefits, plus or minus estimated annual pipeline refunds or surcharges.
10. Estimated Non-Commodity Cost per Therm – Firm Sales: The portion of the Estimated annual Non-Commodity Cost applicable to Firm Sales Service divided by November 1 – October 31 forecasted Firm Sales Service volumes.
Effective: November 1, 2015:
(T) Estimated Non-Commodity Cost per therm-Firm Sales (w/revenue sensitive): $0.11935 (R)
Estimated Non-Commodity Cost per therm-Firm Sales (w/o revenue sensitive): $0.11609 (R)
(continue to Sheet P-3)
NORTHWEST NATURAL GAS COMPANY P.U.C. Or. 25 Third Revision of Sheet P-3 Cancels Second Revision of Sheet P-3
Issued July 31, 2015 Effective with service on NWN OPUC Advice No. 15-12 and after November 1, 2015
Issued by: NORTHWEST NATURAL GAS COMPANY d.b.a. NW Natural
220 N.W. Second Avenue Portland, Oregon 97209-3991
SCHEDULE P
PURCHASED GAS COST ADJUSTMENTS (continued)
DEFINITIONS (continued):
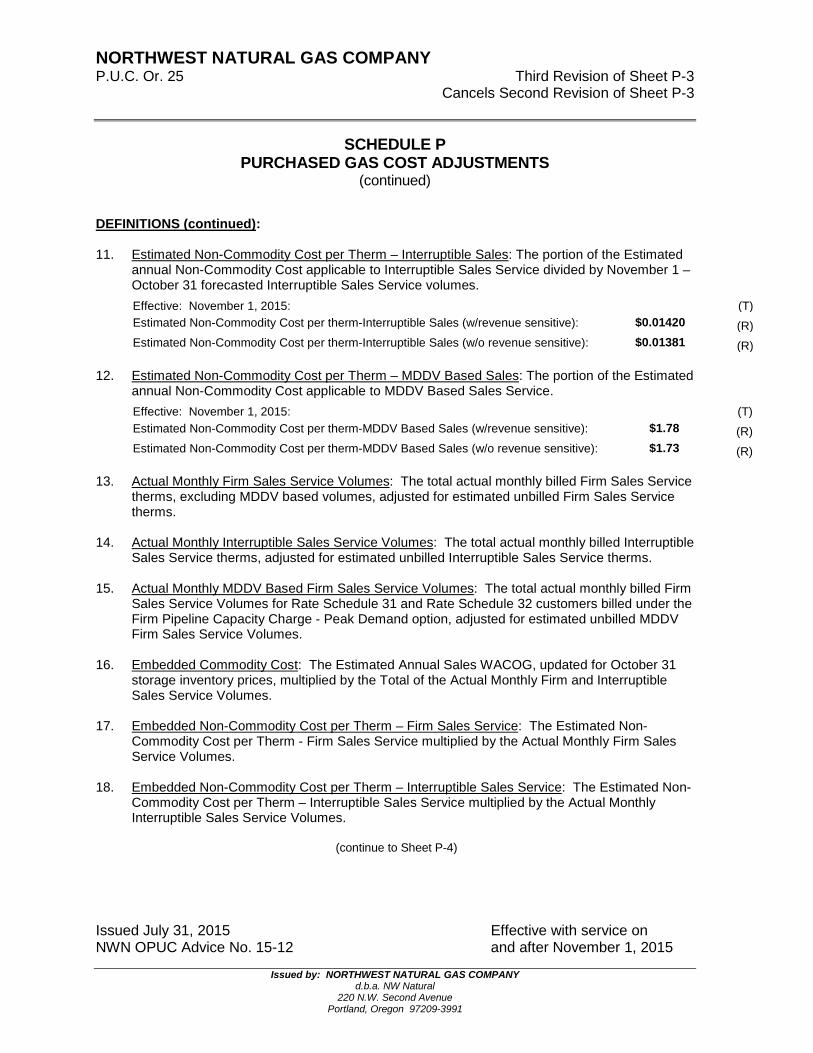
11. Estimated Non-Commodity Cost per Therm – Interruptible Sales: The portion of the Estimated
annual Non-Commodity Cost applicable to Interruptible Sales Service divided by November 1 – October 31 forecasted Interruptible Sales Service volumes. Effective: November 1, 2015:
(T)
Estimated Non-Commodity Cost per therm-Interruptible Sales (w/revenue sensitive): $0.01420 (R) Estimated Non-Commodity Cost per therm-Interruptible Sales (w/o revenue sensitive): $0.01381 (R)
12. Estimated Non-Commodity Cost per Therm – MDDV Based Sales: The portion of the Estimated annual Non-Commodity Cost applicable to MDDV Based Sales Service. Effective: November 1, 2015:
(T)
Estimated Non-Commodity Cost per therm-MDDV Based Sales (w/revenue sensitive): $1.78 (R) Estimated Non-Commodity Cost per therm-MDDV Based Sales (w/o revenue sensitive): $1.73 (R)
13. Actual Monthly Firm Sales Service Volumes: The total actual monthly billed Firm Sales Service therms, excluding MDDV based volumes, adjusted for estimated unbilled Firm Sales Service therms.
14. Actual Monthly Interruptible Sales Service Volumes: The total actual monthly billed Interruptible
Sales Service therms, adjusted for estimated unbilled Interruptible Sales Service therms. 15. Actual Monthly MDDV Based Firm Sales Service Volumes: The total actual monthly billed Firm
Sales Service Volumes for Rate Schedule 31 and Rate Schedule 32 customers billed under the Firm Pipeline Capacity Charge - Peak Demand option, adjusted for estimated unbilled MDDV Firm Sales Service Volumes.
16. Embedded Commodity Cost: The Estimated Annual Sales WACOG, updated for October 31
storage inventory prices, multiplied by the Total of the Actual Monthly Firm and Interruptible Sales Service Volumes.
17. Embedded Non-Commodity Cost per Therm – Firm Sales Service: The Estimated Non-
Commodity Cost per Therm - Firm Sales Service multiplied by the Actual Monthly Firm Sales Service Volumes.
18. Embedded Non-Commodity Cost per Therm – Interruptible Sales Service: The Estimated Non-
Commodity Cost per Therm – Interruptible Sales Service multiplied by the Actual Monthly Interruptible Sales Service Volumes.
(continue to Sheet P-4)

NORTHWEST NATURAL GAS COMPANY P.U.C. Or. 25 Third Revision of Sheet P-5 Cancels Second Revision of Sheet P-5
Issued July 31, 2015 Effective with service on NWN OPUC Advice No. 15-12 and after November 1, 2015
Issued by: NORTHWEST NATURAL GAS COMPANY d.b.a. NW Natural
220 N.W. Second Avenue Portland, Oregon 97209-3991
SCHEDULE P PURCHASED GAS COST ADJUSTMENTS
(continued) CALCULATION OF MONTHLY GAS COSTS FOR DEFERRAL PURPOSES (continued): 2. A debit or credit entry shall be made equal to 100% of any monthly difference between Embedded
Non-Commodity Costs and Monthly Seasonalized Fixed Charges. The monthly Seasonalized Fixed Charges for the period November 1, 2015 through October 31, 2016 are:
November 2015 $8,530,506 (C) December 2015 $12,155,128
January 2016 $11,445,540 February 2016 $9,583,025 March 2016 $8,143,837 April 2016 $6,042,536 May 2016 $3,912,397 June 2016 $2,374,325 July 2016 $2,063,471 August 2016 $2,048,574 September 2016 $2,196,176 October 2016 $4,970,518 ANNUAL TOTAL
$73,466,033 (C)
3. A debit or credit entry shall be made equal to 90% of the difference between the Actual
Commodity Cost and the Embedded Commodity Cost. A debit or credit entry will also be made equal to 100% of the difference between storage withdrawals priced at the actual book inventory rate as of October 31 prior to the PGA year and storage withdrawals priced at the inventory rate used in the PGA filing. For any given tracker year, if the total activity subject to debit or credit entries that is related to the Gas Reserves transaction exceeds $10 million, amounts beyond $10 million will be recorded at 100%.
4. Monthly differentials shall be deemed to be positive if actual costs exceed embedded costs and to
be negative if actual costs fall below embedded costs. 5. The cost differential entries shall be debited to the sub-accounts of Account 191 if positive, and
credited to the sub-accounts of Account 191 if negative. 6. Interest – Beginning November 1, 2007, the Company shall compute interest on existing deferred
balances on a monthly basis using the interest rate(s) approved by the Commission.
(continue to Sheet P-6)
(T)

NORTHWEST NATURAL GAS COMPANY P.U.C. Or. 25 Fifth Revision of Sheet 162-1 Cancels Fourth Revision of Sheet 162-1
Issued July 31, 2015 Effective with service on NWN OPUC Advice No. 15-12 and after November 1, 2015
Issued by: NORTHWEST NATURAL GAS COMPANY d.b.a. NW Natural
220 N.W. Second Avenue Portland, Oregon 97209-3991
SCHEDULE 162
TEMPORARY (TECHNICAL) ADJUSTMENTS TO RATES PURPOSE: To identify adjustments to rates in the Rate Schedules listed below that relate to the amortization of balances in the Company’s Account 191 deferred revenue and gas cost accounts. APPLICABLE: To the following Rate Schedules of this Tariff:
Rate Schedule 2 Rate Schedule 27 Rate Schedule 32 Rate Schedule 3 Rate Schedule 31 Rate Schedule 33
APPLICATION TO RATE SCHEDULES: Effective: November 1, 2015 The Total Adjustment amount shown below is included in the Temporary Adjustments reflected in the above-listed Rate Schedules. NO ADDITIONAL ADJUSTMENT TO RATES IS REQUIRED.
Schedule Block Account 191 Commodity Adjustment
Account 191 Pipeline Capacity
Adjustment
Total Adjustment
(C)
2 ($0.01762) $0.01484 ($0.00278) 3 CSF ($0.01762) $0.01484 ($0.00278) 3 ISF ($0.01762) $0.01484 ($0.00278) 27 ($0.01762) $0.01484 ($0.00278) 31 CSF Block 1 ($0.01762) $0.01484 ($0.00278) Block 2 ($0.01762) $0.01484 ($0.00278) 31 CTF Block 1 N/A N/A $0.00000 Block 2 N/A N/A $0.00000 31 ISF Block 1 ($0.01762) $0.01484 ($0.00278) Block 2 ($0.01762) $0.01484 ($0.00278) 31 ITF Block 1 N/A N/A $0.00000 Block 2 N/A N/A $0.00000 (C)
(continue to Sheet 162-2)
(C) (C)
(T)
(D)
NORTHWEST NATURAL GAS COMPANY P.U.C. Or. 25 Fifth Revision of Sheet 162-2 Cancels Fourth Revision of Sheet 162-2
Issued July 31, 2015 Effective with service on NWN OPUC Advice No. 15-12 and after November 1, 2015
Issued by: NORTHWEST NATURAL GAS COMPANY d.b.a. NW Natural
220 N.W. Second Avenue Portland, Oregon 97209-3991
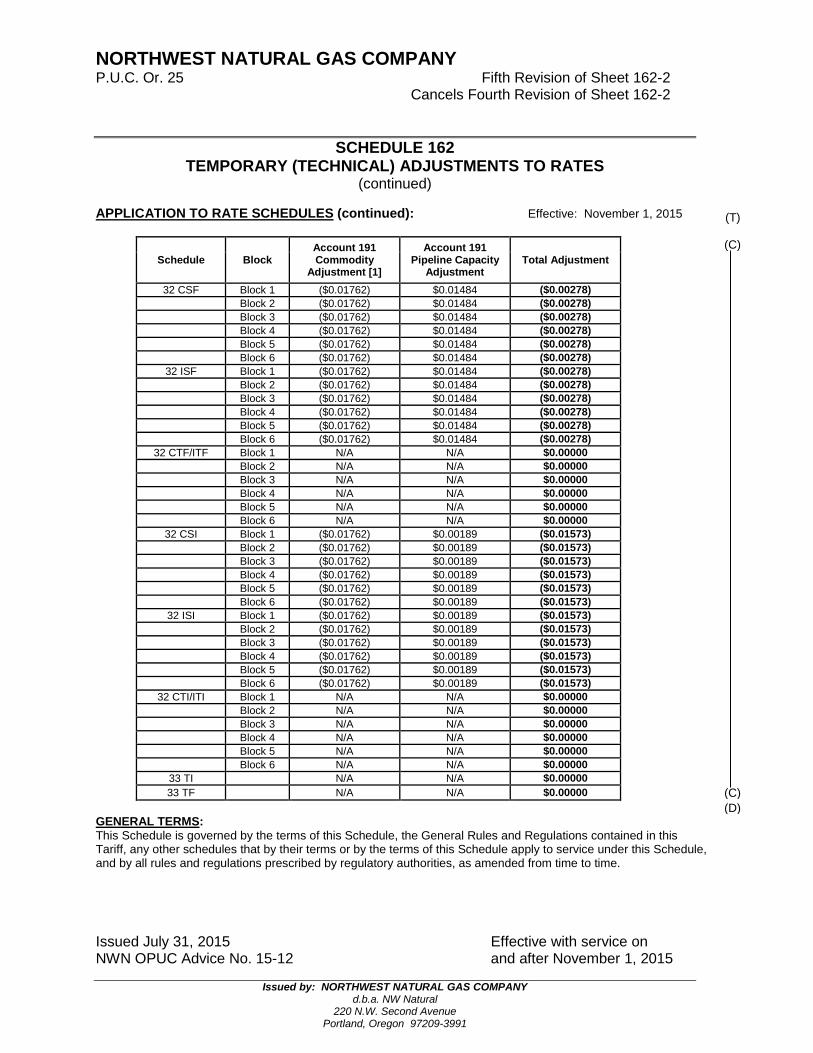
SCHEDULE 162 TEMPORARY (TECHNICAL) ADJUSTMENTS TO RATES
(continued) APPLICATION TO RATE SCHEDULES (continued): Effective: November 1, 2015
Schedule Block Account 191 Commodity
Adjustment [1]
Account 191 Pipeline Capacity
Adjustment Total Adjustment
(C)
32 CSF Block 1 ($0.01762) $0.01484 ($0.00278) Block 2 ($0.01762) $0.01484 ($0.00278) Block 3 ($0.01762) $0.01484 ($0.00278) Block 4 ($0.01762) $0.01484 ($0.00278) Block 5 ($0.01762) $0.01484 ($0.00278) Block 6 ($0.01762) $0.01484 ($0.00278) 32 ISF Block 1 ($0.01762) $0.01484 ($0.00278) Block 2 ($0.01762) $0.01484 ($0.00278) Block 3 ($0.01762) $0.01484 ($0.00278) Block 4 ($0.01762) $0.01484 ($0.00278) Block 5 ($0.01762) $0.01484 ($0.00278) Block 6 ($0.01762) $0.01484 ($0.00278) 32 CTF/ITF Block 1 N/A N/A $0.00000 Block 2 N/A N/A $0.00000 Block 3 N/A N/A $0.00000 Block 4 N/A N/A $0.00000 Block 5 N/A N/A $0.00000 Block 6 N/A N/A $0.00000 32 CSI Block 1 ($0.01762) $0.00189 ($0.01573) Block 2 ($0.01762) $0.00189 ($0.01573) Block 3 ($0.01762) $0.00189 ($0.01573) Block 4 ($0.01762) $0.00189 ($0.01573) Block 5 ($0.01762) $0.00189 ($0.01573) Block 6 ($0.01762) $0.00189 ($0.01573) 32 ISI Block 1 ($0.01762) $0.00189 ($0.01573) Block 2 ($0.01762) $0.00189 ($0.01573) Block 3 ($0.01762) $0.00189 ($0.01573) Block 4 ($0.01762) $0.00189 ($0.01573) Block 5 ($0.01762) $0.00189 ($0.01573) Block 6 ($0.01762) $0.00189 ($0.01573) 32 CTI/ITI Block 1 N/A N/A $0.00000 Block 2 N/A N/A $0.00000 Block 3 N/A N/A $0.00000 Block 4 N/A N/A $0.00000 Block 5 N/A N/A $0.00000 Block 6 N/A N/A $0.00000 33 TI N/A N/A $0.00000 33 TF N/A N/A $0.00000 (C)
(D)
GENERAL TERMS: This Schedule is governed by the terms of this Schedule, the General Rules and Regulations contained in this Tariff, any other schedules that by their terms or by the terms of this Schedule apply to service under this Schedule, and by all rules and regulations prescribed by regulatory authorities, as amended from time to time.
(T)

NORTHWEST NATURAL GAS COMPANY P.U.C. Or. 25 Fourth Revision of Sheet 164-1 Cancels Third Revision of Sheet 164-1
Issued July 31, 2015 Effective with service on NWN OPUC Advice No. 15-12 and after November 1, 2015
Issued by: NORTHWEST NATURAL GAS COMPANY d.b.a. NW Natural
220 N.W. Second Avenue Portland, Oregon 97209-3991
SCHEDULE 164
PURCHASED GAS COST ADJUSTMENT TO RATES PURPOSE: To identify the Commodity and Pipeline Capacity Components applicable to the Rate Schedules listed below. APPLICABLE: To the following Rate Schedules of this Tariff:
Rate Schedule 2 Rate Schedule 3 Rate Schedule 27 Rate Schedule 31 Rate Schedule 32
APPLICATION TO RATE SCHEDULES: Effective: November 1, 2015
Annual Sales WACOG [1] $0.34115 (R) Winter Sales WACOG [2] $0.35271
Firm Sales Service Pipeline Capacity Component [4] $0.11935 Firm Sales Service Pipeline Capacity Component [5] $1.78000 Interruptible Sales Service Pipeline Capacity Component [6] $0.01420 (R)
[1] Applies to all Sales Service Rate Schedules (per therm) except where Winter Sales WACOG or
Monthly Incremental Cost of Gas applies. [2] Applies to Sales Customers that request Winter Sales WACOG at the September 15 Annual
Service Election. [3] Applies to Rate Schedules 2, 3, and Schedule 31 and Schedule 32 Firm Sales Service Volumetric
Pipeline Capacity option (per therm). [4] Applies to Rate Schedules 31 and 32 Firm Sales Service Peak Demand Pipeline Capacity option
(per therm of MDDV per month). [5] Applies to Rate Schedule 32 Interruptible Sales Service (per therm). GENERAL TERMS: This schedule is governed by the terms of this Schedule, the General Rules and Regulations contained in this Tariff, any other schedules that by their terms or by the terms of this Rate Schedule apply to service under the Rate Schedule, and by all rules and regulations prescribed by regulatory authorities, as amended from time to time.
(T)

NORTHWEST NATURAL GAS COMPANY P.U.C. Or. 25 First Revision of Sheet 187-1 Cancels Original Sheet 187-1
Issued July 31, 2015 Effective with service on NWN OPUC Advice No. 15-12 and after November 1, 2015
Issued by: NORTHWEST NATURAL GAS COMPANY
d.b.a. NW Natural 220 N.W. Second Avenue
Portland, Oregon 97209-3991
SCHEDULE 187 SPECIAL RATE ADJUSTMENT FOR MIST CAPACITY RECALL
PURPOSE: The purpose of this Schedule is to reflect the rate effects of the Company’s recall of Mist storage capacity for use by the Company’s core Sales Service Customers. APPLICABLE: To the following Rate Schedules of this Tariff:
Rate Schedule 2 Rate Schedule 3 Rate Schedule 31 Rate Schedule 27 Rate Schedule 32
APPLICATION TO RATE SCHEDULES: Effective: November 1, 2015 The Total Adjustment amounts shown below are included in the Base Adjustments reflected in the above-listed Rate Schedules. NO ADDITIONAL ADJUSTMENT TO RATES IS REQUIRED.
Rate Schedule/Class Block
Mist Recall Schedule Block
Mist Recall (C)
Base Adjustment Base Adjustment
2 $0.00044 31 CSF Block 1 $0.00023 03 CSF $0.00031 Block 2 $0.00021 03 ISF $0.00026 31 ISF Block 1 $0.00017 27 $0.00037 Block 2 $0.00015 32 CSF Block 1 $0.00014 32 CSI Block 1 $0.00010 Block 2 $0.00012 Block 2 $0.00008 Block 3 $0.00008 Block 3 $0.00006 Block 4 $0.00005 Block 4 $0.00003 Block 5 $0.00003 Block 5 $0.00002 Block 6 $0.00001 Block 6 $0.00001 32 ISF Block 1 $0.00010 32 ISI Block 1 $0.00009 Block 2 $0.00009 Block 2 $0.00008 Block 3 $0.00006 Block 3 $0.00006 Block 4 $0.00004 Block 4 $0.00003 Block 5 $0.00002 Block 5 $0.00002 Block 6 $0.00001 Block 6 $0.00001 (C)
GENERAL TERMS: Service under this Schedule is governed by the terms of this Schedule, the General Rules and Regulations contained in this, any other schedules that by their terms or by the terms of this Schedule apply to service under this Schedule, and by all rules and regulations prescribed by regulatory authorities, as amended from time to time.
(T)

EXHIBIT A
BEFORE THE PUBLIC UTILITY COMMISSION
OF OREGON
NW NATURAL SUPPORTING MATERIALS
Purchased Gas Cost Deferral Amortizations UM 1496
NWN OPUC Advice No. 15-12 / UG ____
July 31, 2015

NW NATURAL EXHIBIT A
Supporting Material
Purchased Gas Cost Deferral Amortizations – UM 1496
NWN OPUC ADVICE NO. 15-12/ UG ____
Description Page Summary of Temporary Increments 1 Calculation of Increments Allocated on the Equal Cent per Therm Basis 2 Basis for Revenue Related Costs 3 Summary of Deferred Accounts Included in the PGA 4 191400 Core Market Commodity Gas Cost Deferral 5 191401 Amortization of Oregon WACOG Deferral 6 191405 Post Carry Wells Deferral 7 191410 Core Market Demand Cost Deferral 8 191411 Amortization of Oregon Demand Deferral 9 191417 Coos County Demand 10 191450 Core Market Demand Collection Deferral 11 Calculation of Increments Allocated on the Equal Percentage of Margin Basis 12 Recall of Mist Storage for Core 13

NW NaturalRates & Regulatory Affairs2015-16 PGA - Oregon: August FilingSummary of TEMPORARY Increments
1 Schedule 162
2
3
4
Current
Temporaries
WACOG
Deferral
Demand
Deferral -
FIRM
Demand
Deferral -
INTERRUPTI
BLE
Total Proposed
Temps
Net Effect of
Temps
5 (N = M - A)
6 Schedule Block A B C D M N
7 2R 0.02381 (0.01762) 0.01484 0.00000 0.03651 0.01270
8 3C Sales Firm 0.05288 (0.01762) 0.01484 0.00000 0.07146 0.01858
9 3I Sales Firm 0.03900 (0.01762) 0.01484 0.00000 0.03345 (0.00555)
10 27 Dry Out 0.02332 (0.01762) 0.01484 0.00000 0.00898 (0.01434)
11 31C Sales Firm Block 1 0.05295 (0.01762) 0.01484 0.00000 0.06796 0.01501
12 Block 2 0.05298 (0.01762) 0.01484 0.00000 0.06726 0.01428
13 31C Trans Firm Block 1 (0.00072) 0.00000 0.00000 0.00000 0.01026 0.01098
14 Block 2 (0.00071) 0.00000 0.00000 0.00000 0.00936 0.01007
15 31I Sales Firm Block 1 0.03909 (0.01762) 0.01484 0.00000 0.02985 (0.00924)
16 Block 2 0.03911 (0.01762) 0.01484 0.00000 0.02926 (0.00985)
17 31I Trans Firm Block 1 (0.00002) 0.00000 0.00000 0.00000 0.00673 0.00675
18 Block 2 (0.00001) 0.00000 0.00000 0.00000 0.00610 0.00611
19 32C Sales Firm Block 1 0.03903 (0.01762) 0.01484 0.00000 0.02740 (0.01163)
20 Block 2 0.03906 (0.01762) 0.01484 0.00000 0.02683 (0.01223)
21 Block 3 0.03907 (0.01762) 0.01484 0.00000 0.02587 (0.01320)
22 Block 4 0.03911 (0.01762) 0.01484 0.00000 0.02492 (0.01419)
23 Block 5 0.03912 (0.01762) 0.01484 0.00000 0.02434 (0.01478)
24 Block 6 0.03915 (0.01762) 0.01484 0.00000 0.02397 (0.01518)
25 32I Sales Firm Block 1 0.03916 (0.01762) 0.01484 0.00000 0.02739 (0.01177)
26 Block 2 0.03918 (0.01762) 0.01484 0.00000 0.02684 (0.01234)
27 Block 3 0.03921 (0.01762) 0.01484 0.00000 0.02592 (0.01329)
28 Block 4 0.03922 (0.01762) 0.01484 0.00000 0.02501 (0.01421)
29 Block 5 0.03925 (0.01762) 0.01484 0.00000 0.02446 (0.01479)
30 Block 6 0.03924 (0.01762) 0.01484 0.00000 0.02410 (0.01514)
31 32 Trans Firm Block 1 0.00004 0.00000 0.00000 0.00000 0.00357 0.00353
32 Block 2 0.00004 0.00000 0.00000 0.00000 0.00306 0.00302
33 Block 3 0.00006 0.00000 0.00000 0.00000 0.00220 0.00214
34 Block 4 0.00007 0.00000 0.00000 0.00000 0.00135 0.00128
35 Block 5 0.00009 0.00000 0.00000 0.00000 0.00083 0.00074
36 Block 6 0.00008 0.00000 0.00000 0.00000 0.00050 0.00042
37 32C Sales Interr Block 1 0.04615 (0.01762) 0.00000 0.00189 0.01436 (0.03179)
38 Block 2 0.04615 (0.01762) 0.00000 0.00189 0.01381 (0.03234)
39 Block 3 0.04619 (0.01762) 0.00000 0.00189 0.01287 (0.03332)
40 Block 4 0.04620 (0.01762) 0.00000 0.00189 0.01194 (0.03426)
41 Block 5 0.04623 (0.01762) 0.00000 0.00189 0.01137 (0.03486)
42 Block 6 0.04622 (0.01762) 0.00000 0.00189 0.01101 (0.03521)
43 32I Sales Interr Block 1 0.04626 (0.01762) 0.00000 0.00189 0.01428 (0.03198)
44 Block 2 0.04626 (0.01762) 0.00000 0.00189 0.01376 (0.03250)
45 Block 3 0.04629 (0.01762) 0.00000 0.00189 0.01288 (0.03341)
46 Block 4 0.04630 (0.01762) 0.00000 0.00189 0.01201 (0.03429)
47 Block 5 0.04633 (0.01762) 0.00000 0.00189 0.01148 (0.03485)
48 Block 6 0.04632 (0.01762) 0.00000 0.00189 0.01113 (0.03519)
49 32 Trans Interr Block 1 0.00004 0.00000 0.00000 0.00000 0.00335 0.00331
50 Block 2 0.00005 0.00000 0.00000 0.00000 0.00287 0.00282
51 Block 3 0.00006 0.00000 0.00000 0.00000 0.00207 0.00201
52 Block 4 0.00007 0.00000 0.00000 0.00000 0.00127 0.00120
53 Block 5 0.00009 0.00000 0.00000 0.00000 0.00079 0.00070
54 Block 6 0.00010 0.00000 0.00000 0.00000 0.00047 0.00037
55 33 0.00000 0.00000 0.00000 0.00000 0.00021 0.00021
NWN 2015-16 PGA Oregon rate development file August filing.xlsx 7/28/2015 10:05 AM
Temporaries
Exhibit A - Supporting Materials NWN OPUC Advice No. 15-12/UG ____
Page 1 of 13

NW
Na
tura
lR
ate
s &
Re
gu
lato
ry A
ffa
irs
20
15
-16
PG
A -
Ore
go
n:
Au
gu
st
Fil
ing
Ca
lcu
lati
on
of
In
cre
me
nts
All
oca
ted
on
th
e E
QU
AL C
EN
T P
ER
TH
ER
M B
AS
IS
ALL V
OLU
MES I
N T
HERM
S
1W
AC
OG
De
ferr
al
De
ma
nd
De
ferr
al
- FIR
MD
em
an
d D
efe
rra
l -
INT
ER
RU
PT
IBLE
Re
sid
en
tia
l D
eco
up
lin
g
2O
reg
on
PG
AP
rop
ose
d A
mo
un
t:(1
1,7
19,2
91)
Tem
pora
ry I
ncr
em
ent
9,0
37,0
65
Tem
pora
ry I
ncr
em
ent
106,5
02
Tem
pora
ry I
ncr
em
ent
3V
olu
me
s p
ag
e,
Re
ve
nu
e S
en
sit
ive
Mu
ltip
lie
r:2.7
32%
add r
evenue s
ensi
tive f
act
or
2.7
32%
add r
evenue s
ensi
tive f
act
or
2.7
32%
add r
evenue s
ensi
tive f
act
or
4C
olu
mn
FA
mo
un
t to
Am
ort
ize
:(1
2,0
48
,45
5)
to a
ll sa
les
9,2
90
,89
2to
all
firm
sale
s1
09
,49
3to
all
inte
rruptible
sale
s
5M
ult
ipli
er
Vo
lum
es
Incre
me
nt
Mu
ltip
lie
rV
olu
me
sIn
cre
me
nt
Mu
ltip
lie
rV
olu
me
sIn
cre
me
nt
6Sch
edule
Blo
ckA
BC
DE
FG
HI
J
72R
365,2
85,3
06
1.0
365,2
85,3
06
(0.0
1762)
1.0
365,2
85,3
06
0.0
1484
0.0
00.0
0000
83C F
irm
Sale
s158,9
36,7
55
1.0
158,9
36,7
55
(0.0
1762)
1.0
158,9
36,7
55
0.0
1484
0.0
00.0
0000
93I
Firm
Sale
s3,8
11,7
35
1.0
3,8
11,7
35
(0.0
1762)
1.0
3,8
11,7
35
0.0
1484
0.0
00.0
0000
10
27 D
ry O
ut
700,5
52
1.0
700,5
52
(0.0
1762)
1.0
700,5
52
0.0
1484
0.0
00.0
0000
11
31C F
irm
Sale
sBlo
ck 1
20,7
01,7
36
1.0
20,7
01,7
36
(0.0
1762)
1.0
20,7
01,7
36
0.0
1484
0.0
00.0
0000
12
Blo
ck 2
15,3
17,4
97
1.0
15,3
17,4
97
(0.0
1762)
1.0
15,3
17,4
97
0.0
1484
0.0
00.0
0000
13
31C F
irm
Tra
ns
Blo
ck 1
1,0
22,4
80
0.0
00.0
0000
0.0
00.0
0000
0.0
00.0
0000
14
Blo
ck 2
1,2
38,2
13
0.0
00.0
0000
0.0
00.0
0000
0.0
00.0
0000
15
31I
Firm
Sale
sBlo
ck 1
4,1
78,8
53
1.0
4,1
78,8
53
(0.0
1762)
1.0
4,1
78,8
53
0.0
1484
0.0
00.0
0000
16
Blo
ck 2
9,5
36,7
89
1.0
9,5
36,7
89
(0.0
1762)
1.0
9,5
36,7
89
0.0
1484
0.0
00.0
0000
17
31I
Firm
Tra
ns
Blo
ck 1
181,4
94
0.0
00.0
0000
0.0
00.0
0000
0.0
00.0
0000
18
Blo
ck 2
680,6
50
0.0
00.0
0000
0.0
00.0
0000
0.0
00.0
0000
19
32C F
irm
Sale
sBlo
ck 1
26,5
67,6
26
1.0
26,5
67,6
26
(0.0
1762)
1.0
26,5
67,6
26
0.0
1484
0.0
00.0
0000
20
Blo
ck 2
7,8
04,0
67
1.0
7,8
04,0
67
(0.0
1762)
1.0
7,8
04,0
67
0.0
1484
0.0
00.0
0000
21
Blo
ck 3
829,0
92
1.0
829,0
92
(0.0
1762)
1.0
829,0
92
0.0
1484
0.0
00.0
0000
22
Blo
ck 4
20,7
93
1.0
20,7
93
(0.0
1762)
1.0
20,7
93
0.0
1484
0.0
00.0
0000
23
Blo
ck 5
01.0
0(0
.01762)
1.0
00.0
1484
0.0
00.0
0000
24
Blo
ck 6
01.0
0(0
.01762)
1.0
00.0
1484
0.0
00.0
0000
25
32I
Firm
Sale
sBlo
ck 1
4,6
45,4
09
1.0
4,6
45,4
09
(0.0
1762)
1.0
4,6
45,4
09
0.0
1484
0.0
00.0
0000
26
Blo
ck 2
5,1
52,9
55
1.0
5,1
52,9
55
(0.0
1762)
1.0
5,1
52,9
55
0.0
1484
0.0
00.0
0000
27
Blo
ck 3
1,8
26,2
57
1.0
1,8
26,2
57
(0.0
1762)
1.0
1,8
26,2
57
0.0
1484
0.0
00.0
0000
28
Blo
ck 4
627,9
63
1.0
627,9
63
(0.0
1762)
1.0
627,9
63
0.0
1484
0.0
00.0
0000
29
Blo
ck 5
(0)
1.0
(0)
(0.0
1762)
1.0
(0)
0.0
1484
0.0
00.0
0000
30
Blo
ck 6
01.0
0(0
.01762)
1.0
00.0
1484
0.0
00.0
0000
31
32 F
irm
Tra
ns
Blo
ck 1
12,0
06,5
97
0.0
00.0
0000
0.0
00.0
0000
0.0
00.0
0000
32
Blo
ck 2
16,3
15,4
96
0.0
00.0
0000
0.0
00.0
0000
0.0
00.0
0000
33
Blo
ck 3
9,6
41,3
78
0.0
00.0
0000
0.0
00.0
0000
0.0
00.0
0000
34
Blo
ck 4
16,1
34,1
78
0.0
00.0
0000
0.0
00.0
0000
0.0
00.0
0000
35
Blo
ck 5
21,2
82,0
59
0.0
00.0
0000
0.0
00.0
0000
0.0
00.0
0000
36
Blo
ck 6
1,9
20,7
52
0.0
00.0
0000
0.0
00.0
0000
0.0
00.0
0000
37
32C I
nte
rr S
ale
sBlo
ck 1
5,6
86,2
22
1.0
5,6
86,2
22
(0.0
1762)
0.0
00.0
0000
1.0
5,6
86,2
22
0.0
0189
38
Blo
ck 2
7,5
63,2
08
1.0
7,5
63,2
08
(0.0
1762)
0.0
00.0
0000
1.0
7,5
63,2
08
0.0
0189
39
Blo
ck 3
3,8
97,0
38
1.0
3,8
97,0
38
(0.0
1762)
0.0
00.0
0000
1.0
3,8
97,0
38
0.0
0189
40
Blo
ck 4
4,4
45,3
65
1.0
4,4
45,3
65
(0.0
1762)
0.0
00.0
0000
1.0
4,4
45,3
65
0.0
0189
41
Blo
ck 5
71,8
70
1.0
71,8
70
(0.0
1762)
0.0
00.0
0000
1.0
71,8
70
0.0
0189
42
Blo
ck 6
01.0
0(0
.01762)
0.0
00.0
0000
1.0
00.0
0189
43
32I
Inte
rr S
ale
sBlo
ck 1
7,1
86,2
89
1.0
7,1
86,2
89
(0.0
1762)
0.0
00.0
0000
1.0
7,1
86,2
89
0.0
0189
44
Blo
ck 2
8,9
46,1
42
1.0
8,9
46,1
42
(0.0
1762)
0.0
00.0
0000
1.0
8,9
46,1
42
0.0
0189
45
Blo
ck 3
5,1
35,7
55
1.0
5,1
35,7
55
(0.0
1762)
0.0
00.0
0000
1.0
5,1
35,7
55
0.0
0189
46
Blo
ck 4
10,4
45,1
79
1.0
10,4
45,1
79
(0.0
1762)
0.0
00.0
0000
1.0
10,4
45,1
79
0.0
0189
47
Blo
ck 5
4,5
97,3
92
1.0
4,5
97,3
92
(0.0
1762)
0.0
00.0
0000
1.0
4,5
97,3
92
0.0
0189
48
Blo
ck 6
11.0
1(0
.01762)
0.0
00.0
0000
1.0
10.0
0189
49
32 I
nte
rr T
rans
Blo
ck 1
8,7
79,3
32
0.0
00.0
0000
0.0
00.0
0000
0.0
00.0
0000
50
Blo
ck 2
15,6
89,2
49
0.0
00.0
0000
0.0
00.0
0000
0.0
00.0
0000
51
Blo
ck 3
11,3
06,6
95
0.0
00.0
0000
0.0
00.0
0000
0.0
00.0
0000
52
Blo
ck 4
28,4
29,0
84
0.0
00.0
0000
0.0
00.0
0000
0.0
00.0
0000
53
Blo
ck 5
56,0
35,5
39
0.0
00.0
0000
0.0
00.0
0000
0.0
00.0
0000
54
Blo
ck 6
78,2
78,6
46
0.0
00.0
0000
0.0
00.0
0000
0.0
00.0
0000
55
33
00.0
00.0
0000
0.0
00.0
0000
0.0
00.0
0000
56
57
TO
TALS
962,8
59,6
86
683,9
17,8
44
(0.0
1762)
625,9
43,3
83
0.0
1484
57,9
74,4
61
0.0
0189
NW
N 2
015-1
6 P
GA
Ore
gon r
ate
dev
elopm
ent
file
August
fil
ing.x
lsx 7
/28/2
015 1
0:1
2 A
M
All
oca
tion e
qual
¢ p
er t
her
m
Exhibit A - Supporting Materials NWN OPUC Advice No. 15-12/UG ____
Page 2 of 13
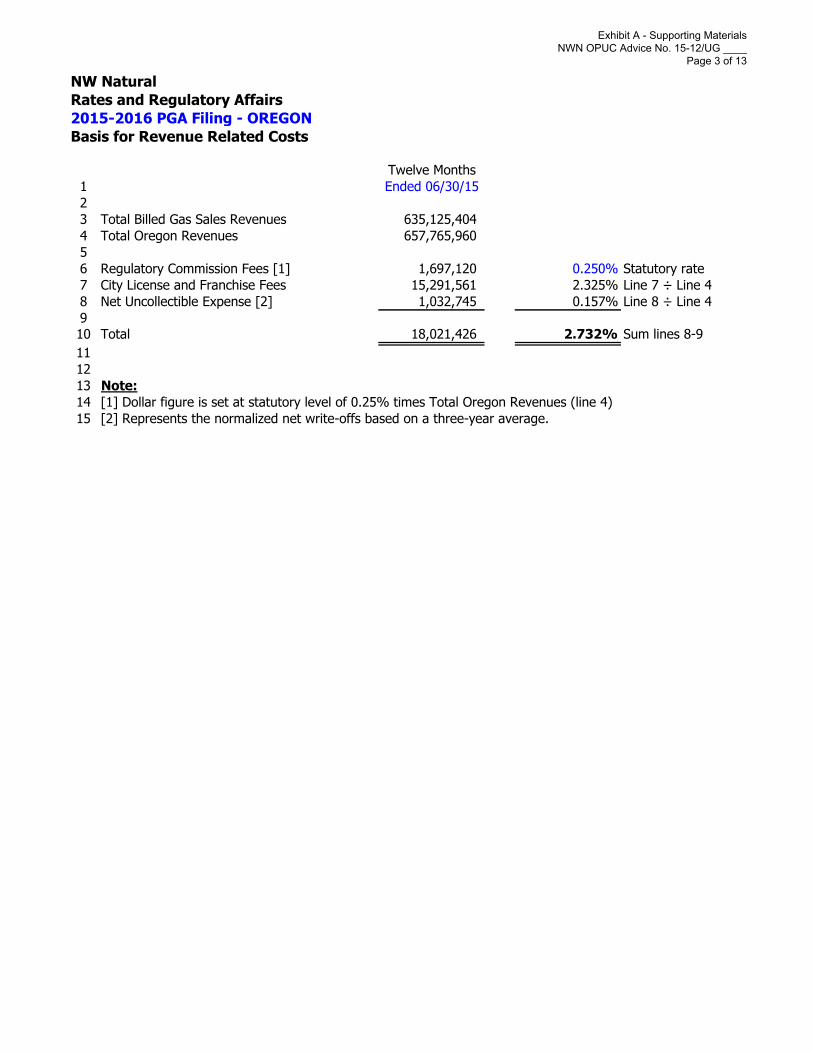
NW Natural
Rates and Regulatory Affairs
2015-2016 PGA Filing - OREGON
Basis for Revenue Related Costs
Twelve Months
1 Ended 06/30/15
2
3 Total Billed Gas Sales Revenues 635,125,404
4 Total Oregon Revenues 657,765,960
5
6 Regulatory Commission Fees [1] 1,697,120 0.250% Statutory rate
7 City License and Franchise Fees 15,291,561 2.325% Line 7 ÷ Line 4
8 Net Uncollectible Expense [2] 1,032,745 0.157% Line 8 ÷ Line 4
9
10 Total 18,021,426 2.732% Sum lines 8-9
11
12
13 Note:
14 [1] Dollar figure is set at statutory level of 0.25% times Total Oregon Revenues (line 4)
15 [2] Represents the normalized net write-offs based on a three-year average.
Exhibit A - Supporting Materials NWN OPUC Advice No. 15-12/UG ____
Page 3 of 13

NW
Na
tura
l
Ra
tes &
Re
gu
lato
ry A
ffa
irs
20
15
-20
16
PG
A F
ilin
g -
Au
gu
st
Fil
ing
Su
mm
ary
of
De
ferr
ed
Acco
un
ts I
nclu
de
d i
n t
he
PG
AT
ota
l
Esti
ma
ted
Esti
ma
ted
Ju
l-O
ct
Esti
ma
ted
In
tere
st
Ra
teIn
tere
st
Am
ou
nt
for
Am
ou
nts
Am
ou
nts
Ba
lan
ce
Esti
ma
ted
Ju
l-O
ct
Ba
lan
ce
Du
rin
gD
uri
ng
(Re
fun
d)
or
Ex
clu
de
d f
rom
In
clu
de
d i
n
Acco
un
t6
/3
0/2
01
5A
dju
stm
en
tA
cti
vit
yIn
tere
st
10
/3
1/2
01
5A
mo
rtiz
ati
on
Am
ort
iza
tio
nC
oll
ecti
on
PG
A F
ilin
gP
GA
Fil
ing
AB
CD
EF
G1
G2
HI
J
F =
sum
B t
hru
E1
.93
%H
= F
+ G
2E
xcl.
Rev S
en
s
23
Mis
ce
lla
ne
ou
s A
mo
rtiz
ati
on
s
24
254309 A
MO
RT S
IP C
OS R
ESER
VE
(173,7
41)
88,3
97
(819)
(86,1
63)
1.9
3%
(903)
(87,0
66)
incl
ude in 1
86XXX S
ch 1
78 A
dj
0
25
26
186232 D
EFER
IN
DU
STR
IAL D
SM
(M
ar
14 -
Feb 1
5 a
ctiv
ity o
nly
)3,2
26,0
86
00
3,2
26,0
86
27
186233 A
MO
R I
ND
USTR
IAL D
SM
384,0
97
(490,2
99)
938
(105,2
64)
28
Subto
tal
3,6
10,1
83
(490,2
99)
938
3,1
20,8
22
1.9
3%
32,7
22
3,1
53,5
44
3,1
53
,54
4
29
30
254315 P
RO
PER
TY S
ALES A
MO
RT
(6,4
05)
(1
5,4
04)
(75)
(21,8
83)
1.9
3%
(229)
(22,1
12)
incl
ude in 1
86XXX S
ch 1
78 A
dj
0
31
32
186307 A
MR
AM
ORT
5,2
63
1,3
66
34
6,6
63
1.9
3%
70
6,7
33
incl
ude in 1
86XXX S
ch 1
78 A
dj
0
33
34
191031 W
ORKIN
G G
AS D
EFER
RAL A
MO
RT
31,1
03
7,3
76
202
38,6
81
1.9
3%
406
39,0
87
incl
ude in 1
86XXX S
ch 1
78 A
dj
0
35
36
186XXX S
chedule
178 R
esi
dual Adju
stm
ents
resi
dual bala
nce
s fo
r 254315, 186307, 191031, and 2
54309
(63
,35
8)
37
38
Ga
s C
ost
De
ferr
als
an
d A
mo
rtiz
ati
on
s
39
191401 A
MO
RTIZ
E O
REG
ON
WACO
G6,0
97,8
89
(3,6
78,9
27)
27,0
60
2,4
46,0
21
40
191405 P
OST-C
AR
RY W
ELL D
EFER
RAL
525,5
92
013,7
63
539,3
56
41
191400 W
ACO
G -
ACCR
UE O
REG
ON
(14,2
10,9
31)
0(3
72,1
36)
(14,5
83,0
67)
42
Subto
tal
(7,5
87,4
50)
0(3
,678,9
27)
(331,3
13)
(11,5
97,6
90)
1.9
3%
(121,6
01)
(11,7
19,2
91)
(11
,71
9,2
91
)
43
44
45
46
191411 A
MO
RTIZ
E D
EM
AN
D O
REG
ON
(1,4
64,4
48)
763,6
79
(6,8
44)
(707,6
12)
47
191410 D
EM
AN
D -
ACCR
UE O
REG
ON
(4,3
02,0
08)
0(1
12,6
55)
(4,4
14,6
63)
48
191417
DEM
AN
D -
ACCR
UE C
OO
S B
AY
101,6
00
00
101,6
00
49
191450 O
REG
ON
DEM
AN
D A
CCR
UE V
OLU
ME
13,7
10,3
39
0359,0
28
14,0
69,3
67
50
Subto
tal
8,0
45,4
84
0763,6
79
239,5
28
9,0
48,6
92
1.9
3%
94,8
75
9,1
43,5
67
9,1
43
,56
751
52
53
GR
AN
D T
OT
AL
25
,04
0,0
94
(4,4
25
,49
9)
40
8,3
50
21
,02
2,9
45
21
,24
3,3
72
21
,24
3,3
72
Prop
osed
Tem
ps O
rego
n 20
15-2
016
PGA
Augu
st fi
ling.
xlsx
7/2
8/20
15 9
:02
AMfo
r PG
A
Exhibit A - Supporting Materials NWN OPUC Advice No. 15-12/UG ____
Page 4 of 13

Com
pany
:N
orth
wes
t N
atur
al G
as C
ompa
nySt
ate:
Ore
gon
Des
crip
tion:
Core
Mar
ket
Com
mod
ity g
as c
ost
defe
rral
Acco
unt
Num
ber:
1914
00D
ocke
t U
M 1
496
Curr
ent
reau
thor
izat
ion
to d
efer
was
gra
nted
in O
rder
No.
13-
365
Nar
rativ
e:D
efer
ral o
f cu
stom
er's
sha
re o
f th
e di
ffer
ence
bet
wee
n ac
tual
cor
e co
mm
odity
cos
t in
curr
ed a
nd t
he A
nnua
l Sal
es W
ACO
Gem
bedd
ed a
s de
fined
in t
he r
elat
ed a
nnua
l PG
A. F
rom
Nov
09
forw
ard
the
defe
rral
ele
ctio
n is
90%
.
1D
ebit
(C
redi
t)D
efer
ral
2Co
mm
odity
Stor
age
Hed
gePl
us I
nt.
3M
onth
/Yea
r N
ote
Def
erra
lIn
tere
stIn
tere
st R
ate
Adiu
stm
ent
Adju
stm
ent
Tran
sfer
Activ
ityG
L Ba
lanc
e4
(a)
(b)
(d)
(e)
(f)
(g)
(h)
(i)(j
)(k
)5 6
Begi
nnin
g Ba
l90
Nov
-13
1(1
,018
,327
)(3
,307
)7.
78%
(1,7
78)
02,
453,
528
1,43
0,11
6
(1,0
23,4
12)
91
Dec
-13
2,37
0,20
91,
040
7.78
%(2
,701
)0
2,36
8,54
8
1,34
5,13
6
92
Jan-
1411
1,63
79,
075
7.78
%(2
,527
)0
118,
185
1,46
3,32
0
93
Feb-
148,
008,
055
35,4
397.
78%
(2,2
75)
08,
041,
219
9,
504,
540
94M
ar-1
47,
058,
076
84,4
967.
78%
(1,4
81)
07,
141,
091
16
,645
,631
95
Apr-
1425
,070
107,
997
7.78
%(1
,175
)0
131,
892
16,7
77,5
22
96M
ay-1
41,
344,
869
113,
132
7.78
%(6
39)
01,
457,
362
18
,234
,884
97
Jun-
141,
214,
886
122,
159
7.78
%(5
79)
01,
336,
466
19
,571
,351
98
Jul-1
484
0,72
712
9,61
17.
78%
(455
)0
969,
883
20,5
41,2
34
99Au
g-14
1,27
4,84
913
7,30
77.
78%
(446
)0
1,41
1,71
0
21,9
52,9
44
100
Sep-
1419
5,30
314
2,96
07.
78%
(477
)0
337,
786
22,2
90,7
29
101
Oct
-14
277,
661
145,
416
7.78
%(7
57)
0(3
7)42
2,28
3
22
,713
,012
10
2N
ov-1
41
941,
419
19,9
947.
78%
(7,3
83)
(21,
218)
(20,
085,
459)
(19,
152,
646)
3,56
0,36
6
10
3D
ec-1
4(1
,096
,163
)19
,345
7.78
%(8
,370
)(4
8,63
5)(1
,133
,823
)
2,
426,
543
104
Jan-
15(3
,864
,444
)3,
058
7.78
%(8
,464
)(3
6,74
9)(3
,906
,599
)
(1
,480
,056
)
105
Feb-
15(2
,693
,034
)(1
8,41
7)7.
78%
(5,9
05)
(22,
227)
(2,7
39,5
83)
(4,2
19,6
38)
10
6M
ar-1
5(3
,753
,477
)(3
9,54
8)7.
78%
(5,1
38)
(2,0
63)
(3,8
00,2
26)
(8,0
19,8
64)
10
7Ap
r-15
(3,3
22,6
26)
(62,
800)
7.78
%(4
,806
)(5
,519
)(3
,395
,750
)
(1
1,41
5,61
4)
108
May
-15
(1,1
54,5
40)
(77,
770)
7.78
%(2
,946
)(1
,941
)2
(1,2
37,1
95)
(12,
652,
809)
10
9Ju
n-15
2(1
,466
,735
)(8
6,80
8)7.
78%
(1,9
12)
(648
)(2
,018
)(1
,558
,122
)
(1
4,21
0,93
1)
114
115
His
tory
tru
nca
ted
for
ease
of
view
ing
116
117
NO
TES:
118
1 -
Tran
sfer
Jun
e ba
lanc
e pl
us J
uly-
Oct
ober
inte
rest
on
June
bal
ance
to
acco
unt
1914
01 f
or a
mor
tizat
ion
119
2 -
Tran
sfer
incl
udes
one
-tim
e ad
just
men
t fo
r tr
ue-u
p to
end
ing
GL
bala
nce
Exhibit A - Supporting Materials NWN OPUC Advice No. 15-12/UG ____
Page 5 of 13
Com
pany
:N
orth
wes
t N
atur
al G
as C
ompa
nySt
ate:
Ore
gon
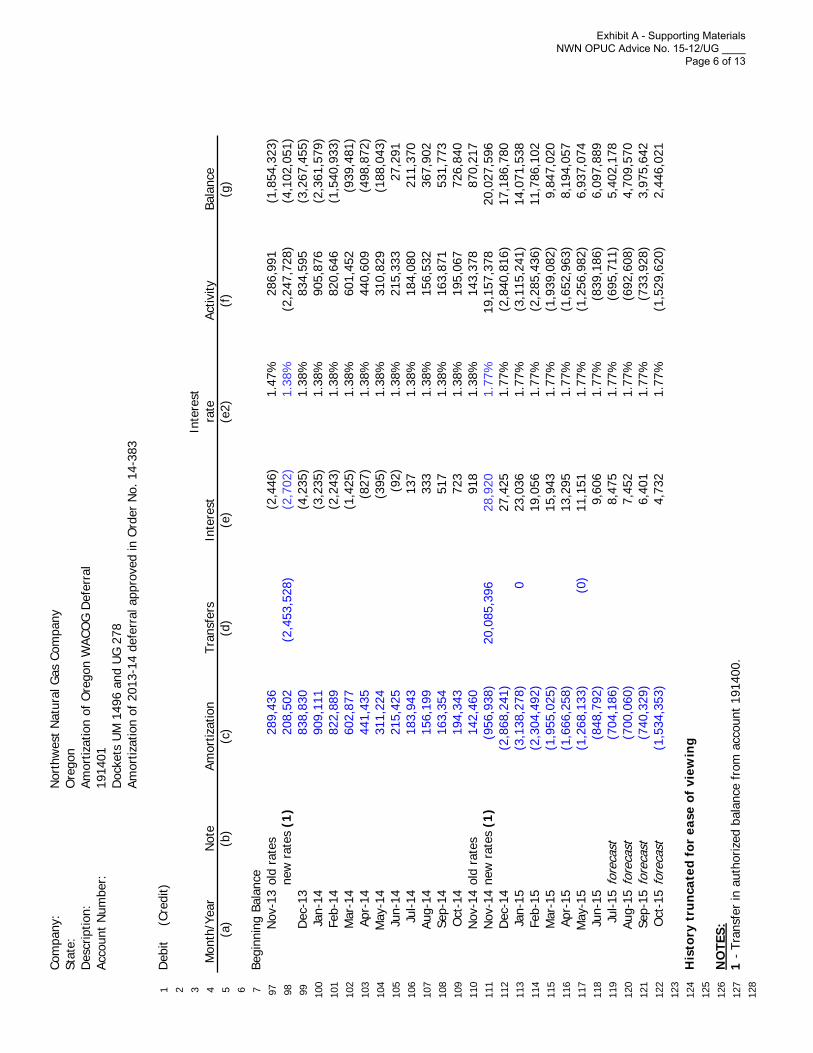
Des
crip
tion:
Amor
tizat
ion
of O
rego
n W
ACO
G D
efer
ral
Acco
unt
Num
ber:
1914
01D
ocke
ts U
M 1
496
and
UG
278
Amor
tizat
ion
of 2
013-
14 d
efer
ral a
ppro
ved
in O
rder
No.
14-
383
1D
ebit
(C
redi
t)2 3
Inte
rest
4M
onth
/Yea
r N
ote
Amor
tizat
ion
Tran
sfer
sIn
tere
stra
teAc
tivity
Bala
nce
5(a
)(b
)(c
)(d
)(e
)(e
2)(f
)(g
)6 7
Begi
nnin
g Ba
lanc
e97
Nov
-13
old
rate
s28
9,43
6(2
,446
)1.
47%
286,
991
(1,8
54,3
23)
98ne
w r
ates
(1
)20
8,50
2(2
,453
,528
)(2
,702
)1.
38%
(2,2
47,7
28)
(4,1
02,0
51)
99D
ec-1
383
8,83
0(4
,235
)1.
38%
834,
595
(3,2
67,4
55)
100
Jan-
1490
9,11
1(3
,235
)1.
38%
905,
876
(2,3
61,5
79)
101
Feb-
1482
2,88
9(2
,243
)1.
38%
820,
646
(1,5
40,9
33)
102
Mar
-14
602,
877
(1,4
25)
1.38
%60
1,45
2(9
39,4
81)
103
Apr-
1444
1,43
5(8
27)
1.38
%44
0,60
9(4
98,8
72)
104
May
-14
311,
224
(395
)1.
38%
310,
829
(188
,043
)10
5Ju
n-14
215,
425
(92)
1.38
%21
5,33
327
,291
106
Jul-1
418
3,94
313
71.
38%
184,
080
211,
370
107
Aug-
1415
6,19
933
31.
38%
156,
532
367,
902
108
Sep-
1416
3,35
451
71.
38%
163,
871
531,
773
109
Oct
-14
194,
343
723
1.38
%19
5,06
772
6,84
011
0N
ov-1
4ol
d ra
tes
142,
460
918
1.38
%14
3,37
887
0,21
711
1N
ov-1
4ne
w r
ates
(1
)(9
56,9
38)
20,0
85,3
9628
,920
1.77
%19
,157
,378
20,0
27,5
9611
2D
ec-1
4(2
,868
,241
)27
,425
1.77
%(2
,840
,816
)17
,186
,780
113
Jan-
15(3
,138
,278
)0
23,0
361.
77%
(3,1
15,2
41)
14,0
71,5
3811
4Fe
b-15
(2,3
04,4
92)
19,0
561.
77%
(2,2
85,4
36)
11,7
86,1
0211
5M
ar-1
5(1
,955
,025
)15
,943
1.77
%(1
,939
,082
)9,
847,
020
116
Apr-
15(1
,666
,258
)13
,295
1.77
%(1
,652
,963
)8,
194,
057
117
May
-15
(1,2
68,1
33)
(0)
11,1
511.
77%
(1,2
56,9
82)
6,93
7,07
411
8Ju
n-15
(848
,792
)9,
606
1.77
%(8
39,1
86)
6,09
7,88
911
9Ju
l-15
fore
cast
(704
,186
)8,
475
1.77
%(6
95,7
11)
5,40
2,17
812
0Au
g-15
fore
cast
(700
,060
)7,
452
1.77
%(6
92,6
08)
4,70
9,57
012
1Se
p-15
fore
cast
(740
,329
)6,
401
1.77
%(7
33,9
28)
3,97
5,64
212
2O
ct-1
5fo
reca
st(1
,534
,353
)4,
732
1.77
%(1
,529
,620
)2,
446,
021
123
124
His
tory
tru
nca
ted
for
ease
of
view
ing
125
126
NO
TES:
127
1 -
Tra
nsfe
r in
aut
horiz
ed b
alan
ce f
rom
acc
ount
191
400.
128
Exhibit A - Supporting Materials NWN OPUC Advice No. 15-12/UG ____
Page 6 of 13
Com
pany
:N
orth
wes
t N
atur
al G
as C
ompa
nySt
ate:
Ore
gon
Des
crip
tion:
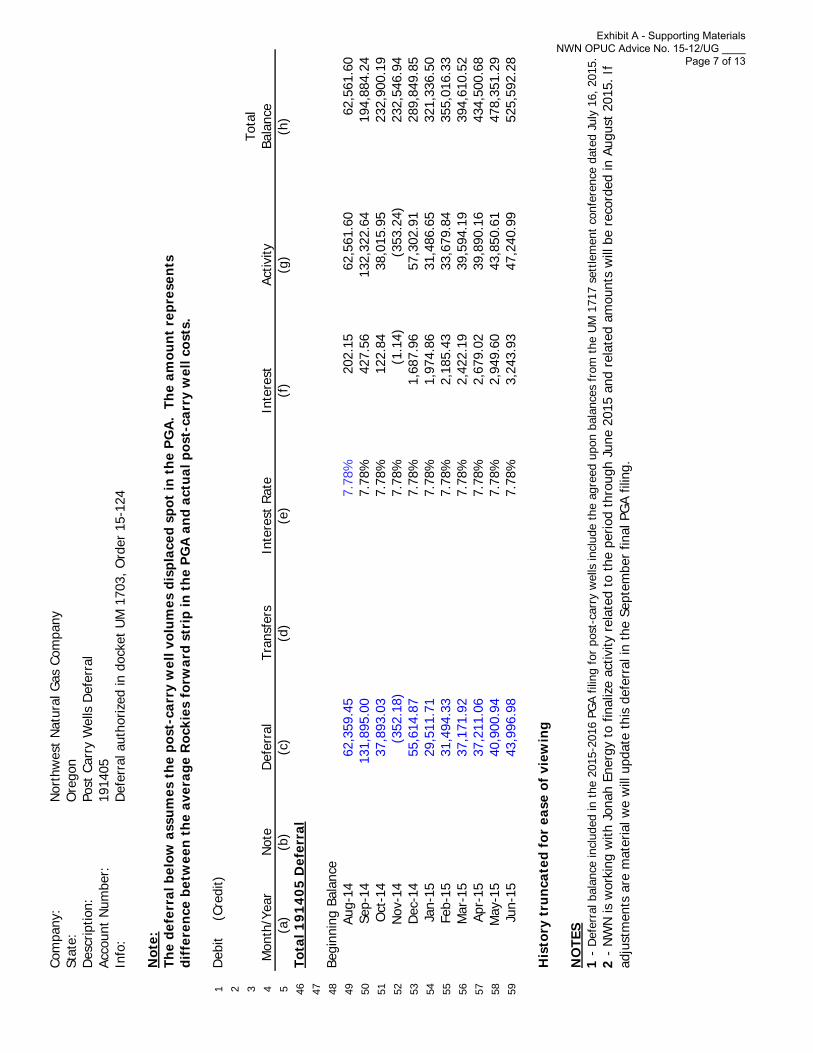
Post
Car
ry W
ells
Def
erra
lAc
coun
t N
umbe
r:19
1405
Info
:D
efer
ral a
utho
rized
in d
ocke
t U
M 1
703,
Ord
er 1
5-12
4
Not
e:Th
e de
ferr
al b
elow
ass
umes
the
pos
t-ca
rry
wel
l vol
umes
dis
plac
ed s
pot
in t
he P
GA
. Th
e am
ount
rep
rese
nts
diff
eren
ce b
etw
een
the
aver
age
Roc
kies
for
war
d st
rip
in t
he P
GA
and
act
ual p
ost-
carr
y w
ell c
osts
.
1D
ebit
(
Cred
it)2 3
Tota
l4
Mon
th/Y
ear
Not
eD
efer
ral
Tran
sfer
sIn
tere
st R
ate
Inte
rest
Activ
ityBa
lanc
e5
(a)
(b)
(c)
(d)
(e)
(f)
(g)
(h)
46To
tal 1
9140
5 D
efer
ral
47 48Be
ginn
ing
Bala
nce
49Au
g-14
62,3
59.4
57.
78%
202.
15
62,5
61.6
0
62,5
61.6
0
50Se
p-14
131,
895.
007.
78%
427.
56
132,
322.
64
19
4,88
4.24
51
Oct
-14
37,8
93.0
37.
78%
122.
84
38,0
15.9
5
232,
900.
19
52
Nov
-14
(352
.18)
7.78
%(1
.14)
(353
.24)
23
2,54
6.94
53
Dec
-14
55,6
14.8
77.
78%
1,68
7.96
57
,302
.91
289,
849.
85
54
Jan-
1529
,511
.71
7.78
%1,
974.
86
31
,486
.65
321,
336.
50
55
Feb-
1531
,494
.33
7.78
%2,
185.
43
33
,679
.84
355,
016.
33
56
Mar
-15
37,1
71.9
27.
78%
2,42
2.19
39
,594
.19
394,
610.
52
57
Apr-
1537
,211
.06
7.78
%2,
679.
02
39
,890
.16
434,
500.
68
58
May
-15
40,9
00.9
47.
78%
2,94
9.60
43
,850
.61
478,
351.
29
59
Jun-
1543
,996
.98
7.78
%3,
243.
93
47
,240
.99
525,
592.
28
His
tory
tru
ncat
ed f
or e
ase
of v
iew
ing
NO
TES
1 -
Def
erra
l bal
ance
incl
uded
in t
he 2
015-
2016
PG
A fil
ing
for
post
-car
ry w
ells
incl
ude
the
agre
ed u
pon
bala
nces
fro
m t
he U
M 1
717
sett
lem
ent
conf
eren
ce d
ated
Jul
y 16
, 201
5.2
- N
WN
is w
orki
ng w
ith J
onah
Ene
rgy
to fin
aliz
e ac
tivity
rel
ated
to
the
perio
d th
roug
h Ju
ne 2
015
and
rela
ted
amou
nts
will
be
reco
rded
in A
ugus
t 20
15. I
f ad
just
men
ts a
re m
ater
ial w
e w
ill u
pdat
e th
is d
efer
ral i
n th
e Se
ptem
ber
final
PG
A fil
ing.
Exhibit A - Supporting Materials NWN OPUC Advice No. 15-12/UG ____
Page 7 of 13

Com
pany
:N
orth
wes
t N
atur
al G
as C
ompa
nySt
ate:
Ore
gon
Des
crip
tion:
Core
Mar
ket
Dem
and
cost
def
erra
lAc
coun
t N
umbe
r:19
1410
Doc
ket
UM
149
6Cu
rren
t re
auth
oriz
atio
n to
def
er w
as g
rant
ed in
Ord
er N
o. 1
4-36
5
Nar
rativ
e:D
efer
ral o
f 10
0% o
f th
e D
iffer
ence
bet
wee
n ac
tual
dem
and
cost
incu
rred
and
the
dem
and
cost
em
bedd
ed a
s de
fined
in t
he r
elat
ed
stat
e's
annu
al P
GA.
1D
ebit
(
Cred
it)D
efer
ral
2D
eman
dPl
us I
nt.
3M
onth
/Yea
r N
ote
Def
erra
lIn
tere
stIn
tere
st R
ate
Adju
stm
ent
Tran
sfer
Activ
ityG
L Ba
lanc
e4
(a)
(b)
(c)
(d)
(e)
(f)
(g)
(h)
(I)
5 6Be
ginn
ing
Bal
90N
ov-1
31,
429
3,81
395
2
7.78
%2,
067,
411
2,
362,
176
29
4,76
6
91
Dec
-13
(162
,444
)1,
384
7.
78%
(161
,060
)
13
3,70
6
92
Jan-
14(1
92,3
72)
243
7.78
%(1
92,1
28)
(5
8,42
3)
93
Feb-
14(3
99,4
81)
(1,6
74)
7.78
%(4
01,1
55)
(4
59,5
77)
94
Mar
-14
(233
,370
)(3
,736
)
7.78
%(2
37,1
06)
(6
96,6
83)
95
Apr-
14(3
68,4
50)
(5,7
11)
7.78
%(3
74,1
61)
(1
,070
,844
)
96
May
-14
(475
,075
)(8
,483
)
7.78
%(4
83,5
57)
(1
,554
,401
)
97
Jun-
14(5
10,2
21)
(11,
732)
7.78
%(5
21,9
53)
(2
,076
,354
)
98
Jul-1
4(3
74,3
25)
(14,
675)
7.78
%(3
89,0
00)
(2
,465
,354
)
99
Aug-
14(5
21,1
50)
(17,
673)
7.78
%(5
38,8
23)
(3
,004
,178
)
10
0Se
p-14
(506
,271
)(2
1,11
8)
7.78
%(5
27,3
89)
(3
,531
,567
)
10
1O
ct-1
4(5
51,1
51)
(24,
683)
7.78
%(2
)
(575
,836
)
(4
,107
,403
)
10
2N
ov-1
41
(1,1
52,3
18)
(16,
682)
7.78
%1,
850,
024
681,
024
(3,1
65,9
76)
10
3D
ec-1
4(1
08,5
41)
(20,
878)
7.78
%(1
29,4
18)
(3
,295
,394
)
10
4Ja
n-15
(137
,525
)(2
1,81
1)
7.78
%(1
59,3
36)
(3
,454
,730
)
10
5Fe
b-15
(144
,116
)(2
2,86
5)
7.78
%(1
66,9
81)
(3
,621
,712
)
10
6M
ar-1
5(9
8,57
8)(2
3,80
0)
7.78
%(1
22,3
79)
(3
,744
,090
)
10
7Ap
r-15
(142
,781
)(2
4,73
7)
7.78
%(1
67,5
18)
(3
,911
,608
)
10
8M
ay-1
5(1
74,7
69)
(25,
927)
7.78
%0
(200
,695
)
(4
,112
,304
)
10
9Ju
n-15
(162
,516
)(2
7,18
8)
7.78
%(1
89,7
04)
(4
,302
,008
)
11
4H
isto
ry t
runc
ated
for
eas
e of
vie
win
g11
511
6N
OTE
S11
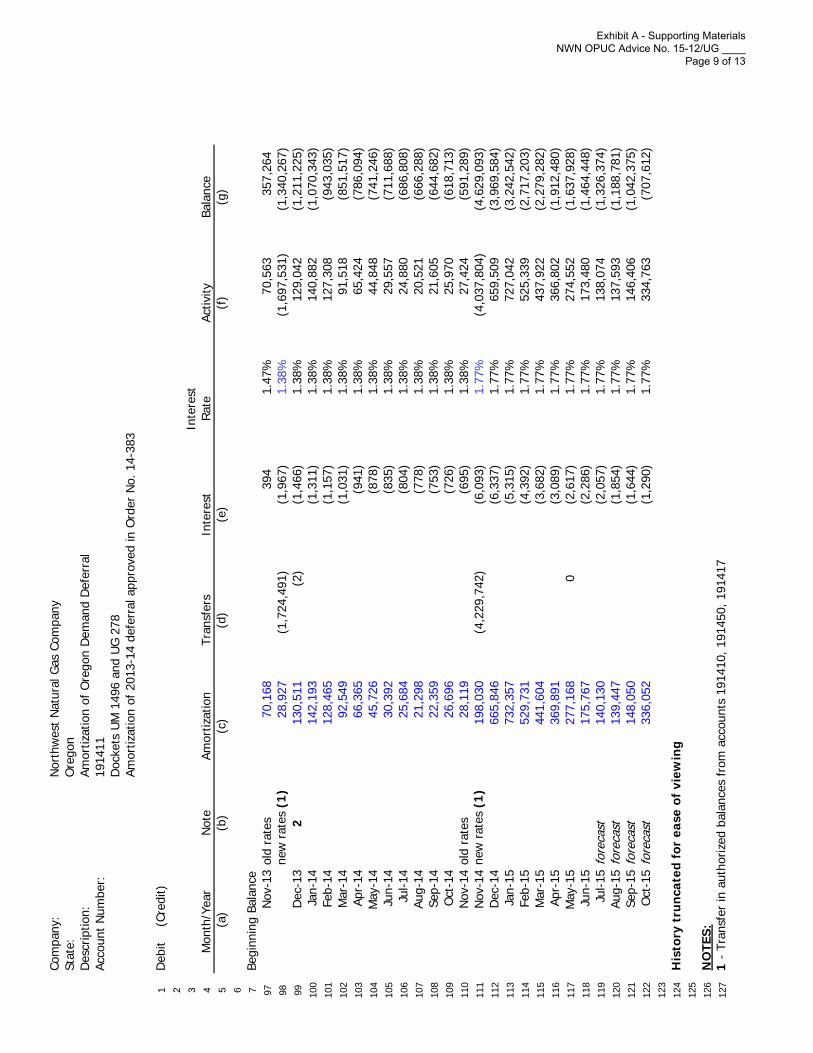
71
-Tra
nsfe
r Ju
ne b
alan
ce p
lus
July
-Oct
ober
inte
rest
on
June
bal
ance
to
acco
unt
1914
11 for
am
ortiz
atio
n
Exhibit A - Supporting Materials NWN OPUC Advice No. 15-12/UG ____
Page 8 of 13
Com
pany
:N
orth
wes
t N
atur
al G
as C
ompa
nySt
ate:
Ore
gon
Des
crip
tion:
Amor
tizat
ion
of O
rego
n D
eman
d D
efer
ral
Acco
unt
Num
ber:
1914
11D
ocke
ts U
M 1
496
and
UG
278
Amor
tizat
ion
of 2
013-
14 d
efer
ral a
ppro
ved
in O
rder
No.
14-
383
1D
ebit
(C
redi
t)2 3
Inte
rest
4M
onth
/Yea
r N
ote
Amor
tizat
ion
Tran
sfer
sIn
tere
stRa
teAc
tivity
Bala
nce
5(a
)(b
)(c
)(d
)(e
)(f
)(g
)6 7
Begi
nnin
g Ba
lanc
e97
Nov
-13
old
rate
s70
,168
394
1.47
%70
,563
357,
264
98ne
w r
ates
(1)
28,9
27(1
,724
,491
)
(1,9
67)
1.38
%(1
,697
,531
)(1
,340
,267
)99
Dec
-13
213
0,51
1(2
)
(1
,466
)1.
38%
129,
042
(1,2
11,2
25)
100
Jan-
1414
2,19
3(1
,311
)1.
38%
140,
882
(1,0
70,3
43)
101
Feb-
1412
8,46
5(1
,157
)1.
38%
127,
308
(943
,035
)10
2M
ar-1
492
,549
(1,0
31)
1.38
%91
,518
(851
,517
)10
3Ap
r-14
66,3
65(9
41)
1.38
%65
,424
(786
,094
)10
4M
ay-1
445
,726
(878
)1.
38%
44,8
48(7
41,2
46)
105
Jun-
1430
,392
(835
)1.
38%
29,5
57(7
11,6
88)
106
Jul-1
425
,684
(804
)1.
38%
24,8
80(6
86,8
08)
107
Aug-
1421
,298
(778
)1.
38%
20,5
21(6
66,2
88)
108
Sep-
1422
,359
(753
)1.
38%
21,6
05(6
44,6
82)
109
Oct
-14
26,6
96(7
26)
1.38
%25
,970
(618
,713
)11
0N
ov-1
4ol
d ra
tes
28,1
19(6
95)
1.38
%27
,424
(591
,289
)11
1N
ov-1
4ne
w r
ates
(1)
198,
030
(4,2
29,7
42)
(6
,093
)1.
77%
(4,0
37,8
04)
(4,6
29,0
93)
112
Dec
-14
665,
846
(6,3
37)
1.77
%65
9,50
9(3
,969
,584
)11
3Ja
n-15
732,
357
(5,3
15)
1.77
%72
7,04
2(3
,242
,542
)11
4Fe
b-15
529,
731
(4,3
92)
1.77
%52
5,33
9(2
,717
,203
)11
5M
ar-1
544
1,60
4(3
,682
)1.
77%
437,
922
(2,2
79,2
82)
116
Apr-
1536
9,89
1(3
,089
)1.
77%
366,
802
(1,9
12,4
80)
117
May
-15
277,
168
0
(2
,617
)1.
77%
274,
552
(1,6
37,9
28)
118
Jun-
1517
5,76
7(2
,286
)1.
77%
173,
480
(1,4
64,4
48)
119
Jul-1
5fo
reca
st14
0,13
0(2
,057
)1.
77%
138,
074
(1,3
26,3
74)
120
Aug-
15fo
reca
st13
9,44
7(1
,854
)1.
77%
137,
593
(1,1
88,7
81)
121
Sep-
15fo
reca
st14
8,05
0(1
,644
)1.
77%
146,
406
(1,0
42,3
75)
122
Oct
-15
fore
cast
336,
052
(1,2
90)
1.77
%33
4,76
3(7
07,6
12)
123
124
His
tory
tru
ncat
ed f
or e
ase
of v
iew
ing
125
126
NO
TES:
127
1 -
Tran
sfer
in a
utho
rized
bal
ance
s fr
om a
ccou
nts
1914
10, 1
9145
0, 1
9141
7
Exhibit A - Supporting Materials NWN OPUC Advice No. 15-12/UG ____
Page 9 of 13

Com
pany
:N
orth
wes
t N
atur
al G
as C
ompa
nySt
ate:
Ore
gon
Des
crip
tion:
Coos
Cou
nty
Dem
and
Acco
unt
Num
ber:
1914
17Cl
ass
of C
usto
mer
s:Co
reD
ocke
t U
M 1
179
Ord
er 0
4-70
2
Nar
rativ
e:D
efer
ral o
f tr
ansp
orta
tion
char
ge p
ayab
le b
y N
W N
atur
al for
use
of th
e na
tura
l gas
tran
smis
sion
pip
elin
e ow
ned
by C
oos
Coun
ty.
1D
ebit
(
Cred
it)2 3 4
Mon
th/Y
ear
Not
eD
efer
ral
Adju
stm
ent
Tran
sfer
Inte
rest
Activ
ityBa
lanc
e5 6
Begi
nnin
g Ba
l90
Nov
-13
121
,683
(6,6
44)
(146
,831
)(1
31,7
92)
15,0
3991
Dec
-13
21,6
83(1
1,70
2)9,
981
25,0
2092
Jan-
1421
,683
(9,4
56)
12,2
2737
,246
93Fe
b-14
17,0
48(8
,723
)8,
325
45,5
7194
Mar
-14
217
,048
(129
,796
)(1
12,7
48)
(67,
177)
95Ap
r-14
17,0
48(5
,827
)11
,221
(55,
956)
96M
ay-1
417
,048
(8,7
80)
8,26
8(4
7,68
8)97
Jun-
1417
,048
(5,9
84)
11,0
64(3
6,62
4)
98Ju
l-14
17,0
48(5
,725
)11
,323
(25,
302)
99Au
g-14
17,0
48(5
,410
)11
,638
(13,
664)
100
Sep-
1417
,049
(5,3
00)
11,7
50(1
,914
)10
1O
ct-1
417
,048
(5,2
83)
11,7
659,
851
102
Nov
-14
117
,048
(7,8
23)
36,6
2445
,849
55,7
0010
3D
ec-1
417
,048
(9,0
81)
7,96
863
,667
104
Jan-
1517
,048
(7,4
52)
9,59
673
,263
105
Feb-
1516
,636
(24,
493)
(7,8
57)
65,4
0610
6M
ar-1
516
,636
(9,1
12)
7,52
472
,930
107
Apr-
1516
,636
(8,1
28)
8,50
881
,438
108
May
-15
16,6
36(6
,941
)9,
695
91,1
3310
9Ju
n-15
16,6
36(6
,169
)10
,467
101,
600
114
His
tory
tru
ncat
ed f
or e
ase
of v
iew
ing
115
116
NO
TES
117
1 -T
rans
fer
June
bal
ance
bal
ance
to
acco
unt
1914
11 for
am
ortiz
atio
n
Exhibit A - Supporting Materials NWN OPUC Advice No. 15-12/UG ____
Page 10 of 13

Com
pany
:N
orth
wes
t N
atur
al G
as C
ompa
nySt
ate:
Ore
gon
Des
crip
tion:
Core
Mar
ket
Dem
and
Colle
ctio
n D
efer
ral
Acco
unt
Num
ber:
1914
50D
ocke
t U
M 1
496
Curr
ent
reau
thor
izat
ion
to d
efer
was
gra
nted
in O
rder
No.
14-
365
Nar
rativ
e:D
efer
ral o
f 10
0% o
f th
e di
ffer
ence
bet
wee
n ac
tual
dem
and
cost
sco
llect
ed a
nd t
he s
easo
naliz
ed im
bedd
ed d
eman
d co
sts
as d
efin
edin
the
sta
te's
ann
ual P
GA.
1D
ebit
(
Cred
it)D
efer
ral
2D
eman
dPl
us I
nt.
3M
onth
/Yea
r N
ote
Def
erra
lIn
tere
stIn
tere
st R
ate
Tran
sfer
Activ
ityG
L Ba
lanc
e4
(a)
(b)
(d)
(e)
(f)
(g)
(i)(j
)5 6
Begi
nnin
g Ba
l90
Nov
-13
1(3
28,2
75)
(1,0
64)
7.78
%(1
96,0
89)
(525
,427
)(3
29,3
39)
91D
ec-1
3(1
,282
,369
)(6
,292
)7.
78%
(1,2
88,6
61)
(1,6
18,0
00)
92Ja
n-14
(864
,778
)(1
3,29
3)7.
78%
(878
,071
)(2
,496
,071
)93
Feb-
14(1
,999
,668
)(2
2,66
5)7.
78%
(2,0
22,3
33)
(4,5
18,4
04)
94M
ar-1
41,
311,
653
(25,
042)
7.78
%1,
286,
611
(3,2
31,7
93)
95Ap
r-14
369,
268
(19,
756)
7.78
%34
9,51
2(2
,882
,281
)96
May
-14
1,00
2,14
9(1
5,43
8)7.
78%
986,
711
(1,8
95,5
70)
97Ju
n-14
(374
,228
)(1
3,50
3)7.
78%
(387
,731
)(2
,283
,301
)98
Jul-1
458
,809
(14,
613)
7.78
%44
,197
(2,2
39,1
04)
99Au
g-14
47,7
09(1
4,36
2)7.
78%
33,3
47(2
,205
,757
)10
0Se
p-14
107,
662
(13,
952)
7.78
%93
,710
(2,1
12,0
47)
101
Oct
-14
1,64
8,66
5(8
,349
)7.
78%
(1)
1,64
0,31
5(4
71,7
32)
102
Nov
-14
11,
232,
252
16,1
277.
78%
2,34
3,09
33,
591,
472
3,11
9,74
010
3D
ec-1
42,
325,
178
27,7
647.
78%
2,35
2,94
15,
472,
682
104
Jan-
151,
638,
415
40,7
927.
78%
1,67
9,20
87,
151,
889
105
Feb-
152,
512,
045
54,5
117.
78%
2,56
6,55
69,
718,
446
106
Mar
-15
2,35
5,01
870
,642
7.78
%2,
425,
660
12,1
44,1
0610
7Ap
r-15
463,
254
80,2
367.
78%
543,
490
12,6
87,5
9610
8M
ay-1
558
7,34
384
,162
7.78
%(1
)67
1,50
313
,359
,099
109
Jun-
1526
3,77
487
,467
7.78
%35
1,24
013
,710
,339
114
His
tory
tru
ncat
ed f
or e
ase
of v
iew
ing
115
117
1 -T
rans
fer
June
bal
ance
plu
s Ju
ly-O
ctob
er in
tere
st o
n Ju
ne b
alan
ce t
o ac
coun
t 19
1411
for
am
ortiz
atio
n
Exhibit A - Supporting Materials NWN OPUC Advice No. 15-12/UG ____
Page 11 of 13

NW
Na
tura
l
Ra
tes &
Re
gu
lato
ry A
ffa
irs
20
15
-16
PG
A -
Ore
go
n:
Au
gu
st
Fil
ing
Ca
lcu
lati
on
of
Incre
me
nts
All
oca
ted
on
th
e E
QU
AL P
ER
CE
NT
AG
E O
F M
AR
GIN
BA
SIS
ALL V
OLU
MES I
N T
HERM
S
1Bill
ing
WACO
G &
Tem
ps
from
2O
regon P
GA
Rate
fro
mD
em
and fro
mTem
pora
ryPro
pose
d A
mount:
231,2
27
PERM
AN
EN
T I
ncr
em
ent
3Volu
mes
page,
Rate
s page,
Rate
s page,
Incr
em
ent
page,
MA
RG
INVolu
metr
icC
usto
me
rT
ota
lRevenue S
ensi
tive M
ultip
lier:
N/A
rev s
ensi
tive fact
or
is b
uilt
in
4Colu
mn F
Colu
mn A
Colu
mn B
+C+
D*
Colu
mn A
Ra
teM
arg
inC
ha
rge
Cu
sto
me
rsM
arg
inAm
ount
to A
mort
ize:
23
1,2
27
to a
ll cl
ass
es
and s
chedule
s
5E
=B
-C-D
Mu
ltip
lie
rAllo
cation t
o R
SIn
cre
me
nt
6Sch
edule
Blo
ckA
BC
DE
F =
E *
AG
HI
PQ
R
72R
365,2
85,3
06
1.0
1330
0.5
5622
0.0
2381
0.4
3327
158,2
67,1
64
$8.0
0571,2
04
213,1
02,7
48
1.0
161,0
80
0.0
0044
83C F
irm
Sale
s158,9
36,7
55
0.9
5518
0.5
5622
0.0
5288
0.3
4608
55,0
04,8
32
$15.0
056,9
28
65,2
51,8
72
1.0
49,3
22
0.0
0031
93I
Firm
Sale
s3,8
11,7
35
0.9
3199
0.5
5622
0.0
3900
0.3
3677
1,2
83,6
78
$15.0
0278
1,3
33,7
18
1.0
1,0
08
0.0
0026
10
27 D
ry O
ut
700,5
52
0.9
0927
0.5
5622
0.0
2332
0.3
2973
230,9
93
$6.0
01,5
17
340,2
17
1.0
257
0.0
0037
11
31C F
irm
Sale
sBlo
ck 1
20,7
01,7
36
0.6
9453
0.4
3383
0.0
5295
0.2
0775
7,2
08,2
00
$325.0
0903
10,7
29,9
00
1.0
8,1
11
0.0
0023
12
Blo
ck 2
15,3
17,4
97
0.6
7662
0.4
3383
0.0
5298
0.1
8981
1.0
0.0
0021
13
31C F
irm
Tra
ns
Blo
ck 1
1,0
22,4
80
0.1
7309
0.0
0000
(0.0
0072)
0.1
7381
374,4
20
$575.0
062
802,2
20
0.0
00.0
0000
14
Blo
ck 2
1,2
38,2
13
0.1
5815
0.0
0000
(0.0
0071)
0.1
5886
0.0
0.0
0000
15
31I
Firm
Sale
sBlo
ck 1
4,1
78,8
53
0.6
3779
0.4
3383
0.0
3909
0.1
6487
2,1
09,6
63
$325.0
0199
2,8
85,7
63
1.0
2,1
81
0.0
0017
16
Blo
ck 2
9,5
36,7
89
0.6
2191
0.4
3383
0.0
3911
0.1
4897
1.0
0.0
0015
17
31I
Firm
Tra
ns
Blo
ck 1
181,4
94
0.1
5988
0.0
0000
(0.0
0002)
0.1
5990
127,3
82
$575.0
08
182,5
82
0.0
00.0
0000
18
Blo
ck 2
680,6
50
0.1
4450
0.0
0000
(0.0
0001)
0.1
4451
0.0
0.0
0000
19
32C F
irm
Sale
sBlo
ck 1
26,5
67,6
26
0.5
6907
0.4
3383
0.0
3903
0.0
9621
3,2
42,7
04
$675.0
0346
6,0
45,3
04
1.0
4,5
70
0.0
0014
20
Blo
ck 2
7,8
04,0
67
0.5
5465
0.4
3383
0.0
3906
0.0
8176
1.0
0.0
0012
21
Blo
ck 3
829,0
92
0.5
3064
0.4
3383
0.0
3907
0.0
5774
1.0
0.0
0008
22
Blo
ck 4
20,7
93
0.5
0663
0.4
3383
0.0
3911
0.0
3369
1.0
0.0
0005
23
Blo
ck 5
00.4
9221
0.4
3383
0.0
3912
0.0
1926
1.0
0.0
0003
24
Blo
ck 6
00.4
8261
0.4
3383
0.0
3915
0.0
0963
1.0
0.0
0001
25
32I
Firm
Sale
sBlo
ck 1
4,6
45,4
09
0.5
6814
0.4
3383
0.0
3916
0.0
9515
983,9
60
$675.0
048
1,3
72,7
60
1.0
1,0
38
0.0
0010
26
Blo
ck 2
5,1
52,9
55
0.5
5389
0.4
3383
0.0
3918
0.0
8088
1.0
0.0
0009
27
Blo
ck 3
1,8
26,2
57
0.5
3013
0.4
3383
0.0
3921
0.0
5709
1.0
0.0
0006
28
Blo
ck 4
627,9
63
0.5
0636
0.4
3383
0.0
3922
0.0
3331
1.0
0.0
0004
29
Blo
ck 5
(0)
0.4
9210
0.4
3383
0.0
3925
0.0
1902
1.0
0.0
0002
30
Blo
ck 6
00.4
8263
0.4
3383
0.0
3924
0.0
0956
1.0
0.0
0001
31
32 F
irm
Tra
ns
Blo
ck 1
12,0
06,5
97
0.0
9488
0.0
0000
0.0
0004
0.0
9484
3,9
60,0
67
$925.0
0116
5,2
47,6
67
0.0
00.0
0000
32
Blo
ck 2
16,3
15,4
96
0.0
8064
0.0
0000
0.0
0004
0.0
8060
0.0
0.0
0000
33
Blo
ck 3
9,6
41,3
78
0.0
5697
0.0
0000
0.0
0006
0.0
5691
0.0
0.0
0000
34
Blo
ck 4
16,1
34,1
78
0.0
3327
0.0
0000
0.0
0007
0.0
3320
0.0
0.0
0000
35
Blo
ck 5
21,2
82,0
59
0.0
1906
0.0
0000
0.0
0009
0.0
1897
0.0
0.0
0000
36
Blo
ck 6
1,9
20,7
52
0.0
0959
0.0
0000
0.0
0008
0.0
0951
0.0
0.0
0000
37
32C I
nte
rr S
ale
sBlo
ck 1
5,6
86,2
22
0.5
7809
0.4
3383
0.0
4615
0.0
9811
1,5
72,2
49
$675.0
061
2,0
66,3
49
1.0
1,5
62
0.0
0010
38
Blo
ck 2
7,5
63,2
08
0.5
6339
0.4
3383
0.0
4615
0.0
8341
1.0
0.0
0008
39
Blo
ck 3
3,8
97,0
38
0.5
3889
0.4
3383
0.0
4619
0.0
5887
1.0
0.0
0006
40
Blo
ck 4
4,4
45,3
65
0.5
1438
0.4
3383
0.0
4620
0.0
3435
1.0
0.0
0003
41
Blo
ck 5
71,8
70
0.4
9967
0.4
3383
0.0
4623
0.0
1961
1.0
0.0
0002
42
Blo
ck 6
00.4
8989
0.4
3383
0.0
4622
0.0
0984
1.0
0.0
0001
43
32I
Inte
rr S
ale
sBlo
ck 1
7,1
86,2
89
0.5
7815
0.4
3383
0.0
4626
0.0
9806
2,2
01,2
08
$675.0
071
2,7
76,3
08
1.0
2,0
99
0.0
0009
44
Blo
ck 2
8,9
46,1
42
0.5
6345
0.4
3383
0.0
4626
0.0
8336
1.0
0.0
0008
45
Blo
ck 3
5,1
35,7
55
0.5
3895
0.4
3383
0.0
4629
0.0
5883
1.0
0.0
0006
46
Blo
ck 4
10,4
45,1
79
0.5
1445
0.4
3383
0.0
4630
0.0
3432
1.0
0.0
0003
47
Blo
ck 5
4,5
97,3
92
0.4
9977
0.4
3383
0.0
4633
0.0
1961
1.0
0.0
0002
48
Blo
ck 6
10.4
8997
0.4
3383
0.0
4632
0.0
0982
1.0
0.0
0001
49
32 I
nte
rr T
rans
Blo
ck 1
8,7
79,3
32
0.0
9620
0.0
0000
0.0
0004
0.0
9616
5,5
69,6
05
$925.0
085
6,5
13,1
05
0.0
00.0
0000
50
Blo
ck 2
15,6
89,2
49
0.0
8179
0.0
0000
0.0
0005
0.0
8174
0.0
0.0
0000
51
Blo
ck 3
11,3
06,6
95
0.0
5777
0.0
0000
0.0
0006
0.0
5771
0.0
0.0
0000
52
Blo
ck 4
28,4
29,0
84
0.0
3373
0.0
0000
0.0
0007
0.0
3366
0.0
0.0
0000
53
Blo
ck 5
56,0
35,5
39
0.0
1933
0.0
0000
0.0
0009
0.0
1924
0.0
0.0
0000
54
Blo
ck 6
78,2
78,6
46
0.0
0975
0.0
0000
0.0
0010
0.0
0965
0.0
0.0
0000
55
33
00.0
0554
0.0
0000
0.0
0000
0.0
0554
0$38,0
00.0
00
00.0
00.0
0000
56
57
TO
TALS
962,8
59,6
86
242,1
36,1
25
318,6
50,5
13
305,9
04,9
39
231,2
28
58
59
So
urc
es f
or
lin
e 2
ab
ove
:
60
Inp
uts
pa
ge
Lin
e 3
7
61
62
Ta
riff
Sch
ed
ule
s
63
Ra
te A
dju
stm
en
t S
ch
ed
ule
Sch
ed 1
87
64
65
Note
: Allo
cation t
o r
ate
sch
edule
s or
blo
cks
with z
ero
volu
mes
is c
alc
ula
ted o
n a
n o
vera
ll m
arg
in p
erc
enta
ge c
hange b
asi
s.
66
* S
ince
Bill
ing R
ate
s fo
r all
schedule
s above 3
1 d
o n
ot
incl
ude d
em
and, co
lum
n c
for
those
sch
edule
s is
WACO
G o
nly
Mis
t C
ap
acit
y R
eca
ll
NW
N 2
015-1
6 P
GA
Ore
gon
rat
e dev
elopm
ent
file
August
fil
ing.x
lsx 7
/29/2
015 6
:02 P
M
All
oca
tion
equal
% o
f m
argin
Exhibit A - Supporting Materials NWN OPUC Advice No. 15-12/UG ____
Page 12 of 13

NW Natural
2015-2016 PGA Filing
Recall of Mist Storage for Core
Allocation Between States
1 Revenue2 Investment Requirement3
4 Net Investment recalled for core $1,801,429 $262,6385
6
7 Allocation based on Actual Firm Sales volumes (12 mos ended 06/30/15):8
9 Oregon 528,944,984 88.04% $231,227 Amount included in PGA10 Washington 71,846,975 11.96% $31,41111 600,791,959 100.0% $262,638
Exhibit A - Supporting Materials NWN OPUC Advice No. 15-12/UG ____
Page 13 of 13

EXHIBIT B
BEFORE THE PUBLIC UTILITY COMMISSION
OF OREGON
NW NATURAL SUPPORTING MATERIALS
Purchased Gas Cost
NWN OPUC Advice No. 15-12 / UG ____
July 31, 2015

NW NATURAL EXHIBIT B
Supporting Material
Purchased Gas Cost
NWN OPUC ADVICE NO. 15-12/ UG ____
Commodity and Non-Commodity Costs Page Summary of Total Commodity Cost 1 Summary of Total Demand Charges 3 Derivation of Oregon Per Therm Non-Commodity Charges 4 Calculation of Winter WACOG 5 Derivation of Oregon Seasonalized Fixed Charges 6 Encana Gas Reserves Deal 7 Effects on Average Bill by Rate Schedule 8 Basis for Revenue Related Costs 9 PGA Effects on Revenue 10

NW
Natu
ral
2015-2
016 P
GA -
SYSTEM
: August
Fili
ng
Sum
mary
of
Tota
l Com
modity C
ost
ALL V
OLU
MES I
N T
HER
MS
SY
ST
EM
CO
ST
S
1(a
)(b
)(c
)(d
)(e
)(f
)(g
)(h
)(i)
(j)
(k)
(l)
(m)
(n)
(o)
2N
ovem
ber
Dece
mber
January
Febru
ary
Marc
hApril
May
June
July
August
Septe
mber
Oct
ober
TO
TAL
31
23
45
67
89
10
11
12
4C
OS
TS
5C
om
mo
dit
y C
ost
fro
m S
up
ply
$22,6
71,5
38
$22,0
46,8
04
$20,1
20,1
93
$16,2
32,2
19
$15,7
87,4
94
$13,9
71,7
96
$9,0
02,6
10
$5,5
08,5
37
$4,6
93,2
61
$4,6
94,8
64
$5,1
81,1
11
$12,4
20,7
82
$152,3
31,2
09
6ta
b c
om
modity
cost
fro
m s
upply
, co
lum
n c
d, lin
es
93-1
05 p
lus
7ta
b c
om
modity
cost
fro
m g
as
rese
rve, co
lum
n q
, lin
es
59-7
0
8V
olu
me
tric
Pip
eli
ne
Ch
gs
$374,3
82
$516,6
47
$470,1
14
$424,4
20
$380,2
36
$211,8
53
$148,9
17
$101,6
07
$91,1
75
$90,2
98
$95,0
73
$181,7
60
$3,0
86,4
82
9ta
b c
om
modity
cost
fro
m v
ol pip
e, co
lum
n e
, lin
e 7
8-9
0
10
Co
mm
od
ity C
ost
fro
m S
tora
ge
$1,6
98,6
70
$16,6
65,8
73
$16,7
07,1
36
$14,3
40,7
50
$9,6
73,9
62
$471,8
56
$110,3
44
$106,7
86
$110,3
44
$110,3
44
$106,7
86
$110,3
44
$60,2
13,1
95
11
tab C
om
modity
Cost
fro
m S
tora
ge, co
lum
n k
, lin
e 6
1-7
3
12
Co
mm
od
ity C
ost
fro
m G
as R
ese
rve
s$2,9
56,2
57
$3,0
33,6
42
$3,0
44,4
87
$2,7
99,6
33
$2,9
73,2
23
$2,8
53,2
85
$2,8
03,2
29
$2,7
50,5
53
$2,8
19,1
60
$2,7
15,7
59
$2,7
10,3
25
$2,7
23,3
73
$34,1
82,9
25
13
tab C
om
modity
Cost
fro
m G
as
Rese
rve, co
lum
n p
, lin
e 5
9-7
0
14
To
tal
Co
mm
od
ity C
ost
$27,7
00,8
46
$42,2
62,9
66
$40,3
41,9
30
$33,7
97,0
23
$28,8
14,9
15
$17,5
08,7
90
$12,0
65,1
00
$8,4
67,4
83
$7,7
13,9
40
$7,6
11,2
65
$8,0
93,2
95
$15,4
36,2
59
$249,8
13,8
11
15
16
VO
LU
ME
S
17
Com
modity V
olu
mes
at
Rece
ipt
Poin
ts85,1
36,3
30
78,7
70,9
50
71,4
83,8
74
58,6
82,5
49
59,1
02,6
56
63,2
79,5
86
42,5
38,3
41
27,3
06,4
88
23,7
13,9
29
23,4
30,3
57
25,1
79,6
44
53,2
32,8
30
611,8
57,5
33
18
Pip
elin
e F
uel U
se1,8
44,4
99
1,6
95,1
91
1,5
29,9
93
1,2
94,5
73
1,2
97,3
22
1,4
30,0
15
919,1
83
566,9
93
483,8
15
479,7
56
521,0
71
1,1
53,9
84
13,2
16,3
94
19
Gas
Arr
ivin
g a
t City G
ate
83,2
91,8
31
77,0
75,7
59
69,9
53,8
81
57,3
87,9
76
57,8
05,3
34
61,8
49,5
71
41,6
19,1
58
26,7
39,4
95
23,2
30,1
14
22,9
50,6
01
24,6
58,5
73
52,0
78,8
46
598,6
41,1
39
20
21
Sto
rage G
as
Withdra
wals
3,9
35,6
95
45,4
99,6
28
45,8
63,9
30
39,9
40,3
23
25,4
71,7
41
1,1
94,4
29
248,0
00
240,0
00
248,0
00
248,0
00
240,0
00
248,0
00
163,3
77,7
47
22
Pip
elin
e F
uel U
se f
or
Alb
ert
a-s
ourc
ed S
tora
ge
94,0
55
364,8
17
372,1
24
230,7
75
78,9
32
00
00
00
01,1
40,7
04
23
Sto
rage G
as
Deliv
eries
at
City G
ate
3,8
41,6
40
45,1
34,8
11
45,4
91,8
06
39,7
09,5
48
25,3
92,8
09
1,1
94,4
29
248,0
00
240,0
00
248,0
00
248,0
00
240,0
00
248,0
00
162,2
37,0
44
24
25
Tota
l G
as
At
City G
ate
(Sto
rage a
nd C
om
modity)
87,1
33,4
71
122,2
10,5
71
115,4
45,6
87
97,0
97,5
24
83,1
98,1
42
63,0
44,0
00
41,8
67,1
58
26,9
79,4
95
23,4
78,1
14
23,1
98,6
01
24,8
98,5
73
52,3
26,8
46
760,8
78,1
83
26
27
Unacc
ounte
d f
or
Gas
538,8
51
498,6
37
452,5
62
371,2
68
373,9
68
400,1
32
269,2
52
172,9
89
150,2
86
148,4
77
159,5
27
336,9
21
3,8
72,8
70
28
29
Load S
erv
ed
86,5
94,6
20
121,7
11,9
34
114,9
93,1
25
96,7
26,2
57
82,8
24,1
75
62,6
43,8
68
41,5
97,9
06
26,8
06,5
05
23,3
27,8
28
23,0
50,1
24
24,7
39,0
46
51,9
89,9
26
757,0
05,3
13
NW
N 2
015-1
6 P
GA g
as
cost
deve
lopm
ent
file
August
fili
ng.x
lsx 7
/27/2
015 1
0:4
6 A
M
Tota
l Com
modity
Sum
mary
Exhibit B - Supporting Materials NWN OPUC Advice No. 15-12/UG ____
Page 1 of 10
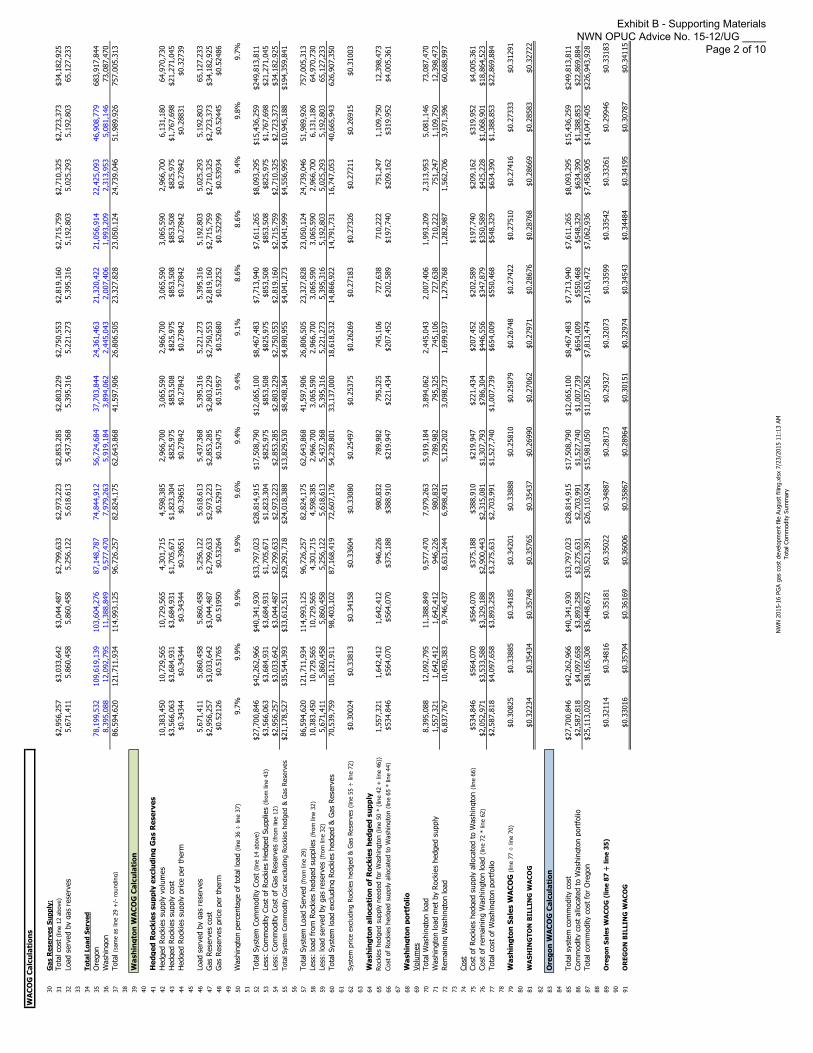
WA
CO
G C
alc
ula
tio
ns
30
Ga
s R
eserv
es S
up
ply
:
31
Tota
l co
st (
line 1
2 a
bove
)$2,9
56,2
57
$3,0
33,6
42
$3,0
44,4
87
$2,7
99,6
33
$2,9
73,2
23
$2,8
53,2
85
$2,8
03,2
29
$2,7
50,5
53
$2,8
19,1
60
$2,7
15,7
59
$2,7
10,3
25
$2,7
23,3
73
$34,1
82,9
25
32
Load s
erv
ed b
y g
as
rese
rves
5,6
71,4
11
5,8
60,4
58
5,8
60,4
58
5,2
56,1
22
5,6
18,6
13
5,4
37,3
68
5,3
95,3
16
5,2
21,2
73
5,3
95,3
16
5,1
92,8
03
5,0
25,2
93
5,1
92,8
03
65,1
27,2
33
33
34
To
tal
Lo
ad
Se
rved
35
Ore
gon
78,1
99,5
32
109,6
19,1
39
103,6
04,2
76
87,1
48,7
87
74,8
44,9
12
56,7
24,6
84
37,7
03,8
44
24,3
61,4
63
21,3
20,4
22
21,0
56,9
14
22,4
25,0
93
46,9
08,7
79
683,9
17,8
44
36
Wash
ingon
8,3
95,0
88
12,0
92,7
95
11,3
88,8
49
9,5
77,4
70
7,9
79,2
63
5,9
19,1
84
3,8
94,0
62
2,4
45,0
43
2,0
07,4
06
1,9
93,2
09
2,3
13,9
53
5,0
81,1
46
73,0
87,4
70
37
Tota
l (s
am
e a
s lin
e 2
9 +
/- r
oundin
g)
86,5
94,6
20
121,7
11,9
34
114,9
93,1
25
96,7
26,2
57
82,8
24,1
75
62,6
43,8
68
41,5
97,9
06
26,8
06,5
05
23,3
27,8
28
23,0
50,1
24
24,7
39,0
46
51,9
89,9
26
757,0
05,3
13
38
39
Wa
sh
ing
ton
WA
CO
G C
alc
ula
tio
n
40
41
He
dg
ed
Ro
ck
ies s
up
ply
ex
clu
din
g G
as R
ese
rve
s
42
Hedged R
ock
ies
supply
volu
mes
10,3
83,4
50
10,7
29,5
65
10,7
29,5
65
4,3
01,7
15
4,5
98,3
85
2,9
66,7
00
3,0
65,5
90
2,9
66,7
00
3,0
65,5
90
3,0
65,5
90
2,9
66,7
00
6,1
31,1
80
64,9
70,7
30
43
Hedged R
ock
ies
supply
cost
$3,5
66,0
63
$3,6
84,9
31
$3,6
84,9
31
$1,7
05,6
71
$1,8
23,3
04
$825,9
75
$853,5
08
$825,9
75
$853,5
08
$853,5
08
$825,9
75
$1,7
67,6
98
$21,2
71,0
45
44
Hedged R
ock
ies
supply
price
per
therm
$0.3
4344
$0.3
4344
$0.3
4344
$0.3
9651
$0.3
9651
$0.2
7842
$0.2
7842
$0.2
7842
$0.2
7842
$0.2
7842
$0.2
7842
$0.2
8831
$0.3
2739
45
46
Load s
erv
ed b
y g
as
rese
rves
5,6
71,4
11
5,8
60,4
58
5,8
60,4
58
5,2
56,1
22
5,6
18,6
13
5,4
37,3
68
5,3
95,3
16
5,2
21,2
73
5,3
95,3
16
5,1
92,8
03
5,0
25,2
93
5,1
92,8
03
65,1
27,2
33
47
Gas
Rese
rves
cost
$2,9
56,2
57
$3,0
33,6
42
$3,0
44,4
87
$2,7
99,6
33
$2,9
73,2
23
$2,8
53,2
85
$2,8
03,2
29
$2,7
50,5
53
$2,8
19,1
60
$2,7
15,7
59
$2,7
10,3
25
$2,7
23,3
73
$34,1
82,9
25
48
Gas
Rese
rves
price
per
therm
$0.5
2126
$0.5
1765
$0.5
1950
$0.5
3264
$0.5
2917
$0.5
2475
$0.5
1957
$0.5
2680
$0.5
2252
$0.5
2299
$0.5
3934
$0.5
2445
$0.5
2486
49
50
Wash
ingto
n p
erc
enta
ge o
f to
tal lo
ad (
line 3
6 ÷
lin
e 3
7)
9.7
%9.9
%9.9
%9.9
%9.6
%9.4
%9.4
%9.1
%8.6
%8.6
%9.4
%9.8
%9.7
%
51
52
Tota
l Syst
em
Com
modity C
ost
(lin
e 1
4 a
bove
)$27,7
00,8
46
$42,2
62,9
66
$40,3
41,9
30
$33,7
97,0
23
$28,8
14,9
15
$17,5
08,7
90
$12,0
65,1
00
$8,4
67,4
83
$7,7
13,9
40
$7,6
11,2
65
$8,0
93,2
95
$15,4
36,2
59
$249,8
13,8
11
53
Less
: Com
modity C
ost
of
Rock
ies
Hedged S
upplie
s (f
rom
lin
e 4
3)
$3,5
66,0
63
$3,6
84,9
31
$3,6
84,9
31
$1,7
05,6
71
$1,8
23,3
04
$825,9
75
$853,5
08
$825,9
75
$853,5
08
$853,5
08
$825,9
75
$1,7
67,6
98
$21,2
71,0
45
54
Less
: Com
modity C
ost
of
Gas
Rese
rves
(fro
m lin
e 1
2)
$2,9
56,2
57
$3,0
33,6
42
$3,0
44,4
87
$2,7
99,6
33
$2,9
73,2
23
$2,8
53,2
85
$2,8
03,2
29
$2,7
50,5
53
$2,8
19,1
60
$2,7
15,7
59
$2,7
10,3
25
$2,7
23,3
73
$34,1
82,9
25
55
Tota
l Syst
em
Com
modity C
ost
excl
udin
g R
ock
ies
hedged &
Gas
Rese
rves
$21,1
78,5
27
$35,5
44,3
93
$33,6
12,5
11
$29,2
91,7
18
$24,0
18,3
88
$13,8
29,5
30
$8,4
08,3
64
$4,8
90,9
55
$4,0
41,2
73
$4,0
41,9
99
$4,5
56,9
95
$10,9
45,1
88
$194,3
59,8
41
56
57
Tota
l Syst
em
Load S
erv
ed (
from
lin
e 2
9)
86,5
94,6
20
121,7
11,9
34
114,9
93,1
25
96,7
26,2
57
82,8
24,1
75
62,6
43,8
68
41,5
97,9
06
26,8
06,5
05
23,3
27,8
28
23,0
50,1
24
24,7
39,0
46
51,9
89,9
26
757,0
05,3
13
58
Less
: lo
ad f
rom
Rock
ies
hedged s
upplie
s (f
rom
lin
e 3
2)
10,3
83,4
50
10,7
29,5
65
10,7
29,5
65
4,3
01,7
15
4,5
98,3
85
2,9
66,7
00
3,0
65,5
90
2,9
66,7
00
3,0
65,5
90
3,0
65,5
90
2,9
66,7
00
6,1
31,1
80
64,9
70,7
30
59
Less
: lo
ad s
erv
ed b
y g
as
rese
rves
(fro
m lin
e 3
2)
5,6
71,4
11
5,8
60,4
58
5,8
60,4
58
5,2
56,1
22
5,6
18,6
13
5,4
37,3
68
5,3
95,3
16
5,2
21,2
73
5,3
95,3
16
5,1
92,8
03
5,0
25,2
93
5,1
92,8
03
65,1
27,2
33
60
Tota
l Syst
em
load e
xcl
udin
g R
ock
ies
hedged &
Gas
Rese
rves
70,5
39,7
59
105,1
21,9
11
98,4
03,1
02
87,1
68,4
19
72,6
07,1
76
54,2
39,8
01
33,1
37,0
00
18,6
18,5
32
14,8
66,9
22
14,7
91,7
31
16,7
47,0
53
40,6
65,9
43
626,9
07,3
50
61
62
Syst
em
price
excl
udin
g R
ock
ies
hedged &
Gas
Rese
rves
(lin
e 5
5 ÷
lin
e 7
2)
$0.3
0024
$0.3
3813
$0.3
4158
$0.3
3604
$0.3
3080
$0.2
5497
$0.2
5375
$0.2
6269
$0.2
7183
$0.2
7326
$0.2
7211
$0.2
6915
$0.3
1003
63
64
Wa
sh
ing
ton
all
oca
tio
n o
f R
ock
ies h
ed
ge
d s
up
ply
65
Rock
ies
hedged s
upply
needed f
or
Wash
ingto
n (
line 5
0 *
(lin
e 4
2 +
lin
e 4
6))
1,5
57,3
21
1,6
42,4
12
1,6
42,4
12
946,2
26
980,8
32
789,9
82
795,3
25
745,1
06
727,6
38
710,2
22
751,2
47
1,1
09,7
50
12,3
98,4
73
66
Cost
of
Rock
ies
hedged s
upply
allo
cate
d t
o W
ash
ingto
n (
line 6
5 *
lin
e 4
4)
$534,8
46
$564,0
70
$564,0
70
$375,1
88
$388,9
10
$219,9
47
$221,4
34
$207,4
52
$202,5
89
$197,7
40
$209,1
62
$319,9
52
$4,0
05,3
61
67
68
Wa
sh
ing
ton
po
rtfo
lio
69
Volu
mes
70
Tota
l W
ash
ingto
n load
8,3
95,0
88
12,0
92,7
95
11,3
88,8
49
9,5
77,4
70
7,9
79,2
63
5,9
19,1
84
3,8
94,0
62
2,4
45,0
43
2,0
07,4
06
1,9
93,2
09
2,3
13,9
53
5,0
81,1
46
73,0
87,4
70
71
Wash
ingto
n load m
et
by R
ock
ies
hedged s
upply
1,5
57,3
21
1,6
42,4
12
1,6
42,4
12
946,2
26
980,8
32
789,9
82
795,3
25
745,1
06
727,6
38
710,2
22
751,2
47
1,1
09,7
50
12,3
98,4
73
72
Rem
ain
ing W
ash
ingto
n load
6,8
37,7
67
10,4
50,3
83
9,7
46,4
37
8,6
31,2
44
6,9
98,4
31
5,1
29,2
02
3,0
98,7
37
1,6
99,9
37
1,2
79,7
68
1,2
82,9
87
1,5
62,7
06
3,9
71,3
96
60,6
88,9
97
73
74
Cost
75
Cost
of
Rock
ies
hedged s
upply
allo
cate
d t
o W
ash
ingto
n (
line 6
6)
$534,8
46
$564,0
70
$564,0
70
$375,1
88
$388,9
10
$219,9
47
$221,4
34
$207,4
52
$202,5
89
$197,7
40
$209,1
62
$319,9
52
$4,0
05,3
61
76
Cost
of
rem
ain
ing W
ash
ingto
n load (
line 7
2 *
lin
e 6
2)
$2,0
52,9
71
$3,5
33,5
88
$3,3
29,1
88
$2,9
00,4
43
$2,3
15,0
81
$1,3
07,7
93
$786,3
04
$446,5
56
$347,8
79
$350,5
89
$425,2
28
$1,0
68,9
01
$18,8
64,5
23
77
Tota
l co
st o
f W
ash
ingto
n p
ort
folio
$2,5
87,8
18
$4,0
97,6
58
$3,8
93,2
58
$3,2
75,6
31
$2,7
03,9
91
$1,5
27,7
40
$1,0
07,7
39
$654,0
09
$550,4
68
$548,3
29
$634,3
90
$1,3
88,8
53
$22,8
69,8
84
78
79
Wa
sh
ing
ton
Sa
les W
AC
OG
(lin
e 7
7 ÷
lin
e 7
0)
$0.3
0825
$0.3
3885
$0.3
4185
$0.3
4201
$0.3
3888
$0.2
5810
$0.2
5879
$0.2
6748
$0.2
7422
$0.2
7510
$0.2
7416
$0.2
7333
$0.3
1291
80
81
WA
SH
IN
GT
ON
BILLIN
G W
AC
OG
$0.3
2234
$0.3
5434
$0.3
5748
$0.3
5765
$0.3
5437
$0.2
6990
$0.2
7062
$0.2
7971
$0.2
8676
$0.2
8768
$0.2
8669
$0.2
8583
$0.3
2722
82
83
Ore
go
n W
AC
OG
Ca
lcu
lati
on
84
85
Tota
l sy
stem
com
modity c
ost
$27,7
00,8
46
$42,2
62,9
66
$40,3
41,9
30
$33,7
97,0
23
$28,8
14,9
15
$17,5
08,7
90
$12,0
65,1
00
$8,4
67,4
83
$7,7
13,9
40
$7,6
11,2
65
$8,0
93,2
95
$15,4
36,2
59
$249,8
13,8
11
86
Com
modity c
ost
allo
cate
d t
o W
ash
ingto
n p
ort
folio
$2,5
87,8
18
$4,0
97,6
58
$3,8
93,2
58
$3,2
75,6
31
$2,7
03,9
91
$1,5
27,7
40
$1,0
07,7
39
$654,0
09
$550,4
68
$548,3
29
$634,3
90
$1,3
88,8
53
$22,8
69,8
84
87
Tota
l co
mm
odity c
ost
for
Ore
gon
$25,1
13,0
29
$38,1
65,3
08
$36,4
48,6
72
$30,5
21,3
91
$26,1
10,9
24
$15,9
81,0
50
$11,0
57,3
62
$7,8
13,4
74
$7,1
63,4
72
$7,0
62,9
36
$7,4
58,9
05
$14,0
47,4
05
$226,9
43,9
28
88
89
Ore
go
n S
ale
s W
AC
OG
(li
ne 8
7 ÷
lin
e 3
5)
$0.3
2114
$0.3
4816
$0.3
5181
$0.3
5022
$0.3
4887
$0.2
8173
$0.2
9327
$0.3
2073
$0.3
3599
$0.3
3542
$0.3
3261
$0.2
9946
$0.3
3183
90
91
OR
EG
ON
BILLIN
G W
AC
OG
$0.3
3016
$0.3
5794
$0.3
6169
$0.3
6006
$0.3
5867
$0.2
8964
$0.3
0151
$0.3
2974
$0.3
4543
$0.3
4484
$0.3
4195
$0.3
0787
$0.3
4115
NW
N 2
015-1
6 P
GA g
as
cost
deve
lopm
ent
file
August
fili
ng.x
lsx 7
/23/2
015 1
1:1
3 A
M
Tota
l Com
modity
Sum
mary
Exhibit B - Supporting Materials NWN OPUC Advice No. 15-12/UG ____
Page 2 of 10

NW
Natu
ral
2015-2
016 P
GA -
SYSTEM
: August
Fili
ng
Sum
mary
of
Tota
l D
em
and C
harg
es
SY
ST
EM
CO
ST
S
1(a
)(b
)(c
)(d
)(e
)(f
)(g
)(h
)(i)
(j)
(k)
(l)
(m)
(n)
(o)
2N
ovem
ber
Dece
mber
January
Febru
ary
Marc
hApril
May
June
July
August
Septe
mber
Oct
ober
TO
TAL
330
31
31
29
31
30
31
30
31
31
30
31
366
4T
ran
sp
ort
ch
arg
es b
y t
ran
sp
ort
er:
5 6N
ort
hw
est
Pip
elin
e$4,2
52,0
26
$4,3
93,7
60
$4,3
93,7
60
$4,1
10,2
90
$4,3
93,7
60
$4,1
52,2
11
$4,2
90,6
18
$4,1
52,2
11
$4,2
90,6
18
$4,2
90,6
18
$4,1
52,2
11
$4,2
90,6
18
$51,1
62,7
00
7 8A
lber
ta: A
EC
O S
tora
ge67,5
86
67,5
86
67,5
86
67,5
86
67,5
86
00
00
00
0337,9
28
9 10
Alb
erta
: NO
VA
658,1
73
658,1
73
658,1
73
658,1
73
658,1
73
658,1
73
658,1
73
658,1
73
658,1
73
658,1
73
658,1
73
658,1
73
7,8
98,0
79
11
12
Alb
erta
: Foo
thills
351,3
18
351,3
18
351,3
18
351,3
18
351,3
18
313,5
80
313,5
80
313,5
80
313,5
80
313,5
80
313,5
80
351,3
18
3,9
89,3
85
13
14
Alb
erta
: GTN
540,1
36
558,1
41
501,1
45
468,8
13
501,1
45
408,1
40
421,7
45
408,1
40
421,7
45
421,7
45
408,1
40
501,1
45
5,5
60,1
80
15
16
BC
: Sou
ther
n C
ross
ing
626,5
39
646,5
24
646,5
24
606,5
55
646,5
24
626,5
39
646,5
24
626,5
39
646,5
24
646,5
24
626,5
39
646,5
24
7,6
38,3
79
17
18
BC
: Spe
ctra
(Wes
tcoa
st)
369,0
00
381,3
00
381,3
00
356,7
00
381,3
00
369,0
00
381,3
00
369,0
00
381,3
00
381,3
00
369,0
00
381,3
00
4,5
01,8
00
19
20
KB P
ipelin
e18,6
88
18,6
88
18,6
88
18,6
88
18,6
88
18,6
88
18,6
88
18,6
88
18,6
88
18,6
88
18,6
88
18,6
88
224,2
58
21
22
Tota
l Syst
em
Dem
and
$6,8
83,4
65
$7,0
75,4
89
$7,0
18,4
94
$6,6
38,1
23
$7,0
18,4
94
$6,5
46,3
31
$6,7
30,6
28
$6,5
46,3
31
$6,7
30,6
28
$6,7
30,6
28
$6,5
46,3
31
$6,8
47,7
66
$81,3
12,7
09
23
24
25
De
tail
in
fil
e "
Ca
pa
cit
y C
on
tra
ct
Mo
nth
ly S
um
ma
ry f
or
Tra
ck
er
20
15
-16
.xls
"
NW
N 2
015-1
6 P
GA g
as
cost
develo
pm
ent
file
August
fili
ng.x
lsx 7
/23/2
015 1
1:3
4 A
M
Dem
and C
harg
es
Exhibit B - Supporting Materials NWN OPUC Advice No. 15-12/UG ____
Page 3 of 10

NW Natural
2015-2016 PGA - SYSTEM: August Filing
Derivation of Oregon per therm Non-Commodity ChargesALL VOLUMES IN THERMS
Oregon Derivation of Demand Increments
1 Without WITH
2 Revenue Sensitive Revenue Sensitive
3 (a) (b) (c) (d)
4 System Demand $81,312,709
5 Oregon Allocation Factor 1/ 90.35%
6 Oregon Demand $73,466,033
7
8 Oregon Firm Sales Forecasted Normal Volumes 625,943,383
9 Oregon Interruptible Sales Forecasted Normal Volumes 57,974,461
10
11
12 Proposed Firm Demand Per Therm 2/ $0.11609 $0.11935
13 Proposed Interruptible Demand 2/ $0.01381 $0.01420
14 Proposed MDDV Demand Charge $1.73 $1.78
15
16 Current Firm Demand Per Therm $0.11899 $0.12239
17 Current Interruptible Demand $0.01415 $0.01455
18 Current MDDV Demand Charge $1.77 $1.82
19
20 Percent Change in Firm Demand -2.44%
21
22
23 1/Allocation Factor: 2013-14 PGA forecast firm sales volumes:
24 Washington Oregon System
25 Firm Sales 71,896,148 625,943,383 697,839,531
26 Interruptible Sales 1,191,322 57,974,461 59,165,782
27 Total 73,087,470 683,917,844 757,005,313
28 9.65% 90.35% 100.00%
29
30 2/Calculation of Proposed Demand Rates:
31
32 Demand change factor 0.976
33
34 Firm Demand (line 8 * line 34) $0.11609 $72,665,688
35 Interruptible Demand (line 9 * line 35) $0.01381 $800,345
36 $73,466,033
37 $0
NWN 2015-16 PGA gas cost development file August filing.xlsx 7/23/2015 11:18 AM
Derivation of Demand rates OR
Exhibit B - Supporting Materials NWN OPUC Advice No. 15-12/UG ____
Page 4 of 10

NW Natural
2015-2016 PGA - SYSTEM: August Filing
Calculation of Winter WACOGPrices are per therm
1 Forecast price for AECO gas:
2
3 AECO/NIT
4
5 November $0.24390
6 December $0.25183
7 January $0.25851
8 February $0.25841
9 March $0.25358
10 April $0.23810
11 May $0.23534
12 June $0.23736
13 July $0.23752
14 August $0.23769
15 September $0.23849
16 October $0.24871
17
18
19 Average price, November-March $0.25325 average lines 5-9
20
21 Annual average price, November-October $0.24495 average lines 5-16
22
23 Ratio of winter to annual 1.03388 line 19 ÷ line 21
24
25 Without Rev WITH Rev
26 Sensitive Sensitive
OR Oregon Annual WACOG $0.33183 $0.34115
OR Oregon Winter WACOG $0.34307 $0.35271
line 23 * $0.33183
WA Washington Annual WACOG $0.31291 $0.32722
WA Washington Winter WACOG $0.32351 $0.33830
line 23 * $0.31291
NWN 2015-16 PGA gas cost development file August filing.xlsx 7/23/2015 11:21 AM
Winter WACOG OR&WA
Exhibit B - Supporting Materials NWN OPUC Advice No. 15-12/UG ____
Page 5 of 10

NW
Na
tura
l
20
15
-20
16
PG
A -
OR
EG
ON
: O
cto
be
r Fil
ing
De
riva
tio
n o
f O
reg
on
Se
aso
na
lize
d F
ixe
d C
ha
rge
s
1N
orm
aliz
ed
Norm
aliz
ed
Firm
Firm
Dem
and
Inte
rr. D
em
and
Seaso
naliz
ed
2Resi
dential
Com
merc
ial
Indust
rial
Inte
rruptible
Incr
em
ent
Incr
em
ent
Fix
ed
3Volu
mes
Volu
mes
Volu
mes
Volu
mes
Tota
lEff
. 11/0
1/1
5Eff
. 11/0
1/1
5Charg
es
4(a
)(b
)(c
)(d
)(e
)(f
)(g
)(h
)(i)
(j)
5 6N
ovem
ber
2015
44,2
99,7
37
26,0
54,7
79
2,4
78,7
51
5,3
66,2
65
78,1
99,5
32
$0.1
1609
$0.0
1381
$8,5
30,5
06
7D
ece
mber
2015
64,8
04,5
93
36,3
07,5
24
2,9
31,4
61
5,5
75,5
61
109,6
19,1
39
$0.1
1609
$0.0
1381
$12,1
55,1
28
8Ja
nuary
2016
60,6
06,8
61
34,2
75,5
83
3,0
35,4
03
5,6
86,4
29
103,6
04,2
76
$0.1
1609
$0.0
1381
$11,4
45,5
40
9Febru
ary
2016
50,2
95,0
28
28,8
69,2
20
2,7
65,0
44
5,2
19,4
95
87,1
48,7
87
$0.1
1609
$0.0
1381
$9,5
83,0
25
10
Marc
h2016
41,9
79,3
47
24,9
85,2
30
2,5
54,6
10
5,3
25,7
25
74,8
44,9
12
$0.1
1609
$0.0
1381
$8,1
43,8
37
11
April
2016
30,0
62,2
25
18,8
96,8
16
2,4
61,6
83
5,3
03,9
60
56,7
24,6
84
$0.1
1609
$0.0
1381
$6,0
42,5
36
12
May
2016
17,9
18,8
94
12,9
80,0
24
2,2
62,9
94
4,5
41,9
32
37,7
03,8
44
$0.1
1609
$0.0
1381
$3,9
12,3
97
13
June
2016
9,3
26,7
36
8,4
92,7
06
2,1
05,7
64
4,4
36,2
57
24,3
61,4
63
$0.1
1609
$0.0
1381
$2,3
74,3
25
14
July
2016
7,2
89,8
51
7,7
55,0
38
2,2
51,6
06
4,0
23,9
27
21,3
20,4
22
$0.1
1609
$0.0
1381
$2,0
63,4
71
15
August
2016
7,2
98,6
39
7,7
54,3
36
2,1
33,4
40
3,8
70,4
99
21,0
56,9
14
$0.1
1609
$0.0
1381
$2,0
48,5
74
16
Septe
mber
2016
8,1
64,1
20
7,8
78,3
68
2,4
02,3
50
3,9
80,2
55
22,4
25,0
93
$0.1
1609
$0.0
1381
$2,1
96,1
76
17
Oct
ober
2016
23,9
39,8
28
15,9
27,9
42
2,3
96,8
53
4,6
44,1
56
46,9
08,7
79
$0.1
1609
$0.0
1381
$4,9
70,5
18
18
19
20
21
365,9
85,8
57
230,1
77,5
65
29,7
79,9
61
57,9
74,4
61
683,9
17,8
44
$73,4
66,0
33
NW
N 2
015-1
6 O
regon P
GA S
easo
naliz
ed F
ixed C
hgs
August
fili
ng.x
ls 7
/23/2
015 1
1:4
1 A
M
Exhibit B - Supporting Materials NWN OPUC Advice No. 15-12/UG ____
Page 6 of 10

NW
Nat
ura
l
20
15
-20
16
PG
A -
OR
EGO
N:
Au
gust
Fili
ng
Enca
na
Gas
Re
serv
es
De
alP
roje
cte
dP
roje
cte
dP
roje
cte
dP
roje
cte
dP
roje
cte
dP
roje
cte
dP
roje
cte
dP
roje
cte
dP
roje
cte
dP
roje
cte
dP
roje
cte
dP
roje
cte
dP
roje
cte
d
No
vem
be
rD
ece
mb
er
Jan
uar
yFe
bru
ary
Mar
chA
pri
lM
ayJu
ne
July
Au
gust
Sep
tem
be
rO
cto
be
rP
GA
20
15
20
15
20
16
20
16
20
16
20
16
20
16
20
16
20
16
20
16
20
16
20
16
Tota
ls1
The
rms
De
live
red
(0
00
s)
2To
tal T
he
rms
5,4
40
.17
5
,56
7.5
4
5,4
93
.47
5
,07
1.9
3
5,3
52
.16
5
,11
4.1
6
5,2
19
.00
4
,98
8.9
6
5,0
93
.04
5
,03
2.6
5
4,8
13
.41
4
,91
6.4
4
62
,10
2.9
4
3R
ate
pe
r Th
erm
(D
ep
leti
on
Rat
e)
0.2
60
2
0
.26
02
0.2
60
2
0
.26
02
0.2
60
2
0
.26
02
0.2
60
2
0
.26
02
0.2
60
2
0
.26
02
0.2
60
2
0
.26
02
0.2
60
2
4D
eliv
ery
Val
ue
1,4
15
.72
1
,44
8.8
6
1,4
29
.59
1
,31
9.8
9
1,3
92
.81
1
,33
0.8
8
1,3
58
.16
1
,29
8.3
0
1,3
25
.38
1
,30
9.6
7
1,2
52
.61
1
,27
9.4
3
16
,16
1.2
9
50
.26
02
6O
pe
x /
Se
vera
nce
/ A
d V
alo
rem
7O
pe
rati
ng
Co
st5
76
.92
58
3.4
3
5
80
.87
56
3.0
4
6
24
.32
56
2.9
9
5
67
.39
55
7.9
6
5
62
.92
56
0.2
5
6
00
.79
55
5.4
3
6
,89
6.3
0
8Se
vera
nce
an
d A
d V
alo
rem
Tax
es
17
6.7
3
1
95
.60
19
9.7
8
1
83
.29
18
7.7
4
1
63
.22
16
7.1
9
1
61
.87
17
2.8
8
1
69
.35
15
8.5
5
1
66
.18
2,1
02
.37
9To
tal
75
3.6
6
7
79
.03
78
0.6
5
7
46
.33
81
2.0
6
7
26
.20
73
4.5
8
7
19
.82
73
5.8
0
7
29
.60
75
9.3
4
7
21
.61
8,9
98
.67
10
0.1
44
9
11
Ave
rage
Rat
e B
ase
77
,00
2.7
3
7
6,0
58
.21
75
,14
4.6
0
7
4,2
97
.40
73
,40
6.0
4
7
2,5
52
.19
71
,68
1.8
2
7
0,8
47
.69
69
,99
7.1
6
6
9,1
56
.15
68
,34
9.6
8
6
7,5
26
.97
12
13
Car
ryin
g C
ost
14
Equ
ity
9.5
00
0%
30
4.8
0
3
01
.06
29
7.4
5
2
94
.09
29
0.5
7
2
87
.19
28
3.7
4
2
80
.44
27
7.0
7
2
73
.74
27
0.5
5
2
67
.29
15
Equ
ity
% o
f C
ap S
tru
ct5
0.0
00
0%
16
Equ
ity
Pre
tax
39
.45
89
%4
56
.33
44
4.6
2
4
36
.79
43
5.0
9
4
27
.36
42
8.0
6
4
20
.65
41
6.1
5
4
06
.77
40
1.7
1
3
99
.10
39
0.8
4
17
De
bt
6.0
56
0%
19
4.3
0
1
91
.92
18
9.6
1
1
87
.48
18
5.2
3
1
83
.07
18
0.8
8
1
78
.77
17
6.6
3
1
74
.50
17
2.4
7
1
70
.39
18
Tota
l Car
ryin
g C
ost
65
0.6
3
6
36
.54
62
6.4
1
6
22
.57
61
2.5
9
6
11
.14
60
1.5
3
5
94
.92
58
3.4
0
5
76
.22
57
1.5
7
5
61
.23
7,2
48
.74
19
0.1
16
7
20
Tota
l Co
st2
,82
0.0
1
2,8
64
.43
2
,83
6.6
5
2,6
88
.79
2
,81
7.4
6
2,6
68
.21
2
,69
4.2
6
2,6
13
.04
2
,64
4.5
8
2,6
15
.48
2
,58
3.5
2
2,5
62
.26
3
2,4
08
.70
21
Tota
l Vo
lum
e5
,44
0.1
7
5,5
67
.54
5
,49
3.4
7
5,0
71
.93
5
,35
2.1
6
5,1
14
.16
5
,21
9.0
0
4,9
88
.96
5
,09
3.0
4
5,0
32
.65
4
,81
3.4
1
4,9
16
.44
6
2,1
02
.94
22
Tota
l Rat
e P
er
The
rm0
.51
8
0.5
14
0
.51
6
0.5
30
0
.52
6
0.5
22
0
.51
6
0.5
24
0
.51
9
0.5
20
0
.53
7
0.5
21
0
.52
2
R:\
Reg
ula
tory
_Aff
airs
\PG
A -
OR
EGO
N\2
01
5\A
ugu
st F
ilin
g\G
as C
ost
Dev
elo
pm
ent\
Enca
na
Sco
reca
rd -
dra
ft P
GA
7.1
0.2
01
5.x
lsxO
PU
C
Pri
nt
dat
e: 7
/23
/20
15
Exhibit B - Supporting Materials NWN OPUC Advice No. 15-12/UG ____
Page 7 of 10

NW Natural
Rates & Regulatory Affairs
2015-16 PGA - Oregon: August Filing
Effects on Average Bill by Rate Schedule
ALL VOLUMES IN THERMS Advice 15-12
See note [8]
1 Oregon PGA Normal Proposed Proposed Proposed
2 Normalized Therms Minimum 11/1/2014 11/1/2014 11/1/2015 11/1/2015 11/1/2015
3 Volumes page, Therms in Monthly Monthly Billing Current PGA PGA PGA
4 Column D Block Average use Charge Rates Average Bill Rates Average Bill % Bill Change
5 F=D+(C * E) Z=D+(C * Y) AA = (Z - F)/F
6 Schedule Block A B C D E F Y Z AA
7 2R 365,285,306 N/A 53.0 8.00 1.01330 61.70 0.89102 55.22 -10.5%
8 3C Firm Sales 158,936,755 N/A 233.0 15.00 0.95518 237.56 0.83277 209.04 -12.0%
9 3I Firm Sales 3,811,735 N/A 1,143.0 15.00 0.93199 1,080.26 0.80953 940.29 -13.0%
10 27 Dry Out 700,552 N/A 38.0 6.00 0.91 40.55 0.78692 35.90 -11.5%
11 31C Firm Sales Block 1 20,701,736 2,000 3,324.0 325.00 0.69453 0.57508
12 Block 2 15,317,497 all additional 0.67662 0.55715
13 Total 2,609.90 2,212.83 -15.2%
14 31C Firm Trans Block 1 1,022,480 2,000 1,374.0 575.00 0.17309 0.17309
15 Block 2 1,238,213 all additional 0.15815 0.15815
16 Total 812.83 812.83 0.0%
17 31I Firm Sales Block 1 4,178,853 2,000 5,744.0 325.00 0.63779 0.51828
18 Block 2 9,536,789 all additional 0.62191 0.50238
19 Total 3,929.01 3,242.47 -17.5%
20 31I Firm Trans Block 1 181,494 2,000 8,981.0 575.00 0.15988 0.15988
21 Block 2 680,650 all additional 0.14450 0.14450
22 Total 1,903.51 1,903.51 0.0%
23 32C Firm Sales Block 1 26,567,626 10,000 8,483.0 675.00 0.56907 0.44953
24 Block 2 7,804,067 20,000 0.55465 0.43509
25 Block 3 829,092 20,000 0.53064 0.41104
26 Block 4 20,793 100,000 0.50663 0.38700
27 Block 5 0 600,000 0.49221 0.37256
28 Block 6 0 all additional 0.48261 0.36294
29 Total 5,502.42 4,488.36 -18.4%
30 32I Firm Sales Block 1 4,645,409 10,000 21,272.0 675.00 0.56814 0.44856
31 Block 2 5,152,955 20,000 0.55389 0.43430
32 Block 3 1,826,257 20,000 0.53013 0.41051
33 Block 4 627,963 100,000 0.50636 0.38672
34 Block 5 (0) 600,000 0.49210 0.37244
35 Block 6 0 all additional 0.48263 0.36296
36 Total 12,599.85 10,056.03 -20.2%
37 32 Firm Trans Block 1 12,006,597 10,000 55,532.0 925.00 0.09488 0.09488
38 Block 2 16,315,496 20,000 0.08064 0.08064
39 Block 3 9,641,378 20,000 0.05697 0.05697
40 Block 4 16,134,178 100,000 0.03327 0.03327
41 Block 5 21,282,059 600,000 0.01906 0.01906
42 Block 6 1,920,752 all additional 0.00959 0.00959
43 Total 4,810.05 4,810.05 0.0%
44 32C Interr Sales Block 1 5,686,222 10,000 29,595.0 675.00 0.57809 0.43848
45 Block 2 7,563,208 20,000 0.56339 0.42376
46 Block 3 3,897,038 20,000 0.53889 0.39924
47 Block 4 4,445,365 100,000 0.51438 0.37470
48 Block 5 71,870 600,000 0.49967 0.35998
49 Block 6 0 all additional 0.48989 0.35019
50 Total 17,495.53 13,363.38 -23.6%
51 32I Interr Sales Block 1 7,186,289 10,000 42,618.0 675.00 0.57815 0.43853
52 Block 2 8,946,142 20,000 0.56345 0.42382
53 Block 3 5,135,755 20,000 0.53895 0.39930
54 Block 4 10,445,179 100,000 0.51445 0.37477
55 Block 5 4,597,392 600,000 0.49977 0.36008
56 Block 6 1 all additional 0.48997 0.35027
57 Total 24,525.97 18,575.07 -24.3%
58 32 Interr Trans Block 1 8,779,332 10,000 194,626.0 925.00 0.09620 0.09620
59 Block 2 15,689,249 20,000 0.08179 0.08179
60 Block 3 11,306,695 20,000 0.05777 0.05777
61 Block 4 28,429,084 100,000 0.03373 0.03373
62 Block 5 56,035,539 600,000 0.01933 0.01933
63 Block 6 78,278,646 all additional 0.00975 0.00975
64 Total 8,913.82 8,913.82 0.0%
65 33 0 N/A 0.0 38,000.00 0.00554 38,000.00 0.00554 38,000.00 0.0%
66
67 Totals 962,859,686
68 0
69
70 Sources:
71 Direct Inputs per Tariff per Tariff
72
73 Rates in summary Column A Column A
74 Permanents
75 Temporaries Add: Cols B+ C
76 PRIOR YEAR Temporaries Add: Cols B+ C
77
78 [1] For convenience of presentation, the cent per therm demand charge is used, rather than the available MDDV demand option for Rate Schedules 31 and 32.
79 [2] Tariff Advice Notice 15-06: Non-Gas Cost Deferral Amortizations - Intervenor Funding
80 [3] Tariff Advice Notice 15-07: Non-Gas Cost Deferral Amortizations - Industrial DSM
81 [4] Tariff Advice Notice 15-08: Non-Gas Cost Deferral Amortizations - Residual
82 [5] Tariff Advice Notice 15-09: Non-Gas Cost Deferral Amortizations - Decoupling
83 [6] Tariff Advice Notice 15-10: Non-Gas Cost Deferral Amortizations - SIP
84 [7] Tariff Advice Notice 15-11: Non-Gas Cost Deferral Amortizations - SRRM
85 [8] Tariff Advice Notice 15-12: PGA
Calculation of Effect on Customer Average Bill by Rate Schedule [1]
NWN 2015-16 PGA Oregon rate development file August filing.xlsx 7/30/2015 11:47 AM
Average Bill by RS
Exhibit B - Supporting Materials NWN OPUC Advice No. 15-12/UG ____
Page 8 of 10

NW Natural
Rates and Regulatory Affairs
2015-2016 PGA Filing - OREGON
Basis for Revenue Related Costs
Twelve Months
1 Ended 06/30/15
2
3 Total Billed Gas Sales Revenues 635,125,404
4 Total Oregon Revenues 657,765,960
5
6 Regulatory Commission Fees [1] 1,697,120 0.250% Statutory rate
7 City License and Franchise Fees 15,291,561 2.325% Line 7 ÷ Line 4
8 Net Uncollectible Expense [2] 1,032,745 0.157% Line 8 ÷ Line 4
9
10 Total 18,021,426 2.732% Sum lines 8-9
11
12
13 Note:
14 [1] Dollar figure is set at statutory level of 0.25% times Total Oregon Revenues (line 4)
15 [2] Represents the normalized net write-offs based on a three-year average.
Exhibit B - Supporting Materials NWN OPUC Advice No. 15-12/UG ____
Page 9 of 10
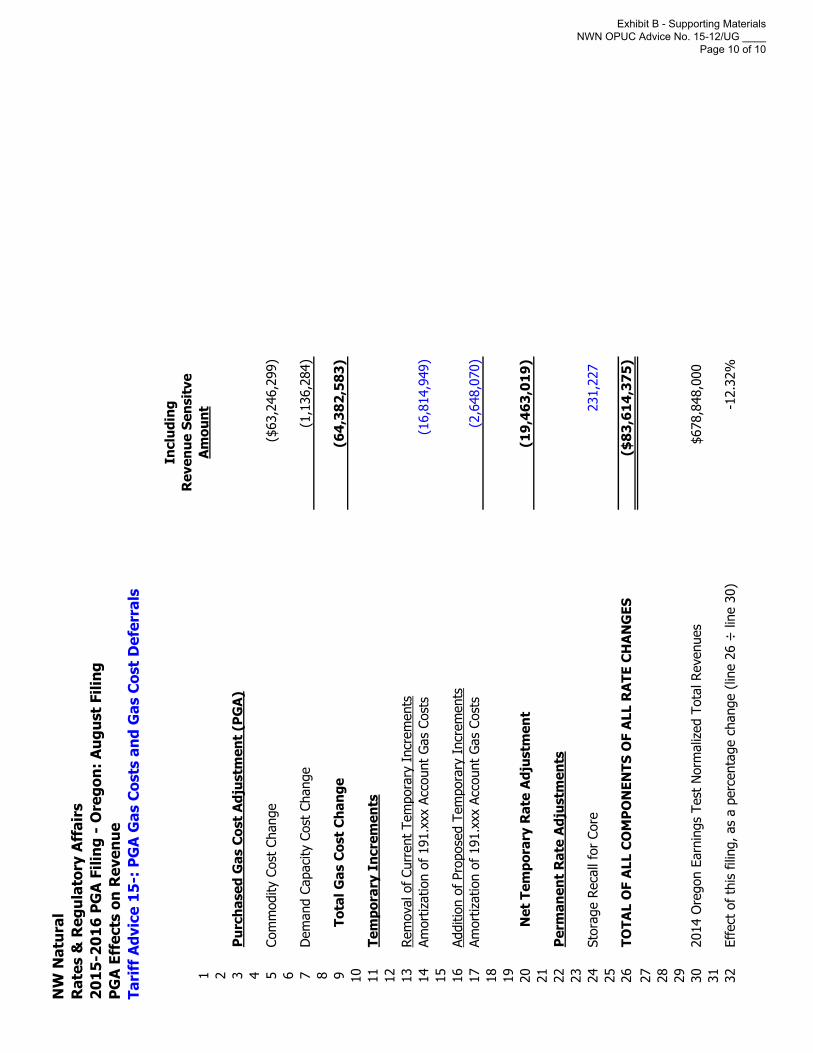
NW
Na
tura
l
Ra
tes &
Re
gu
lato
ry A
ffa
irs
20
15
-20
16
PG
A F
ilin
g -
Ore
go
n:
Au
gu
st
Fil
ing
PG
A E
ffe
cts
on
Re
ve
nu
e
Ta
riff
Ad
vic
e 1
5-:
PG
A G
as C
osts
an
d G
as C
ost
De
ferr
als
Inclu
din
g
Re
ve
nu
e S
en
sit
ve
1A
mo
un
t
2 3P
urc
ha
se
d G
as C
ost
Ad
justm
en
t (P
GA
)
4 5Com
modity C
ost
Change
($63,2
46,2
99)
6 7D
em
and C
apaci
ty C
ost
Change
(1,1
36,2
84)
8 9T
ota
l G
as C
ost
Ch
an
ge
(64
,38
2,5
83
)
10
11
Te
mp
ora
ry I
ncre
me
nts
12
13
Rem
oval of Curr
ent
Tem
pora
ry I
ncr
em
ents
14
Am
ort
ization o
f 191.x
xx A
ccount
Gas
Cost
s(1
6,8
14,9
49)
15
16
Additio
n o
f Pro
pose
d T
em
pora
ry I
ncr
em
ents
17
Am
ort
ization o
f 191.x
xx A
ccount
Gas
Cost
s(2
,648,0
70)
18
19
20
Ne
t T
em
po
rary
Ra
te A
dju
stm
en
t(1
9,4
63
,01
9)
21
22
Pe
rma
ne
nt
Ra
te A
dju
stm
en
ts
23
24
Sto
rage R
eca
ll fo
r Core
231,2
27
25
26
TO
TA
L O
F A
LL C
OM
PO
NE
NT
S O
F A
LL R
AT
E C
HA
NG
ES
($8
3,6
14
,37
5)
27
28
29
30
2014 O
regon E
arn
ings
Test
Norm
aliz
ed T
ota
l Revenues
$678,8
48,0
00
31
32
Effect
of th
is fili
ng, as
a p
erc
enta
ge c
hange (
line 2
6 ÷
lin
e 3
0)
-12.3
2%
Exhibit B - Supporting Materials NWN OPUC Advice No. 15-12/UG ____
Page 10 of 10


Index - Page 1
DATA AND ANALYSIS
Guideline Reference
Data Requirement Location/Link Status
IV General Information and Forecasting1 General Informationa) Definitions of all major terms and acronyms in the data and
information provided. Definitions!A1
b) Any significant new regulatory requirements identified by the utility that in the utility’s judgment directly impacts the Oregon portfolio design, implementation, or assessment.
IV.1b!A1
c) All forecasts of demand, weather, etc. upon which the gas supply portfolio for the current PGA filing is based should be based on a methodology and data sources that are consistent with the most recently acknowledged IRP or IRP update for the utility. If the methodology and/or data sources are not consistent each difference should be identified, explained, and documented as part of the PGA filing workpapers.
IV.1c!A1
2 Workpapersa) PGA Summary Sheet IV.2a!A1b) Gas Supply Portfolio and Related Transportation1 Summary of portfolio planning IV.2b 1-6'!A12 LDC sales system demand forecasting IV.2b 1-6'!A13 Natural gas price forecasts IV.2b 1-6'!A14 Physical resources for the portfolio IV.2b 1-6'!A1 CONFIDENTIAL
IV.2b.4 Tables 1 - 55 Financial resources for the portfolio (derivatives and other
financial arrangements). IV.2b 1-6'!A1 CONFIDENTIAL
6 Storage resources. IV.2b 1-6'!A17 Forecasted annual and peak demand used in the current
PGA portfolio, with and without programmatic and non-programmatic demand response, with explanation.
IV.2b.7!A1
8 Forecasted annual and peak demand used in the current PGA portfolio, with and without effects from gas supply incentive mechanisms, with explanation.
IV.2b.8!A1
9 Summary of portfolio documentation provided IV.2b.9!A1
V.1 Physical Gas Supply V.1.a pg 1'!A1 HIGHLY CONFIDENTIAL
V.1.a pg 2'!A1 HIGHLY CONFIDENTIAL
V.1.a pg3'!A1 HIGHLY CONFIDENTIAL
a) For each physical natural gas supply resource that is included in a utility’s portfolio (except spot purchases) upon which the current PGA is based, the utility should provide the following:
1 Pricing for the resource, including the commodity price and, if relevant, reservation charges.
NW NATURAL
OPUC ORDER No. 11-196DOCKET UM 1286
SECTION IV and V. PGA PORTFOLIO GUIDELINES
EXHIBIT COPUC Advice No. 15-12
Exhibit C - Supporting Materials NWN OPUC Advice No. 15-12/UG ____
Page 1 of 114

Index - Page 2
DATA AND ANALYSIS
Guideline Reference
Data Requirement Location/Link Status
NW NATURAL
OPUC ORDER No. 11-196DOCKET UM 1286
SECTION IV and V. PGA PORTFOLIO GUIDELINES
EXHIBIT COPUC Advice No. 15-12
2 For new transactions and contracts with pricing provisions entered into since the last PGA: competitive bidding process for the resource. This should include number of bidders, bid prices, utility decision criteria in selecting a “winning” bid, and any special pricing or delivery provisions negotiated as part of the bidding process.
3 Brief explanation of each contract’s role within the portfolio.
b) For purchases of physical natural gas supply resource from the spot natural gas market included in the portfolio at the time of the filing of the current PGA or after that filing, the utility should provide the following:
V.1.b!A1
1 An explanation of the utility’s spot purchasing guidelines, the data/information generally reviewed and analyzed in making spot purchases, and the general process through which such purchases are completed by the utility.
V.1.b!A1
2 Any contract provisions that materially deviate from the standard NAESB contract.
V.1.b!A1
V.2 HedgingThe utility should clearly identify by type, contract, counterparty, and pricing point both the total cost and the cost per volume unit of each financial hedge included in its portfolio.
V.2!A1 HIGHLY CONFIDENTIAL
V.3 Load Forecastinga) Customer count and revenue by month and class. V.3.a!A1b) Historical (five years) and forecasted (one year ahead) sales
system physical peak demand.V.3.b!A1
c) Historical (five years), and forecasted (one year ahead) sales system physical annual demand.
V.3.c!A1
d) Historical (five years), and forecasted (one year ahead) sales system physical demand for each of following,
1 Annual for each customer class V.3.d.1!A12 Annual and monthly baseload. V.3.d.2!A13 Annual and monthly non-baseload. V.3.d.3!A14 Annual and monthly for the geographic regions utilized by
each LDC in its most recent IRP or IRP update.V.3.d.4!A1
V.4 Market InformationGeneral historical and forecasted (one year ahead) conditions in the national and regional physical and financial natural gas purchase markets. This should include descriptions of each major supply point from which the LDC physically purchases and the major factors affecting supply, prices, and liquidity at those points.
V.4!A1
V.5 Data Interpretation
Exhibit C - Supporting Materials NWN OPUC Advice No. 15-12/UG ____
Page 2 of 114
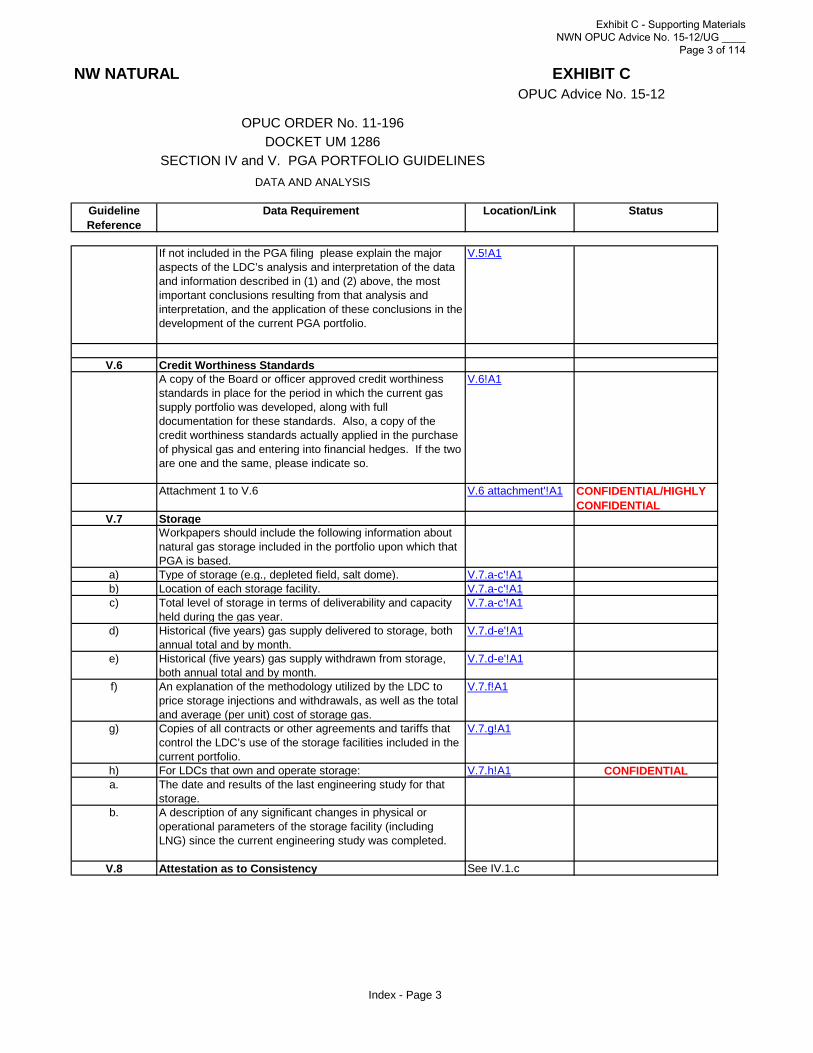
Index - Page 3
DATA AND ANALYSIS
Guideline Reference
Data Requirement Location/Link Status
NW NATURAL
OPUC ORDER No. 11-196DOCKET UM 1286
SECTION IV and V. PGA PORTFOLIO GUIDELINES
EXHIBIT COPUC Advice No. 15-12
If not included in the PGA filing please explain the major aspects of the LDC’s analysis and interpretation of the data and information described in (1) and (2) above, the most important conclusions resulting from that analysis and interpretation, and the application of these conclusions in the development of the current PGA portfolio.
V.5!A1
V.6 Credit Worthiness StandardsA copy of the Board or officer approved credit worthiness standards in place for the period in which the current gas supply portfolio was developed, along with full documentation for these standards. Also, a copy of the credit worthiness standards actually applied in the purchase of physical gas and entering into financial hedges. If the two are one and the same, please indicate so.
V.6!A1
Attachment 1 to V.6 V.6 attachment'!A1 CONFIDENTIAL/HIGHLY CONFIDENTIAL
V.7 StorageWorkpapers should include the following information about natural gas storage included in the portfolio upon which that PGA is based.
a) Type of storage (e.g., depleted field, salt dome). V.7.a-c'!A1b) Location of each storage facility. V.7.a-c'!A1c) Total level of storage in terms of deliverability and capacity
held during the gas year.V.7.a-c'!A1
d) Historical (five years) gas supply delivered to storage, both annual total and by month.
V.7.d-e'!A1
e) Historical (five years) gas supply withdrawn from storage, both annual total and by month.
V.7.d-e'!A1
f) An explanation of the methodology utilized by the LDC to price storage injections and withdrawals, as well as the total and average (per unit) cost of storage gas.
V.7.f!A1
g) Copies of all contracts or other agreements and tariffs that control the LDC’s use of the storage facilities included in the current portfolio.
V.7.g!A1
h) For LDCs that own and operate storage: V.7.h!A1 CONFIDENTIALa. The date and results of the last engineering study for that
storage. b. A description of any significant changes in physical or
operational parameters of the storage facility (including LNG) since the current engineering study was completed.
V.8 Attestation as to Consistency See IV.1.c
Exhibit C - Supporting Materials NWN OPUC Advice No. 15-12/UG ____
Page 3 of 114

Section IV. 1 General Informationa) Definitions and Acronyms
AECO The industry acronym used for Alberta sourced natural gas supply. It originally
Base Load gas (contract) Purchase agreements in which NW Natural has to take a set amount of gas each day from a supplier for the term of the agreement. Usually involves paying for any gas not taken unless excused by reason of Force Majeure.
Base Rate The portion of rates that does not change outside of a general rate case, except as allowed through a Commission approved base rate adjustment.
Base Rate Adjustment A permanent adjustment to rates approved by the Commission outside of a general rate case process.
Btu British thermal unit. 100,000 Btus is equivalent to one therm.
CGPR Canadian Gas Price Reporter. This is the industry publication in Canada that is put out by Canadian Enerdata Ltd and is the exclusive source of Canadian natural gas storage and price forecasts and publishes first of month Canadian indices used in baseload purchase pricing
Collar Financial hedges that set ceiling and floor values on the price of gas purchases.
Commodity Component The Tariff term used to refer to the cost of gas component of a customer’s billing rate, and which will equal either (a) the Annual Sales WACOG, (b) the Winter Sales WACOG, or (c) the Monthly Incremental Cost of Gas.
Dth Dekatherm. A unit of measure equal to 10 therms or one million Btu.
Demand [Charge] The term used to refer to Pipeline Capacity related costs.
Derivative products Financial transactions related to gas supply, including but not limited to hedges, swaps, puts, calls, options and collars that are exercised to provide price stability/control or supply reliability for sales service customers.
EIA U.S. Energy Information Administration
FERC Federal Energy Regulatory Commission
Financial swaps Transactions that involve an exchange of cash flows with a counterparty.
Financially hedged Purchases that have associated financial swaps such that the price of the gas is fixed for a pre-determined period of time.
FOM First of Month
Fuel-in-Kind (KIG) The published fuel rate calculated based on the amount of fuel used on each pipeline to run the compressors and other equipment to move gas across their pipes. Fuel is taken in kind from all receipt shippers by reducing each shippers daily volumes in accordance to the pipelines estimated fuel requirements.
GMR-NWP Rockies Inside FERC's Gas Market Report, a publication put out by Platts (a McGraw-Hill subsidiary) that is the source used for price forecasts and indices that used to set US baseload and some daily purchase prices.
NW NaturalPGA Portfolio Development Guidelines
OPUC Order No. 11-196, Docket UM 1286
Exhibit C - Supporting Materials NWN OPUC Advice No. 15-12/UG ____
Page 4 of 114

IRP Integrated Resource Plan
MDDV Maximum Daily Delivery Volume
NWP Northwest Pipeline
Off-system storage Storage facilities located outside NW Natural’s service territory.
On-system storage Storage facilities located inside NW Natural’s service territory.
PGA Purchased Gas Adjustment
Peak day The day in which volumes distr buted or sold by NW Natural are at a maximum. May be theoretical (the “design day”) or actual.
Pipeline Capacity The quantity (volume) of natural gas available on the interstate pipeline for the transportation of gas supplies to the Company's distribution system. Pipeline Capacity related costs are often referred to as "Demand".
Recallable gas supply/capacity Refers to arrangements that allow NW Natural to use the upstream pipeline capacity and gas supplies held by third parties.
Revenue Sensitive The amount by which rates are adjusted to reflect the effects of revenue related costs, such as uncollectible expense, regulatory fees, and city license and franchise fees
Swing gas (contract) Purchase agreements in which NW Natural has the right, but not the obligation, to take gas from a supplier on any given day.
Technical Rate Adjustments Also referred to as Temporary Rate Adjustments.
Therm A unit of heating value equivalent to 100,000 Btus. The amount of heat energy in approximately 100 cubic feet of Natural Gas.
Total Commodity Cost The combined costs for all purchased gas supplies, excluding transportation costs.
Total Gas Cost The combined costs of all purchased gas supplies and associated transportation costs.
Transportation Cost The combined costs for all pipeline related demand, capacity or reservation charges
Transportation Resources The various upstream pipeline capacity agreements held by the company.
Upstream pipeline Those pipelines that collect natural gas from the areas where it is produced in the British Columbia, Alberta and the U.S. Rocky Mountain supply regions and transport that gas to NW Natural’s service territory.
Upstream pipeline capacity Refers to the rights that NW Natural has obtained to transport gas on upstream pipelines.
WACOG The Company’s weighted average commodity cost of gas (excluding transportation cost), also referred to as Annual Sales WACOG.
Winter Sales WACOG The Company’s winter period weighted average commodity cost of gas (excluding transportation cost).
Exhibit C - Supporting Materials NWN OPUC Advice No. 15-12/UG ____
Page 5 of 114

IV
1b)
FERC issued a Notice of Proposed Rulemaking (NOPR) on March 20, 2014, Docket No. RM-14-2-000, which proposed changes to the start time for the "gas day," the timelines for scheduling gas, and the introduction of more "nomination" cycles. NW Natural was an active participant in this process through several broad coalitions. The Final Rule was issued by FERC on April 16, 2015, and it adopted the changes that were supported by those gas industry coalitions. Pipeline implementation of the new scheduling standards is expected to occur in April 2016. The ultimate impact on NW Natural's operations should be minimal.
NW NaturalPGA Portfolio Guidelines
OPUC Order No. 11-196, Docket UM 1286
General Information and Forecasting
General InformationAny significant new regulatory requirements identified by the utility that in the utility’s judgment directly impacts the Oregon portfolio design, implementation, or assessment.
The interdependencies between the electric sector and natural gas utilities took center stage in February 2011 when an extreme cold weather event in the southwestern U.S. affected service to 4.4 million electric customers and over 50,000 natural gas customers. FERC, NERC and various other agencies have held hearings and issued reports since then, and other studies are still ongoing. Many of the calls for better coordination and preparedness were already anticipated by energy utilities in the Pacific Northwest, in part due to our own regional outage event that occurred in December 2009, and also in part due to past planning efforts that have drawn together many of the same stakeholders.
Exhibit C - Supporting Materials NWN OPUC Advice No. 15-12/UG ____
Page 6 of 114

IV1c)
and8
In accordance with the PGA Portfolio Guidelines at Section IV(1)(c), the Company acknowledges that all forecasts of demand, weather, etc., upon which the gas supply portfolio for this PGA filing is based, uses the methodology and data sources that are consistent with the Company’s recently acknowledged 2014 IRP.
General InformationAll forecasts of demand, weather, etc. upon which the gas supply portfolio for the current PGA filing
NW NaturalPGA Portfolio Guidelines
OPUC Order No. 11-196, Docket UM 1286
General Information and Forecasting
Attestation of verification of consistency
Exhibit C - Supporting Materials NWN OPUC Advice No. 15-12/UG ____
Page 7 of 114

NW NaturalPGA Portfolio GuidelinesOPUC Order No. 11-196, Docket UM 1286
Amount Location in Company Filing (cite)
1) Change in Annual Revenues (Per OAR 860-022-0017(3)(a))
A) Dollars (To 1 million) ($57,900,000) Refer to workpaper "PGA filing Summary Effects"
B) Percent (To 1 percent) -8.54% "
2) Annual Revenues Calculation (Whole Dollars)A) PGA Cost Change (Commodity & Transportation ) (64,382,583) Refer to workpaper "PGA filing Summary Effects"B) Remove Last Year's Temporary Increment Total (26,662,471) "C) Add New Temporary Increment 29,851,086 " necessary )
1) Net Safety Programs 582,277 Refer to workpaper "PGA filing Summary Effects"2) Mist Recall 231,227 "3) Schedule 182 5,140,4374) 05) 06) 0
E) Total Proposed Change (55 240 026) "
3) Residential Bill Effects Summary A) Residential Schedule 2 Rate Impacts
1) Current Billing Rate per Therm $1.01330 Refer to workpaper "2014-15 Rate Development" 2) Proposed Billing Rate per Therm $0.94093 "3) Rate Change Per Therm ($0.07237) "4) Percent Change per Therm (to 1%) -7.1% "
B) Average Residential Bill Impact (forecasted weather-normalized annual)1) Average Residential Monthly Use 53.0 Refer to workpaper "2014-15 Rate Development" 2) Customer Charge $8.00 "3) Current Average Monthly Bill $61.70 "4) Proposed Average Monthly Bill $57.87 "5) Change in Average Monthly Bill ($3.83) "6) Percent change in Average Monthly Bill (to 1%) -6.2% "
C) Average January Residential Bill Impact 1) Average January Residential Use (forecasted weather-normalized) 96.0 N/A2) Customer Charge $8.00 N/A3) Current Average January Bill $105.05 N/A4) Proposed Average January Bill $98.12 N/A5) Change in Average January Bill ($6.93) N/A6) Percent change in Average January Bill (to 1%) -6.6% N/A
Amount Location in Company Filing (cite)4) Breakdown of Costs
A) Embedded in Rates 1) Total Commodity Cost 255,214,968
a) Total Demand Cost (assoc. w/ supply) 0b) Total Peaking Cost (assoc. w/ supply) 0c) Total Reservation Cost (assoc. w/ supply) 0d) Total Volumetric Cost (assoc. w/ supply) $2 970 476 2013-14 PGA filinge) Total Storage Cost (assoc. w/ supply) 0f) Other $0 2013-14 PGA filing
2) Total Transportation Cost (Pipeline related) 0a) Total Upstream Canadian Toll 0
i.Total Demand, Capacity, or Reservation Cost 0 2013-14 PGA filingii. Total Volumetric Cost 0
b) Total Domestic Cost 0i. Total Demand, Capacity, or Reservation Cost 0 2013-14 PGA filingii. Total Volumetric Cost 0
3) Total Storage Costs $70,064,362 2013-14 PGA filing4) Capacity Release Credits 05) Total Gas Costs $328,249,806 2013-14 PGA filing
B) Projected For New Rates1) Total Commodity Cost 186,514,134
a) Total Demand Cost (assoc. w/ supply) 0b) Total Peaking Cost (assoc. w/ supply) 0c) Total Reservation Cost (assoc. w/ supply) 0d) Total Vaporization Cost (assoc. w/ supply) 3,086,482e) Total Volumetric Cost (assoc. w/ supply) $0 Exhibit B, Page 1f) Total Storage Cost (assoc. w/ supply) 0g) Other (A&G Benchmark Savings) $0 Exhibit B, Page 1
2) Total Transportation Cost (Pipeline related) 0a) Total Upstream Canadian Toll 0
i.Total Demand, Capacity, or Reservation Cost 0 Exhibit B, Page 1ii. Total Volumetric Cost 0
b) Total Domestic Cost 0i. Total Demand, Capacity, or Reservation Cost 0 Exhibit B, Page 1ii. Total Volumetric Cost 60,213,195
3) Total Storage Costs $0 Exhibit B, Page 14) Capacity Release Credits 05) Total Gas Costs $249,813,811 Exhibit B, Page 1
Exhibit C - Supporting Materials NWN OPUC Advice No. 15-12/UG ____
Page 8 of 114

Amount Location in Company Filing (cite)5) WACOG (Weighted Average Cost of Gas)
A) Embedded in Rates1) WACOG (Commodity Only)
a. With revenue sensitive $0.43383 N/Ab. Without revenue sensitive $0.42178 N/A
2) WACOG (Non-Commodity)a. With revenue sensitive $0.12239 N/Ab. Without revenue sensitive $0.11899 N/A
B) Proposed for New Rates1) WACOG (Commodity Only)
a. With revenue sensitive $0.34115 Exhibit B, Page 6 and Page 9b. Without revenue sensitive $0.33183 "
2) WACOG (Non-Commodity)a. With revenue sensitive $0.11935 Exhibit B, Page 8b. Without revenue sensitive $0.11609 "
6) Therms Sold 757,005,313 Exhibit B, Page 1
7) Purchasing/ Hedging Strategies Prepare 1-2 page summary of gas cost situation to include resources, purchasing strategy, hedging, and pipeline issues Within the summary include:
A) Resources embedded in current rates and an explanation of proposed resources.1) Firm Pipeline Capacity
a) Year-round supply contracts N/A Exhibit A, IV.2.b 1-7b) Winter-only contracts N/A "c) Reliance on Spot Gas/Other Short Term Contracts N/A "d) Other - e.g. Supply area storage N/A "
2) Market Area Storagea) Underground-owned N/A "b) Underground- contracted N/A "c) LNG-owned N/A "d) LNG-contracted N/A "
3) Other Resourcesa) Recallable Supply N/A "b) City gate Deliveries N/A "c) Owned-Production N/A "d) Propane/Air N/A "
Exhibit C - Supporting Materials NWN OPUC Advice No. 15-12/UG ____
Page 9 of 114

IV General Information and Forecasting2 Workpapersb) Gas Supply Portfolio and Related Transportation123456 Storage Resources
1. Summary of Portfolio Planning Process
To ensure adequate reliability, NWN contracts for firm upstream pipeline capacity, firm off-system storage service and firm recallable gas supply/capacity arrangements with certain on-system customers, in addition to its development of on-system underground and LNG storage.
Upstream gas supply contracts have been negotiated with the following objectives in mind: (1) Use a diverse group of reliable suppliers as established by their asset positions, past performance and other factors; (2) Try to match our year-round customer requirements to baseload (take-or-pay) annual or multi-year supply contracts to obtain the most favorable pricing; (3) Use winter only (Nov-Mar) term contracts to match our rise in requirements during the heating season; (4) Reduce spot purchase requirements during the winter due to the likely correlation of high requirements with high spot prices; (5) Take advantage of favorable pricing opportunities to use supply-basin storage when poss ble; (6) Use index-related pricing formulas in term contracts to enable easy evaluation of competitive offers and avoid the need for further price negotiation over the term of the contract; (7) Structure the portfolio to provide some opportunity to take advantage when spot prices are favorable; and (8) Avoid over-contracting gas on a take-or-pay basis, which could result in excess gas supplies that must be sold at a loss if requirements fail to materialize such as during a warm winter.
Upstream pipeline capacity has been contracted with the following objectives in mind: (1) Diversify capacity sources so that disruptions in any one supply region, such as from a pipeline rupture, well freeze-offs, etc., have a minimal impact on NWN; (2) Obtain upstream capacity along the path from NWN’s service territory to points generally recognized for their liquidity, such as AECO/NIT, to maximize buying opportunities and minimize price volatility; and (3) Find ways to minimize the cost of upstream capacity such as through optimization activities or committing to capacity only on a winter season basis if poss ble.
One item that would have been found in the above list in prior years was an objective to use a variety of term contract durations to avoid having to re-contract all physcial gas supplies every year. More recently, with the surge in supplies represented by shale gas, the Company has decreased its reliance on multi-year physical term contracts, and as they have expired, replaced them with 1-year or shorter term purchases.
[1] "Design" year criteria is developed and discussed in the Company's Integrated Resource Plan (IRP).
NW NaturalPGA Portfolio Guidelines
OPUC Order No. 11-196, Docket UM 1286
Summary of portfolio planning processLDC sales system demand forecastingNatural gas price forecastsPhysical resources for the portfolioFinancial resources for the portfolio (derivatives and other financial arrangements)
NWN’s goal is to assemble resources sufficient to meet expected firm customer requirements under “design” year conditions at the lowest reasonable cost. [1]
Exhibit C - Supporting Materials NWN OPUC Advice No. 15-12/UG ____
Page 10 of 114

2. LDC sales system demand forecasting.
3. Natural gas price forecasts.
The company’s methodology for forecasting annual sales and firm peak day requirements follow the methodology established in its Integrated Resource Plan (IRP). Also applicable here is the load forecast methodology previously established for PGA filings.
This means that while the demand forecast reflects "normal" weather, the company still is planning for the possil bity of extreme cold weather during the upcoming heating season. Where these two differing load forecasts collide is in the dispatch of storage resources. To handle this conflict in load forecasting criteria, implicit in the resource dispatch are constraints that limit storage withdrawals to the extent needed to maintain maximum daily deliverabilities into early February. This addresses the need to maintain reliability of service to firm customers should extreme cold weather arise this coming winter, while at the same time complying with the PGA load forecast requirements.
NWN relies on forecasts prepared by the U.S. Energy Information Administration (EIA), the IHS CERA consulting firm as well as NYMEX futures prices to help formulate its gas purchase and hedging strategies. Various other price forecasts and analyses also come to NWN by way of trade publications, consultant visits, oil/gas company presentations and other governmental sources. These provide opportunities to test assumptions and explore alternate viewpoints.
As an example, below is the latest long-range natural gas price forecast - Reference (base case) along with three alternate scenarios - from EIA’s 2015 Annual Energy Outlook dated April 2015. It indicates that prices currently have bottomed out. Even though EIA predicts natural gas production would continue to grow, in most cases this is offset by demand growth that is led by gas exports in the form of LNG as well as via pipeline to Mexico.
Fundamental forecasts that call for rising gas prices have spurred NWN to formulate hedging strategies around locking in prices on a longer term basis for a larger portion of its expected purchase volumes. This was discussed in the company's 2014 IRP and is now the topic of Oregon docket UM 1720.
Exhibit C - Supporting Materials NWN OPUC Advice No. 15-12/UG ____
Page 11 of 114

4. Physical resources for the portfolio.
As mentioned above, NWN’s physical portfolio on any given day includes gas supplies purchased and transported over the upstream pipeline grid as well as supplies either placed into or withdrawn from a variety of gas storage facilities. The company also has arrangements with three large on-system customers that allow it to call on their gas supplies on short notice for use by the company (“recall arrangements”). Finally, a very small portion of the company’s gas supply (about 1%) is native gas produced from the Mist Field. This is the company’s only gas supply that does not require transportation at one time or another over the interstate pipeline system.
Four significant changes to the physical supply resource portfolio were discussed in last year's PGA filing: (1) removal of 601,00 therms/day from the Plymouth LNG plant due to uncertainty over its reliability after a Northwest Pipeline curtailment of its related TF-2 pipeline transportation service (this occurred several months prior to the Plymouth plant explosion/outage); (2) addition of a 200,000 therms/day citygate peaking supply contract with a gas marketing company to offset a portion of the lost Plymouth capacity; (3) reliance on "segmented" capacity of 438,000 therms/day from Sumas/Huntingdon as a stopgap measure to offset the rest of the Plymouth loss; and (4) termination of our 600,000 therms/day T-South pipeline contract on the Westcoast Energy (Spectra) pipeline system in British Columbia, which changed the purchasing location for certain supplies from Station 2 to Sumas/Huntingdon. An additional matter that was discussed - but not changed lat year - was the (5) company's continuing reliance on "subordinate" TF-2 service to transport a portion of its supplies from the Jackson Prairie storage facility (135,250 therms/day). The current status for each of these items is discussed below.
(1) The situation regarding the Plymouth LNG plant has not changed. While there may be columns or rows in certain spreadsheets labeled for Plymouth, these are holdovers from prior files and there should be no actual entries (or just zeros) in those cells. This is unlikely to change in the future unless Northwest Pipeline develops a primary firm transportation service from Plymouth that greatly improves the cost-effectiveness of the service, which no doubt would be analyzed in an IRP-type process prior to its appearance in any PGA filing.
(2) The 200,000 therms/day citygate peaking supply contract is expected to continue for another winter under the same terms as last winter, though those negotiations are not yet complete.
(3) The need for segmented capacity as a stopgap measure essentially was eliminated through the combination of the citygate peaking supply mentioned above and a 300,000 therm/day Mist "recall" that took effect on May 1, 2015. This recall is in accordance with the action plan in the acknowledged 2014 IRP. Accordingly, the company is not reflecting segmented capacity in its current peak day resource plan.
(4) T-South capacity has been evaluated for this coming year and a 300,000 therm/day contract has been secured through a gas marketing capacity. The economic analysis is provided in a separate spreadsheet in this file labeled "T-South analysis". In sum, there were three reasons for this turnabout: (1) lower T-South toll rates due to recontracting on the Westcoast system; (2) a further reduction in the effective cost in U.S. dollars due to favorable movement in the U.S./Canadian currency exchange rate; and (3) a widening in the spread between Station 2 and Sumas/Huntingdon commodity prices.
(5) The company has signed an MOU with Northwest Pipeline that would provide 135,250 therms/day of discounted TF-1 service from Jackson Prairie, eliminating reliance on the "subordinate" capacity, subject to approval in this PGA process. This agreement was analyzed and filed as an IRP update with the Oregon PUC on May 8, 2015, under docket LC 60. The company will make separate arrangements to provide the analysis to the WUTC as appropriate.
As a reminder from prior years, a small "de-rate" continues to be in place for the Newport LNG tank capacity. This reflects the gradual accumulation of frozen carbon dioxide (commonly known as "dry ice") on the tank floor over the plant's 35 years of operation. This has not reduced Newport's design peak day delivery rate. In the 2014 IRP, a project to refurbish Newport was described and acknowledged. That project is now underway, and one element of the project address the dry ice issue, gradually and safely eliminating the problem over a multi-year period.
Exhibit C - Supporting Materials NWN OPUC Advice No. 15-12/UG ____
Page 12 of 114

The company’s portfolio continues to reflect the gas reserves purchased under the agreement with Encana approved by the OPUC in 2011 with Encana. That agreement was amended in March 2014 and seven new gas wells were drilled with the successor company Jonah Energy LLC. This PGA will reflect the regulatory settlement tentatively reached in mid-July regarding those seven wells, i.e., those volumes will be included at the settlement price. As a reminder, all of the gas reserve volumes essentially function as a financial tool, i.e., they displace an identical volume of financial derivatives that the company otherwise would have executed. For the purposes of this filing, the Encana and Jonah Energy gas reserve volumes have no impact on the company’s physical supply portfolio.
Using its mix of transportation and storage resources, the company achieves the following profile on a typical winter day.
Exhibit C - Supporting Materials NWN OPUC Advice No. 15-12/UG ____
Page 13 of 114

Regarding physical supply purchasing, NWN will have contracts with suppliers for 650,000 therms per day of firm deliveries on a daily basis over the upcoming November 2015 through October 2016 period. This reflects the relatively stable daily component of NWN’s demand, including some portion of storage injection requirements in the summer months.
For the November 2015 through March 2016 heating season, NWN will have contracts for an additional 1.20 million therms/day of supply under baseload agreements, another 300,000 therms/day under peaking (swing) contracts in the supply basins, and another 200,000 therms/day of peaking supply under a citygate delivery agreement. This reflects the higher consumption of customers during those months. Buying under term supply contracts lessens the need to rely extensively on the spot market during periods of high demand when competition for supplies may be intense. The baseload contracts that have a maximum total of 1.85 million therms/day (650,000 year-round plus 1.20 million winter season) are purchased on a take-or-pay basis. The remaining 500,000 therms/day (300,000 in the supply area plus 200,000 at the citygate) are made available to NWN on a daily basis in exchange either for payment of a fixed “reservation” charge or for equivalent value in the form of put options during the summer months. These swing contracts have no minimum daily, monthly or seasonal purchase requirement, but they provide additional daily supply flexibility, which is especially valuable since winter weather can fluctuate rapidly between mild and cool temperatures, resulting in rapidly changing customer requirements.
This means between 1.16 and 1.46 million therms/day of upstream capacity could be available during the heating season for spot (one month and shorter duration) purchases as and when needed. Accordingly, on days when all upstream capacity is in use, purchases will be split among three categories – year-round contracts, winter term contracts and spot purchases.
Should its “design” peak day occur, all physical resources would be used in the following proportions (segmented capacity is excluded but presumably would be used if available and if spot gas purchases to fill that capacity make economic or operational sense):
A summary of the company’s physical supply resources is provided in Tables 1 through 5.
Exhibit C - Supporting Materials NWN OPUC Advice No. 15-12/UG ____
Page 14 of 114

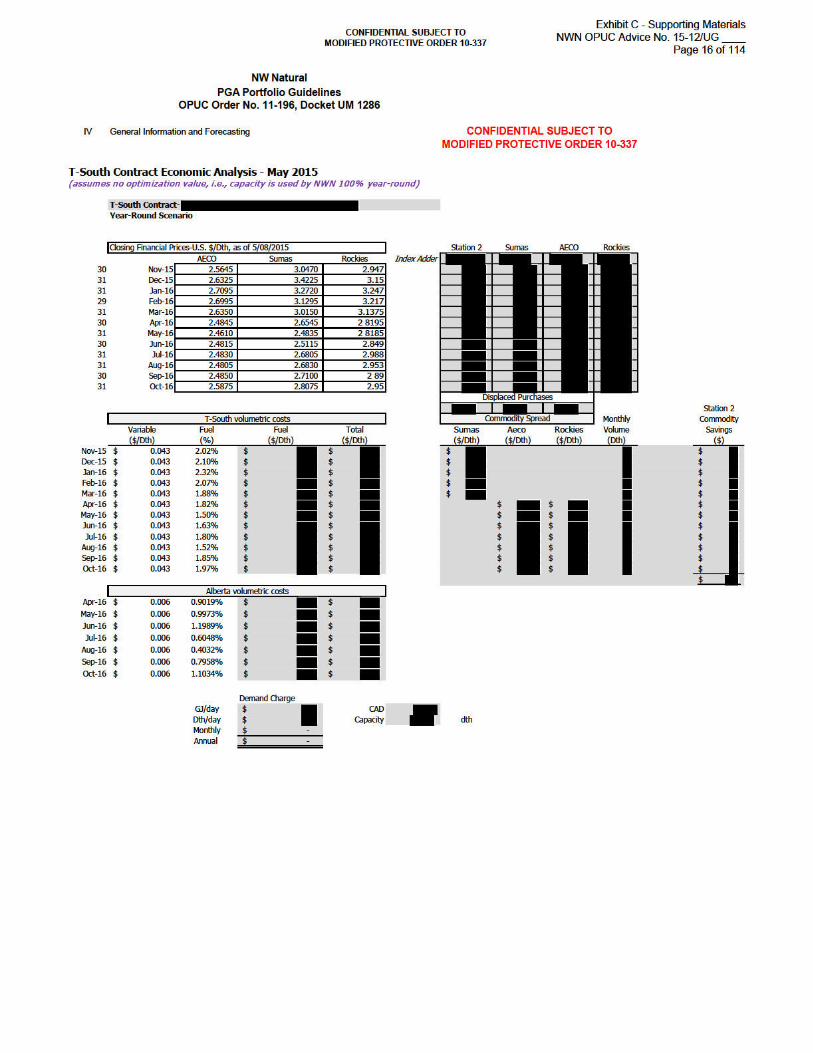
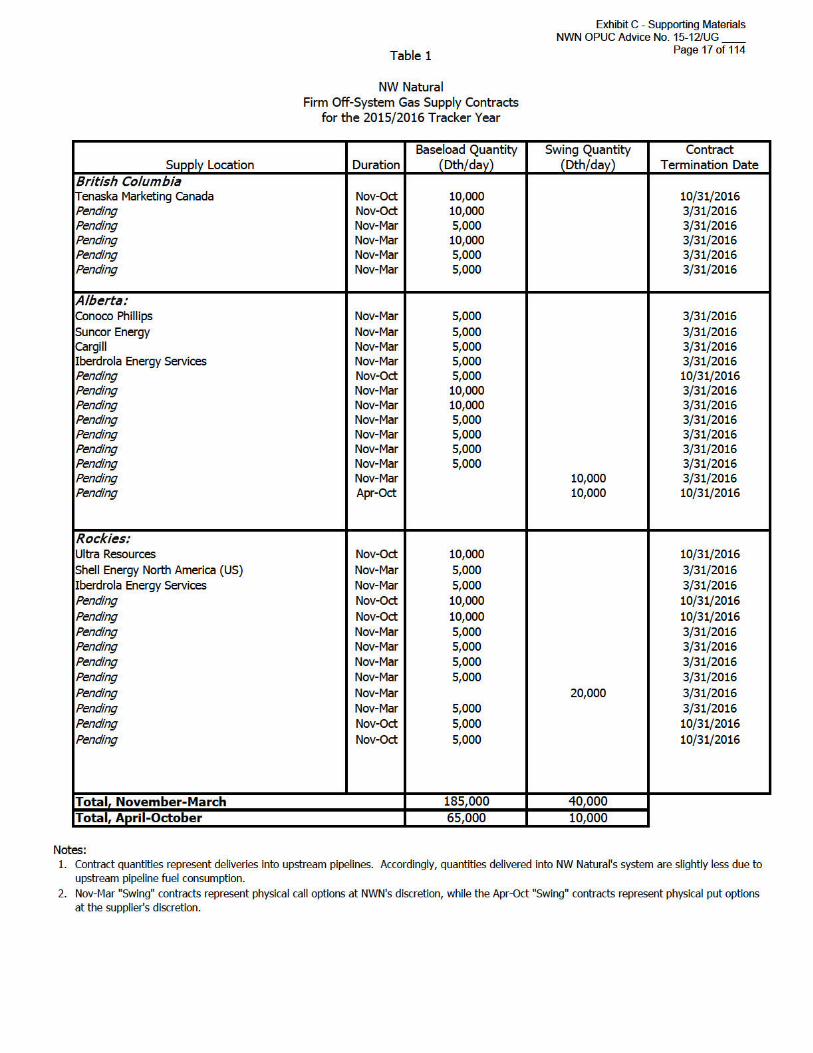


Max. Daily Rate Max. Seasonal LevelFacility (Dth/day) (Dth) Termination Date
Jackson Prairie:
SGS-2F 46,030 1,120,288 Upon 1-year notice
TF-2 (primary firm portion) 23,038 839,046 Upon 1-year notice TF-2 (primary firm portion) 9,467 281,242 Upon 1-year notice TF-1 (per MOU) 13,525 10/31/2023
Firm On-System Storage Plants:
Mist (reserved for core) 305,000 10,644,758 n/a Portland LNG Plant 120,000 600,000 n/a Newport LNG Plant 60,000 900,000 n/aTotal On-System Storage 485,000 12,144,758
Total Firm Storage Resource 531,030 13,265,046
Notes:1.
2.
3.4.
5.
6.7.8.
AECO Gas Storage Partnership (Niska) - 1,895,634 DthJ. Aron & Company - 1,530,000 Dth
Table 3
NW NaturalFirm Storage Resources
for the 2015/2016 Tracker Year
Newport tank capacity de-rated from 1,000,000 Dth pending CO2 removal project.The Company's Plymouth-related contracts terminate on October 31, 2015, so they are no longer reflected in this table. NW Natural has supply-basin storage contracts in Alberta that are NOT included in this table to avoid double-counting resources because their deliverability relies on portions of the same upstream pipeline capacity already included in Table 2. These contracts are with:
Tenaska Marketing Canada - 947,817 Dth
The SGS-2F and TF-2 contracts have a unilateral annual evergreen provision (continuation at NW Natural's sole option), while the TF-1 contract requires mutual consent with Northwest Pipeline to continue after the indicated termination date.The TF-2 contracts also contain additional "subordinated" firm service of 9,586 Dth/day on the first agreement listed above and 3,939 Dth/day on the second agreement. The subordinated service is NOT included in NW Natural's peak day planning. On-system storage peak deliverability is based on design criteria, for example, Mist is at least 50% full..Mist numbers pertain to the portion reserved for core utility service per the Company's Integrated Resource Plan, including a "recall" of 30,000 Dth/day of deliverability (with associated working gas) effective 5/1/2015. Additional capacity and deliverability at Mist have been contracted under varying terms to Interstate/Intrastate storage customers. The Dth numbers for Mist, Newport LNG and Portland LNG are approximate in that they are converted from Mcf volumes, and so depend on the heat content of the stored gas. The current heat content used for Mist is 1010 Btu/cf. The current heat content used for both Newport and Portland LNG is 1000 Btu/cf, but that is under review and likely to be increased for both plants, though not by an amount that would create a material impact on the annual PGA.
Exhibit C - Supporting Materials NWN OPUC Advice No. 15-12/UG ____
Page 19 of 114


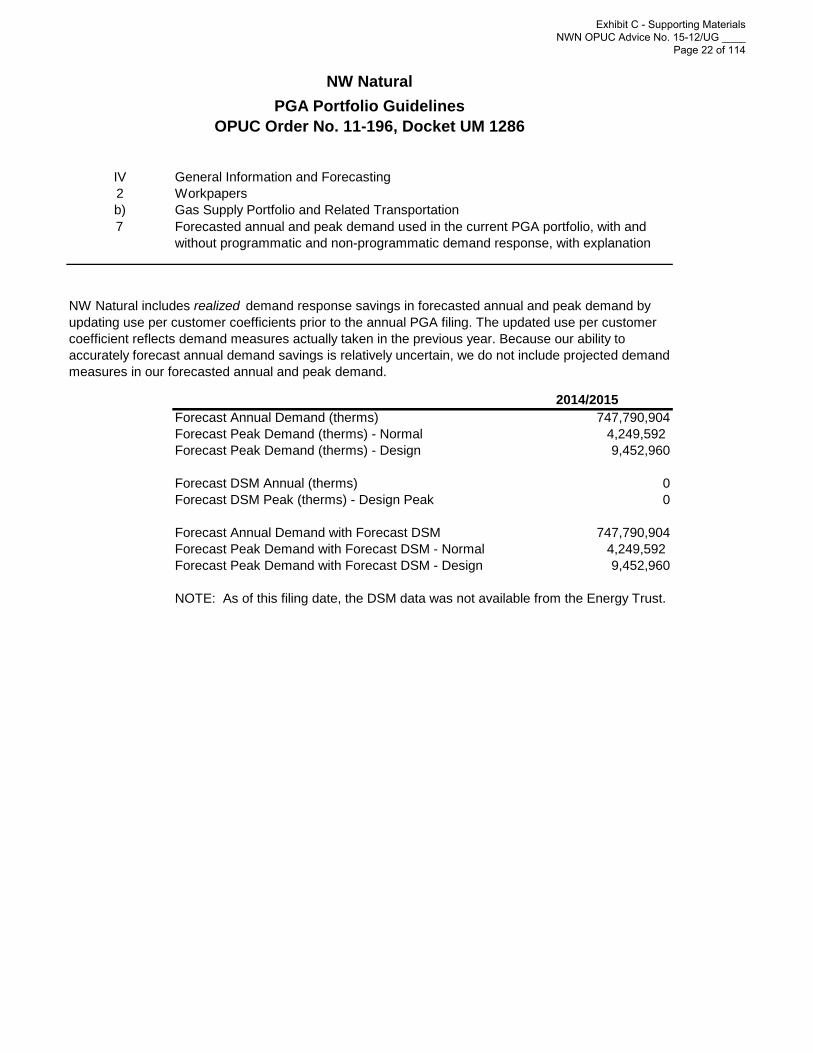
IV General Information and Forecasting2 Workpapersb) Gas Supply Portfolio and Related Transportation7
2014/2015Forecast Annual Demand (therms) 747,790,904Forecast Peak Demand (therms) - Normal 4,249,592 Forecast Peak Demand (therms) - Design 9,452,960
Forecast DSM Annual (therms) 0Forecast DSM Peak (therms) - Design Peak 0
Forecast Annual Demand with Forecast DSM 747,790,904Forecast Peak Demand with Forecast DSM - Normal 4,249,592 Forecast Peak Demand with Forecast DSM - Design 9,452,960
NOTE: As of this filing date, the DSM data was not available from the Energy Trust.
OPUC Order No. 11-196, Docket UM 1286
NW Natural includes realized demand response savings in forecasted annual and peak demand by updating use per customer coefficients prior to the annual PGA filing. The updated use per customer coefficient reflects demand measures actually taken in the previous year. Because our ability to accurately forecast annual demand savings is relatively uncertain, we do not include projected demand measures in our forecasted annual and peak demand.
Forecasted annual and peak demand used in the current PGA portfolio, with and without programmatic and non-programmatic demand response, with explanation
NW NaturalPGA Portfolio Guidelines
Exhibit C - Supporting Materials NWN OPUC Advice No. 15-12/UG ____
Page 22 of 114

IV General Information and Forecasting2 Workpapersb) Gas Supply Portfolio and Related Transportation8
Our forecasted annual and peak demand is not impacted by gas supply incentive mechanisms.
NW NaturalPGA Portfolio Guidelines
OPUC Order No. 11-196, Docket UM 1286
Forecasted annual and peak demand used in the current PGA portfolio, with and without effects from gas supply incentive mechanisms, with explanation.
Exhibit C - Supporting Materials NWN OPUC Advice No. 15-12/UG ____
Page 23 of 114

IV General Information and Forecasting2 Workpapersb) Gas Supply Portfolio and Related Transportation
9
See Index to this Worksheet.
NW NaturalPGA Portfolio Guidelines
OPUC Order No. 11-196, Docket UM 1286
Summary of portfolio documentation provided
Exhibit C - Supporting Materials NWN OPUC Advice No. 15-12/UG ____
Page 24 of 114

V.1 Physical Gas Supply
a)
1
2
3
See V.1.a, Page 1 through 4
NW NaturalPGA Portfolio Guidelines
OPUC Order No. 11-196, Docket UM 1286
Brief explanation of each contract's role within the portfolio.
For each physical natural gas supply resource that is included in a utility's portfolio (except spot purchases) upon which the current PGA is based, the utility should provide the following:
Pricing for the resource, including the commodity price and, if relevant, reservation charges.
For new transactions and contracts with pricing provisions entered into since the last PGA: competitive bidding process for the resource. This should include number of bidders, bid prices utility decision criteria in selecting a "winning" bid, and any special pricing or delivery provisions negotiated as part of the bidding process
Exhibit C - Supporting Materials NWN OPUC Advice No. 15-12/UG ____
Page 25 of 114
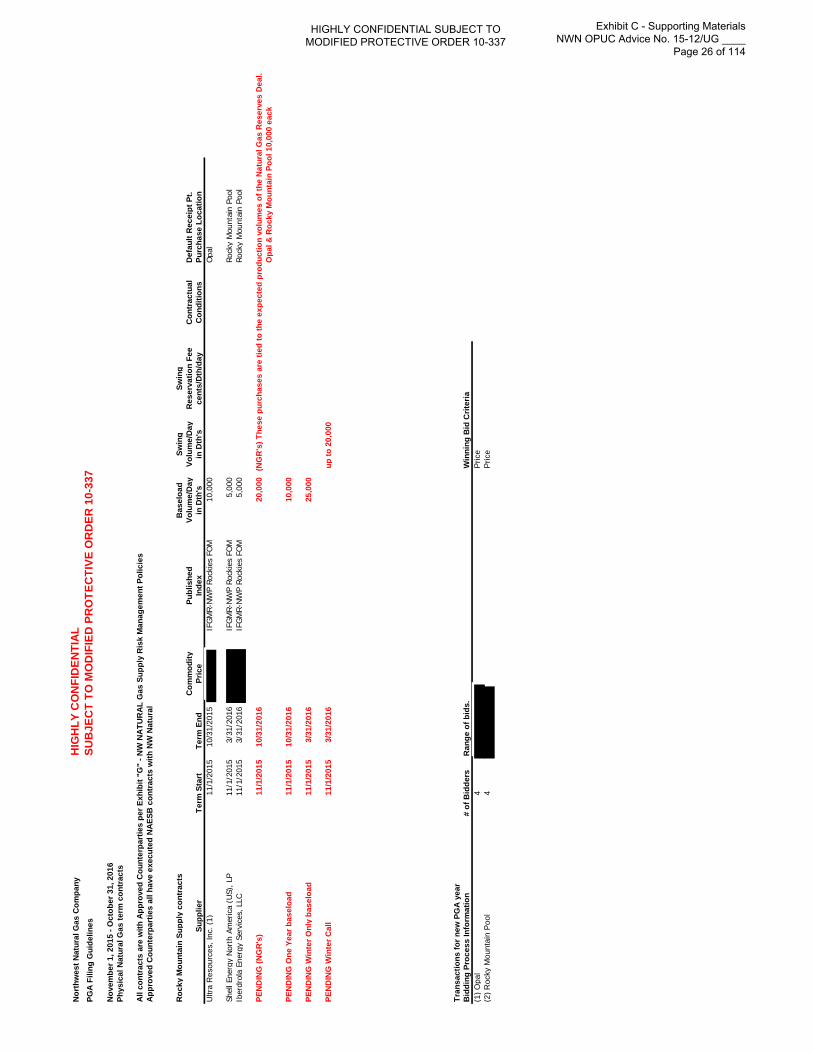
Nor
thw
est N
atur
al G
as C
ompa
nyH
IGH
LY C
ON
FID
ENTI
AL
PGA
Fili
ng G
uide
lines
SUB
JEC
T TO
MO
DIF
IED
PR
OTE
CTI
VE O
RD
ER 1
0-33
7
Nov
embe
r 1, 2
015
- Oct
ober
31,
201
6Ph
ysic
al N
atur
al G
as te
rm c
ontr
acts
All
cont
ract
s ar
e w
ith A
ppro
ved
Cou
nter
part
ies
per E
xhib
it "G
" - N
W N
ATU
RA
L G
as S
uppl
y R
isk
Man
agem
ent P
olic
ies
App
rove
d C
ount
erpa
rtie
s al
l hav
e ex
ecut
ed N
AES
B c
ontr
acts
with
NW
Nat
ural
Roc
ky M
ount
ain
Supp
ly c
ontr
acts
B
asel
oad
Swin
gSw
ing
Com
mod
ityPu
blis
hed
Volu
me/
Day
Volu
me/
Day
Res
erva
tion
Fee
Con
trac
tual
Def
ault
Rec
eipt
Pt.
Supp
lier
Term
Sta
rtTe
rm E
ndPr
ice
Inde
xin
Dth
'sin
Dth
'sce
nts/
Dth
/day
Con
ditio
nsPu
rcha
se L
ocat
ion
Ultr
a R
esou
rces
, Inc
. (1)
11/1
/201
510
/31/
2015
IFG
MR-
NW
P Ro
ckie
s FO
M10
,000
Opa
l
Shel
l Ene
rgy
Nor
th A
mer
ica
(US)
, LP
11/1
/201
53/
31/2
016
IFG
MR-
NW
P Ro
ckie
s FO
M5,
000
Ro
cky
Mou
ntai
n Po
olIb
erdr
ola
Ener
gy S
ervi
ces,
LLC
11/1
/201
53/
31/2
016
IFG
MR-
NW
P Ro
ckie
s FO
M5,
000
Ro
cky
Mou
ntai
n Po
ol
PEN
DIN
G (N
GR
's)
11/1
/201
510
/31/
2016
20,0
00
(N
GR
's) T
hese
pur
chas
es a
re ti
ed to
the
expe
cted
pro
duct
ion
volu
mes
of t
he N
atur
al G
as R
eser
ves
Dea
l.O
pal &
Roc
ky M
ount
ain
Pool
10,
000
eack
PEN
DIN
G O
ne Y
ear b
asel
oad
11/1
/201
510
/31/
2016
10,0
00
PEN
DIN
G W
inte
r Onl
y ba
selo
ad11
/1/2
015
3/31
/201
625
,000
PEN
DIN
G W
inte
r Cal
l 11
/1/2
015
3/31
/201
6up
to 2
0,00
0
Tran
sact
ions
for n
ew P
GA
yea
rB
iddi
ng P
roce
ss In
form
atio
n#
of B
idde
rsR
ange
of b
ids.
Win
ning
Bid
Crit
eria
(1) O
pal
4Pr
ice
(2) R
ocky
Mou
ntai
n Po
ol4
Pric
e
HIGHLY CONFIDENTIAL SUBJECT TO MODIFIED PROTECTIVE ORDER 10-337
Exhibit C - Supporting Materials NWN OPUC Advice No. 15-12/UG ____
Page 26 of 114

Nor
thw
est N
atur
al G
as C
ompa
nyH
IGH
LY C
ON
FID
ENTI
AL
PGA
Fili
ng G
uide
lines
SUB
JEC
T TO
MO
DIF
IED
PR
OTE
CTI
VE O
RD
ER 1
0-33
7
Nov
embe
r 1, 2
015
- Oct
ober
31,
201
6 Ph
ysic
al N
atur
al G
as te
rm c
ontr
acts
All
cont
ract
s ar
e w
ith A
ppro
ved
Cou
nter
part
ies
per E
xhib
it "G
" - N
W N
ATU
RA
L G
as S
uppl
y R
isk
Man
agem
ent P
olic
ies
App
rove
d C
ount
erpa
rtie
s al
l hav
e ex
ecut
ed N
AES
B c
ontr
acts
with
NW
Nat
ural
Hun
tingd
on, B
C S
uppl
y co
ntra
cts
Bas
eloa
dC
omm
odity
Publ
ishe
dVo
lum
e/D
aySu
pplie
rTe
rm S
tart
Term
End
Pric
eIn
dex
in D
th's
EDF
Trad
ing
Nor
th A
mer
ica,
LLC
11/1
/201
53/
31/2
016
IFG
MR-
NW
P Ca
nadi
an B
orde
r FO
M5,
000
Po
wer
ex C
orp.
11/1
/201
53/
31/2
016
IFG
MR-
NW
P Ca
nadi
an B
orde
r FO
M5,
000
PEN
DIN
G W
inte
r Onl
y ba
selo
ad11
/1/2
015
3/31
/201
610
,000
Tran
sact
ions
for n
ew P
GA
yea
rB
iddi
ng P
roce
ss In
form
atio
n#
of B
idde
rsR
ange
of b
ids.
Win
ning
Bid
Crit
eria
(1)
4Pr
ice
& Su
pplie
r
HIGHLY CONFIDENTIAL SUBJECT TO MODIFIED PROTECTIVE ORDER 10-337
Exhibit C - Supporting Materials NWN OPUC Advice No. 15-12/UG ____
Page 27 of 114
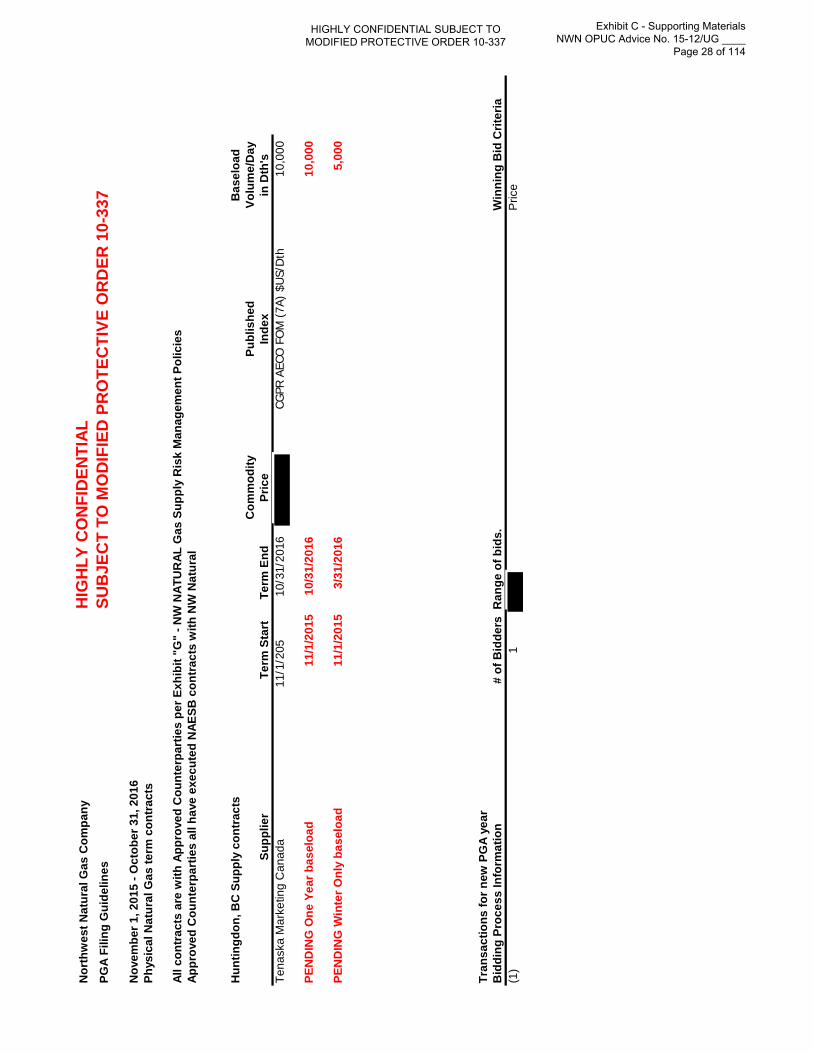
Nor
thw
est N
atur
al G
as C
ompa
nyH
IGH
LY C
ON
FID
ENTI
ALPG
A Fi
ling
Gui
delin
esSU
BJE
CT
TO M
OD
IFIE
D P
RO
TEC
TIVE
OR
DER
10-
337
Nov
embe
r 1, 2
015
- Oct
ober
31,
201
6 Ph
ysic
al N
atur
al G
as te
rm c
ontr
acts
All c
ontr
acts
are
with
App
rove
d C
ount
erpa
rtie
s pe
r Exh
ibit
"G"
- NW
NAT
UR
AL G
as S
uppl
y R
isk
Man
agem
ent P
olic
ies
Appr
oved
Cou
nter
part
ies
all h
ave
exec
uted
NAE
SB c
ontr
acts
with
NW
Nat
ural
Hun
tingd
on, B
C S
uppl
y co
ntra
cts
Bas
eloa
dC
omm
odity
Publ
ishe
dVo
lum
e/D
aySu
pplie
rTe
rm S
tart
Term
End
Pric
eIn
dex
in D
th's
Tena
ska
Mar
ketin
g C
anad
a11
/1/2
0510
/31/
2016
CGPR
AEC
O F
OM
(7A
) $U
S/D
th10
,000
PEN
DIN
G O
ne Y
ear b
asel
oad
11/1
/201
510
/31/
2016
10,0
00
PEN
DIN
G W
inte
r Onl
y ba
selo
ad11
/1/2
015
3/31
/201
65,
000
Tran
sact
ions
for n
ew P
GA
year
Bid
ding
Pro
cess
Info
rmat
ion
# of
Bid
ders
Ran
ge o
f bid
s.W
inni
ng B
id C
riter
ia(1
) 1
Pric
e
HIGHLY CONFIDENTIAL SUBJECT TO MODIFIED PROTECTIVE ORDER 10-337
Exhibit C - Supporting Materials NWN OPUC Advice No. 15-12/UG ____
Page 28 of 114

Nor
thw
est N
atur
al G
as C
ompa
nyH
IGH
LY C
ON
FID
ENTI
ALPG
A Fi
ling
Gui
delin
esSU
BJE
CT
TO M
OD
IFIE
D P
RO
TEC
TIVE
OR
DER
10-
337
Nov
embe
r 1, 2
015
- Oct
ober
31,
201
6 Ph
ysic
al N
atur
al G
as te
rm c
ontr
acts
All c
ontr
acts
are
with
App
rove
d C
ount
erpa
rtie
s pe
r Exh
ibit
"G"
- NW
NAT
UR
AL G
as S
uppl
y R
isk
Man
agem
ent P
olic
ies
Appr
oved
Cou
nter
part
ies
all h
ave
exec
uted
NAE
SB c
ontr
acts
with
NW
Nat
ural
Aeco
-NIT
Sup
ply
cont
ract
s B
asel
oad
Swin
gC
omm
odity
Publ
ishe
dVo
lum
e/D
ayVo
lum
e/D
ayC
ontr
actu
alSu
pplie
rTe
rm S
tart
Term
End
Pric
eIn
dex
in D
th's
in D
th's
Con
ditio
nsC
onoc
oPhi
llips
Can
ada
Mar
ketin
g (1
)11
/1/2
015
3/31
/201
6CG
PR A
ECO
FO
M (
7A)
$US/
Dth
5,00
0
Sun
cor E
nerg
y M
arke
ting
(1)
11/1
/201
53/
31/2
016
CGPR
AEC
O F
OM
(7A
) $U
S/D
th5,
000
Iber
drol
a E
nerg
y S
ervi
ces
(2)
11/1
/201
53/
31/2
016
CGPR
AEC
O F
OM
(7A
) $U
S/D
th5,
000
C
argi
ll Lt
d (2
)11
/1/2
015
3/31
/201
6CG
PR A
ECO
FO
M (
7A)
$US/
Dth
5,00
0
PEN
DIN
G O
ne Y
ear b
asel
oad
11/1
/201
510
/31/
2016
5,00
0
PEN
DIN
G W
inte
r Onl
y B
asel
oad
11/1
/201
53/
31/2
016
40,0
00
PEN
DIN
G W
inte
r Cal
l11
/1/2
015
3/31
/201
6up
to 1
0,00
0PE
ND
ING
Sum
mer
Put
4/1/
2016
10/3
1/20
16up
to 1
0,00
0
Tran
sact
ions
for n
ew P
GA
year
Bid
ding
Pro
cess
Info
rmat
ion
# of
Bid
ders
Ran
ge o
f bid
s.W
inni
ng B
id C
riter
ia(1
)5
Pric
e(2
)4
Pric
e
HIGHLY CONFIDENTIAL SUBJECT TO MODIFIED PROTECTIVE ORDER 10-337
Exhibit C - Supporting Materials NWN OPUC Advice No. 15-12/UG ____
Page 29 of 114
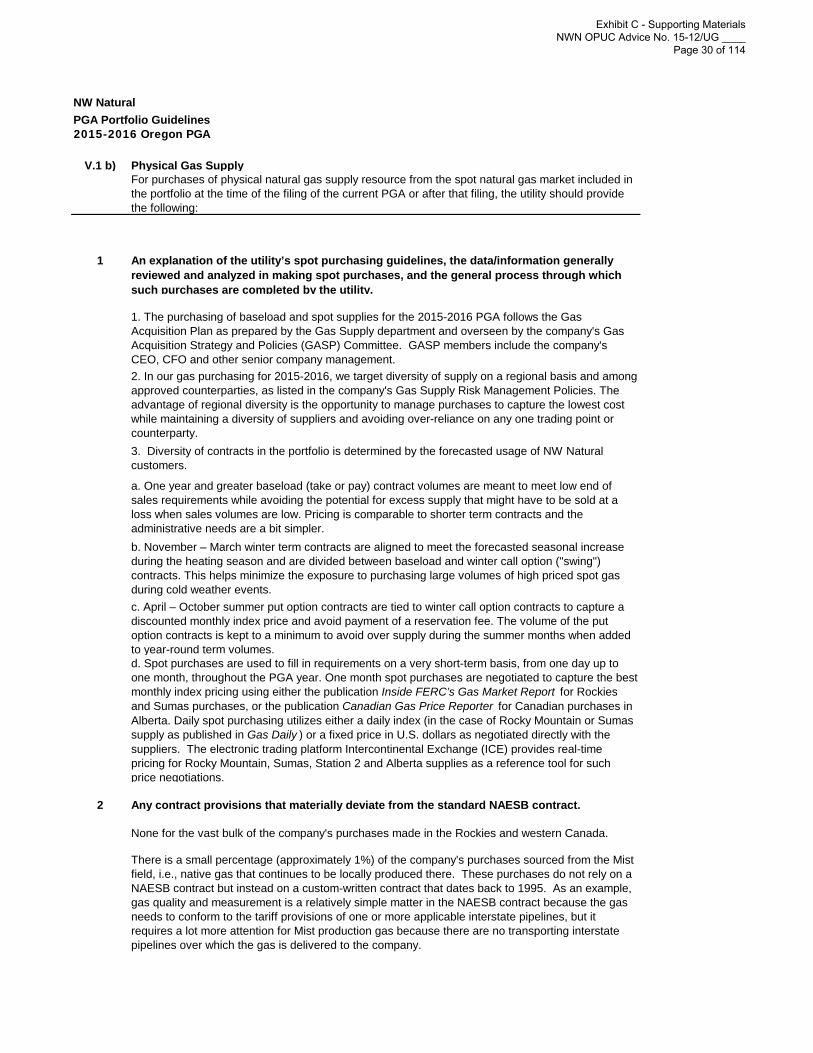
2015-2016 Oregon PGA
V.1 b) Physical Gas SupplyFor purchases of physical natural gas supply resource from the spot natural gas market included in the portfolio at the time of the filing of the current PGA or after that filing, the utility should provide the following:
1 An explanation of the utility’s spot purchasing guidelines, the data/information generally reviewed and analyzed in making spot purchases, and the general process through which such purchases are completed by the utility.
1. The purchasing of baseload and spot supplies for the 2015-2016 PGA follows the Gas Acquisition Plan as prepared by the Gas Supply department and overseen by the company's Gas Acquisition Strategy and Policies (GASP) Committee. GASP members include the company's CEO, CFO and other senior company management.2. In our gas purchasing for 2015-2016, we target diversity of supply on a regional basis and among approved counterparties, as listed in the company's Gas Supply Risk Management Policies. The advantage of regional diversity is the opportunity to manage purchases to capture the lowest cost while maintaining a diversity of suppliers and avoiding over-reliance on any one trading point or counterparty.3. Diversity of contracts in the portfolio is determined by the forecasted usage of NW Natural customers.
a. One year and greater baseload (take or pay) contract volumes are meant to meet low end of sales requirements while avoiding the potential for excess supply that might have to be sold at a loss when sales volumes are low. Pricing is comparable to shorter term contracts and the administrative needs are a bit simpler.b. November – March winter term contracts are aligned to meet the forecasted seasonal increase during the heating season and are divided between baseload and winter call option ("swing") contracts. This helps minimize the exposure to purchasing large volumes of high priced spot gas during cold weather events.c. April – October summer put option contracts are tied to winter call option contracts to capture a discounted monthly index price and avoid payment of a reservation fee. The volume of the put option contracts is kept to a minimum to avoid over supply during the summer months when added to year-round term volumes.d. Spot purchases are used to fill in requirements on a very short-term basis, from one day up to one month, throughout the PGA year. One month spot purchases are negotiated to capture the best monthly index pricing using either the publication Inside FERC’s Gas Market Report for Rockies and Sumas purchases, or the publication Canadian Gas Price Reporter for Canadian purchases in Alberta. Daily spot purchasing utilizes either a daily index (in the case of Rocky Mountain or Sumas supply as published in Gas Daily ) or a fixed price in U.S. dollars as negotiated directly with the suppliers. The electronic trading platform Intercontinental Exchange (ICE) provides real-time pricing for Rocky Mountain, Sumas, Station 2 and Alberta supplies as a reference tool for such price negotiations.
2 Any contract provisions that materially deviate from the standard NAESB contract.
None for the vast bulk of the company's purchases made in the Rockies and western Canada.
There is a small percentage (approximately 1%) of the company's purchases sourced from the Mist field, i.e., native gas that continues to be locally produced there. These purchases do not rely on a NAESB contract but instead on a custom-written contract that dates back to 1995. As an example, gas quality and measurement is a relatively simple matter in the NAESB contract because the gas needs to conform to the tariff provisions of one or more applicable interstate pipelines, but it requires a lot more attention for Mist production gas because there are no transporting interstate pipelines over which the gas is delivered to the company.
NW NaturalPGA Portfolio Guidelines
Exhibit C - Supporting Materials NWN OPUC Advice No. 15-12/UG ____
Page 30 of 114


NW
Nat
ural
UM
128
6 P
GA
Por
tfol
io G
uide
lines
2015
-201
6 O
rego
n P
GA
V.3.
a
Cus
tom
er C
ntR
even
ueC
usto
mer
Cnt
Rev
enue
Cus
tom
er C
ntR
even
ueJu
l-14
Jul-1
4Au
g-14
Aug-
14Se
p-14
Sep-
14To
tal
696,
677
29,3
98,7
17.5
6$
69
5,90
2
26
,382
,229
.04
$
696,
172
27
,226
,396
.58
$
Ore
gon
622,
708
26,4
55,7
56.1
1
62
1,87
2
23
,839
,563
.47
622,
053
24
,593
,632
.76
Was
hing
ton
73,9
69
2,94
2,96
1.45
74
,030
2,
542,
665.
57
74,1
19
2,63
2,76
3.82
To
tal R
esid
entia
l63
0,26
2
14
,884
,815
.81
629,
627
13,1
13,8
56.9
4
62
9,96
8
13,4
22,3
44.1
0
To
tal C
omm
erci
al65
,427
9,
250,
068.
64
65,2
90
8,18
8,77
5.63
65
,215
8,
479,
500.
25
Tota
l Ind
ustri
al
585
1,78
7,69
9.74
58
3
1,
736,
778.
93
586
1,
897,
327.
51
Tota
l Int
erru
ptib
le14
7
2,
199,
987.
83
146
2,05
6,34
6.47
14
7
2,11
9,43
1.70
To
tal T
rans
porta
tion
- Com
mer
cial
Firm
47
82,8
50.1
3
47
82
,088
.47
47
84
,106
.55
Tota
l Tra
nspo
rtatio
n - I
ndus
trial
Firm
110
588,
294.
91
11
0
58
1,32
0.29
110
59
6,02
0.85
Tota
l Tra
nspo
rtatio
n - I
nter
rupt
ible
99
605,
000.
50
99
62
3,06
2.31
99
62
7,66
5.62
U
nbille
d R
even
ue(3
,329
,329
.50)
515,
356.
64
68
7,61
4.47
Ag
ency
Fee
sN
et B
alan
cing
/Ove
rrun
47.0
0
11.0
0
-
Tota
l Gas
Ope
ratin
g R
even
ue26
,069
,435
.06
$
26,8
97,5
96.6
8$
27
,914
,011
.05
$
Cust
omer
cou
nt a
nd r
even
ue b
y m
onth
and
cla
ss.
Exhibit C - Supporting Materials NWN OPUC Advice No. 15-12/UG ____
Page 33 of 114

NW
Nat
ural
UM
128
6 P
GA
Por
tfol
io G
uide
lines
2015
-201
6 O
rego
n P
GA
V.3.
a
Tota
l
Ore
gon
W
ashi
ngto
n
Tota
l Res
iden
tial
To
tal C
omm
erci
al
Tota
l Ind
ustri
al
To
tal I
nter
rupt
ible
To
tal T
rans
porta
tion
- Com
mer
cial
Firm
To
tal T
rans
porta
tion
- Ind
ustri
al F
irm
Tota
l Tra
nspo
rtatio
n - I
nter
rupt
ible
Unb
illed
Rev
enue
Agen
cy F
ees
Net
Bal
anci
ng/O
verr
unTo
tal G
as O
pera
ting
Rev
enue
Cust
omer
cou
nt a
nd r
even
ue b
y m
onth
and
cla
ss.
Cus
tom
er C
ntR
even
ueC
usto
mer
Cnt
Rev
enue
Cus
tom
er C
ntR
even
ueO
ct-1
4O
ct-1
4N
ov-1
4N
ov-1
4D
ec-1
4D
ec-1
469
7,70
4
30
,954
,625
.86
$
700,
842
58,6
23,1
55.3
5$
704,
644
105,
202,
223.
27$
623,
406
28,0
00,1
55.5
8
62
6,23
6
53
,049
,915
.37
62
9,63
4
94
,522
,707
.95
74
,298
2,
954,
470.
28
74
,606
5,
573,
239.
98
75,0
10
10,6
79,5
15.3
2
631,
412
15,5
29,7
90.7
0
63
4,17
1
34
,821
,997
.83
63
7,41
1
65
,918
,724
.88
65
,302
9,
619,
957.
54
65
,647
16
,874
,598
.89
66
,204
31
,853
,411
.90
58
7
1,
969,
279.
70
57
2
2,
169,
716.
51
571
2,55
9,99
0.07
147
2,46
4,52
5.77
140
3,20
2,86
0.81
14
2
3,
299,
447.
23
47
93
,504
.44
98
208,
433.
22
10
0
22
1,63
3.07
11
0
62
5,98
3.20
11
4
68
8,93
0.16
116
698,
315.
76
99
651,
584.
51
100
656,
617.
93
10
0
65
0,70
0.36
9,
673,
361.
67
35
,692
,017
.79
(1
,521
,265
.73)
-
-
8,
741.
00
40
,627
,987
.53
$
94,3
15,1
73.1
4$
103,
689,
698.
54$
Exhibit C - Supporting Materials NWN OPUC Advice No. 15-12/UG ____
Page 34 of 114

NW
Nat
ural
UM
128
6 P
GA
Por
tfol
io G
uide
lines
2015
-201
6 O
rego
n P
GA
V.3.
a
Tota
l
Ore
gon
W
ashi
ngto
n
Tota
l Res
iden
tial
To
tal C
omm
erci
al
Tota
l Ind
ustri
al
To
tal I
nter
rupt
ible
To
tal T
rans
porta
tion
- Com
mer
cial
Firm
To
tal T
rans
porta
tion
- Ind
ustri
al F
irm
Tota
l Tra
nspo
rtatio
n - I
nter
rupt
ible
Unb
illed
Rev
enue
Agen
cy F
ees
Net
Bal
anci
ng/O
verr
unTo
tal G
as O
pera
ting
Rev
enue
Cust
omer
cou
nt a
nd r
even
ue b
y m
onth
and
cla
ss.
Cus
tom
er C
ntR
even
ueC
usto
mer
Cnt
Rev
enue
Cus
tom
er C
ntR
even
ueJa
n-15
Jan-
15Fe
b-15
Feb-
15M
ar-1
5M
ar-1
570
6,10
2
117,
162,
074.
27$
70
6,86
1
90,2
51,1
16.3
1$
707,
472
76
,780
,740
.34
$
630,
888
10
5,55
1,63
0.06
631,
556
81
,437
,220
.44
63
2,05
4
69,6
23,6
35.2
6
75
,214
11,6
10,4
44.2
1
75,3
05
8,
813,
895.
87
75
,418
7,15
7,10
5.08
638,
876
73
,883
,919
.15
63
9,59
9
56,2
17,2
86.9
6
640,
235
46
,825
,624
.40
66,2
01
35
,705
,737
.58
66
,238
27,2
31,0
38.4
2
66,2
14
23
,139
,322
.56
569
2,
617,
771.
65
569
2,33
6,83
1.96
566
2,17
4,84
3.82
140
3,
375,
959.
37
140
3,00
6,65
3.94
141
3,17
0,70
0.55
100
21
8,53
0.70
100
185,
898.
47
100
179,
269.
85
116
70
7,04
1.28
116
657,
370.
35
117
665,
725.
81
100
65
3,11
4.54
99
61
6,03
6.21
99
625,
253.
35
(10,
489,
606.
82)
(10,
589,
225.
94)
(5
,848
,278
.05)
-
740.
00
-
10
6,67
2,46
7.45
$
79,6
62,6
30.3
7$
70,9
32,4
62.2
9$
Exhibit C - Supporting Materials NWN OPUC Advice No. 15-12/UG ____
Page 35 of 114

NW
Nat
ural
UM
128
6 P
GA
Por
tfol
io G
uide
lines
2015
-201
6 O
rego
n P
GA
V.3.
a
Tota
l
Ore
gon
W
ashi
ngto
n
Tota
l Res
iden
tial
To
tal C
omm
erci
al
Tota
l Ind
ustri
al
To
tal I
nter
rupt
ible
To
tal T
rans
porta
tion
- Com
mer
cial
Firm
To
tal T
rans
porta
tion
- Ind
ustri
al F
irm
Tota
l Tra
nspo
rtatio
n - I
nter
rupt
ible
Unb
illed
Rev
enue
Agen
cy F
ees
Net
Bal
anci
ng/O
verr
unTo
tal G
as O
pera
ting
Rev
enue
Cust
omer
cou
nt a
nd r
even
ue b
y m
onth
and
cla
ss.
Cus
tom
er C
ntR
even
ueC
usto
mer
Cnt
Rev
enue
Cus
tom
er C
ntR
even
ueAp
r-15
Apr-
15M
ay-1
5M
ay-1
5Ju
n-15
Jun-
1570
7,58
8
64
,400
,212
.73
$
70
7,75
6
50,6
01,3
06.4
0$
70
7,53
9
27,0
51,3
50.5
7$
632,
066
58,4
55,7
50.1
1
632,
138
45
,950
,660
.52
631,
843
23
,631
,958
.97
75
,522
5,94
4,46
2.62
75
,618
4,
650,
645.
88
75,6
96
3,
419,
391.
60
640,
437
38,6
15,8
76.1
2
640,
682
28
,423
,380
.34
640,
581
13
,456
,039
.28
66
,128
19,3
78,9
74.7
8
66,0
52
16,4
01,5
03.0
0
65
,936
9,44
7,22
3.00
56
8
2,
083,
642.
68
569
1,
901,
518.
23
568
1,29
1,30
3.59
14
0
2,
853,
434.
90
138
2,
461,
717.
82
137
1,51
1,08
6.37
10
0
17
4,38
6.39
100
14
3,17
8.62
100
121,
996.
57
11
6
66
4,42
6.38
116
64
0,71
0.14
117
603,
901.
45
99
62
9,47
1.48
99
62
9,29
8.25
100
619,
800.
31
(3
,703
,323
.34)
(8
,033
,521
.38)
(5,1
33,4
63.1
8)
189.
00
-
3,
089.
00
60
,697
,078
.39
$
42
,567
,785
.02
$
21,9
20,9
76.3
9$
Exhibit C - Supporting Materials NWN OPUC Advice No. 15-12/UG ____
Page 36 of 114

NW
Nat
ural
UM
1286
PG
A P
ortf
olio
Gui
delin
es20
15-2
016
Ore
gon
PG
A
V.3.
bH
isto
rical
(fiv
e ye
ars)
and
fore
cast
ed (o
ne y
ear a
head
) sal
es s
yste
m p
hysi
cal p
eak
dem
and.
2015
/201
6 Fo
reca
sted
2014
/201
520
13/2
014
2012
/201
3 20
11/2
012
2010
/201
1
Syst
em p
eak
dem
and
(the
rms)
9,45
2,96
09,
369,
764
9,32
0,24
29,
252,
236
9,42
4,40
09,
450,
100
Exhibit C - Supporting Materials NWN OPUC Advice No. 15-12/UG ____
Page 37 of 114

NW
Nat
ural
UM
1286
PG
A P
ortf
olio
Gui
delin
es20
15-2
016
Ore
gon
PG
A
V.3.
cH
isto
rical
(fiv
e ye
ars)
and
fore
cast
ed (o
ne y
ear a
head
) sal
es s
yste
m p
hysi
cal a
nnua
l dem
and
Gas
Yea
rFo
reca
sted
201
5/20
1620
14/2
015
2013
/201
420
12/2
013
2011
/201
220
10/2
011
Ann
ual D
eman
d (th
erm
s)75
7,00
5,31
374
7,79
0,90
474
6,84
7,55
673
2,27
2,08
175
9,95
2,95
276
4,74
0,02
5
Exhibit C - Supporting Materials NWN OPUC Advice No. 15-12/UG ____
Page 38 of 114

NW
Nat
ural
UM
1286
PG
A P
ortf
olio
Gui
delin
es20
15-2
016
Ore
gon
PG
A
V.3
.d.
1.
Gas
Yea
r Fo
reca
sted
201
5/20
1620
14/2
015
2013
/201
420
12/2
013
2011
/201
220
10/2
011
Res
iden
tial (
ther
ms)
413,
822,
757
340,
361,
989
41
6,38
9,18
1
38
5,90
9,96
7
412,
646,
882
41
7,05
8,26
9
Com
mer
cial
(the
rms)
251,
595,
828
216,
426,
531
25
4,87
7,09
1
23
7,49
0,34
1
251,
126,
608
25
2,59
5,46
2
Indu
stria
l Firm
(the
rms)
32,4
20,9
4532
,273
,813
34,8
38,4
43
33
,521
,314
36,5
91,0
01
37
,507
,291
In
dust
rial I
nter
rupt
ible
(the
rms)
59,1
65,7
8258
,789
,923
62,5
13,3
67
58
,152
,459
59,4
95,4
87
59
,897
,024
Upd
ated
for a
ctua
ls
His
toric
al (f
ive
year
s), a
nd fo
reca
sted
(one
yea
r ahe
ad) s
ales
sys
tem
phy
sica
l dem
and
for e
ach
of th
e fo
llow
ing:
Ann
ual f
or e
ach
cust
omer
cla
ss
Exhibit C - Supporting Materials NWN OPUC Advice No. 15-12/UG ____
Page 39 of 114

NW
Nat
ural
UM
1286
PG
A P
ortf
olio
Gui
delin
es20
15-2
016
Ore
gon
PG
A
V.3.
d.
2.
Gas
Yea
r Fo
reca
sted
20
15-2
016
2014
/201
520
13/2
014
2012
/201
320
11/2
012
2010
/201
1N
ovem
ber
22,3
51,6
4422
,999
,936
22
,397
,233
22
,308
,001
22,3
43,1
88
22
,177
,486
Dec
embe
r22
,916
,079
24,2
82,7
15
23,2
02,8
72
23,0
64,4
85
23
,284
,414
23,0
34,1
72
Ja
nuar
y22
,938
,449
24,3
62,0
06
23,1
96,6
14
23,0
81,2
08
23
,283
,122
23,0
64,1
36
Fe
brua
ry21
,874
,421
22,1
59,1
74
20,9
43,2
60
20,8
59,8
21
21
,819
,517
20,7
79,4
77
M
arch
22,9
68,8
8223
,866
,828
23
,202
,391
23
,109
,951
23,2
98,9
52
23
,041
,150
April
22,4
40,6
8422
,869
,798
22
,513
,500
22
,379
,225
22,5
14,7
58
22
,275
,981
May
22,9
97,5
4323
,238
,337
23
,254
,362
23
,138
,668
23,2
51,9
08
22
,972
,378
June
22,4
70,4
4322
,332
,108
22
,556
,453
22
,399
,655
22,4
49,7
49
22
,181
,087
July
23,0
23,3
5323
,019
,887
23
,314
,587
23
,152
,520
22,7
84,4
59
23
,022
,789
Augu
st23
,050
,124
23,0
15,1
23
23,3
24,4
27
23,1
62,2
91
23
,007
,978
23,0
30,5
26
Se
ptem
ber
22,5
27,3
6222
,737
,568
22
,537
,805
22
,425
,676
22,2
73,3
29
22
,193
,140
Oct
ober
23,1
00,6
4023
,881
,459
23
,359
,078
23
,196
,701
23,0
35,7
35
23
,025
,826
Annu
al27
2,65
9,62
527
8,76
4,93
927
3,80
2,58
127
2,27
8,20
127
3,34
7,10
927
0,79
8,14
8
His
toric
al (f
ive
year
s), a
nd fo
reca
sted
(one
yea
r ahe
ad) s
ales
sys
tem
phy
sica
l dem
and
for e
ach
of th
e fo
llow
ing:
Annu
al a
nd m
onth
ly b
ase
load
Exhibit C - Supporting Materials NWN OPUC Advice No. 15-12/UG ____
Page 40 of 114

NW
Nat
ural
UM
1286
PG
A P
ortf
olio
Gui
delin
es20
15-2
016
Ore
gon
PG
A
V.3.
d.
3.
Gas
Yea
rFo
reca
sted
20
15/2
016
2014
/201
520
13/2
014
2012
/201
320
11/2
012
2010
/201
1N
ovem
ber
64,2
42,9
7662
,486
,370
62
,248
,709
61,2
26,2
39
40,4
91,4
99
33,1
53,4
63
D
ecem
ber
98,7
95,8
5596
,475
,524
95
,405
,022
90,4
81,3
45
86,5
34,8
33
81,3
21,7
73
Ja
nuar
y92
,054
,676
90,4
86,1
11
91,3
82,4
51
86
,593
,507
97
,758
,992
97
,632
,484
Febr
uary
74,8
51,8
3571
,804
,677
72
,204
,387
69,5
75,3
67
78,5
30,9
12
76,1
25,4
02
M
arch
59,8
55,2
9258
,202
,117
58
,522
,284
56,4
08,0
82
74,1
69,0
45
79,1
34,3
29
Ap
ril40
,203
,184
38,4
91,5
13
38,7
45,7
92
37
,886
,663
54
,489
,168
55
,063
,637
May
18,6
00,3
6217
,127
,632
17
,039
,845
15,9
82,5
05
25,6
16,7
66
37,9
73,5
15
Ju
ne4,
336,
063
3,48
8,68
9
4,18
1,98
9
3,79
9,25
1
13
,742
,491
18
,528
,871
July
304,
475
25,2
01
707,
612
393,
204
4,
443,
994
3,
792,
900
Augu
st0
-
769,
863
358,
541
56
9,56
5
45
6,28
2
Sept
embe
r2,
211,
685
2,29
1,29
8
3,22
0,57
3
1,67
3,21
3
1,
867,
959
1,
657,
358
Oct
ober
28,8
89,2
8528
,146
,833
28
,616
,445
27,5
84,4
76
27,7
56,5
49
9,10
1,86
3
Annu
al48
4,34
5,68
846
9,02
5,96
547
3,04
4,97
545
1,96
2,39
450
5,97
1,77
349
3,94
1,87
7
His
toric
al (f
ive
year
s), a
nd fo
reca
sted
(one
yea
r ahe
ad) s
ales
sys
tem
phy
sica
l dem
and
for e
ach
of th
e fo
llow
ing:
Annu
al a
nd m
onth
ly n
on-b
ase
load
Exhibit C - Supporting Materials NWN OPUC Advice No. 15-12/UG ____
Page 41 of 114
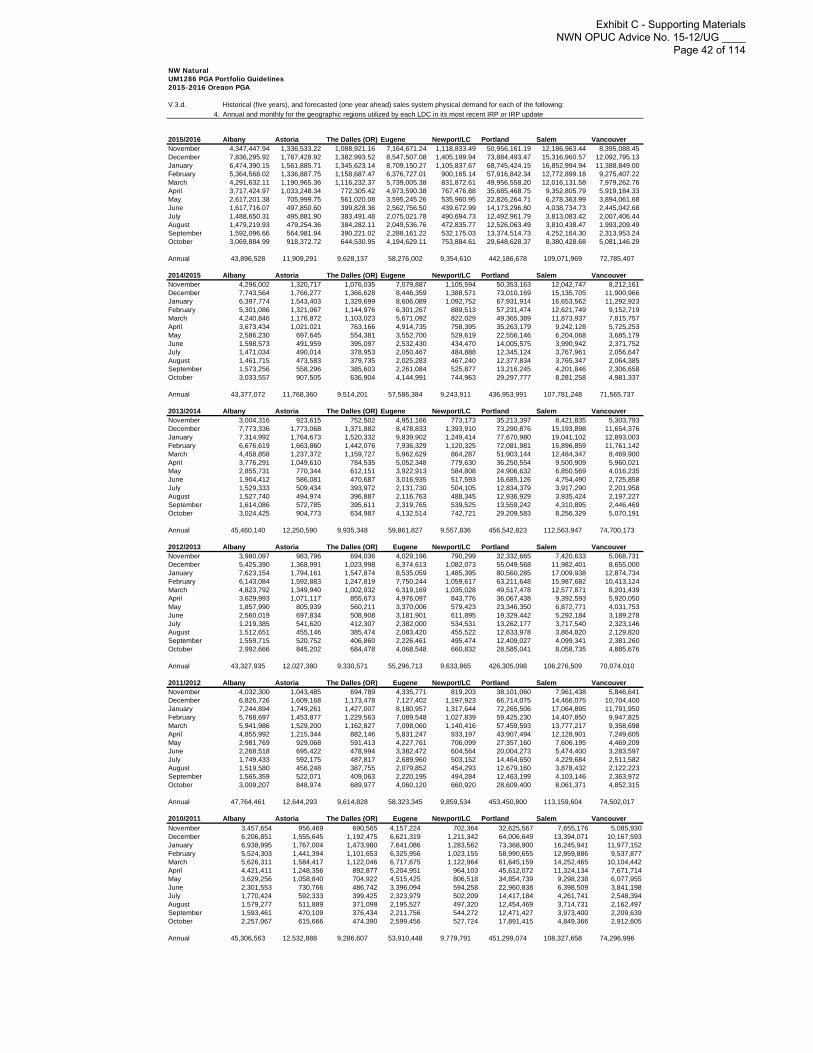
NW NaturalUM1286 PGA Portfolio Guidelines2015-2016 Oregon PGA
V.3.d.4. Annual and monthly for the geographic regions utilized by each LDC in its most recent IRP or IRP update
2015/2016 Albany Astoria The Dalles (OR) Eugene Newport/LC Portland Salem VancouverNovember 4,347,447.94 1,336,533.22 1,088,921.16 7,164,671.24 1,118,833.49 50,956,161.19 12,186,963.44 8,395,088.45 December 7,836,295.92 1,787,428.92 1,382,993.52 8,547,507.08 1,405,199.94 73,884,493.47 15,316,960.57 12,092,795.13 January 6,474,390.15 1,561,885.71 1,345,623.14 8,709,150.27 1,105,837.67 68,745,424.15 16,852,994.94 11,388,849.00 February 5,364,568.02 1,336,887.75 1,158,687.47 6,376,727.01 900,165.14 57,916,842.34 12,772,899.18 9,275,407.22 March 4,291,632.11 1,190,965.36 1,116,232.37 5,739,005.38 831,872.61 49,956,558.20 12,016,131.58 7,979,262.76 April 3,717,424.97 1,033,248.34 772,305.42 4,973,590.38 767,476.88 35,685,468.75 9,352,805.79 5,919,184.33 May 2,617,201.38 705,999.75 561,020.08 3,595,245.26 535,960.95 22,826,264.71 6,278,363.99 3,894,061.68 June 1,617,716.07 497,850.60 399,828.36 2,562,756.50 439,672.99 14,173,296.80 4,038,734.73 2,445,042.68 July 1,488,650.31 495,881.90 383,491.48 2,075,021.78 490,694.73 12,492,961.79 3,813,083.42 2,007,406.44 August 1,479,219.93 479,254.36 384,282.11 2,049,536.76 472,835.77 12,526,063.49 3,810,438.47 1,993,209.49 September 1,592,096.66 564,981.94 390,221.02 2,288,161.22 532,175.03 13,374,514.73 4,252,164.30 2,313,953.24 October 3,069,884.99 918,372.72 644,530.95 4,194,629.11 753,884.61 29,648,628.37 8,380,428.68 5,081,146.29
Annual 43,896,528 11,909,291 9,628,137 58,276,002 9,354,610 442,186,678 109,071,969 72,785,407
2014/2015 Albany Astoria The Dalles (OR) Eugene Newport/LC Portland Salem VancouverNovember 4,296,002 1,320,717 1,076,035 7,079,887 1,105,594 50,353,163 12,042,747 8,212,161 December 7,743,564 1,766,277 1,366,628 8,446,359 1,388,571 73,010,169 15,135,705 11,900,966 January 6,397,774 1,543,403 1,329,699 8,606,089 1,092,752 67,931,914 16,653,562 11,292,923 February 5,301,086 1,321,067 1,144,976 6,301,267 889,513 57,231,474 12,621,749 9,152,719 March 4,240,846 1,176,872 1,103,023 5,671,092 822,029 49,365,389 11,873,937 7,815,757 April 3,673,434 1,021,021 763,166 4,914,735 758,395 35,263,179 9,242,128 5,725,253 May 2,586,230 697,645 554,381 3,552,700 529,619 22,556,146 6,204,068 3,685,179 June 1,598,573 491,959 395,097 2,532,430 434,470 14,005,575 3,990,942 2,371,752 July 1,471,034 490,014 378,953 2,050,467 484,888 12,345,124 3,767,961 2,056,647 August 1,461,715 473,583 379,735 2,025,283 467,240 12,377,834 3,765,347 2,064,385 September 1,573,256 558,296 385,603 2,261,084 525,877 13,216,245 4,201,846 2,306,658 October 3,033,557 907,505 636,904 4,144,991 744,963 29,297,777 8,281,258 4,981,337
Annual 43,377,072 11,768,360 9,514,201 57,586,384 9,243,911 436,953,991 107,781,248 71,565,737
2013/2014 Albany Astoria The Dalles (OR) Eugene Newport/LC Portland Salem VancouverNovember 3,004,316 923,615 752,502 4,951,166 773,173 35,213,397 8,421,835 5,303,793 December 7,773,336 1,773,068 1,371,882 8,478,833 1,393,910 73,290,876 15,193,898 11,654,376 January 7,314,992 1,764,673 1,520,332 9,839,902 1,249,414 77,670,980 19,041,102 12,893,003 February 6,676,619 1,663,860 1,442,076 7,936,329 1,120,325 72,081,981 15,896,859 11,761,142 March 4,458,858 1,237,372 1,159,727 5,962,629 864,287 51,903,144 12,484,347 8,469,900 April 3,776,291 1,049,610 784,535 5,052,348 779,630 36,250,554 9,500,909 5,960,021 May 2,855,731 770,344 612,151 3,922,913 584,808 24,906,632 6,850,569 4,016,235 June 1,904,412 586,081 470,687 3,016,935 517,593 16,685,126 4,754,490 2,725,858 July 1,529,333 509,434 393,972 2,131,730 504,105 12,834,379 3,917,290 2,201,958 August 1,527,740 494,974 396,887 2,116,763 488,345 12,936,929 3,935,424 2,197,227 September 1,614,086 572,785 395,611 2,319,765 539,525 13,559,242 4,310,895 2,446,469 October 3,024,425 904,773 634,987 4,132,514 742,721 29,209,583 8,256,329 5,070,191
Annual 45,460,140 12,250,590 9,935,348 59,861,827 9,557,836 456,542,823 112,563,947 74,700,173
2012/2013 Albany Astoria The Dalles (OR) Eugene Newport/LC Portland Salem VancouverNovember 3,980,097 983,796 694,036 4,029,196 790,299 32,332,665 7,420,633 5,068,731 December 5,425,390 1,368,991 1,023,998 6,374,613 1,082,073 55,049,568 11,982,401 8,655,000 January 7,623,154 1,794,161 1,547,874 8,535,059 1,485,395 80,560,285 17,009,938 12,874,734 February 6,143,084 1,592,883 1,247,819 7,750,244 1,059,617 63,211,648 15,987,682 10,413,124 March 4,823,792 1,349,940 1,002,932 6,319,169 1,035,028 49,517,478 12,577,871 8,201,439 April 3,629,993 1,071,117 855,673 4,976,097 843,776 36,067,438 9,392,593 5,920,050 May 1,857,990 805,939 560,211 3,370,006 579,423 23,346,350 6,872,771 4,031,753 June 2,560,019 697,834 508,908 3,181,901 611,895 19,329,442 5,292,184 3,189,278 July 1,219,385 541,620 412,307 2,382,000 534,531 13,262,177 3,717,540 2,323,146 August 1,512,651 455,146 385,474 2,083,420 455,522 12,633,978 3,864,820 2,129,820 September 1,559,715 520,752 406,860 2,226,461 495,474 12,409,027 4,099,341 2,381,260 October 2,992,666 845,202 684,478 4,068,548 660,832 28,585,041 8,058,735 4,885,676
Annual 43,327,935 12,027,380 9,330,571 55,296,713 9,633,865 426,305,098 106,276,509 70,074,010
2011/2012 Albany Astoria The Dalles (OR) Eugene Newport/LC Portland Salem VancouverNovember 4,032,300 1,043,485 694,789 4,335,771 819,203 38,101,060 7,961,438 5,846,641 December 6,826,726 1,609,168 1,173,478 7,127,402 1,197,923 66,714,075 14,466,075 10,704,400 January 7,244,894 1,749,261 1,427,007 8,180,957 1,317,644 72,265,506 17,064,895 11,791,950 February 5,768,697 1,453,877 1,229,563 7,089,548 1,027,839 59,425,230 14,407,850 9,947,825 March 5,941,986 1,529,200 1,162,827 7,098,060 1,140,416 57,459,593 13,777,217 9,358,698 April 4,855,992 1,215,344 882,146 5,831,247 933,197 43,907,494 12,128,901 7,249,605 May 2,981,769 929,068 591,413 4,227,761 706,099 27,357,160 7,606,195 4,469,209 June 2,268,518 695,422 478,994 3,382,472 604,564 20,004,273 5,474,400 3,283,597 July 1,749,433 592,175 487,817 2,689,960 503,152 14,464,650 4,229,684 2,511,582 August 1,519,580 456,248 387,755 2,079,852 454,293 12,679,160 3,878,432 2,122,223 September 1,565,359 522,071 409,063 2,220,195 494,284 12,463,199 4,103,146 2,363,972 October 3,009,207 848,974 689,977 4,060,120 660,920 28,609,400 8,061,371 4,852,315
Annual 47,764,461 12,644,293 9,614,828 58,323,345 9,859,534 453,450,800 113,159,604 74,502,017
2010/2011 Albany Astoria The Dalles (OR) Eugene Newport/LC Portland Salem VancouverNovember 3,457,654 956,469 690,565 4,157,224 702,364 32,625,567 7,655,176 5,085,930December 6,206,851 1,555,645 1,192,475 6,621,319 1,211,342 64,006,649 13,394,071 10,167,593January 6,938,995 1,767,004 1,473,980 7,641,086 1,283,562 73,368,900 16,245,941 11,977,152February 5,524,303 1,441,394 1,101,653 6,325,956 1,023,155 58,990,655 12,959,886 9,537,877March 5,626,311 1,584,417 1,122,046 6,717,675 1,122,964 61,645,159 14,252,465 10,104,442April 4,421,411 1,248,356 892,877 5,204,951 964,103 45,612,072 11,324,134 7,671,714May 3,629,256 1,058,840 704,922 4,515,425 806,518 34,854,739 9,298,238 6,077,955June 2,301,553 730,766 486,742 3,396,094 594,258 22,960,838 6,398,509 3,841,198July 1,770,424 592,333 399,425 2,323,979 502,209 14,417,184 4,261,741 2,548,394August 1,579,277 511,889 371,098 2,195,527 497,320 12,454,469 3,714,731 2,162,497September 1,593,461 470,109 376,434 2,211,756 544,272 12,471,427 3,973,400 2,209,639October 2,257,067 615,666 474,390 2,599,456 527,724 17,891,415 4,849,366 2,912,605
Annual 45,306,563 12,532,888 9,286,607 53,910,448 9,779,791 451,299,074 108,327,658 74,296,996
Historical (five years), and forecasted (one year ahead) sales system physical demand for each of the following:
Exhibit C - Supporting Materials NWN OPUC Advice No. 15-12/UG ____
Page 42 of 114

Northwest Natural Gas CompanyUM1286 PGA Portfolio Guidelines2015-2016 Oregon PGA
V.4 Market Information:General historical and forecasted (one year ahead) conditions in the national and regional physical and financial natural gas purchase markets. This should include descriptions of each major supply point from which the LDC physically purchases and the major factors affecting supply, prices, and liquidity at those points.
Deregulation from the late 1970s to early 1990s was a response to perceived natural gas shortages. In the new unregulated environment, prices dropped due to competition, increased efficiencies, technological improvements, and the discovery of more natural gas.
In the early 2000s, prices rose dramatically due to tightness in the supply/demand balance, a situation that Enron (and others) sought to exploit. This led to scandals, lawsuits, regulatory investigations, bankruptcies and other headline-making news that obscured the fact that gas supplies really were tightening and that demand growth would be dependent on bringing additional supplies to North America in the form of LNG imports. Catastrophic hurricanes (Katrina, Rita, et al) in 2005 interrupted natural gas supplies from the Gulf of Mexico and prices spiked again. Gas prices soared in the spring and summer of 2008 on the tails of predicted supply shortfalls. At that time, Henry Hub prices peaked at $13.31. Within months, the onset of a global economic recession reduced demand while the advent of horizontal drilling into shale formations unleashed a surge of production. Prices soon tumbled (Figure 1). Historical indexed prices into the Pacific Northwest at NW Natural's major supply points reflected national trends (Figure 2).
Exhibit C - Supporting Materials NWN OPUC Advice No. 15-12/UG ____
Page 43 of 114

Figure 3
The major factors affecting this outlook are:
Prices are expected to rise. The U.S. Energy Information Administration’s (EIA) Annual Energy Outlook dated April 2015 examined three scenarios in addition to a reference case and the question is not whether, but by how much and how quickly will prices increase over time (Figure 3).
As mentioned, production began ramping up in 2008 with the surge in shale drilling innovations. Prices fell dramatically but as shown in Figure 2, bottomed out by spring 2012
Exhibit C - Supporting Materials NWN OPUC Advice No. 15-12/UG ____
Page 44 of 114

1. Natural gas production in the U.S. is at record levels and continues to grow, pushing down prices. Growth will continue through 2015 and 2016 according to most experts. Bentek expects a 4.2 Bcfd increase for November 2014 through October 2015 compared to the prior 12 months. The EIA says production will jump by 3.7 Bcfd in 2015 with another 1.6 Bcfd increase in 2016. IHS is forecasting a 2.7 Bcfd production increase in 2015 and another 1.1 in 2016.
Production forecasts were traditionally based on drilling rig counts, which seemed like the clearest leading indicator of future production levels. However, U.S. gas drilling rig counts fell from 992 in 2011 to 268 in March 2015, the lowest level in 20 years, yet production continued to rise. Several reasons have contributed to the breakdown of traditional methods for estimating natural gas production. The development of shale resources increased integration of oil and gas production. Natural gas is often produced from rigs that target oil. Also, there have been increases in drilling efficiency, or the number of wells drilled per rig each month. And there is a backlog of wells that have been drilled but not yet completed. That acts as a cushion for well additions, offsetting immediate decreases in drilling activity and delaying the production impact.
2. Power generation has become the gyroscope for U.S. natural gas, helping to balance supply and demand and keep prices within a certain range. Gas and coal battle for power generation load. Price often dictates the winner, with a small change in price creating a large change in demand. Increases in gas supply or decreases in demand can cause gas prices to drop below coal prices. Power generators then switch from coal to gas. Gas demand goes up. Gas prices start moving back up. Power generators eventually switch back to coal. Gas demand drops. Gas prices drop. The cycle repeats.
Fuel switching for price occurs more often in Eastern states due to higher coal prices in the Central Appalachian region (CAPP). Recently, natural gas prices have even dipped below cheaper coal prices in the Powder River Basin (PRB), a region centered in Wyoming. Sometimes a small price change has a huge impact on demand. A drop in Henry Hub prices from about $2.50 to $2.00/Dth could trigger a 5 Bcfd increase in natural gas for power generation.
Bentek says natural gas prices will reach a low point in 2015 and then rise, diffusing some future fuel switching incentive for power generators. Nevertheless, coal plant retirements should push gas power demand to record levels.
A very recent development is the June 29, 2015, decision by the Supreme Court to overturn EPA's Mercury and Air Toxics Standards (MATS) rule. Initial reactions seem to indicate that this decision will have a relatively modest impact on the future generation mix due to the investments already made by power companies to comply with EPA's regulations.
3. An industrial renaissance is expected in the U.S. in response to lower gas prices, but the timing and location(s) of that response are highly uncertain. For the next year or two, the impact in the Pacific Northwest is likely to be small. Given that any very large-scale plant expansions would take at least a couple of years to construct, we should be able to estimate their impact well in advance of operation.
Exhibit C - Supporting Materials NWN OPUC Advice No. 15-12/UG ____
Page 45 of 114

Regarding liquidity at our major supply points in the Rockies and western Canada, it is likely to continue to be very strong for the next couple of years. That is, Rockies and western Canadian gas that typically flowed to mid-Continent and east coast markets will continue to be displaced by the growth in gas supplies from eastern shale plays such as Marcellus . It is likely, though, that demand growth - some combination of power gen, industrial loads and regional LNG exports - will catch up with available supplies, spurring a strong price response. The magnitude of the price response will depend on the ability of gas producers to tap more supplies from western Canada (B.C. shales) and the Rockies.
5. Deviations from "Normal" Conditions. Temperatures, hydro levels and storage inventories are examples of factors that can have large short-term effects, but when looking a year or more into the future, are normalized to some extent in price forecasts. This means variations in any of these factors from normal or expected conditions will increase price volatility if not outright price levels. For example, the 2013-2014 winter was extremely cold (the term "Polar Vortex" became very popular) and storage inventories were drained down to levels not seen in over a decade. The "hangover" from that winter was through the following year because it affected both the cost to refill storage during summer 2014 as well as influence 2014-2015 winter prices. Then the 2014-2015 winter arrived and it was just as cold in the eastern half of the country, but the utilities were ready for it and the impact (price spikes, storage levels) much more contained.
In the west, very mild and dry winter weather is likely to lead to low hydroelectric generation this year. So while storage inventories were relatively untouched during the winter, the expectation is for higher gas prices through the hotter periods of the summer as gas generation makes up for the loss of hydro power.
Incidentally, one factor that previously fell into this category was hurricane activity. However, with the continuing migration of gas production from off-shore (Gulf of Mexico) to on-shore (shale play) sources, the destructive impact of hurricanes is fast approaching a point at which it is more likely to suppress as much demand as it does supply, leaving only the psychological impact to influence pricing.
4. Gas exports in the form of LNG are likely to be restricted to the Gulf of Mexico region for at least the next several years, and so have an indirect and generally limited impact on prices in the Pacific Northwest. The longer-term prospects for LNG exports from British Columbia are very real and we would expect a significant impact on local gas prices further out into the future, probably well before the end of this decade. A mitigating factor will be shale gas developments in British Columbia, specifically, how well (or poorly) the timing of that productions matches up with LNG export plans. Impetus for an LNG export terminal in Oregon, especially the Jordan Cove (Coos Bay)project, does not seem to be diminishing and is starting to gain some notice. For example, in our IRP process, scenarios are now included regarding the two Oregon projects and their associated pipeline connections to the larger regional grid.
Meanwhile, gas exports via pipeline to Mexico continue to gain ground. Exports to Mexico were 2.1 Bcfd in 2014. IHS predicts exports of 2.4 Bcfd in 2015, 3.6 Bcfd in 2016, and 4.1 Bcfd in 2016. Citicorp says those exports will hit 5 Bcfd by 2018. Mexico plans to add at least 28 gigawatts of power generating capacity over the next 12 years to accommodate more global manufacturers (especially auto manufacturers). Mexico is now a cheaper manufacturing hub then China, and energy costs for companies in Mexico fell by 37% over the past decade. While the gas that is exported comes primarily from Texas, it creates a void in California that is filled with gas from the Rockies, which in turn could impact price spreads between the Rockies and western Canadian gas.
Exhibit C - Supporting Materials NWN OPUC Advice No. 15-12/UG ____
Page 46 of 114

Northwest Natural Gas CompanyUM1286 PGA Portfolio Guidelines2015-2016 Oregon PGA
V.5
See this Exhibit C, IV.2.b.
If not included in the PGA filing please explain the major aspects of the LDC’s analysis and interpretation of the data and information described in (1) and (2) above, the most important conclusions resulting from that analysis and interpretation, and the application of these conclusions in the development of the current PGA portfolio.
Data Interpretation
Exhibit C - Supporting Materials NWN OPUC Advice No. 15-12/UG ____
Page 47 of 114
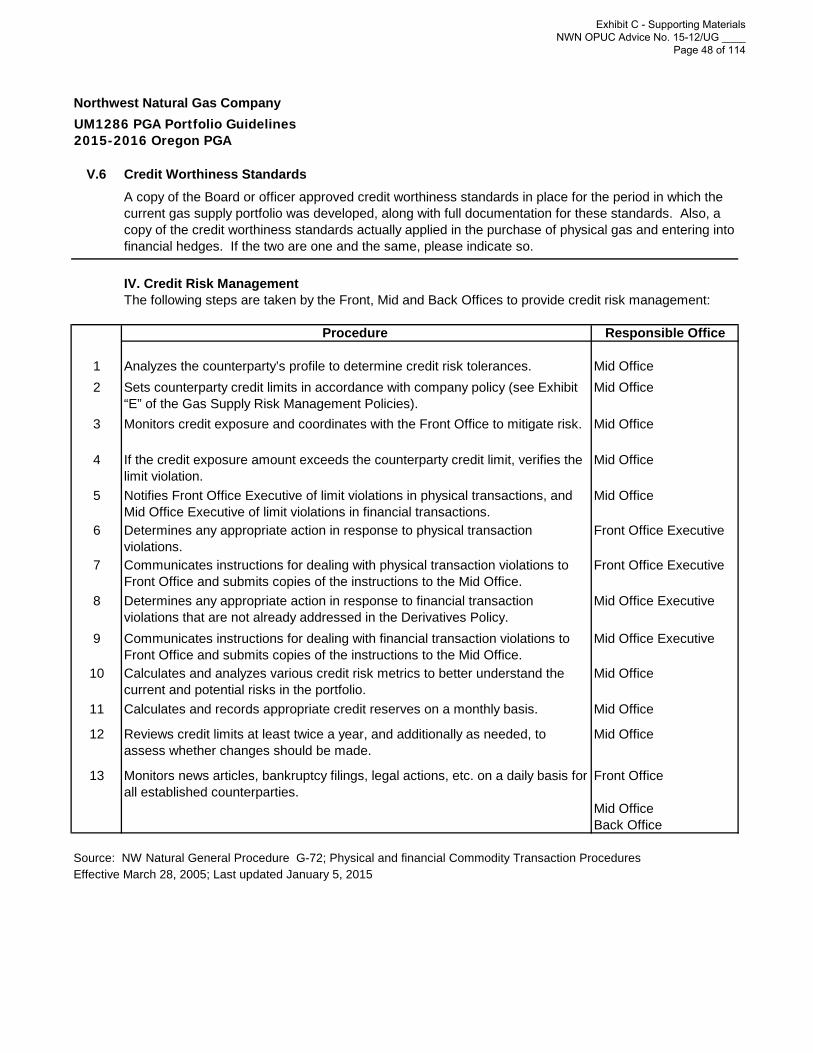
Northwest Natural Gas CompanyUM1286 PGA Portfolio Guidelines2015-2016 Oregon PGA
V.6 Credit Worthiness Standards
IV. Credit Risk ManagementThe following steps are taken by the Front, Mid and Back Offices to provide credit risk management:
Procedure Responsible Office
1 Analyzes the counterparty’s profile to determine credit risk tolerances. Mid Office2 Sets counterparty credit limits in accordance with company policy (see Exhibit
“E” of the Gas Supply Risk Management Policies).Mid Office
3 Monitors credit exposure and coordinates with the Front Office to mitigate risk. Mid Office
4 If the credit exposure amount exceeds the counterparty credit limit, verifies the limit violation.
Mid Office
5 Notifies Front Office Executive of limit violations in physical transactions, and Mid Office Executive of limit violations in financial transactions.
Mid Office
6 Determines any appropriate action in response to physical transaction violations.
Front Office Executive
7 Communicates instructions for dealing with physical transaction violations to Front Office and submits copies of the instructions to the Mid Office.
Front Office Executive
8 Determines any appropriate action in response to financial transaction violations that are not already addressed in the Derivatives Policy.
Mid Office Executive
9 Communicates instructions for dealing with financial transaction violations to Front Office and submits copies of the instructions to the Mid Office.
Mid Office Executive
10 Calculates and analyzes various credit risk metrics to better understand the current and potential risks in the portfolio.
Mid Office
11 Calculates and records appropriate credit reserves on a monthly basis. Mid Office
12 Reviews credit limits at least twice a year, and additionally as needed, to assess whether changes should be made.
Mid Office
13 Monitors news articles, bankruptcy filings, legal actions, etc. on a daily basis for all established counterparties.
Front Office
Mid OfficeBack Office
Source: NW Natural General Procedure G-72; Physical and financial Commodity Transaction ProceduresEffective March 28, 2005; Last updated January 5, 2015
A copy of the Board or officer approved credit worthiness standards in place for the period in which the current gas supply portfolio was developed, along with full documentation for these standards. Also, a copy of the credit worthiness standards actually applied in the purchase of physical gas and entering into financial hedges. If the two are one and the same, please indicate so.
Exhibit C - Supporting Materials NWN OPUC Advice No. 15-12/UG ____
Page 48 of 114

NW NATURAL
Gas Supply Risk Management Policies
Index No. 110
December 2014 Original Date of Approval: March 29, 2005
CONFIDENTIAL SUBJECT TO MODIFIED PROTECTIVE ORDER 10-337
CONFIDENTIAL SUBJECT TO MODIFIED PROTECTIVE ORDER 10-337
Exhibit C - Supporting Materials NWN OPUC Advice No. 15-12/UG ____
Page 49 of 114

2
I. Introduction
CONFIDENTIAL SUBJECT TO MODIFIED PROTECTIVE ORDER 10-337
CONFIDENTIAL SUBJECT TO MODIFIED PROTECTIVE ORDER 10-337
Exhibit C - Supporting Materials NWN OPUC Advice No. 15-12/UG ____
Page 50 of 114


Derivatives Policy (Last Updated: December 2014)
5
III. Derivatives Policy (Financial Products)
CONFIDENTIAL SUBJECT TO MODIFIED PROTECTIVE ORDER 10-337
CONFIDENTIAL SUBJECT TO MODIFIED PROTECTIVE ORDER 10-337
Exhibit C - Supporting Materials NWN OPUC Advice No. 15-12/UG ____
Page 53 of 114

Derivatives Policy (Last Updated: December 2014)
6
CONFIDENTIAL SUBJECT TO MODIFIED PROTECTIVE ORDER 10-337
CONFIDENTIAL SUBJECT TO MODIFIED PROTECTIVE ORDER 10-337
Exhibit C - Supporting Materials NWN OPUC Advice No. 15-12/UG ____
Page 54 of 114

Derivatives Policy (Last Updated: December 2014)
7
CONFIDENTIAL SUBJECT TO MODIFIED PROTECTIVE ORDER 10-337
CONFIDENTIAL SUBJECT TO MODIFIED PROTECTIVE ORDER 10-337
Exhibit C - Supporting Materials NWN OPUC Advice No. 15-12/UG ____
Page 55 of 114

Derivatives Policy (Last Updated: December 2014)
8
CONFIDENTIAL SUBJECT TO MODIFIED PROTECTIVE ORDER 10-337
CONFIDENTIAL SUBJECT TO MODIFIED PROTECTIVE ORDER 10-337
Exhibit C - Supporting Materials NWN OPUC Advice No. 15-12/UG ____
Page 56 of 114

Derivatives Policy (Last Updated: December 2014)
9
CONFIDENTIAL SUBJECT TO MODIFIED PROTECTIVE ORDER 10-337
CONFIDENTIAL SUBJECT TO MODIFIED PROTECTIVE ORDER 10-337
Exhibit C - Supporting Materials NWN OPUC Advice No. 15-12/UG ____
Page 57 of 114

Derivatives Policy (Last Updated: December 2014)
10
CONFIDENTIAL SUBJECT TO MODIFIED PROTECTIVE ORDER 10-337
CONFIDENTIAL SUBJECT TO MODIFIED PROTECTIVE ORDER 10-337
Exhibit C - Supporting Materials NWN OPUC Advice No. 15-12/UG ____
Page 58 of 114

Derivatives Policy (Last Updated: December 2014)
11
CONFIDENTIAL SUBJECT TO MODIFIED PROTECTIVE ORDER 10-337
CONFIDENTIAL SUBJECT TO MODIFIED PROTECTIVE ORDER 10-337
Exhibit C - Supporting Materials NWN OPUC Advice No. 15-12/UG ____
Page 59 of 114


Derivatives Policy (Last Updated: December 2014)
14
CONFIDENTIAL SUBJECT TO MODIFIED PROTECTIVE ORDER 10-337
CONFIDENTIAL SUBJECT TO MODIFIED PROTECTIVE ORDER 10-337
Exhibit C - Supporting Materials NWN OPUC Advice No. 15-12/UG ____
Page 62 of 114

Physical Transactions Policy (Last Updated: September 2014)
15
IV. Physical Gas Commodity Transactions Policy
CONFIDENTIAL SUBJECT TO MODIFIED PROTECTIVE ORDER 10-337
CONFIDENTIAL SUBJECT TO MODIFIED PROTECTIVE ORDER 10-337
Exhibit C - Supporting Materials NWN OPUC Advice No. 15-12/UG ____
Page 63 of 114

Physical Transactions Policy (Last Updated: September 2014)
16
CONFIDENTIAL SUBJECT TO MODIFIED PROTECTIVE ORDER 10-337
CONFIDENTIAL SUBJECT TO MODIFIED PROTECTIVE ORDER 10-337
Exhibit C - Supporting Materials NWN OPUC Advice No. 15-12/UG ____
Page 64 of 114

Physical Transactions Policy (Last Updated: September 2014)
17
CONFIDENTIAL SUBJECT TO MODIFIED PROTECTIVE ORDER 10-337
CONFIDENTIAL SUBJECT TO MODIFIED PROTECTIVE ORDER 10-337
Exhibit C - Supporting Materials NWN OPUC Advice No. 15-12/UG ____
Page 65 of 114


20
V. Exhibits
CONFIDENTIAL SUBJECT TO MODIFIED PROTECTIVE ORDER 10-337
CONFIDENTIAL SUBJECT TO MODIFIED PROTECTIVE ORDER 10-337
Exhibit C - Supporting Materials NWN OPUC Advice No. 15-12/UG ____
Page 68 of 114

21
Exhibit “A”
(Last updated: September 2014)
CONFIDENTIAL SUBJECT TO MODIFIED PROTECTIVE ORDER 10-337
CONFIDENTIAL SUBJECT TO MODIFIED PROTECTIVE ORDER 10-337
Exhibit C - Supporting Materials NWN OPUC Advice No. 15-12/UG ____
Page 69 of 114
22
Exhibit “B”
(Last updated: September 2014)
CONFIDENTIAL SUBJECT TO MODIFIED PROTECTIVE ORDER 10-337
CONFIDENTIAL SUBJECT TO MODIFIED PROTECTIVE ORDER 10-337
Exhibit C - Supporting Materials NWN OPUC Advice No. 15-12/UG ____
Page 70 of 114

23
Exhibit “C”
(Last updated: September 2014)
CONFIDENTIAL SUBJECT TO MODIFIED PROTECTIVE ORDER 10-337
CONFIDENTIAL SUBJECT TO MODIFIED PROTECTIVE ORDER 10-337
Exhibit C - Supporting Materials NWN OPUC Advice No. 15-12/UG ____
Page 71 of 114

24
Exhi
bit
“D”
CO
NFI
DE
NTI
AL
SU
BJE
CT
TO
MO
DIF
IED
PR
OTE
CTI
VE
OR
DE
R 1
0-33
7CONFIDENTIAL SUBJECT TO
MODIFIED PROTECTIVE ORDER 10-337Exhibit C - Supporting Materials
NWN OPUC Advice No. 15-12/UG ____ Page 72 of 114

25
CO
NFI
DE
NTI
AL
SU
BJE
CT
TO
MO
DIF
IED
PR
OTE
CTI
VE
OR
DE
R 1
0-33
7CONFIDENTIAL SUBJECT TO
MODIFIED PROTECTIVE ORDER 10-337Exhibit C - Supporting Materials
NWN OPUC Advice No. 15-12/UG ____ Page 73 of 114

26
P
P
CO
NFI
DE
NTI
AL
SU
BJE
CT
TO
MO
DIF
IED
PR
OTE
CTI
VE
OR
DE
R 1
0-33
7CONFIDENTIAL SUBJECT TO
MODIFIED PROTECTIVE ORDER 10-337Exhibit C - Supporting Materials
NWN OPUC Advice No. 15-12/UG ____ Page 74 of 114

Exhibit “E”
(Last updated: July 2015)
HIGHLY CONFIDENTIAL SUBJECT TO MODIFIED PROTECTIVE ORDER 10-337
Exhibit C - Supporting Materials NWN OPUC Advice No. 15-12/UG ____
Page 75 of 114

Exhibit “F”
HIGHLY CONFIDENTIAL SUBJECT TO MODIFIED PROTECTIVE ORDER 10-337
Exhibit C - Supporting Materials NWN OPUC Advice No. 15-12/UG ____
Page 76 of 114

29
Exhibit “G”
CONFIDENTIAL SUBJECT TO MODIFIED PROTECTIVE ORDER 10-337
Exhibit C - Supporting Materials NWN OPUC Advice No. 15-12/UG ____
Page 77 of 114

30
Exhibit “G” (Continued)
CONFIDENTIAL SUBJECT TO MODIFIED PROTECTIVE ORDER 10-337
Exhibit C - Supporting Materials NWN OPUC Advice No. 15-12/UG ____
Page 78 of 114

31
Exhibit “G” (Continued)
(Last updated: July 2015)
CONFIDENTIAL SUBJECT TO MODIFIED PROTECTIVE ORDER 10-337
Exhibit C - Supporting Materials NWN OPUC Advice No. 15-12/UG ____
Page 79 of 114

32
CONFIDENTIAL SUBJECT TO MODIFIED PROTECTIVE ORDER 10-337
Exhibit C - Supporting Materials NWN OPUC Advice No. 15-12/UG ____
Page 80 of 114


Northwest Natural Gas Company
V.7.d
V.7.e
BEGINNING BALANCE ISSUES (Withdrawals) LIQUEFIED INJECTIONS (Deliveries) ENDING BALANCE
MONTH THERMS AMOUNT RATE THERMS AMOUNT THERMS AMOUNT RATE THERMS AMOUNT RATE
Jan-10 123,357,378 72,645,617.50$ 0.58890 9,410,501 5,373,535.47$ 4,395,990 2,432,943.95$ 0.55345 118,342,867 69,705,025.98$ 0.58901
Feb 118,342,867 69,705,025.98$ 0.58901 4,879,344 2,627,742.75$ 2,365,397 1,217,833.57$ 0.51485 115,828,920 68,295,116.80$ 0.58962
Mar 115,828,920 68,295,116.80$ 0.58962 7,912,236 4,425,625.23$ 2,309,560 985,508.03$ 0.42671 110,226,244 64,854,999.60$ 0.58838
Apr 110,226,244 64,854,999.60$ 0.58838 15,503,891 8,614,804.86$ 1,670,862 646,032.16$ 0.38665 96,393,215 56,886,226.90$ 0.59015
May 96,393,215 56,886,226.90$ 0.59015 1,927,556 793,228.54$ 9,406,506 3,645,785.79$ 0.38758 103,872,165 59,738,784.15$ 0.57512
Jun 103,872,165 59,738,784.15$ 0.57512 652,061 363,386.29$ 5,713,773 2,465,796.73$ 0.43155 108,933,877 61,841,194.59$ 0.56769
Jul 108,933,877 61,841,194.59$ 0.56769 287,609 183,359.98$ 12,279,896 5,485,162.22$ 0.44668 120,926,164 67,142,996.83$ 0.55524
Aug 120,926,164 67,142,996.83$ 0.55524 405,287 249,157.52$ 5,090,346 2,304,088.84$ 0.45264 125,611,223 69,197,928.15$ 0.55089
Sep 125,611,223 69,197,928.15$ 0.55089 271,651 167,341.59$ 13,753,326 4,504,967.37$ 0.32755 139,092,898 73,535,553.93$ 0.52868
Oct 139,092,898 73,535,553.93$ 0.52868 2,687,797 1,156,185.84$ 14,129,691 4,843,395.19$ 0.34278 150,534,792 77,222,763.28$ 0.51299
Nov 150,534,792 77,222,763.28$ 0.51299 10,700,976 4,746,126.96$ 5,072,131 1,953,821.35$ 0.38521 144,905,947 74,430,457.67$ 0.51365
Dec 144 905 947 74 430 457.67$ 0.51365 7 060 485 3 161 021.50$ 1 684 010 679 171.39$ 0.40331 139 529 472 71 948 607.56$ 0.51565
TOTAL 2010 ACTIVITY 61,699,394 31,861,516.53$ 77,871,488 31,164,506.59$
Jan-11 139,529,472 71,948,607.56$ 0.51565 16,536,581 7,960,155.79$ 4,534,550 1,898,587.33$ 0.41869 127,527,441 65,887,039.10$ 0.51665
Feb 127,527,441 65,887,039.10$ 0.51665 12,055,968 6,039,266.36$ 3,407,810 1,383,289.09$ 0.40592 118,879,283 61,231,061.83$ 0.51507
Mar 118,879,283 61,231,061.83$ 0.51507 7,076,302 3,517,454.99$ 2,822,600 1,085,126.04$ 0.38444 114,625,581 58,798,732.88$ 0.51296
Apr 114,625,581 58,798,732.88$ 0.51296 5,732,315 2,519,434.50$ 2,628,886 1,088,941.38$ 0.41422 111,522,152 57,368,239.76$ 0.51441
May 111,522,152 57,368,239.76$ 0.51441 10,792,274 5,520,359.51$ 3,546,961 1,499,222.91$ 0.42268 104,276,839 53,347,103.16$ 0.51159
Jun 104,276,839 53,347,103.16$ 0.51159 278,481 153,669.85$ 4,613,636 2,022,089.98$ 0.43829 108,611,994 55,215,523.29$ 0.50837
Jul 108,611,994 55,215,523.29$ 0.50837 348,655 193,744.00$ 20,717,911 8,891,484.55$ 0.42917 128,981,250 63,913,263.84$ 0.49552
Aug 128,981,250 63,913,263.84$ 0.49552 288,531 159,121.73$ 7,526,103 3,115,834.52$ 0.41400 136,218,822 66,869,976.63$ 0.49090
Sep 136,218,822 66,869,976.63$ 0.49090 322,758 178,017.13$ 14,891,055 5,710,632.39$ 0.38349 150,787,119 72,402,591.89$ 0.48016
Oct 150,787,119 72,402,591.89$ 0.48016 3,380,719 1,404,966.55$ 27,967,660 9,873,518.03$ 0.35303 175,374,060 80,871,143.37$ 0.46114
Nov 175,374,060 80,871,143.37$ 0.46114 9,465,008 3,550,962.54$ 2,945,068 1,024,003.04$ 0.34770 168,854,120 78,344,183.87$ 0.46398
Dec 168 854 120 78 344 183.87$ 0.46398 11 517 779 4 952 519.39$ 2 644 302 893 127.66$ 0.33776 159 980 643 74 284 792.14$ 0.46434
TOTAL 2011 ACTIVITY 77,795,371 36,149,672.34$ 98,246,542 38,485,856.92$
Jan-12 159,980,643 74,284,792.14$ 0.46434 11,911,891 4,669,327.57$ 2,279,590 649,110.97$ 0.28475 150,348,342 70,264,575.54$ 0.46735
Feb 150,348,342 70,264,575.54$ 0.46735 8,672,041 3,187,445.76$ 348,590 88,897.46$ 0.25502 142,024,891 67,166,027.24$ 0.47292
Mar 142,024,891 67,166,027.24$ 0.47292 12,658,159 5,455,394.54$ 3,460,810 739,939.28$ 0.21381 132,827,542 62,450,571.98$ 0.47016
Apr 132,827,542 62,450,571.98$ 0.47016 23,051,846 10,194,050.58$ 4,500,360 869,525.78$ 0.19321 114,276,056 53,126,047.18$ 0.46489
May 114,276,056 53,126,047.18$ 0.46489 2,790,265 1,071,649.57$ 3,842,187 895,679.98$ 0.23312 115,327,978 52,950,077.59$ 0.45913
Jun 115,327,978 52,950,077.59$ 0.45913 2,209,903 643,407.48$ 6,310,010 1,367,411.71$ 0.21671 119,428,085 53,674,081.82$ 0.44943
Jul 119,428,085 53,674,081.82$ 0.44943 922,095 285,082.42$ 7,056,836 1,790,152.04$ 0.25368 125,562,826 55,179,151.44$ 0.43945
Aug 125,562,826 55,179,151.44$ 0.43945 289,508 151,844.55$ 3,112,036 792,432.45$ 0.25463 128,385,354 55,819,739.34$ 0.43478
Sep 128,385,354 55,819,739.34$ 0.43478 207,941 113,206.61$ 10,098,405 2,607,874.72$ 0.25825 138,275,818 58,314,407.45$ 0.42173
Oct 138,275,818 58,314,407.45$ 0.42173 5,444,783 1,384,452.69$ 25,766,796 8,855,633.86$ 0.34368 158,597,831 65,785,588.62$ 0.41480
Nov 158,597,831 65,785,588.62$ 0.41480 4,580,684 1,750,833.09$ 2,489,966 929,470.94$ 0.37329 156,507,113 64,964,226.47$ 0.41509
Dec 156 507 113 64 964 226.47$ 0.41509 8 384 530 2 953 010.06$ 2 106 485 850 861.58$ 0.40392 150 229 068 62 862 077.99$ 0.41844
TOTAL 2012 ACTIVITY 81 123 646 31 859 704.92$ 71 372 071 20 436 990.77$
Jan-13 150,229,068 62,862,077.99$ 0.41844 14,677,497 5,405,016.60$ 5,093,510 1,831,966.73$ 0.35967 140,645,081 59,289,028.12$ 0.42155
Feb 140,645,081 59,289,028.12$ 0.42155 13,800,354 5,335,663.36$ 1,262,630 409,713.41$ 0.32449 128,107,357 54,363,078.17$ 0.42436
Mar 128,107,357 54,363,078.17$ 0.42436 3,567,521 1,115,677.83$ 5,501,939 1,964,738.34$ 0.35710 130,041,775 55,212,138.68$ 0.42457
Apr 130,041,775 55,212,138.68$ 0.42457 21,459,008 8,365,699.38$ 4,538,540 1,807,682.82$ 0.39830 113,121,307 48,654,122.12$ 0.43011
May 113,121,307 48,654,122.12$ 0.43011 4,818,397 1,845,435.83$ 8,574,316 2,707,134.37$ 0.31573 116,877,226 49,515,820.66$ 0.42366
Jun 116,877,226 49,515,820.66$ 0.42366 175,511 91,369.64$ 8,915,841 3,055,934.87$ 0.34275 125,524,403 52,469,340.89$ 0.41800
Jul 125,524,403 52,469,340.89$ 0.41800 565,039 240,884.14$ 15,007,288 4,532,440.74$ 0.30202 139,966,652 56,760,897.49$ 0.40553
Aug 139,966,651 56,760,897.49$ 0.40553 274,464 135,425.37$ 17,596,859 4,711,223.75$ 0.26773 157,289,046 61,336,695.87$ 0.38996
Sep 157,289,046 61,336,695.87$ 0.38996 285,901 140,062.88$ 10,388,350 2,723,301.45$ 0.26215 167,391,495 63,919,934.44$ 0.38186
Oct 167,391,495 63,919,934.44$ 0.38186 4,070,753 1,272,892.19$ 10,841,958 4,013,141.26$ 0.37015 174,162,700 66,660,183.51$ 0.38275
Nov 174,162,700 66,660,183.51$ 0.38275 7,315,178 2,342,207.60$ 12,577,745 4,710,632.15$ 0.37452 179,425,267 69,028,608.06$ 0.38472
Dec 179 425 267 69 028 608.06$ 0.38472 46 561 323 17 032 482.39$ 6 732 330 3 374 222.26$ 0.50120 139 596 274 55 370 347.93$ 0.39665
TOTAL 2013 ACTIVITY 117,570,946 43,322,817.21$ 107,031,306 35,842,132.15$
Jan-14 139,596,274 55,370,347.93$ 0.39665 30,835,168 11,843,590.19$ 1,760,410 767,548.02$ 0.43601 110,521,516 44,294,305.76$ 0.40078
Feb 110,521,516 44,294,305.76$ 0.40078 29,228,201 12,337,686.61$ 2,109,060 1,410,671.47$ 0.66886 83,402,375 33,367,290.62$ 0.40008
Mar 83,402,375 33,367,290.62$ 0.40008 4,103,948 1,427,892.69$ 5,235,359 2,778,669.67$ 0.53075 84,533,786 34,718,067.60$ 0.41070
Apr 84,533,786 34,718,067.60$ 0.41070 2,620,950 1,039,548.32$ 7,343,259 3,410,003.35$ 0.46437 89,256,095 37,088,522.63$ 0.41553
May 89,256,095 37,088,522.63$ 0.41553 179,202 87,337.55$ 15,343,377 6,883,358.12$ 0.44862 104,420,270 43,884,543.20$ 0.42027
Jun 104,420,270 43,884,543.20$ 0.42027 409,025 200,391.58$ 15,898,061 7,384,324.83$ 0.46448 119,909,306 51,068,476.45$ 0.42589
Jul 119,909,306 $51,068,476.45 0.42589 150,183 70,223.64$ 25,904,013 10,835,078.53$ 0.41828 145,663,136 $61,833,331.34 0.42450
Aug 145,663,136 $61,833,331.34 0.42450 12,428 5,479.26$ 25,531,734 10,129,576.35$ 0.39674 171,182,442 $71,957,428.43 0.42036
Sep 171,182,442 $71,957,428.43 0.42036 62,586 30,087.78$ 17,516,192 7,008,362.97$ 0.40011 188,636,048 $78,935,703.62 0.41846
Oct 188,636,048 $78,935,703.62 0.41846 1,483,225 756,854.52$ 10,968,256 4,113,318.43$ 0.37502 198,121,080 $82,292,167.52 0.41536
Nov 198,121,080 $82,292,167.52 0.41536 13,322,697 5,892,179.83$ 4,433,490 1,873,768.24$ 0.42264 189,231,873 $78,273,755.94 0.41364
Dec 189 231 873 $78 273 755.94 0.41364 13 750 118 5 897 877.99$ 2 358 363 663 443.82$ 0.28132 177 840 118 $73 039 321.77 0.41070
TOTAL 2014 ACTIVITY 96,157,731 39,589,149.96$ 134,401,574 57,258,123.80$
Jan-15 177,840,118 $73,039,321.77 0.41070 14,245,904 $6,012,586.29 888,310 $262,325.07 0.29531 164,482,524 $67,289,060.55 0.40910
Feb 164,482,524 $67,289,060.55 0.40910 7,292,629 $3,141,852.01 6,012,346 $1,426,726.22 0.23730 163,202,241 $65,573,934.75 0.40180
Mar 163,202,241 $65,573,934.75 0.40180 1,830,436 $805,376.16 4,745,680 $1,098,192.39 0.23141 166,117,485 $65,866,750.98 0.39651
Apr 166,117,485 $65,866,750.98 0.39651 4,171,954 $1,638,956.58 5,066,936 $1,154,126.03 0.22778 167,012,467 $65,381,920.43 0.39148
May 167,012,467 $65,381,920.43 0.39148 113,933 $49,743.72 7,893,979 $2,197,251.85 0.27835 174,792,513 $67,529,428.55 0.38634
Jun 174 792 513 $67 529 428.55 0.38634 294 416 $130 693.66 8 657 668 $2 011 544.95 0.23234 183 155 765 $69 410 279.85 0.37897
TOTAL 2015 ACTIVITY 27,949,272 11,779,208.42$ 33,264,919 8,150,166.51$
All Sites Therms Summary
PGA Portfolio Guidelines2015-2016 Oregon PGA
Historical (five years) gas supply delivered to storage, both annual total and by month.
Historical (five years) gas supply withdrawn from storage, both annual total and by month.
NORTHWEST NATURAL GAS COMPANY
Exhibit C - Supporting Materials NWN OPUC Advice No. 15-12/UG ____
Page 82 of 114

Northwest Natural Gas Company
V.7.f
PGA Portfolio Guidelines2015-2016 Oregon PGA
Withdrawals at each facility (Mist, Gasco, etc.) are priced at the average inventory price as established at the beginning of each month. The beginning of the month cost at each facility is adjusted for any withdrawals and any injections to create the end of the month cost, which then becomes the beginning of the month cost for the next month.
* Direct associated costs, such as liquefaction fees (LS-1), FIK (SGS) and actual material costs incurred (Newport) can be added to the base cost when determined significant.
An explanation of the methdology utilized by the LDC to price storage injections and withdrawals, as well as the total and average (per unit) cost of storage gas.
The price of gas placed into storage, classed as working inventory, will be the average cost of gas defined as the average commodity cost of gas delivered to the city gate (utilizing unhedged discretionary sources first: i.e., spot gas first, then swing, and base load term supplies last. If storage injections exceed unhedged gas purchases, then average cost of hedged gas would be used to value the remainder of the storage injections.) This price would represent commodity cost, transportation cost, and fuel-in-kind (FIK) at either the NNG city gas (internal storage) or at the external storage site. In addition, this price will include all storage reservation charges.
This pricing policy will apply to all storage locations owned or under contract to the NNG, with exceptions as noted.
* When the contract for a storage site includes a provision for the price of the gas placed into storage, the price shall be the price as defined by the agreement.
*Injections into Canadian storage sites are valued using specific commodity deals plus added costs to maintain specific contract terms for each site.
Exhibit C - Supporting Materials NWN OPUC Advice No. 15-12/UG ____
Page 83 of 114

NW Natural
V.7.g Copies of all contracts or other agreements and tariffs that control the LDC's use of the storage facilities included in the current portfolio.
See Attachment 1 to this Exhibit C titled: "Attachment 1 Exhibit C V.7.g. Svc Agreement NW Pipeline Rate Sch SGS-2F.pdf.
PGA Portfolio Guidelines2015-2016 Oregon PGA
Exhibit C - Supporting Materials NWN OPUC Advice No. 15-12/UG ____
Page 84 of 114
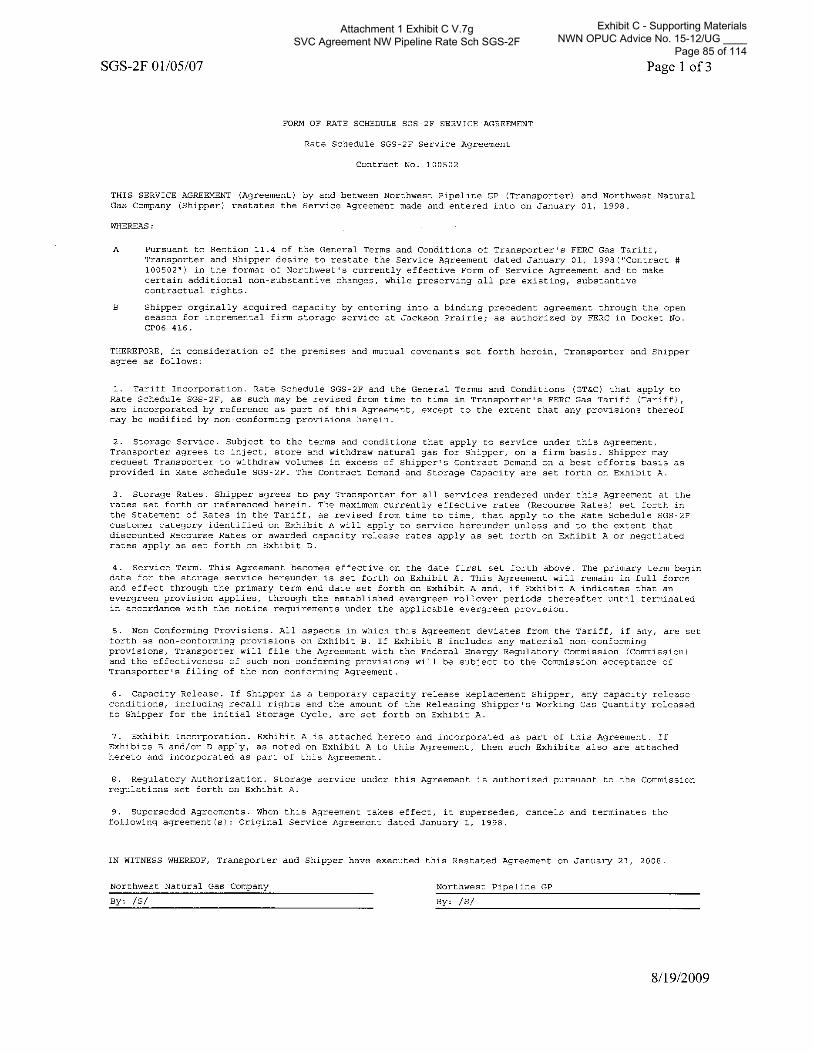
Attachment 1 Exhibit C V.7g SVC Agreement NW Pipeline Rate Sch SGS-2F
Exhibit C - Supporting Materials NWN OPUC Advice No. 15-12/UG ____
Page 85 of 114

Attachment 1 Exhibit C V.7g SVC Agreement NW Pipeline Rate Sch SGS-2F
Exhibit C - Supporting Materials NWN OPUC Advice No. 15-12/UG ____
Page 86 of 114

Attachment 1 Exhibit C V.7g SVC Agreement NW Pipeline Rate Sch SGS-2F
Exhibit C - Supporting Materials NWN OPUC Advice No. 15-12/UG ____
Page 87 of 114

Attachment 1 Exhibit C V.7g SVC Agreement NW Pipeline Rate Sch SGS-2F
Exhibit C - Supporting Materials NWN OPUC Advice No. 15-12/UG ____
Page 88 of 114

Attachment 1 Exhibit C V.7g SVC Agreement NW Pipeline Rate Sch SGS-2F
Exhibit C - Supporting Materials NWN OPUC Advice No. 15-12/UG ____
Page 89 of 114

Attachment 1 Exhibit C V.7g SVC Agreement NW Pipeline Rate Sch SGS-2F
Exhibit C - Supporting Materials NWN OPUC Advice No. 15-12/UG ____
Page 90 of 114

Attachment 1 Exhibit C V.7g SVC Agreement NW Pipeline Rate Sch SGS-2F
Exhibit C - Supporting Materials NWN OPUC Advice No. 15-12/UG ____
Page 91 of 114

Attachment 1 Exhibit C V.7g SVC Agreement NW Pipeline Rate Sch SGS-2F
Exhibit C - Supporting Materials NWN OPUC Advice No. 15-12/UG ____
Page 92 of 114

Attachment 1 Exhibit C V.7g SVC Agreement NW Pipeline Rate Sch SGS-2F
Exhibit C - Supporting Materials NWN OPUC Advice No. 15-12/UG ____
Page 93 of 114

Attachment 1 Exhibit C V.7g SVC Agreement NW Pipeline Rate Sch SGS-2F
Exhibit C - Supporting Materials NWN OPUC Advice No. 15-12/UG ____
Page 94 of 114

Attachment 1 Exhibit C V.7g SVC Agreement NW Pipeline Rate Sch SGS-2F
Exhibit C - Supporting Materials NWN OPUC Advice No. 15-12/UG ____
Page 95 of 114

Attachment 1 Exhibit C V.7g SVC Agreement NW Pipeline Rate Sch SGS-2F
Exhibit C - Supporting Materials NWN OPUC Advice No. 15-12/UG ____
Page 96 of 114

Attachment 1 Exhibit C V.7g SVC Agreement NW Pipeline Rate Sch SGS-2F
Exhibit C - Supporting Materials NWN OPUC Advice No. 15-12/UG ____
Page 97 of 114

Attachment 1 Exhibit C V.7g SVC Agreement NW Pipeline Rate Sch SGS-2F
Exhibit C - Supporting Materials NWN OPUC Advice No. 15-12/UG ____
Page 98 of 114
Northwest Natural Gas Company
2015-2016 Oregon PGA
V.7.h
a.
b.
a.
b,
PGA Portfolio Guidelines
For LDCs that own and operate storage:
The date and results of the last engineering study for that storage.
A description of any significant changes in physical or operational parameters of the storage facility (including LNG) since the current engineering study was completed.
See Attachment 1 to V.7.h to this Exhibit C dated July 2014, identified as Confidential and subject to Modified Protective Order No. 10-337.
There have been no significant changes in physical or operational parameters of the storage facility since completion of the July 2014 study.
Exhibit C - Supporting Materials NWN OPUC Advice No. 15-12/UG ____
Page 99 of 114

Confidential
Capacity Performance Study
Of the Mist Underground Natural Gas Storage Field
Mist Field,
Columbia County,Oregon
Clayton L. Roth P.E, P.G.
July 2015
CONFIDENTIAL SUBJECT TO MODIFIED PROTECTIVE ORDER 10-337
Exhibit C - Supporting Materials NWN OPUC Advice No. 15-12/UG ____
Page 100 of 114Attachment 1 V.7.h

2
CONFIDENTIAL SUBJECT TO MODIFIED PROTECTIVE ORDER 10-337
Exhibit C - Supporting Materials NWN OPUC Advice No. 15-12/UG ____
Page 101 of 114Attachment 1 V.7.h

3
CONFIDENTIAL SUBJECT TO MODIFIED PROTECTIVE ORDER 10-337
Exhibit C - Supporting Materials NWN OPUC Advice No. 15-12/UG ____
Page 102 of 114Attachment 1 V.7.h

4
CONFIDENTIAL SUBJECT TO MODIFIED PROTECTIVE ORDER 10-337
Exhibit C - Supporting Materials NWN OPUC Advice No. 15-12/UG ____
Page 103 of 114Attachment 1 V.7.h

Attachment 1 V.7.h

6
5
Figure 2
CONFIDENTIAL SUBJECT TO MODIFIED PROTECTIVE ORDER 10-337
Exhibit C - Supporting Materials NWN OPUC Advice No. 15-12/UG ____
Page 105 of 114Attachment 1 V.7.h

Attachment 1 V.7.h

8
Figure 4
CONFIDENTIAL SUBJECT TO MODIFIED PROTECTIVE ORDER 10-337
Exhibit C - Supporting Materials NWN OPUC Advice No. 15-12/UG ____
Page 107 of 114Attachment 1 V.7.h

9
Figure 5
CONFIDENTIAL SUBJECT TO MODIFIED PROTECTIVE ORDER 10-337
Exhibit C - Supporting Materials NWN OPUC Advice No. 15-12/UG ____
Page 108 of 114Attachment 1 V.7.h
10
Figure 6
CONFIDENTIAL SUBJECT TO MODIFIED PROTECTIVE ORDER 10-337
Exhibit C - Supporting Materials NWN OPUC Advice No. 15-12/UG ____
Page 109 of 114Attachment 1 V.7.h

11
Figure 7
CONFIDENTIAL SUBJECT TO MODIFIED PROTECTIVE ORDER 10-337
Exhibit C - Supporting Materials NWN OPUC Advice No. 15-12/UG ____
Page 110 of 114Attachment 1 V.7.h

Attachment 1 V.7.h

13
CONFIDENTIAL SUBJECT TO MODIFIED PROTECTIVE ORDER 10-337
Exhibit C - Supporting Materials NWN OPUC Advice No. 15-12/UG ____
Page 112 of 114Attachment 1 V.7.h

14
5.
CONFIDENTIAL SUBJECT TO MODIFIED PROTECTIVE ORDER 10-337
Exhibit C - Supporting Materials NWN OPUC Advice No. 15-12/UG ____
Page 113 of 114Attachment 1 V.7.h

V.8 Attestation as to Consistency
See IV.1.c
NW NaturalPGA Portfolio Guidelines
OPUC Order No. 11-196, Docket UM 1286
Exhibit C - Supporting Materials NWN OPUC Advice No. 15-12/UG ____
Page 114 of 114