
Vessel size measurements in angiograms: A comparison of ...enrigri/Public/Biblio/Hoffmann 02.pdf ·...
12
Vessel size measurements in angiograms: A comparison of techniques Kenneth R. Hoffmann, a) Daryl P. Nazareth, La ´ szlo ´ Miskolczi, Anant Gopal, Zhou Wang, Stephen Rudin, and Daniel R. Bednarek Toshiba Stroke Research Center, 445 Biomedical Research Building, Department of Neurosurgery, University at Buffalo, Buffalo, New York 14214-3025 ~Received 26 October 2001; accepted for publication 3 May 2002; published 24 June 2002! As interventional procedures become more complicated, the need for accurate quantitative vascular information increases. In response to this need, many commercial vendors provide techniques for measurement of vessel sizes, usually based on derivative techniques. In this study, we investigate the accuracy of several techniques used in the measurement of vessel size. Simulated images of vessels having circular cross sections were generated and convolved with various focal spot distri- butions taking into account the magnification. These vessel images were then convolved with Gaussian image detector line spread functions ~LSFs!. Additionally, images of a phantom contain- ing vessels with a range of diameters were acquired for the 4.59,69,99, and 129 modes of an image intensifier–TV ~II–TV! system. Vessel sizes in the images were determined using a first-derivative technique, a second-derivative technique, a linear combination of these two measured sizes, a thresholding technique, a densitometric technique, and a model-based technique. For the same focal spot size, the shape of the focal spot distribution does not affect measured vessel sizes except at large magnifications. For vessels with diameters larger than the full-width-at-half-maximum ~FWHM! of the LSF, accurate vessel sizes ~errors ;0.1 mm! could be obtained by using an average of sizes determined by the first and second derivatives. For vessels with diameters smaller than the FWHM of the LSF, the densitometric and model-based techniques can provide accurate vessel sizes when these techniques are properly calibrated. © 2002 American Association of Physicists in Medicine. @DOI: 10.1118/1.1488603# I. INTRODUCTION Much of the effort in digital vascular analysis has focused on characterization of the arterial lumen, primarily because lu- men size remains the standard upon which interventional de- cisions are based when treating patients with atherosclerotic occlusive disease. Because of its greater spatial resolution, availability during interventional procedures, and its rapid imaging of the entire volume of interest ~up to 60 frames per second!, projection angiography is preferred for these mea- surements despite the development of newer tomographic techniques such as echocardiography, computed tomography ~CT!, electronic beam computed tomography ~EBCT!, and magnetic resonance angiography ~MRA!. Although measure- ments of stenosis based on visual estimates or caliper deter- minations from x-ray angiograms are useful, they are not precise. 1 To improve the accuracy and precision of measured vessel sizes, numerous investigators have developed various meth- ods for measurement of vessel sizes in angiograms. 2–10 There are basically four types of measurement techniques: derivative-based techniques, 2–5 densitometric techniques, 6,7 threshold-based techniques, and model-based techniques. 8–10 Prior to the actual measurement of the vessel sizes, the fol- lowing steps are usually performed. The vessel of interest is identified, often by manual indication. The center line is de- termined using vessel tracking 11–13 or region growing. Vessel profiles are extracted along lines lying perpendicular to the vessel center line from the image data. The vessel diameter or cross-sectional area is then determined from these profiles. The techniques used to measure the vessel size differ prima- rily in their analysis of these profiles. In derivative-based techniques, the first and second de- rivatives of the vessel profile are obtained. The distance be- tween the extrema of these derivatives is used to estimate vessel size. Because the first derivative tends to underesti- mate the vessel size and the second derivative tends to over- estimate vessel size, 2,5 a combination of the sizes measured with these two approaches is usually employed, the weight- ing of each being determined by calibration. 2,5 These tech- niques have the advantages that they are relatively fast and are not very sensitive to the low-spatial-frequency back- ground in the image. In densitometry-based techniques, 6,7 the area under the vessel profile of interest is compared with the area under the profile of a vessel of known cross-sectional area or diameter, from which the cross-sectional area of the vessel is calcu- lated. Prior to the measurements, the pixel values must be converted to relative exposure values ~e.g., using the charac- teristic curve of the imaging system 14–16 !. The characteristic curve expresses the relationship between the exposure ~usu- ally log relative exposure is used! and the optical density of the film 14 or the pixel value in the digital image. 15,16 In ad- dition, the technique requires accurate estimation and sub- traction of the local background, knowledge of the relative concentrations of contrast material in both the calibration vessel and the vessel of interest, and knowledge of the ori- entation of these two vessels relative to the imaging plane. For calculation of a vessel size from the estimated area, a shape must be assumed for the vessel lumen, e.g., circular. 1622 1622 Med. Phys. 29 „7…, July 2002 0094-2405Õ2002Õ29„7…Õ1622Õ12Õ$19.00 © 2002 Am. Assoc. Phys. Med.
Transcript of Vessel size measurements in angiograms: A comparison of ...enrigri/Public/Biblio/Hoffmann 02.pdf ·...

Vessel size measurements in angiograms: A comparison of techniquesKenneth R. Hoffmann,a) Daryl P. Nazareth, Laszlo Miskolczi, Anant Gopal, Zhou Wang,Stephen Rudin, and Daniel R. BednarekToshiba Stroke Research Center, 445 Biomedical Research Building, Department of Neurosurgery,University at Buffalo, Buffalo, New York 14214-3025
~Received 26 October 2001; accepted for publication 3 May 2002; published 24 June 2002!
As interventional procedures become more complicated, the need for accurate quantitative vascularinformation increases. In response to this need, many commercial vendors provide techniques formeasurement of vessel sizes, usually based on derivative techniques. In this study, we investigatethe accuracy of several techniques used in the measurement of vessel size. Simulated images ofvessels having circular cross sections were generated and convolved with various focal spot distri-butions taking into account the magnification. These vessel images were then convolved withGaussian image detector line spread functions~LSFs!. Additionally, images of a phantom contain-ing vessels with a range of diameters were acquired for the 4.59, 69, 99, and 129 modes of an imageintensifier–TV~II–TV ! system. Vessel sizes in the images were determined using a first-derivativetechnique, a second-derivative technique, a linear combination of these two measured sizes, athresholding technique, a densitometric technique, and a model-based technique. For the same focalspot size, the shape of the focal spot distribution does not affect measured vessel sizes except atlarge magnifications. For vessels with diameters larger than the full-width-at-half-maximum~FWHM! of the LSF, accurate vessel sizes~errors;0.1 mm! could be obtained by using an averageof sizes determined by the first and second derivatives. For vessels with diameters smaller than theFWHM of the LSF, the densitometric and model-based techniques can provide accurate vessel sizeswhen these techniques are properly calibrated. ©2002 American Association of Physicists inMedicine. @DOI: 10.1118/1.1488603#
olud
rotioid
aphap
etno
sse
.ue
s.fte
lthefile
ima-
de-be-ate
esti-ver-dht-
andck-
theter,
lcu-t be-
f
ub-veionori-ne.
a, aular.
I. INTRODUCTION
Much of the effort in digital vascular analysis has focusedcharacterization of the arterial lumen, primarily becausemen size remains the standard upon which interventionalcisions are based when treating patients with atheroscleocclusive disease. Because of its greater spatial resoluavailability during interventional procedures, and its rapimaging of the entire volume of interest~up to 60 frames persecond!, projection angiography is preferred for these mesurements despite the development of newer tomogratechniques such as echocardiography, computed tomogr~CT!, electronic beam computed tomography~EBCT!, andmagnetic resonance angiography~MRA!. Although measure-ments of stenosis based on visual estimates or caliper dminations from x-ray angiograms are useful, they areprecise.1
To improve the accuracy and precision of measured vesizes, numerous investigators have developed various mods for measurement of vessel sizes in angiograms2–10
There are basically four types of measurement techniqderivative-based techniques,2–5 densitometric techniques,6,7
threshold-based techniques, and model-based technique8–10
Prior to the actual measurement of the vessel sizes, thelowing steps are usually performed. The vessel of interesidentified, often by manual indication. The center line is dtermined using vessel tracking11–13or region growing. Vesseprofiles are extracted along lines lying perpendicular tovessel center line from the image data. The vessel diamor cross-sectional area is then determined from these pro
1622 Med. Phys. 29 „7…, July 2002 0094-2405 Õ2002Õ29„7…
n-e-ticn,
-ichy
er-t
elth-
s:
ol-is-
eters.
The techniques used to measure the vessel size differ prrily in their analysis of these profiles.
In derivative-based techniques, the first and secondrivatives of the vessel profile are obtained. The distancetween the extrema of these derivatives is used to estimvessel size. Because the first derivative tends to undermate the vessel size and the second derivative tends to oestimate vessel size,2,5 a combination of the sizes measurewith these two approaches is usually employed, the weiging of each being determined by calibration.2,5 These tech-niques have the advantages that they are relatively fastare not very sensitive to the low-spatial-frequency baground in the image.
In densitometry-based techniques,6,7 the area under thevessel profile of interest is compared with the area underprofile of a vessel of known cross-sectional area or diamefrom which the cross-sectional area of the vessel is calated. Prior to the measurements, the pixel values musconverted to relative exposure values~e.g., using the characteristic curve of the imaging system14–16!. The characteristiccurve expresses the relationship between the exposure~usu-ally log relative exposure is used! and the optical density othe film14 or the pixel value in the digital image.15,16 In ad-dition, the technique requires accurate estimation and straction of the local background, knowledge of the relaticoncentrations of contrast material in both the calibratvessel and the vessel of interest, and knowledge of theentation of these two vessels relative to the imaging plaFor calculation of a vessel size from the estimated areshape must be assumed for the vessel lumen, e.g., circ
1622Õ1622Õ12Õ$19.00 © 2002 Am. Assoc. Phys. Med.

str
so
emar
fo-
e
tina
see
ie
rm
uest-athri
teaiss.iththps
esooeraehcotivouhae
onu
onpra
wereis
ane,the
ese
ingg aersterfilesult-
H
d-
ked
d.torleder-
ot
age
nehe
mmm.
1623 Hoffmann et al. : Vessel size measurements 1623
Because the resolution or unsharpness of the imaging sysimply blurs the vessel profile but does not change the aunder the profile, accurate measurements of vessel areabe obtained using densitometric techniques when the abconditions are met. The resolution of the imaging syst~sometimes referred to as imaging system blur or unshness! is a combination~convolution! of the resolution due tothe detector and the geometric unsharpness due to thespot. In this study, the term ‘‘resolution function’’ corresponds to the line spread function~LSF! of the imaging sys-tem because we are dealing with line-like objects, i.e., vsels.
In model-based techniques, a shape is assumed forvessel lumen, usually circular, and the effects of the imagsystem resolution are either circumvented or taken intocount. With Fourier-based techniques,9 the Fourier transformof a profile of a vessel with a circular cross section croszero atv057.62/D. This zero crossing is independent of thresolution of the imaging system since its effect in Fourspace is a multiplication~a convolution in real space!. Theresolution of the imaging system is often expressed in teof the modulation transfer function~MTF!,17 which repre-sents the response of the system to input at various freqcies. Other model-based techniques take the imaging syresolution into account.8–10 In these approaches, the following steps are usually taken. A number of vessel profilescalculated based on a circular cross-section model forvessel and an estimated concentration of contrast mateThese profiles are then convolved with the imaging sysLSF, after which the exposure values of these profilesconverted to pixel values using the measured charactercurve of the imaging system to yield ‘‘ideal’’ vessel profileThese ‘‘ideal’’ vessel profiles are iteratively compared wthe background-subtracted image profiles. The size ofvessel whose calculated profile best matches the imagefile is taken as the size of the vessel in the image. The emated vessel sizes are accurate over a large range of vsizes;8 in particular for vessels with sizes comparable toeven smaller than the width of the LSF. The technique dnot appear to be sensitive to the concentration of contmaterial in the vessel and can actually be used to estimat8
Although each of these techniques and their resultsappeared in the literature, there has been no systematicparison of these techniques and discussion of their relamerits. In this study, we compare the accuracy of the varitechniques in measuring vessel sizes in simulation and ptom studies as well as comparing these results with thoshuman observers. Because results of Brownet al.18 have in-dicated that approximately 96% of the luminal cross sectiof stenosed coronary vessels are circular or elliptical, wevessels with circular cross sections in this study.
II. METHODS
Simulated vessel profiles were generated, and imagesvessel phantom were acquired using various image intefier ~II ! modes. Vessel sizes were determined from thesefiles using derivative-based, densitometric, model-based,
Medical Physics, Vol. 29, No. 7, July 2002
emeacanve
p-
cal
s-
hegc-
s
r
s
n-em
ree
al.mretic
ero-ti-sel
rsstit.asm-esn-of
sse
f asi-o-nd
thresholding techniques. The vessel size measurementsevaluated in terms of their accuracy. Here, vessel sizetaken to mean the diameter of the vessel in the image pland vessel diameter is taken to mean the diameter ofvessel in the object plane; for magnification equal to 1, thterms are used interchangeably.
A. Generation of the vessel profiles
1. Simulation of vessel profiles
To generate the simulated vessel profiles the followsteps were taken. Vessel profiles were generated usincircular-cross-section model for the vessels. Diametranged from 0.1 to 3 mm, in steps of 0.1 mm. The cenlines of the vessels were considered known. These prowere then convolved with the geometric unsharpness resing from the finite focal spot size.19,20 The focal spot wasmodeled using rectangular, Gaussian, triangular, andshapes, each with a full-width-at-half-maximum~FWHM! of0.5 mm. The ‘‘H’’ or bi-modal shape was generated by ading narrow Gaussians~0.1 mm FWHM! at the edges of arectangular shape, such that the resulting distribution loosimilar to an H with the bottom filled in.
Magnifications ranging from 1.0 to 2.0 were simulateThese blurred profiles were then convolved with the detecLSF. The LSF of the image detector system was modeusing Gaussians of specified FWHM. Profiles were genated using various pixel sizes~0.025–0.200 mm!. To mimicthe clinical situation in which the characteristic curve is nmeasured~and/or assumed to be linear!, the characteristiccurve was modeled as being linear. An example of an imgenerated using this approach is shown in Fig. 1.
2. Phantom images
A vessel phantom was constructed using polyethyletubes with inner diameters ranging from 0.28–6.37 mm. Tphantom was placed on the face of the II~magnification;1!.
FIG. 1. Simulated vessel images. The vessel sizes range from 0.1–3.0and the FWHM of the resolution function ranges from 0.0 mm to 0.3 mThe images are noiseless, and the order of the vessels is random.

eonowveftee
ags.taa
noti.
cedirewvc
b-ivr
e
infiete
asi.e.,
e ofured
tived de--
ech-the
rveand
cal-
the-reafile,
jita
en-re-vedtu-tud-ngselles,le.
aned,
a
1624 Hoffmann et al. : Vessel size measurements 1624
Images were acquired using 4.59 ~shown in Fig. 2!, 69, 99,and 129 II modes of the CAS-8000V II system~ToshibaCorp., Tochigi-Ken, Japan!. Pixel sizes in the object planwere determined from the images of a calibration object csisting of rectangular array of copper beads spaced at knintervals. Profiles were then extracted perpendicular to asel center line that was automatically determined amanual indication of two points near the vessel center linVessel sizes were measured for each profile and averalong the length of the vessel to obtain the measured sizethe phantom studies, to approximate the situation thacommon in most clinics, the LSF was not measured butproximated as a Gaussian, the FWHM of which was takena multiple of the pixel size, and the calibration curve wasmeasured but assumed to be linear. Pincushion correcwas not performed; pincushion errors were less than 1%
3. Background subtraction
Prior to measurement of the vessel diameter, the baground pixel value and the ‘‘vessel region’’ were estimatas follows.21 The average of the pixel values in the entprofile was obtained. All pixel values of the profile belothis first average were then used to calculate a second aage which was taken as the background value and subtrafrom the profile. The first derivative of the profile was otained, and the locations of the maxima in the first derivaton either side of the peak were identified as edges. Thegion in the background-subtracted profile containing the vsel information ~to be called the vessel region! was thenidentified as those pixels contiguous with the center, havpixel values greater than zero, and within the edges identiusing the first derivative. The vessel sizes were then demined by analysis of the vessel region.
FIG. 2. Image of the vessel phantom acquired using the 4.5 inch II mode~60kVp, 100 mA, 4 ms, 100% Renographin!. Vessel sizes range from 0.28 mmto 6.3 mm. Pixel size was 0.130 mm. FWHM of the resolution function wapproximately 0.2 mm.
Medical Physics, Vol. 29, No. 7, July 2002
-n
s-rs.edIn
isp-ston
k-
er-ted
ee-s-
gdr-
B. Vessel size measurements
1. Derivative-based techniques
The first derivative of the profile in the vessel region wobtained using a nearest-neighbor difference technique,
p8~x!5p~x1Dx!2p~x2Dx!
2Dx. ~1!
The distance between the maxima in the absolute valuthe first derivative was taken as the vessel size as measby the first derivative.
The second derivative of the profile was obtained as
p9~x!5p~x1Dx!22p~x!1p~x2Dx!
DxDx. ~2!
The distance between the maxima in the second derivawas taken as the vessel size as measured by the seconrivative. In addition, a weighted combination of the diameters measured using the first- and second-derivative tniques was used. An equal weighting was found to yieldmost accurate results in this study.
2. Densitometric technique
For the densitometric technique, the characteristic cuwas assumed to be linear with respect to log exposure,the area under the profile within the vessel region wasculated as
Aprofile5 (left edge
right edge
p~x!, ~3!
where the left and right edges correspond to the limits ofvessel region. The diameter,d, corresponding to the measured profile was calculated from this calculated profile aand the area calculated for the calibration vessel proAvcalc, ~with a diameter,dvcalc, of 3 mm in the simulations,and 2.67 mm in the phantom study! as
d5sqrt@Aprofile/Avcalc#* dvcalc. ~4!
3. Model-based technique
The model-based technique was based on that of Fuet al.,8 the iterative deconvolution technique~IDT!. Simu-lated vessel profiles, with circular cross-sections, were gerated with diameters ranging from 0.1 to 10 mm, in incments of 0.1 mm. These simulated profiles were convolwith the geometric unsharpness~resulting from the focal spoand magnification! as well as a Gaussian-shaped LSF simlating the unsharpness of the detector. In the phantom sies, the FWHM of the detector LSF used in the modeliwas varied. After normalizing the area to that of the vesregion of the extracted profile, these ideal vessel profiv i(x)diam, were compared with the extracted vessel profiThe diameter of the vessel and the center,xcenter, of the idealvessel profile were varied in an iterative manner untiloptimal match with the extracted vessel profile was obtainas determined by the residual,Rmb, given by summation of
s

de
deia
itsitisag
uthemt
tssa
eaa
lug
ar
teay
-t
ot
lde-
iplendedndpa-ters
ner-red/ciesea-tionntec-
g.as
ilesec-ionourselsian-
gecusbil-thexelwasion,ard
the
ech-izescu-
SFsing
1625 Hoffmann et al. : Vessel size measurements 1625
the absolute differences between the pixel values of the i(v i(x2xcenter)diam) and extracted vessel profiles (p(x)), i.e.,
Rmb~xcenter,diam!5 (Left edge
Right edge
abs@p~x!2v i~x2xcenter!diam#.
~5!
The vessel size and center of the ideal profile that yielminimum residual were taken as the measured vessel deter and center, respectively.
4. Threshold-based technique
For the threshold technique, the maximum pixel valuethe profile was determined. The threshold value was se50% of this maximum value. The pixels with pixel valueabove this threshold value and contiguous with the pixel wthe maximum pixel value were identified. The width of thcontiguous region was taken as the vessel size in the im
C. Evaluations
The measured vessel sizes depend on the techniquefor the measurement, the effective resolution function ofimaging system, and the pixel size of the detector systWe evaluated the effect of these various components onvessel diameters measured by the various techniques.
In all the evaluations, the magnification was consideredbe known exactly. In general, all techniques measure vesizes in the images and correct the measured sizes for mnification to obtain the diameter. The errors in the size msurement,Esize, and the errors in the calculated magnifiction, Emag, can be considered separately as a~good! firstapproximation, i.e.,
Ediam5E~size/mag!
5size/mag* sqrt@~Emag/mag!21~Esize/size!2#
1O@~Emag* Esize!/~mag* size!#, ~6!
where O@x# stands for ‘‘of the order ofx.’’ Errors in theestimated vessel diameters would therefore have to incthe results presented here forEsize as well as those resultinfrom errors in the estimated magnification.
1. Effect of the focal spot distribution
As will be seen in the results, the primary effect thneeds to be taken into account~either through calibration oby including it in the calculations! is that of the imagingsystem resolution. The final vessel profile,v f(x), can be un-derstood as resulting from the convolution of the projecvessel profile which would be obtained with a point x-rsource, v(x), with the geometric unsharpness,f (x/(mag21)), ~due to the finite size of the focal spot! as well as withthe detector LSF,L(x), i.e.,
v f~x!5~v~x!* f ~x/~mag21!!!* L~x!, ~7!
where* indicates convolution,f (x) is the focal spot resolution and f (x/(mag21)) is the effective projected focal spodistribution.22 We investigated the effect of the focal sp
Medical Physics, Vol. 29, No. 7, July 2002
al
dm-
nto
h
e.
sede.
he
oelg--
-
de
t
d
distribution shape on the shape ofv f(x) and on the vessesizes measured using the various techniques for varioustector LSFs.
2. Effect of imaging system resolution and pixelsize
Image-intensifier–TV~II–TV ! systems are commonlyused in angiography. These systems allow the use of multfields of view, each of which has different pixels sizes aresolution with the detector resolution strongly correlatwith the pixel size. For selected focal spot distributions amagnifications, we investigated the effect of the detectorrameters, resolution and pixel size, on the vessel diamemeasured using the various techniques.
3. Sensitivity of diameters measured with themodel-based technique to the assumedmagnification and imaging system resolution
Model-based techniques use ideal vessel profiles geated by convolving assumed vessel models with measuestimated imaging-system resolution functions. Inaccurain these models or resolution functions can affect the msured vessel diameters. Errors in the estimated magnificawill result in errors in the projected focal spot distributioused to simulate the geometric unsharpness. Although detor resolution functions can be measured fairly reliably,23,24
they may not be readily available in the clinical settinThus, the effect of errors in these resolution functions walso investigated by varying the FWHM of the LSFs. Whevaluations with a variety of shapes for the vessel crosstion would be of value, we believe that such an evaluatgoes beyond the scope of this study. We therefore limitedstudy to profile shapes for circular models for the vescross sections, selected magnification factors, and Gausshaped LSFs for the image detector.
4. Effect of the signal-to-noise ratio on measureddiameters
In addition to the effects of resolution, noise in the imacan obscure the vessel information. Although not the foof this study, we investigated the accuracy and reproduciity of the measured vessel diameters for various levels ofSNR for vessels of various diameters. The maximum pivalue in the noiseless vessel profile, i.e., its peak value,determined. Noise, sampled from a Gaussian distributwas added to the pixel values in the images; the standdeviation of the noise distribution was selected to yieldspecified signal-to-noise ratio at the peak of the profile.
III. RESULTS
Each of the techniques, except the threshold-based tnique, was found to provide accurate measured vessel sunder appropriate conditions. Vessel sizes could be acrately measured~errors;0.1 mm! for vessels with projectedsizes greater than the FWHM of the imaging system Lwith the proper combination of vessel sizes measured u

perntle
-t
fin
heth
e
gn
Mte
feth
th
e
re-ian
ure-s in
ssnhetri-waligicaulg
Themm;edthe
ng thet foriqueields.ased
d byyieldsuredel di-first
resh-
1626 Hoffmann et al. : Vessel size measurements 1626
the first and second derivatives. Model-based techniquesformed well when the system characteristics were proptaken into account. Densitometric techniques consisteoutperformed all other techniques for vessels with sizesthan 1 mm.
A. Effect of the focal spot distribution
In general, for a given FWHM of the focal spot distribution, the shape of the focal spot distribution was foundaffect neither the measured sizes nor the shape of thevessel profiles~see Fig. 3!, in agreement with Doiet al.25–27
This can be understood by considering the following. If tprojected vessel profiles, the focal spot distributions, anddetector LSF were Gaussian shaped~or approximatelyGaussian shaped!, the FWHM of the vessel profile whichincluded the blurring due to imaging system would be giv~approximately! by
FWHMvp5sqrt$~diam mag)21~FWHMProjFoc!2
1~FWHMDet!2%, ~8!
where diam is the diameter of the vessel, mag is its mafication, FWHMProjFoc is the full-width-half-maximum of theprojected focal spot distribution @FWHMProjFoc
5FWHMFoc~mag21)], and FWHMDet is the full-width-half-maximum of the image detector LSF. The FWHwhich is substantially larger than the others will domina~and determine to first order! the FWHMvp and the shape othe final profile. Consistent with this approximation, wfound that the size and shape of the focal spot did affectFWHM and shape of the final vessel profiles whenFWHM of the projected focal spot [email protected].,FWHMfocal~mag21)# was greater than the FWHM of th
FIG. 3. Simulated vessel profiles obtained for a 0.36 mm diameter veafter convolution with four different focal spot distributions, GaussiaH-shaped, Uniform, and Triangular, each with an FWHM of 0.5 mm. Tmagnification factor was 1.4. The effective FWHM of the focal spot disbution in the imaging plane was 0.2 mm. No image detector resolutionincluded here. The curves were peak normalized. Although there are sdifferences at the edges, the FWHM of the distributions are almost identi.e., 0.572, 0.560, 0.570, 0.570 for the Gaussian, H, uniform, and triangfocal spots, respectively. These differences would be undetectable usinevaluated techniques~see Results!.
Medical Physics, Vol. 29, No. 7, July 2002
er-lylyss
oal
e
n
i-
ee
vessel profile after convolution of the detector LSF. Thefore, only one type of focal spot distribution, i.e., a Gaussshape, was used in the subsequent analyses.
B. The effect of resolution and pixel size
In Fig. 4, we present results of the vessel size measments obtained using the six above-described technique
el,
shtl,
arthe
FIG. 4. Diameters of vessels measured using the various techniques.image system LSF was represented as a Gaussian with a FWHM of 0.5the magnification was 1.0.~a! Diameters of simulated vessels measurusing first derivatives, second derivatives, and 50–50 combination oftwo sizes measured using these techniques. Diameters measured usifirst derivative are consistently less than the true vessel diameter, excepvessels with diameters less than 0.5 mm. The second derivative technconsistently overestimates the vessel sizes. The 50–50 combination yaccurate results except for vessels with diameters less than 1.0 mm~b!Diameters of simulated vessels measured using densitometric, model-b~IDT!, and thresholding techniques. Densitometric results are overlayethe model-based results. Densitometric and model-based techniquesaccurate vessel diameters for all vessel diameters. The diameters meausing the threshold technique are consistently less than the true vessameter, except for vessels with diameters less than 0.6 mm. Unlike thederivative results, the deviation of the diameters measured using the tholding technique increases with vessel diameter.

.5ea
cizedeFp
ntd
ssiqule
dithresspe
ina-ig.
thesingwithIning
ar-thatsselthe
o-
the
asble
fusd
unitsef-d
vele I.
sels
erdes-tric
en
argerith
the
haniththetriccan
uret-m
thenth
veam
1627 Hoffmann et al. : Vessel size measurements 1627
simulated images in which the FWHM of the LSF was 0mm. In Fig. 4~a!, we see that the first-derivative techniquconsistently underestimates the vessel size except for smsized vessels whereas the second-derivative techniquesistently overestimates the vessel size. For vessels with sgreater than the FWHM of the LSF, accurate sizes are msured by using a 50–50 combination of the vessel sizestermined using the first and second derivative techniquFor vessels with sizes smaller than the FWHM of the LSthe sizes measured using the derivative-based techniquesteau, i.e., the measured sizes are approximately constathis range. In Fig. 4~b!, we see that the densitometric anmodel-based techniques yield the correct sizes for all vesizes, i.e., the requirements for the densitometric technwere met, and the imaging system was accurately modeThe results of diameter measurements using thresholtechniques exhibits behavior similar to that obtained withfirst derivative, except that the deviation of the measudiameter from the true diameter increases with actual vesize. These results are in good agreement with those aping in the literature.2–9
FIG. 5. Effect of resolution on diameters of simulated vessels measusing the derivative techniques.~a! Vessel sizes measured using the firsderivative technique, the FWHM of the LSF varied from 0.1 mm to 1.0 mPlateauing is seen in each curve~except the 0.1 mm curve! with the mea-sured curve crossing the line of unity at approximately the FWHM ofLSF. ~b! Errors in the vessel sizes measured using the 50–50 combinatiofirst and second derivative techniques. For vessels with diameters lessthe FWHM of the LSF, plateauing gives rise to increasing errors. Howefor the vessels with diameters larger than the FWHM of the LSF, the dieters are accurately determined.
Medical Physics, Vol. 29, No. 7, July 2002
ll-on-esa-e-s.,la-in
eled.
ngedelar-
Similar results were obtained in simulation studieswhich the FWHM for the LSF was varied. The sizes mesured using the first-derivative technique are shown in F5~a!. The first-derivative technique underestimated~overesti-mated! vessel sizes for vessels with sizes larger~smaller!than the FWHM of the LSF, with the errors increasing wiincreasing FWHM of the LSF. Although not shown, thtrends seen in Fig. 4 were repeated for sizes measured uthe second-derivative and threshold-based techniques,the errors increasing with increasing FWHM of the LSF.Fig. 5~b!, we present the errors in the sizes measured usthe 50–50 combination~of first and second derivative sizes!.We have modified the axes from that of Figs. 4 and 5~a!, toallow appreciation of the error for small vessel sizes, in pticular, as well as for the larger vessel sizes. We seeaccurate sizes are obtained for larger vessels with vesizes overestimated for the smaller vessels, again witherror increasing with the FWHM of the LSF. The densitimetric and model-based techniques~also not shown! pro-vided consistently accurate vessel sizes independent ofresolution function.
For the above simulation evaluations, the pixel size w25 microns, substantially smaller than that for any availaangiographic system. When the pixel size was increased@andthe FWHM of the LSF was increased accordingly~set equalto twice the pixel size!#, we observed behavior for each othe techniques similar to that obtained above for varioresolution functions. In addition, for the derivative- anthreshold-based techniques, the sizes were quantized inof pixels. Although this pixelation effect can be overcomwith curve fitting and/or interpolation or averaging, the efects of resolution will still limit the accuracy of measurevessel sizes for small-diameter vessels.
In the phantom studies, results similar to those abowere obtained, and these are presented in Fig. 6 and TabFor vessels with diameters greater than 1 mm@part ~C! ofTable I#, the 50–50 combination@Fig. 6~a!# yielded the mostaccurate and reliable sizes, errors of;0.1 mm and averagestandard deviations of 0.050 mm, respectively. For veswith diameters less than 1 mm@part ~B! of Table I#, thedensitometric technique@Fig. 6~b!# yielded the most accuratand reliable sizes, errors of;0.1 mm and average standadeviations of 0.050 mm, respectively. For large diameter vsels, the errors in the sizes calculated by the densitometechnique increase due to saturation@Fig. 6~b!#, i.e., the non-linearities in the characteristic curve which were not takinto account~see Discussion!. As can be seen in part~B! ofTable I and by comparing Figs. 6~b! and 6~c!, the errors inthe sizes measured by the model-based technique were lthan those of the densitometric technique for vessels wsizes less than 1 mm, probably due to the sensitivity ofmodel-based technique to the FWHM of the LSF@see Sec.III C ~below!#. Part ~C! of Table I and Figs. 6~a! and 6~c!indicate that the model-based errors were also larger tthose of the 50–50 combination technique for vessels wsizes larger than 1 mm, probably due to the saturation ofpixel value which reduced the accuracy of the densitometechnique as well. Although the model-based technique
d
.
ofanr,-

selsan-ld
ofique
ateingre
hegni-uentare
m-
mheed.r inn
larly
odonphsno
ther t
rrot
r t
cti
ious
ec-
terser
1628 Hoffmann et al. : Vessel size measurements 1628
FIG. 6. Vessel sizes determined in the phantom study for the three maccurate techniques, i.e., the 50–50 combination, the densitometric, anmodel-based techniques. The error bars represent one standard deviati~a!Vessel sizes measured using the 50–50 combination technique for thetom study in which the 4.59, 69, 99, and 129 II modes were used. The resultare similar to those seen in Fig. 5~b!. For vessels with diameters smaller tha1 mm, the errors are large, and there is a strong dependence on the II mFor larger vessels, errors are small and do not appear to depend onmode.~b! Vessel sizes measured using the densitometric technique fophantom study in which the 4.59, 69, 99, and 129 II modes were used. Errorsfor vessels with diameters less than 1 mm are less than 0.1 mm. Ebecome large for vessels much larger than 1 mm, due to saturation inimage.~c! Vessel sizes measured using the model-based technique fophantom study in which the 4.59, 69, 99, and 129 II modes were used. TheLSF was modeled using a Gaussian with a FWHM of 3 times the respepixel size.
Medical Physics, Vol. 29, No. 7, July 2002
provide accurate vessel sizes for the entire range of vessizes,8 we present results as would be obtained in the stdard clinical setting in which the characteristic curve wounot be measured prior to vessel size measurement.
C. Sensitivity of diameters measured with the model-based technique to the assumed magnificationand the imaging system resolution
In Fig. 7, we present the results of simulation studiesmeasurement of vessel sizes with the model-based technwith incorrect modeling of the imaging system. To generFig. 7~a!, the geometric unsharpness was modeled assuma magnification of 1.4, while the actual magnifications we1.3 and 1.5. Note that for this figure, in an effort to show teffect of incorrect geometric unsharpness, the correct mafication was used to calculate the vessel diameter subseqto vessel size determination in the image. Vessel sizesaccurate to within 50 microns except for vessels with diaeters less than 0.3 mm.
Figure 7~b! shows the deviation of measured sizes frothe true size in simulation studies in which the FWHM of tmodeled LSF was 0.5 mm but the actual FWHM was variThe error in the measured sizes increases with the errothe FWHM for the modeling Gaussian. Although not showhere, results obtained when using Gaussian and triangudistributed LSFs for the image system~while using only a
stthe.an-
de.II
he
rshehe
ve
TABLE I. Average errors in the vessel sizes measured using the vartechniques in the phantom study for images acquired using the 4.59, 69, 99,and 129 II modes~pixel sizes were 0.130, 0.172, 0.232, 0.321 mm, resptively!. ~A! Error was determined by averaging the error over all vessels.~B!Error was determined by averaging the error over vessels with diameless than 1 mm.~C! Error was determined by averaging the error ovvessels with diameters greater than 1 mm.
Vessel sizingmethod
II mode
4.5 6.0 9.0 12.0
~A!First derivative 0.17 0.17 0.19 0.23Seond derivative 0.19 0.22 0.34 0.5450–50 combination 0.10 0.11 0.15 0.25Thresholding 0.20 0.20 0.18 0.21Densitometric 0.44 0.46 0.43 0.38Model based 0.15 0.20 0.26 0.30
~B!First derivative 0.14 0.17 0.16 0.28Second derivative 0.26 0.30 0.45 0.7450–50 combination 0.12 0.16 0.25 0.46Thresholding 0.11 0.08 0.11 0.19Densitometric 0.06 0.08 0.10 0.10Model based 0.07 0.14 0.22 0.20
~C!First derivative 0.19 0.17 0.22 0.19Second derivative 0.13 0.15 0.25 0.3850–50 combination 0.07 0.06 0.06 0.08Thresholding 0.29 0.29 0.24 0.21Densitometric 0.75 0.77 0.70 0.61Model based 0.22 0.25 0.29 0.39

,
t
red
ab
a
c
e-ythcun-
seeSh
eni
se
he.
he
edwith
o the
d.
phan-as, i.e.,the4.5e todard
1629 Hoffmann et al. : Vessel size measurements 1629
Gaussian LSF for the modeling! yield comparable resultsi.e., little dependence on the shape of the LSF~similar to thatobserved for the focal spot distribution!.
In the phantom studies of the model-based [email protected]~c! and Table I#, the FWHM of the LSF was not known, buthe residuals@Eq. ~5!# indicate a quality of fit. When theFWHM of the LSF is chosen based on the minimum diffeence~Table II and Fig. 8!, the average errors in the measursizes are seen to improve for the 4.59, 69, and 99 II-modeimages for vessels smaller than 1 mm, becoming comparto those of the densitometric technique@~B! of Table I vs~B!of Table II#. The errors for the vessels with sizes greater th1 mm remain about the same@~C! of Table I vs~C! of TableII #, because the saturation in the image has not beenrected or taken into account. As can be seen from~A!–~C! ofTable II, the FWHM which yields the minimum residual dpends somewhat on the range of the vessels being emploand the minimum residual does not always coincide withminimum error~probably because the system was not acrately modeled!. However, the minimum residual does coi
FIG. 7. Effect of incorrect modeling of the imaging system on model-bameasurements.~a! Error in measured vessel size for simulated vessels duincorrect magnification factor used in calculating the imaging system Lfor the model-based method. The actual magnification was 1.3 and 1.5 wthat assumed in the model was 1.4.~b! Effect of using the incorrect LSF~FWHM50.5 mm! in the model-based technique for simulated vessels gerated using LSFs of various FWHM. When the width of the actual LSFsmaller~larger! than that used in the model based technique, sizes of vesless than 1.0 mm tend to be underestimated~overestimated!. The errors seenhere are comparable to those seen for the first derivative [email protected]~a!#.
Medical Physics, Vol. 29, No. 7, July 2002
-
le
n
or-
ed,e-
dtoFile
-sls
TABLE II. Effect of incorrect modeling of the image detector LSF on tsizes measured using the model based technique in phantom studies~A!Average error~in mm! for all vessels. Bolded values correspond to tsmallest residual summed over all vessels for the particular II mode.~B!Average error~in mm! for vessels with diameters less than 1 mm. Boldvalues correspond to the smallest residual summed over all vesselsdiameter,1 mm for the particular II mode.~C! Average error~in mm! forvessels with diameters greater than 1 mm. Bolded values correspond tsmallest residual residual summed over all vessels with diameter.1 mm forthe particular II mode.
FWHMof LSF~units of
pixel size!
II Mode
4.5 6.0 9.0 12.0
Error Resid. Error Resid. Error Resid. Error Resi
~A!1 0.20 16.4 0.23 20.0 0.31 30.6 0.48 34.81.5 0.19 15.6 0.21 18.6 0.27 28.1 0.45 31.22 0.18 15.0 0.18 18.0 0.21 26.9 0.34 29.52.5 0.16 14.9 0.18 18.1 0.19 27.3 0.30 30.23.0 0.15 15.2 0.20 19.0 0.26 29.0 0.30 33.53.5 0.17 16.0 0.26 20.3 0.29 32.5 0.28 37.8
~B!1 0.16 3.2 0.20 3.8 0.29 4.9 0.57 4.91.5 0.15 2.6 0.16 3.0 0.23 3.5 0.49 3.52 0.13 2.1 0.10 2.5 0.10 2.8 0.29 3.02.5 0.09 1.7 0.09 2.3 0.07 2.9 0.22 3.43.0 0.07 1.6 0.14 2.6 0.22 4.0 0.20 6.13.5 0.12 1.7 0.26 3.0 0.27 7.2 0.19 10.3
~C!1 0.23 27.4 0.26 33.5 0.32 51.9 0.41 59.81.5 0.23 26.5 0.26 31.7 0.31 48.5 0.41 54.32 0.23 25.8 0.25 30.9 0.30 46.9 0.38 51.52.5 0.22 25.9 0.25 31.1 0.28 47.6 0.38 52.53.0 0.22 26.6 0.25 32.6 0.29 50.2 0.39 56.43.5 0.22 37.9 0.25 34.7 0.30 53.5 0.37 60.9
FIG. 8. Vessel sizes measured using the model-based technique for thetom study in which the 4.59, 69, 99, and 129 II modes were used. The datwere chosen using the smallest residuals when summed over all vesselfrom part ~A! of Table II bolded data. For vessels smaller than 1 mm,errors are comparable to those of the densitometric technique for the9,69, and 99 modes. For vessels larger than 1 mm, the errors increase duthe saturation of the pixel values. The error bars represent one standeviation.
w
est
u-nac.
hed
sha.foeajut
ssnne
ve
iff the
ocaltersion
ri-ea-eris-.theld
ents
thetoch-s;aretric
d
e ac-ns,rs.e
.ch-val-r.
tememmd byainsmm
r the
M
1630 Hoffmann et al. : Vessel size measurements 1630
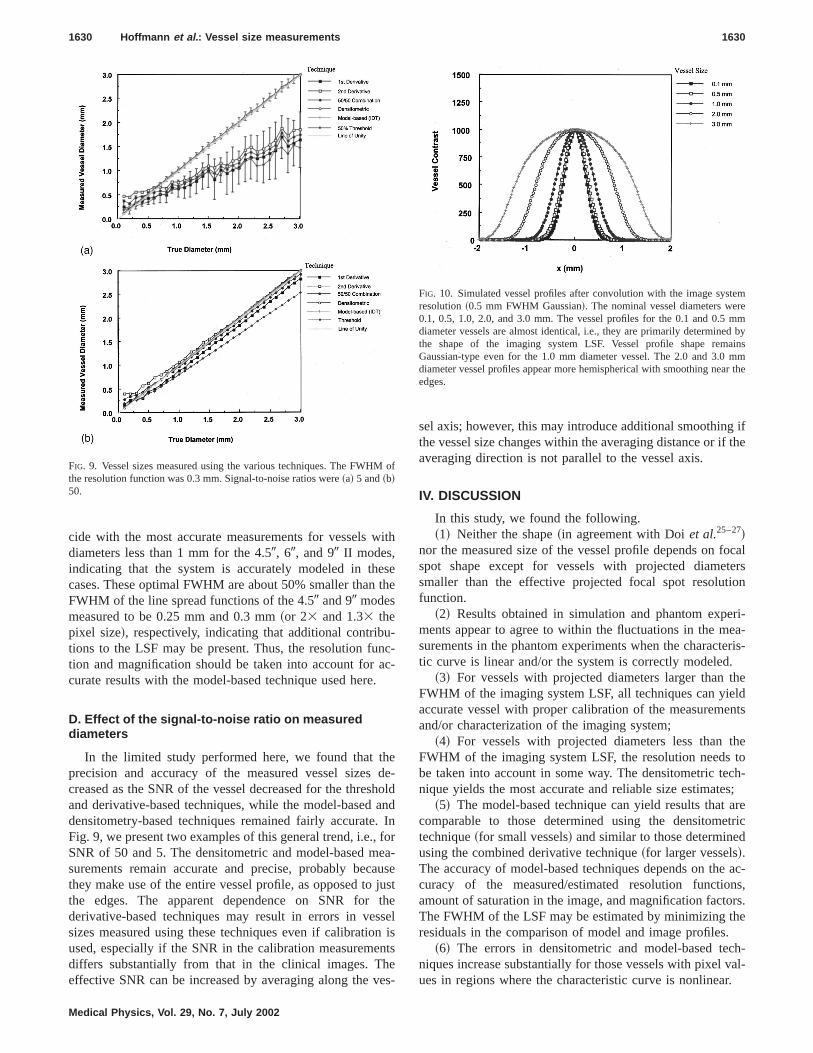
cide with the most accurate measurements for vesselsdiameters less than 1 mm for the 4.59, 69, and 99 II modes,indicating that the system is accurately modeled in thcases. These optimal FWHM are about 50% smaller thanFWHM of the line spread functions of the 4.59 and 99 modesmeasured to be 0.25 mm and 0.3 mm~or 23 and 1.33 thepixel size!, respectively, indicating that additional contribtions to the LSF may be present. Thus, the resolution fution and magnification should be taken into account forcurate results with the model-based technique used here
D. Effect of the signal-to-noise ratio on measureddiameters
In the limited study performed here, we found that tprecision and accuracy of the measured vessel sizescreased as the SNR of the vessel decreased for the threand derivative-based techniques, while the model-baseddensitometry-based techniques remained fairly accurateFig. 9, we present two examples of this general trend, i.e.,SNR of 50 and 5. The densitometric and model-based msurements remain accurate and precise, probably becthey make use of the entire vessel profile, as opposed tothe edges. The apparent dependence on SNR forderivative-based techniques may result in errors in vesizes measured using these techniques even if calibratioused, especially if the SNR in the calibration measuremediffers substantially from that in the clinical images. Theffective SNR can be increased by averaging along the
FIG. 9. Vessel sizes measured using the various techniques. The FWHthe resolution function was 0.3 mm. Signal-to-noise ratios were~a! 5 and~b!50.
Medical Physics, Vol. 29, No. 7, July 2002
ith
ehe
c--
e-oldndInr
a-usest
heelis
ts
s-
sel axis; however, this may introduce additional smoothingthe vessel size changes within the averaging distance or iaveraging direction is not parallel to the vessel axis.
IV. DISCUSSION
In this study, we found the following.~1! Neither the shape~in agreement with Doiet al.25–27!
nor the measured size of the vessel profile depends on fspot shape except for vessels with projected diamesmaller than the effective projected focal spot resolutfunction.
~2! Results obtained in simulation and phantom expements appear to agree to within the fluctuations in the msurements in the phantom experiments when the characttic curve is linear and/or the system is correctly modeled
~3! For vessels with projected diameters larger thanFWHM of the imaging system LSF, all techniques can yieaccurate vessel with proper calibration of the measuremand/or characterization of the imaging system;
~4! For vessels with projected diameters less thanFWHM of the imaging system LSF, the resolution needsbe taken into account in some way. The densitometric tenique yields the most accurate and reliable size estimate
~5! The model-based technique can yield results thatcomparable to those determined using the densitometechnique~for small vessels! and similar to those determineusing the combined derivative technique~for larger vessels!.The accuracy of model-based techniques depends on thcuracy of the measured/estimated resolution functioamount of saturation in the image, and magnification factoThe FWHM of the LSF may be estimated by minimizing thresiduals in the comparison of model and image profiles
~6! The errors in densitometric and model-based teniques increase substantially for those vessels with pixelues in regions where the characteristic curve is nonlinea
FIG. 10. Simulated vessel profiles after convolution with the image sysresolution~0.5 mm FWHM Gaussian!. The nominal vessel diameters wer0.1, 0.5, 1.0, 2.0, and 3.0 mm. The vessel profiles for the 0.1 and 0.5diameter vessels are almost identical, i.e., they are primarily determinethe shape of the imaging system LSF. Vessel profile shape remGaussian-type even for the 1.0 mm diameter vessel. The 2.0 and 3.0diameter vessel profiles appear more hemispherical with smoothing neaedges.
of

is
dlemnro
-eed
urtinli
vethulteaiur
mar
tonnd
scestithp
reaflehar
ro
iqhountistintho
leurti-e
ion,
ite-ap-ardmet-ng athis
thera-ane-te-canmm,in
ioniffer-
tentated., a
cali-ion.
c-hegle
ates
s onal
lin-sed
e to
itive
towithallerns.theof
less
for
elingp-rateheck
1631 Hoffmann et al. : Vessel size measurements 1631
The lack of sensitivity to the shape of the focal spot dtribution and the sensitivity of the derivative techniques~forsmall vessels! to the FWHM of the LSF can be understooby considering Fig. 10. In Fig. 10, we present vessel profiof various sizes after convolution with the imaging systeLSF ~FWHM 0.5 mm!. The maxima in the profiles have beenormalized to facilitate perception of the change in the pfile shape from that of the vessel profile~semicircular! overto that of the LSF~Gaussian! as the vessel diameter decreases. Thus, in this latter case, the sizes measured arproximately equal to the FWHM of the LSF as determinusing the respective techniques.
The agreement of the simulation and phantom measments indicates that simulations may be useful in evaluavessel sizing techniques when the characteristic curve isear and/or the system is correctly modeled. Moriokaet al.,28
also obtained similar results in manual measurements ofsel sizes in simulation and phantom studies. However,results here have been obtained for phantoms with circcross sections. Further study and comparisons of theseniques in simulation and phantom studies of vessels conting asymmetric lumen should be performed to explore fther the usefulness and limitations of simulations.
These results, especially for vessels with projected diaeters larger than the FWHM of the imaging system LSF,in good agreement with those seen in the literature.3–10 Inparticular, accurate sizes of vessels with sizes larger thanFWHM of the LSF can be obtained using a combinati~50–50 here! of the sizes measured using first- and secoderivative techniques. Other investigators2,5 have proposeddifferent weighting of these sizes when measuring vessizes in digitized cine-film angiograms. While the differenin weighting may be due to differences in the charactericurves of the imaging systems and/or to differences inshapes of the resolution functions, changes in these comnents of the imaging chain did not appear to affect oursults. Thus, the sizing technique employed should be cbrated using phantoms and imaging parameters that rethose which would be used clinically. It should be noted tthese results also indicate that vessel sizes of smallestenosed vessels@O~1 mm!# will tend to be overestimatedusing derivative-based techniques even with careful calibtion. This overestimation can result in an underestimationthe percent stenosis.
Vessel sizes measured using the densitometric technwere consistently more accurate and more precise than tmeasured in simulation studies using the other techniqwhen the characteristic curve is linear or properly taken iaccount. In the phantom studies, in which the charactercurve was assumed to be linear, accurate sizes were obtafor the smaller vessels. However, substantial errors inmeasured sizes of large vessels resulted from the nlinearity ~i.e., saturation! of the characteristic curve~see be-low!. The quality of the densitometric results for the smalvessels is probably due to its inherent insensitivity to blring by the resolution function and because it uses the envessel profile~effectively improving the SNR of the measurement!. The accuracy of the densitometric technique do
Medical Physics, Vol. 29, No. 7, July 2002
-
s
-
ap-
e-gn-
s-e
arch-n--
-e
he
-
el
ceo--
li-cttor
a-f
uese
esoiceden-
r-re
s
depend on the method used to determine the vessel regi.e., the edges to be used in integration@Eq. ~4!#. When thevessel region was identified using only a thresholding crrion, the errors increased by approximately a factor ofproximately 50% for the smaller vessels with the standdeviation remaining about the same. Because the densitoric technique calculates the measured vessel sizes usicalibration vessel, the absolute sizes measured usingtechnique will be sensitive to accuracy of the diameter ofcalibration vessel, differences in orientations of the calibtion and measured vessel relative to the imaging pl@;sqrt~cos~Q!!,3% error for a 20 degree error in orientation#, and differences in the concentration of contrast marial in these two vessels. The densitometric techniqueyield accurate vessel sizes, for vessels as small as 0.3even for a 129 II mode, if the measurements are performeda linear region of the characteristic curve, the calibratvessel measurement is accurate, and these latter two dences are small.
The model-based technique provided the most consisaccuracy across the entire range of vessel sizes evaluHowever, it does require an estimate of the magnificationmodel for the vessel cross section, measurement of thebration curve, and measurement of the resolution functErrors in the estimated magnification@O~7%!# appear to re-sult in small errors in the measured sizes@O~50 microns!#@Fig. 7~a!#. In this study, we employed a circular cross setion for our model. However, projections of ellipses have tsame functional form independent of eccentricity and anof the major axis relative to the imaging plane.29,30Thus, thecircular cross-section model should yield accurate estimof maximal extent~vessel sizes! for vessels with ellipticalcross sections as well. The characteristic curve dependthe kVp of the acquisition, and it is not a standard clinicpractice to determine it. Saturation in the image, i.e., nonearities in the characteristic curve, can result in increaerrors in the model-based~and densitometric! techniques.However, the model-based technique is not as sensitivthese nonlinearities as is the densitometric technique~seebelow!.
The model-based technique appears to be most sensto errors in the FWHM~and not the shape! of the imagingsystem LSF. Errors in the FWHM of the LSF can leaderrors in the measured sizes comparable to those seenthe derivative-based techniques for vessels with sizes smthan 1 mm@Fig. 7~b!#. The measurement of the resolutiofunction23,24 is not part of standard practice in most clinicWhen the resolution function is estimated as part ofcalculations,10,31errors obtained were comparable to thosethe densitometric technique for vessels with diametersthan 1 mm for the 4.59, 69, and 99 II modes and comparableto those of the 50–50 combination derivative techniquevessels larger than 1 mm. The larger errors in the 129 IImode measurements are probably due to inaccurate modof the imaging system. Thus, if the imaging system is proerly modeled, model-based techniques may provide accuvessel sizes for a wide range of vessels or be used as a c

sns
oub
ssit
twiththan
eththnenv
re
inem
nsa
tioch
aehvitt
withdeainte
us
at
te
r-
tem
the
ndhei
e,
r, P.ivoingar-
ifi-sic
diol.
lvid-
on
eaiol.
iszedes,’’
ries
ueEEE
. J.p.
k-a-
o-ag-
ar-ue,’’
n of
icof
-
1632 Hoffmann et al. : Vessel size measurements 1632
of sizes measured using derivative~larger vessels! or densi-tometric techniques~smaller vessels!.
The derivative-based techniques yielded accurate sizelarger vessels in the presence of saturation of the sigwhereas accuracy of the densitometric and model-batechniques degraded. The relative sensitivity of the varitechniques to nonlinearities in the characteristic curve canunderstood as follows. The effect of saturation on the veprofiles is to change the shape of the profile from one wthe functional form sqrt(12(x/xmax)
2), i.e., elliptic, to onewhich is more square. The derivative-based techniques,most insensitive of the techniques, evaluate the regionshighest derivative which do not change substantially aselliptic-to-square change of shape occurs. Althoughmodel-based technique uses an elliptic shape in its compsons with the image profiles, it is less sensitive to nolinearities than the densitometric technique because~1! theresidual@Eq. ~5!# is more sensitive to errors in regions of thprofile with high gradients than those near the center ofprofile and~2! the gradients near the edge remains aboutsame with the primary shape change occurring at the ceof the profile. The densitometric technique is the most ssitive to non-linearities because the area changes with detions of the characteristic curve from linearity, i.e., the aof the profile is given by
Aprofile5 (Left edge
Right edge
CC~p~x!!; (Left edge
Right edge
p~x!, ~9!
where p(x) is the pixel value at positionx in the vesselprofile, and CC(y) is the transformation of pixel valuey tolog exposure value. If the function CC is deviates from learity ~or saturates! for the central portion of the curve, thprofile is effectively clipped, and the area calculated assuing linearity @using the latter portion of Eq.~9!# will be com-mensurately reduced from its proper value. Thus, the detometric is the most sensitive to the shape of the profiledetermined by the characteristic curve.
While not the focus of this study, the signal-to-noise ra~SNR! was found to affect the accuracy of each of the teniques. The densitometric and model-based techniquespear to be relatively insensitive to the SNR, probably bcause they take the whole profile into account. Tderivative- and threshold-based techniques appear to besensitive to the SNR in this study. We believe this sensitivarises primarily because of the technique used to defineedges of the vessel region~Sec. II A 3!; specifically, the ves-sel region was determined as those pixels contiguousthe center, having pixel values greater than zero, and wiedges identified using the first derivative. As the SNRcreases, there is an increasing probability that the maximthe derivatives or the 50% threshold level will occur withthe vessel region and not at its edge. Thus, one shouldthe particular method for various levels of SNR and adjthe method accordingly.10,31,32
Although each of the techniques can yield highly accurvessel sizes for a range of vessel sizes~independent of theFWHM of the LSF!, no one technique provides accura
Medical Physics, Vol. 29, No. 7, July 2002
foraledse
elh
hetheeri--
ee
ter-
ia-a
-
-
i-s
-p--eeryyhe
thin-in
stt
e
sizes for all vessel sizes~unless the imaging system is corectly modeled or characterized!. A combination of thederivative-based technique~for larger vessels! and tech-niques which attempt to characterize and model the sysfrom the image data itself10,31 ~for smaller vessels! hold per-haps the most promise in providing accurate sizes overentire range of vessel sizes~0.3 mm–6 mm!.
ACKNOWLEDGMENTS
Supported by USPHS Grants Nos. HL52567 aNS38746, the Toshiba Corporation, and the Robert L. OisFoundation.
a!Electronic mail: [email protected]. Zir, S. W. Miller, R. E. Dinsmore, J. P. Gilbert, and J. W. Harthorn‘‘Interobserver variability in coronary angiography,’’ Circulation53,627–632~1976!.
2J. Haase, C. DiMario, C. J. Slager, W. J. van der Giessen, A. den BoeJ. deFeyter, J. H. Reiber, P. D. Verdouw, and P. W. Serruys, ‘‘In-vvalidation of on-line and off-line geometric coronary measurements usinsertion of stenosis phantoms in porcine coronary arteries,’’ Cathet Cdiovasc. Diagn.27, 16–27~1992!.
3P. M. van der Zwet and J. H. Reiber, ‘‘A new approach for the quantcation of complex lesion morphology: the gradient field transform; baprinciples and validation results,’’ J. Am. Coll. Cardiol.24, 216–224~1994!.
4R. L. Kirkeeide, P. Fung, R. W. Smalling, and K. L. Gould, ‘‘Automateevaluation of vessel diameter from arteriograms,’’ Comput. Card1982, 215–218~1982!.
5M. T. LeFree, S. B. Simon, G. B. J. Mancini, and R. A. Vogel, ‘‘Digitaradiographic assessment of coronary arterial geometric diameter andeodensitometric cross-sectional area,’’ Proc. SPIE626, 334–341~1986!.
6R. A. Kruger, ‘‘Estimation of the diameter of and iodine concentratiwithin blood vessels using digital radiography devices,’’ Med. Phys.8,652–658~1981!.
7M. A. Simons, R. A. Kruger, and R. L. Power, ‘‘Cross-sectional armeasurements by digital subtraction videodensitometry,’’ Invest. Rad8, 637–644~1986!.
8H. Fujita, K. Doi, L. E. Fencil, and K. G. Chua, ‘‘Image feature analysand computer-aided diagnosis in digital radiography. 2. Computeridetermination of vessel sizes in digital subtraction angiographic imagMed. Phys.14, 549–556~1987!.
9D. M. Weber, ‘‘Absolute diameter measurements of coronary artebased on the first zero crossing of the Fourier spectrum,’’ Med. Phys.16,188–196~1989!.
10R. C. Chan, W. C. Karl, and R. S. Lee, ‘‘A new model-based techniqfor enhanced small-vessel measurement in x-ray cine-angiograms,’’ ITrans. Med. Imaging19, 243–255~2000!.
11J. J. Gerbrands, J. H. C. Reiber, B. Scholts, G. Langhout, and CKooijman, ‘‘Structural analysis of the coronary arterial tree,’’ Int. SymMed. Imaging Image Interpretation, 54–58~1982!.
12K. R. Hoffmann, K. Doi, S. H. Chen, and H. P. Chan, ‘‘Automated tracing and computer reproduction of vessels in DSA images,’’ Invest. Rdiol. 25, 1069–1075~1990!.
13I. Liu and Y. Sun, ‘‘Recursive tracking of vascular networks in angigrams based on the detection-deletion scheme,’’ IEEE Trans. Med. Iming 12, 334–341~1993!.
14H. P. Chan and K. Doi, ‘‘Determination of radiographic screen-film chacteristic curve and its gradient by use of a curve-smoothing techniqMed. Phys.5, 443–447~1978!.
15D. R. Bednarek and S. Rudin, ‘‘Computer-aided bootstrap generatiocharacteristic curves for radiographic imaging systems,’’ Med. Phys.28,515–520~2001!.
16H. Fujita, K. Doi, M. L. Giger, and H. P. Chan, ‘‘Investigation of basimaging properties in digital radiography. 5. Characteristic curvesII-TV digital systems,’’ Med. Phys.13, 13–18~1986!.
17C. E. Metz and K. Doi, ‘‘Transfer function analysis of radiographic imaging systems,’’ Phys. Med. Biol.24, 1079–1106~1979!.

in
nged
n
ofjec
gs-
.fer
SPIE
d
-ze in
dd.
a-io-
rea
egio-
dere,’’
1633 Hoffmann et al. : Vessel size measurements 1633
18B. G. Brown, E. L. Bolson, and H. T. Dodge, ‘‘Dynamic mechanismshuman coronary stenosis,’’ Circulation74, 106–111~1986!.
19K. Doi and K. Rossmann, ‘‘Comparison of convolution and ray-tracimethods for computing small blood vessel images in angiography,’’ MPhys.4, 154–156~1977!.
20K. Doi, L. N. Loo, and K. Rossmann, ‘‘Validity of computer simulatioof blood vessel imaging in angiography,’’ Med. Phys.4, 400–403~1977!.
21A. Sen, L. Lan, K. Doi, and K. R. Hoffmann, ‘‘Quantitative evaluationa coronary vessel tracking technique on clinical angiographic protions,’’ Med. Phys.26, 698–706~1999!.
22B. Hasegawa,The Physics of Medical X-ray Imaging, 2nd ed.~MedicalPhysics Publishing, Madison, Wisconsin, 1991!.
23H. Fujita, K. Doi, and M. L. Giger, ‘‘Investigation of basic imaginproperties in digital radiography. 6. MTFs of II-TV digital imaging sytems,’’ Med. Phys.12, 713–720~1985!.
24H. Fujita, D. Y. Tsai, T. Itoh, K. Doi, J. Morishita, K. Ueda, and AOhtsuka, ‘‘A simple method for determining the modulation transfunction in digital radiography,’’ IEEE Trans. Med. Imaging11, 34–39~1992!.
25K. Doi and K. Rossmann, ‘‘Evaluation of focal spot distribution by RMvalue and its effect of blood vessel imaging in angiography,’’ Proc. S47, 207–213~1974!.
Medical Physics, Vol. 29, No. 7, July 2002
.
-
26K. Doi and K. Rossmann, ‘‘Effect of focal spot distribution on bloovessel imaging in magnification radiology,’’ Radiology114, 435–441~1975!.
27K. Doi, L. N. Loo, and H. P. Chan, ‘‘X-ray tube focal spot sizes: comprehensive studies of their measurement and effect of measured siangiography,’’ Radiology144, 383–393~1982!.
28C. A. Morioka, C. K. Abbey, M. Eckstein, R. A. Close, J. S. Whiting, anM. LeFree, ‘‘Simulating coronary arteries in x-ray angiograms,’’ MePhys.27, 2438–2444~2000!.
29D. W. Crawford, S. H. Brooks, R. Barndt, and D. H. Blankenhorn, ‘‘Mesurement of atherosclerotic luminal irregularity and obstruction by radgraphic densitometry,’’ Invest. Radiol.12, 307–313~1997!.
30P. L. Lee and R. H. Selzer, ‘‘Best estimate of luminal cross-sectional aof coronary arteries from angiograms,’’ Med. Phys.15, 576–580~1988!.
31M. Sonka, G. K. Reddy, M. D. Winniford, and S. M. Collins, ‘‘Adaptivapproach to accurate analysis of small-diameter vessels in cineangrams,’’ IEEE Trans. Med. Imaging16, 87–95~1997!.
32J. H. Reiber, B. Goedhart, G. J. Brand, L. Schiemanck, and P. M. vanZwet, ‘‘Quantitative coronary arteriography: current status and futurHeart Vessels12, 209–211~1997!.


![Analysis of Radially Undersampled 4D Velocity Mapping (PC ... · Post-Processing of the data included calculation of angiograms similar to complex difference processing [7], vessel](https://static.fdocuments.net/doc/165x107/5e90d2594647eb037a3ca285/analysis-of-radially-undersampled-4d-velocity-mapping-pc-post-processing-of.jpg)