VERTICAL INTEGRATION DURING THE HOLLYWOOD STUDIO ERA: A
47
VERTICAL INTEGRATION DURING THE HOLLYWOOD STUDIO ERA: A TRANSACTION COSTS EXPLANATION F. Andrew Hanssen Montana State University and the Department of Justice* April 4, 2008 ABSTRACT: The Hollywood “studio system” – with production, distribution, and exhibition vertically integrated – flourished from the late teens until 1948, when the U.S. Supreme Court issued its famous Paramount decision. The Paramount consent decrees required the divestiture of affiliated theater chains and the abandonment of a number of vertical practices. Although many of the vertical practices have since been posited to have enhanced efficiency, an efficiency- enhancing rationale for ownership of theater chains has not been developed. This paper explores a transaction costs hypothesis: the vertical integration of production/distribution with exhibition allowed more efficient adjustments in the length of film runs. Post-contractual run length adjustments were desirable, because demand for a given film is not revealed until the film is actually exhibited. To test the hypothesis, the paper employs a unique data set of cinema booking sheets. It finds that run lengths for releases by vertically integrated (into exhibition) film producers were significantly – economically and statistically – more likely to be altered ex post. The paper also discusses additional contractual practices intended to promote flexibility in run lengths, some of which were instituted following the Paramount divestitures. I would like to thank Rob Fleck, Patrick Greenlee, Alex Raskovich, Chuck Romeo, Jeff Wooldridge, and seminar participants at the Department of Justice’s Economic Analysis Group, George Washington University, and Montana State University for helpful comments. Any errors are, as usual, my own. *Professor, Department of Economics, Montana State University, Bozeman, MT 59717, and Visiting Economist, Economic Analysis Group, Antitrust Division, Department of Justice (phone: 202-307-5820; e-mail: [email protected] )
Transcript of VERTICAL INTEGRATION DURING THE HOLLYWOOD STUDIO ERA: A

VERTICAL INTEGRATION DURING THE HOLLYWOOD STUDIO ERA:A TRANSACTION COSTS EXPLANATION
F. Andrew HanssenMontana State University and the Department of Justice*
April 4, 2008
ABSTRACT: The Hollywood “studio system” – with production, distribution, and exhibitionvertically integrated – flourished from the late teens until 1948, when the U.S. Supreme Courtissued its famous Paramount decision. The Paramount consent decrees required the divestitureof affiliated theater chains and the abandonment of a number of vertical practices. Althoughmany of the vertical practices have since been posited to have enhanced efficiency, an efficiency-enhancing rationale for ownership of theater chains has not been developed. This paper exploresa transaction costs hypothesis: the vertical integration of production/distribution with exhibitionallowed more efficient adjustments in the length of film runs. Post-contractual run lengthadjustments were desirable, because demand for a given film is not revealed until the film isactually exhibited. To test the hypothesis, the paper employs a unique data set of cinemabooking sheets. It finds that run lengths for releases by vertically integrated (into exhibition) filmproducers were significantly – economically and statistically – more likely to be altered ex post. The paper also discusses additional contractual practices intended to promote flexibility in runlengths, some of which were instituted following the Paramount divestitures.
I would like to thank Rob Fleck, Patrick Greenlee, Alex Raskovich, Chuck Romeo, Jeff Wooldridge, andseminar participants at the Department of Justice’s Economic Analysis Group, George WashingtonUniversity, and Montana State University for helpful comments. Any errors are, as usual, my own.
*Professor, Department of Economics, Montana State University, Bozeman, MT 59717, and VisitingEconomist, Economic Analysis Group, Antitrust Division, Department of Justice (phone: 202-307-5820;e-mail: [email protected])
1U.S. v. Paramount Pictures, Inc., 66 F. Supp. 323 (S.D.N.Y. 1946); modified onrecharging, 70 F. Supp 53 (S.D.N.Y. 1947); U.S. v. Paramount Pictures, Inc., 334 U.S. 131(1948); remanded, 85 F. Supp. 881 (S.D.N.Y. 1949).
2The Court asserted that (first-run) exhibition was “foreclosed” in order to maintain amonopoly on movie production, and that the monopoly on movie production enabled thedefendants to foreclose exhibition. (The circularity of the argument was not noted.) “Naiveforeclosure” theory of this type was effectively demolished by Chicago school scholars of the late1950s onwards. Although more recent models provide a stronger theoretical foundation for theclaim of foreclosure through vertical integration (see, e.g., Salinger 1988, Ordover, Saloner, andSalop 1990, Riordan 1998), most do not appear to fit the facts of the motion picture industry verywell. Furthermore, many non-affiliated producers and exhibitors were clearly not foreclosedduring the Hollywood studio era – independent producers like David O. Selznick flourished, andnon-integrated Columbia, Universal, and United Artists evidently had no trouble booking theirfilms into Big Five cinemas. In addition, more than one-quarter of first-run theaters wereindependents.
1
I. INTRODUCTION
Arguably, no U.S. antitrust action of the post-War period has had as profound an effect
on an industry as the Paramount case, which brought the famous Hollywood studio era to an
end.1 The Paramount consent decrees, following more than twenty-five years of near-continuous
litigation, altered fundamentally the structure of the relationship between producer/distributors
and exhibitors. Under the terms of the decrees, contractual practices such as block-booking were
banned; the system of runs, clearance periods, and zoning under which films were distributed
was outlawed; and the divestiture of producer-owned cinemas was mandated. The scope of the
decision was remarkable – in recent years, only the AT&T break-up comes close.
The passage of time has not been kind to the economic arguments underlying the
Paramount decision.2 Kenney and Klein (1983) and Hanssen (2000) provide efficiency
rationales for block-booking. De Vany and Eckert (1991) and Orbach and Einav (forthcoming)
discuss how minimum ticket prices reduced monitoring costs. De Vany and Eckert (1991, 76)
3In addition, De Vany and Eckert argue that various other practices described by theSupreme Court as “devices for stifling competition and diverting the cream of the business to thelarge operators” (e.g., “formula deals,” whereby film rents were set as a percentage of nationalgross; “master agreements,” which licensed whole circuits simultaneously; and “moreoverclauses,” which allowed circuits to move films across cinemas) served to reduce transactioncosts.
4Though see Raskovich (2003).
2
argue that the system of runs, clearances, and zoning served to provide low-cost access to large
numbers of film goers.3
The one banned practice that has yet to be satisfactorily explained is Hollywood’s vertical
integration of exhibition with production/distribution. Although the Justice Department’s
assertion that integration was intended to foreclose the market (thus preventing independent
producers and exhibitors from entering) appears naive today, no better alternative has arisen.4
Indeed, it is not immediately apparent what (if anything) film companies gained by owning both
production and exhibition facilities. Cinema ownership was certainly not a prerequisite for
success in production – there were a large number of cinema-less film producers (albeit
somewhat smaller in size), including three of the Paramount defendants. Similarly, many
independent cinemas flourished, and in fact accounted for the majority of attendance revenue.
Furthermore, because most affiliated cinemas were as likely to show films by rival film-makers
as by the affiliated studio, avoiding double marginalization does not appear to have been a key
issue. And although direct ownership of certain large urban cinemas might conceivably be
understood as a response to concerns about risk-sharing, information-gathering, or free-riding
problems, large urban cinemas comprised only a tiny minority of the exhibition outlets owned by
the Paramount defendants.
5Ex post adjustments could generate potentially large gains, because demand is highlyunpredictable until a film actually begins its run (see, e.g., De Vany and Walls 1996). SeeSection III for a more complete discussion.
6The film booking season typically ran from September 1 of one year to August 31 of thefollowing year. See United States v. Paramount et al, Petition, Equity No. 87-823 (1938), p 55.
7These results are similar to Gil (2007), which finds that vertically-integrated exhibitorsin Spain (i.e., Spanish exhibitors with ownership links to Spanish movie distributors) show filmsfor which contracts are more likely to be renegotiated. See also Filson (2005), who develops amodel that predicts that ownership of exhibition outlets by a vertically integrated producer allowsbetter coordination of film runs.
3
In this paper, I use a unique data set to explore a transaction cost-based explanation for
the vertical integration of exhibition with production/distribution. I propose that cinema-
ownership promoted revenue-enhancing but difficult-to-contract-for adjustments in the length of
film runs, by allowing film producers – through their affiliated cinemas – to capture part of the
surplus generated by the replacement of films revealed ex post (i.e., upon exhibition) to be less
popular than expected.5 To test the hypothesis, I examine a set of cinema booking sheets from
the 1937-8 film season.6 Consistent with the hypothesis, I find that abbreviated run lengths were
roughly 10 percent more likely for films released by companies that owned theater chains. The
results are robust to alternative specifications, and hold for films of different types.7 I also
identify and discuss additional contractual features that served to promote ex post flexibility in
run lengths, and briefly explore new contractual terms that emerged in the aftermath of the
Paramount-mandated divestitures.
This paper is part of a large literature on “relational” or “implicit” contracts –
arrangements undergirded not by the threat of third-party enforcement (by a court, for example),
8See, e.g., Bull (1987), Klein (1996), Klein and Leffler (1981), Telser (1981), andWilliamson (1975, 1985). There is also a large sociology/organizational behavior literature; see,e.g., Simon (1951) on employment relationships.
9See, e.g., Waterman and Weis (1996), Chipty (2001). Similar arguments were applied tonetwork television in past decades; see the discussion in Crandall (1975).
4
but by reputation, the prospect of repeat dealings, or self-enforcing penalties.8 As many
researchers have noted, important aspects of business relationships (both inside and outside the
firm) are conducted without formal contracts. Baker, Gibbons, and Murphy (2002, 40) write,
a formal contract must be specified ex ante in terms that can be verified ex post bythe third party [enforcer], whereas a relational contract can be based on outcomesthat are observed by only the contracting parties ex post, and also on outcomesthat are prohibitively costly to specify ex ante. A relational contract thus allowsthe parties to utilize their detailed knowledge of their specific situation and toadapt to new information as it becomes available.
My hypothesis is that during the Hollywood studio era, cinema ownership helped enforce a
relational/implicit/informal contract that allowed ex post adjustment in run lengths of ex ante
unpredictable films.
The findings presented in this paper have implications not only for understanding the
Paramount case (as important as this may be, given that the Paramount consent decrees are still
in effect), but for theories of foreclosure more generally. The parallels between the vertically
integrated motion picture companies and today’s cable television providers are clear – both
produce(d) “content” – movies and cable programs/networks – and own(ed) exhibition facilities.
A number of commentators have suggested that if allowed to produce programming, cable
television companies will favor their own productions over those of independent rivals.9 In this
paper, I provide evidence that cinema-owning motion picture companies did not favor their own
productions – producer owned-cinemas exhibited substantially more films by rival studios than
10Cassady (1958, 152) writes, “The major problem of motion picture distribution is to sodeploy the several hundred [expensive] prints of a film that maximum revenue will result fromthe process.” De Vany and Eckert (1991, 77) note that in 1945, a black-and-white film print cost$150-300, and a colored print $600-800, to manufacture. The average number of prints per filmwas 300, and each print had about 100 bookings, the average of which returned rentals less thanprint costs. (As a point of comparison, the average run in the sample I analyze in this papergenerated $360, and that was during first-runs.)
11All eight defendants engaged in distribution, and all but United Artists engaged inproduction (UA financed and distributed the films of a small number of affiliated producers). The eight defendants accounted for 71 percent of total feature films released between 1937 and1946, and almost all the ‘A’ pictures (see Conant 1960, 45). There were also a large number ofsmaller production companies who were not defendants in the case – the 1946 Film DailyYearbook lists releases by 29 separate production companies. Most of these companies(Monogram and Republic were two of the largest), tended to eschew A films completely and
5
by affiliated studios. Moreover, I propose that any favoritism would have defeated the very
purpose of the vertical integration.
II. THE MOTION PICTURE INDUSTRY AT THE TIME OF PARAMOUNT
The motion picture industry encompasses three vertically-linked activities: production
(using actors, sets, and film), distribution (passing motion picture prints from producer to
exhibitor, and from exhibitor to exhibitor), and exhibition (showing motion picture prints to the
final consumer). In any given year, hundreds of movies of various genres, costs, and ex ante
unobservable levels of popularity are produced, distributed to local theaters, and exhibited.10
At the time of the Paramount decrees, there were five fully integrated (production-
distribution-exhibition) and three partly integrated (production-distribution) Paramount
defendants. The fully integrated defendants – known as the “Big Five” – were Twentieth
Century-Fox, Loew’s-MGM, Paramount, RKO, and Warner Brothers. The partly integrated
defendants – known as the “Little Three” – were Columbia, Universal and United Artists.11 In

devote themselves entirely to serials (such as the Lone Ranger films) and B-pictures. There were64 film distributors in existence as of 1944 (and 77 in 1946), but only eleven engaged innationwide distribution (the eight Paramount defendants plus low-budget film makersMonogram, Republic, and PRC).
12The Big Five also owned subsequent-run theaters; see Conant (1960) citing Paramountcase material, for a discussion and details. First-run theaters exhibited films first upon release,and were located in prime downtown areas. Second and third-run theaters tended to besomewhat smaller, and were located in less central, areas. Fourth and fifth (and subsequent) runtheaters were smaller still, and found mostly in residential neighborhoods. A large city (likeChicago) might have a dozen runs. Theaters within each run designation enjoyed a contractually-set period of time that had to pass before a film could be sent to a lower-run theater – the“clearance.” Second-run theaters, for instance, usually had to wait for three weeks beyond theend of the first-run to exhibit a film. Finally, runs and clearances operated within a specifiedgeographic “zone,” over which the exhibitor was given exclusive privilege. This was the systemof “runs, clearances, and zoning” that was banned under the Paramount decrees. Zoningeventually became quite complex, and even gave theaters in certain cities prior rights over thosein other cities. See, e.g., Huettig (1944, 125-7) for more detail).
13See Appendix to the Brief for the United States of America, Section B, The UnitedStates v. Paramount Pictures, Inc., et al., October 1947. Cinemas owned by the Big Five wereespecially important in major urban areas, accounting for 70 percent of rental revenues in NewYork, 75 percent in Philadelphia, and 75 percent in Atlanta (Huettig 1944, 78-9). The larger thecity, the smaller the proportion of revenue earned during the first-run (because the greater thenumber of subsequent runs). For example, in New York and Philadelphia (numbers 1 and 3 in1940 population rank), the first-run accounted for 20 percent and 30 percent of rental revenues,respectively, while in Atlanta (number 28 in 1940 population rank), the first-run accounted for 80percent of rental revenues (see Huettig 1944, 78-9).
6
the 1940s, Big Five-owned cinemas accounted for about 15 percent of all cinemas in the U.S.,
and for about 70 percent of first-run cinemas (cinemas that received films for exhibition first).12
Big Five cinemas were the source of nearly half of all film rental revenues.13
Broadly speaking, the Big Five owned two different types of cinemas: “movie palaces”
and “ordinary cinemas.” The movie palaces (sometimes referred to as “metro-deluxe” theaters)
were the most famous, their distinguishing characteristics being size, opulence, and – very
importantly – the fact they exhibited only the films of the affiliated studio (typically in a “pre-
14The original complaint by the Department of Justice did not focus on first-run cinemasper se (although first-run cinemas were central in final decision) but rather on ownership of“metropolitan deluxe theaters” which was alleged to allow the defendants to “promote andcontrol the value of pictures to subsequent-run theaters.” Balio (1976, 47) writes, “after themovie palaces were built, it meant playing a picture before general release in a first-class theateron an extended basis and at top admissions prices, usually about two dollars.” An example of anerstwhile movie palace is the Paramount Theater, which was located at the base of the ParamountBuilding in Times Square and seated 3600. (For a description of the Paramount Theater, seehttp://en.wikipedia.org/wiki/Paramount_Theater_(New_York_City).) As of the late 1930s, theaverage cinema in the U.S. seated 579, and only 0.7 percent of all cinemas seated more than 3000(and 7 percent seated more than 1500). See the 1938-39 International Motion PictureHandbook, pp 930-1.
15The exceptionally large number of Paramount cinemas is partly explained by the factthat Paramount commonly took partial stakes.
7
release” mode that preceded the official first-run).14 Palace screenings could last for weeks, were
tracked nationwide by industry publications (the weekly trade paper Variety devoted several
pages to them in each issue), and served to influence success in the runs that followed (both by
inspiring audiences to see the film, and by inspiring exhibitors to show the film in the first place).
Yet, as can be seen in Table 1, movie palaces made up but a small minority of the
cinemas owned by the Paramount defendants – about 5 percent in terms of numbers (two-to-
three times that in terms of revenue generated).15 Most Big Five cinemas were “ordinary,” in the
sense of not differing from the independent cinemas with which they competed (in terms of size,
appearance, or booking practices). “Ordinary” Big Five cinemas were set in unglamorous
locales, such as Hickory, North Carolina (the Paramount-owned Center Theater), or Florence,
Colorado (Fox’s Liberty Theater), or Appleton, Wisconsin (Warner Brother’s Appleton Theater).
Most germane to this analysis, these ordinary cinemas, unlike the palaces, exhibited films
produced by rival film companies, typically renting from all of the major producers. This can be
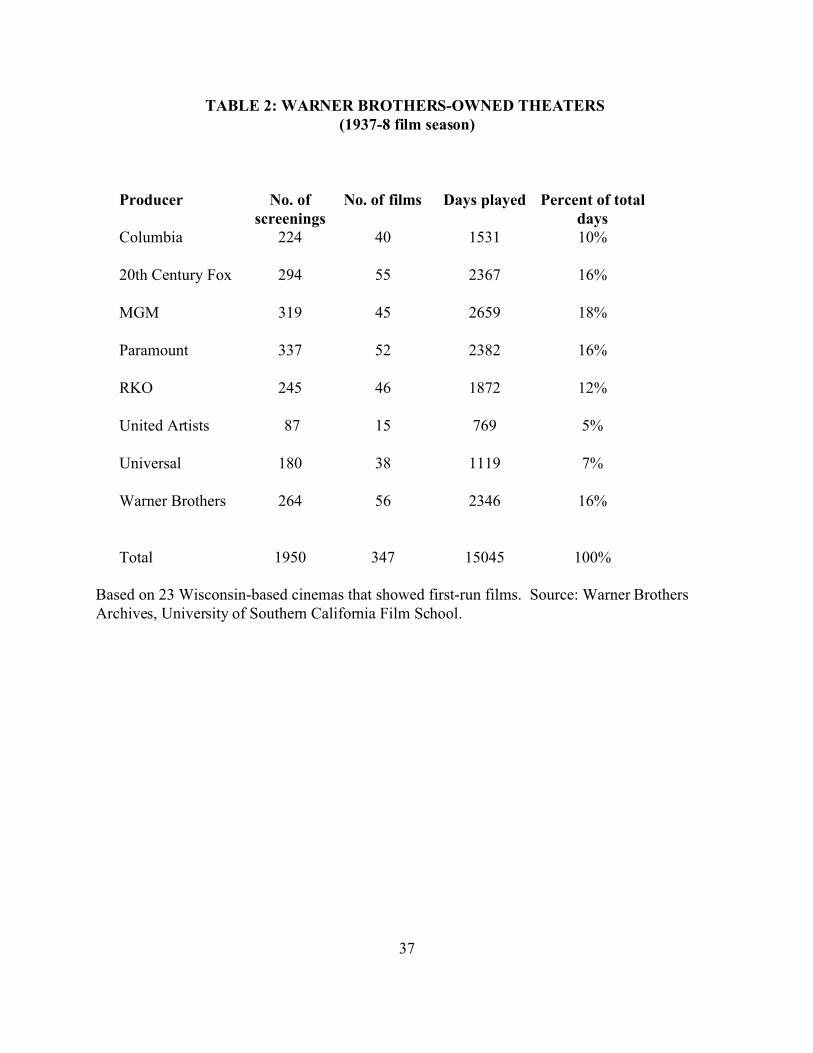
seen in Table 2, which shows total days of first-run exhibition by producer for twenty-three
16I describe this sample in detail in Section IV.
17See also U.S. v. Paramount Pictures, Inc., 334 U.S. 131 (October 1947), “Appendix toBrief for the United States of America,” pp. 61-88, which discusses the terms under which eachof the affiliated cinemas showed each of their rival’s films (the terms were mostly the sameacross company).
8
Warner Brothers-owned cinemas for the 1937-38 season.16 Despite the Warner Brothers’
ownership, Warner Brothers’ releases accounted for only 16 percent of film showing days, the
same as for Paramount and Fox, and less than for MGM, which accounted for 18 percent of total
film showing days.17
The hypothesis I test in this paper – that cinema ownership supported post-contractual
adjustments in film run lengths – applies solely to these “ordinary” cinemas. Because a movie
palace exhibited only the films of its affiliated studio, the costs and benefits of adjusting film
runs ex post were fully internalized. This was not the case with the ordinary cinemas – when an
ordinary cinema terminated the run of one producer’s film, it (generally) replaced it with a film
from a rival producer (as will be documented in Section IV). This created a problem which – I
propose – cinema ownership helped resolve.
III. THE PROBLEM
The salient contracting problem in motion picture distribution is the need to promote two
desirable yet conflicting objectives, commitment and flexibility. The schedule (including
number of prints to be made, number of screens to be booked, length of bookings, and so forth)
must be established before a film can be exhibited, but until the film is exhibited, demand for the
18For a discussion of the problem, see De Vany and Walls (1996). De Vany and Eckert(1991) posit that a number of allegedly anticompetitive vertical practices were intended to helpresolve this problem.
19In this simple scenario, it is not necessary to discuss whether these firms are price takersor instead have market power. As providers of differentiated goods, producers and exhibitorspresumably faced downward sloping demand curves.
9
film (and thus how many prints are needed, screens should be booked, etc.) is highly uncertain.18
As a result, it may be desirable to renegotiate the length of a film’s run ex post; i.e., after demand
for the film has been revealed. In a world of perfect information and zero transaction costs, the
particular form the renegotiation takes is unimportant – surplus will be maximized. But in the
real world of uncertainty, costly monitoring, and costly transacting, the form matters greatly.
Consider the following simple scenario. Producer A has two films available for
exhibition, with production costs sunk. Either of the films may be “unpopular” (make only a
little money) or “popular” (make lots of money), but ex ante, no one knows for sure. There is
also an exhibitor with one screen.19 Assume Producer A and the exhibitor have contracted to
show the first film for two weeks. At the end of the first week, it is apparent that the film is
“unpopular.” Producer A is willing to substitute the (potentially more popular) second film for
the first film – expected total surplus will increase; hence ex post adjustments can be in both
parties’ interests. Now suppose instead that A’s film will be replaced by a film from a rival
producer, Producer B. Ex post adjustments are no longer in A’s interest, unless A is
compensated. Of course, because the substitution of B’s film for A’s increases surplus,
compensation is feasible – A and B can reach a mutually beneficial agreement. But what form
should the agreement take?
20See, Baker, Gibbonns and Murphy (2002) for a formal analysis.
10
The question of form is essential, because the motion picture industry is characterized not
only by the pervasive ex ante uncertainty that makes ex post renegotiation of run lengths
desirable, but by information asymmetries between producers and exhibitors that complicate
attempts at ex post renegotiation. For example, exhibitors have better knowledge of local
demand conditions, not least because it is costly for a producer to determine whether cinemas are
reporting revenues honestly (furthermore, difficult-to-monitor exhibitor inputs such as
advertising and a clean theater affect local demand). On the producer’s side, certain inputs to
film performance (national advertising, film budget) may be difficult for exhibitors to observe, ex
ante or ex post (because so many unidentifiable factors contribute to a film’s performance). If
under the contract the cinema pays too little to switch films ex post (for example), it may switch
too often – expected revenue to the exhibitor may increase with switching, but not by enough to
cover switching costs (transport of prints, diversion of prints from elsewhere). Yet if the cinema
pays the full cost of ex post switching (or more), the producer’s ex ante incentive to invest in
complementary inputs may be reduced.
Klein and Leffler (1981) point out that such problems are especially difficult to resolve
when demand is uncertain ex ante – the bargaining threat points of the parties may move outside
the easily “self-enforcing” range. In this context, vertical integration can help support a self-
enforcing arrangement.20 Consider A’s integration into exhibition. First, the share of attendance
revenue captured by A’s theater provides A with additional incentive to let the poorly performing
runs of its films be abbreviated – when B’s more popular film replaces A’s, the rental revenue of
“A the producer” diminishes, but the attendance revenue of “A the exhibitor” rises. In other
21Similarly, De Vany and Eckert (1991) propose that a major advantage to verticalintegration was that the fully integrated firms were able to manage release dates and run lengthsso as to maximize joint surplus.
22The source is the Warner Brothers Archives at the University of Southern CaliforniaFilm School.
11
words, cinema ownership functions as de facto side payments, allowing vertically integrated
producers to share in the surplus generated by the replacement of their unpopular films.21
Second, cinema ownership reduces (or eliminates) the information asymmetries between
producers and exhibitors that can lead to inefficiently too many or too few replacements. Third,
if B integrates, as well, the showing of B’s film in A’s cinema (to replace A’s unpopular film)
could be made contingent on allowing A’s unpopular film to be replaced in other cinemas (I will
expand on this last point in Section D below).
Did cinema ownership support the ex post renegotiation of film runs? The question is
ultimately empirical – is there a relationship between run renegotiation and vertical integration?
I turn now to the empirical analysis.
IV. THE EVIDENCE
To investigate the relationship between integration and renegotiation, I employ a unique
sample of booking sheets from twenty-three Warner Brothers-owned cinemas in the state of
Wisconsin.22 What makes this data set unique – and allows my test – is that the sheets provide
information on the length of runs contracted for, as well as on the number of days actually played
(for several hundred films exhibited in nearly 2000 first-run screenings). Obtaining information
23By contrast, determining the number of days a film actually played at any given cinemais relatively unproblematic (although potentially time-consuming) – cinemas have longadvertised film showings in newspapers.
24Gil (2007) conducts an analysis of present-day screenings in Spanish cinemas, anddetermines booking lengths by interviewing company employees.
25For example, Warner Brothers’ executives, like executives from all the Paramountdefendants, testified that they negotiated with their own cinema circuits as if the circuits were“strangers,” and that many circuit officials, including theater managers, received salaries basedupon a percentage of the given theater’s profits (Conant 1960, 72). Consistently, RKO’s theatermanagers had the right to refuse to accept any RKO film that it considered “unsuitable” for localaudiences (Lewis 1933, 110).
26Furthermore, each agreement “covers all theaters owned or controlled by Warner BrosPictures.” See U.S. v. Paramount Pictures, Inc., 334 U.S. 131 (October 1947), “Appendix toBrief for the United States of America,” pp. 61-88. MGM, Fox, and RKO add the additionalstipulation that the agreement covers only first run exhibition unless otherwise noted. In anycase, I investigate first run showings only.
12
on how long a film was originally booked to play is extremely difficult (I have found no other
sources).23 As a result, I am able to conduct a test that would not be possible otherwise.24
At the same time, it is important to note the data set’s limitations. First, it encompasses
only cinemas owned by Warner Brothers. That said, as far as can be determined, Warner
Brothers was no different than any other film company (vertically integrated or independent)
when it came to the management of its cinemas, and the types of exhibition contracts its cinemas
signed with distributors.25 For example, the appendix to the brief in the Paramount case lists the
“Master Agreement” (i.e., the terms in and above those of the Standard Form Exhibition
Contract) for each and every Paramount defendant producer with each and every Paramount
defendant exhibition chain. The terms employed with Warner Brothers cinemas are essentially
identical to the terms employed with Fox, Paramount, Loew’s and RKO cinemas.26 A second,
more minor limitation of the data set is the relatively small number of cinemas in the sample –
27All of the Big Five integrated between the late teens and the late 1920s. One of theLittle Three – Universal – disintegrated (sold of its theater chain) after declaring bankruptcy inthe early 1930s.
28The film total includes second features when double features were shown, which wasmost of the time (in these cinemas and everywhere, the double feature was the norm). Thus,most of the screenings in the sample involved two films, although the same two films did notalways run concurrently (e.g., the run of one-half of the double feature might expire or bereplaced before the other).
29Because my sample consists only of first-run screenings, it is to be expected that itsaverage run would be longer than the average for all cinemas. The figure for all cinemas is takenfrom The 1940 Film Daily Year Book of Motion Pictures (cited in De Vany and Eckert 1991, 77).
13
more cinemas would presumably provide more information. However, the most relevant
variation resides the cross-section of film companies – specifically, whether a given
producer/distributor owns cinemas or not – and the composition of that cross-section is invariant
to the number of cinemas or films in the sample (and over the time period, as well).27 I will
discuss below what this implies for the estimation.
The sample consist of all films booked and screened by this group of cinemas during the
1937-8 film season. The 23 theaters collectively held 1950 screenings of 347 different films,
with screenings lasting from one to ten days.28 The fact that the average sample screening lasted
3.4 days provides further evidence that the sample is not atypical – the average screening in all
U.S. cinemas at about that time lasted 2.25 days.29 Each screening is an observation, so I have
1950 observations.
There are several features of the booking process worth noting. The first can be observed
in Table 3. The vast majority of screenings – 1556 out of 1950 – involved films that were
booked for a range of days (one-to-three days, two-to-four days), rather than for a fixed number
of days. Booking films for a range of days was a logical response to ex ante uncertainty about
30In order to determine the relationship between running time and booked run, I examinedthree frequently-employed contract lengths – 2-4 days, 3-4 days, and 4 days – in the subset ofcinemas that booked at least ten runs of each of these lengths. Films booked for 4 days were 91minutes long on average, versus 79 minutes for films booked for 3-4 days, versus 71 minuteslong for films booked for 2-4 days. Only 20 percent of the shorter films starred a contract player(i.e., an actor under long-term contract with the studio – a status give mostly to A-stars), whilenearly all the 4-day films starred at least one contract player.
31In addition, 18 percent played for longer than the contract, but this was unlikely to havebeen objectionable to the film’s producer.
14
quality – cinemas were thus contractually permitted to adjust run lengths (to a degree) after
observing film performance. Table 3 also illustrates a second notable feature of the booking
process: each cinema booked films for many different periods of time (anywhere from one to
seven days and everything in between). The average cinema in the sample booked films for 4.4
different time periods (6.8 when weighted by number of screenings). It appears that (not
surprisingly) cinemas booked films expected ex ante to perform better for longer runs – the more
stars a film featured and the longer its running time (a proxy for budget), the longer the booked
run.30 In other words, cinemas did not simply follow a mechanistic change policy (e.g., one film
per week for cinemas that changed films weekly), but attempted to set run length in accord with
ex ante expectations about film quality.
Yet foresight being imperfect and despite the contractually permitted ranges, there would
have been times when replacing a film before the contract permitted would have increased
attendance revenues. And indeed, as Table 4 shows, early terminations were relatively common
– 13 percent of screenings were ended before the minimum period specified in the contract.31
What happened when a film’s run was terminated before the minimum time specified in
contract? There are several possibilities. First, prematurely terminated films may have been
32See any issue of the Film Daily Yearbook during the 1930s for a copy of the StandardForm Exhibition Contract. I cannot observe the contracts producers used with these particularcinemas (I have only the booking sheets), but the Standard Form Exhibition Contract was widelyemployed, and formed the basis for exhibition contracts used by these producers elsewhere (seeU.S. v. Paramount Pictures, Inc., 334 U.S. 131, “Appendix to Brief for the United States ofAmerica,” pp. 61-88.) I have obtained copies of exhibition contracts employed by WarnerBrothers and RKO when booking films in other cinemas – they correspond closely to thestandard form contract.
15
replaced by other (presumptively more successful) films released by the same producer, so that
the costs and benefits of replacement were fully internalized (as was the case with the movie
palaces). The data shown in Table 5 rule out this first possibility. The highlighted diagonal
indicates the proportion of early terminations of a given producer’s films followed by
replacement by a film from the same producer. As can be seen, replacement by a film from a
different studio was much more common. Given there are eight producers (and ignoring the fact
that somewhat different numbers of films were booked from different producers), pure random
chance would indicate that 12.5 percent of the time, a terminated film will be followed by a film
from the same producer. The average in the sample is 15 percent, falling to 13 percent when
weighted by number of terminations. Terminated films were not more likely to be replaced by
films from the same producers than from other producers.
Alternatively, perhaps the cinema replacing the film before its contractually-specified
period merely paid the penalty specified in the Standard Form Exhibition Contract – 65 percent
of the rentals earned on the last day of showing before termination.32 Simple calculations suggest
that, for this sample of cinemas, at least, this would not have been good strategy – early
termination increased gross attendance revenues by 24 percent on average, but with the penalty
33I analyzed the sub-set of films that were booked for the two-to-three day range (i.e., theexhibitor can send it back after two days or to keep it for a third) and canceled after the first day(so that I can observe how the film performed in its last screening; i.e., the first day) with thefilms that replaced them. I found that about two-thirds of replacements were efficient in thesense of generating more revenue than the old film on the day of replacement, but that only aboutforty percent of replacements were profitable once the penalty is taken into account. In dollarterms, replacement increased gross attendance receipts on the day of replacement by 17 percentof average daily revenues), but led to an average net loss to the cinema equal to 6 percent ofaverage daily revenues.
16
subtracted, had a negative expected value for the cinema.33 The fact that attendance revenue
increased on average post-termination is reassuring (suggesting the replacements may have been
efficient) but the relatively large number of early terminations – 257 out of 1950 screenings – is
difficult to reconcile with a negative expected value for the cinema. This suggests that the early
termination penalty was not widely enforced. I will return to this possibility in Section D below.
Finally, there is the hypothesis I explore here – cinema-owning film companies did not
penalize early termination because cinema ownership allowed them to capture some of the gains
resulting from the replacement of a less popular film by a more popular film. If this hypothesis is
correct, early terminations – call them “abbreviations” – should be more common for the films of
the cinema-owning Big Five than for the films of the cinema-less Little Three.
A. Direct Tests
I start with a simple examination of mean values. As can be seen in Table 5, 16 percent
of the screenings of Big Five films were taken off the screen earlier than specified in the contract,
versus only 6 percent of the films of the Little Three. Furthermore, Warner Brothers films do not
appear to have been treated differently than those of other producers, despite the Warner
Brothers’ ownership of the cinemas.
To test more systematically, I will start with a probit analysis. My model is:

34The correlation between the two variables (days contracted and revenue per day) is 0.62. Including higher order terms (i.e., days contracted squared) has little effect on the coefficients ofinterest.
35Appendix A shows the data by cinema.
17
1) Abbreviateig = " + Integrateg$+Zig( + ,ig
where Abbreviateig is whether the showing has been abbreviated (ended before permitted under
the contract), Integrateg is whether the producer owns cinemas, and Z is a matrix of controls.
The subscript “i” signifies variation at the level of the individual observation (in this case, the
screening), and subscript “g” signifies variation at the level of the group (in this case, the film
company). My dependent variable takes on the values
Abbreviateig ={1 if the screening period was abbreviated
0 otherwise
For the probit analysis, I employ several specifications. First, I include the “integrated” dummy
variable by itself. Second, I control for the expected popularity of the film, using an ex ante
measure and an ex post measure: number of days contracted for, and actual attendance revenue
earned per day.34 Third, I include dummy variables for each of the 23 cinemas and seasonal
quarter dummy variables (some cinemas shut down temporarily during the summer).
Table 6 presents descriptive statistics. Films released by the cinema-owning Big Five –
represented by the “integrated” variable – account for about three-quarters of all screenings (the
other quarter being films released by the Little Three). The average contract was for 3.36 days,
and the average film ran for 3.39 days and generated about $1400, or $360 per day. The numbers
vary across theaters – different theaters booked films for different periods, and some of the
theaters only rarely exhibited films on first-run.35
36Including a Warner Brothers dummy in the probit analysis reduces the size of thecoefficient on “integrated” slightly (0.09 rather than 0.10 or 0.06 rather than 0.07), notsurprisingly given that it removes from the “integrated” coefficient the effect of one of the fivefully integrated firms. (The “integrated” coefficients nonetheless remain statistically significantat less than one percent.)
18
The left-hand side of Table 7 presents the results of the probit regressions (marginal
effects shown). Consistent with the hypothesis, the point estimates on the “integrated” variable
are positive, statistically significant at less than one percent, and of such magnitude as to suggest
screenings of films by the cinema-owning Big Five were seven-to-ten percent more likely to be
abbreviated.36
In the data set, there are no changes over time in the cinema-owning status of any of the
Paramount defendants – the measure of interest, “integrated,” varies only across the eight
producer/distributors. Moulton (1990) shows that models combining individual-level data (such
as “abbreviated,” which varies across screenings) with grouped data (such as “integrated,” which
varies only across film companies) will bias downwards the standard errors of the coefficients if
the group-specific effect is not taken into account. Thus, although the point estimates presented
on the left-hand side of Table 7 are unbiased and consistent, the confidence interval implied by
the standard errors is too narrow.
To illustrate, I will re-write equation 1, decomposing the residual into two parts, a group-
specific residual, and an idiosyncratic component:
1') Abbreviateig = " + Integrateg$+Zig( + :g + Lig
A common way to account for the group-specific residual is to cluster standard errors at the
group level (e.g., Wooldridge 2003). However, Donald and Lang (2007) point out that such
clustering is justified only when the number of groups is “large” relative to the number of
37When this condition does not hold, the effect of clustering on the standard errors of thecoefficients is simply not well-understood – the asymptotic properties are generally unknown. Donald and Lang (2007, 299) state that, “the Cluster approach may be quite unreliable except inthe case when there are many groups.” In my analysis, clustering by film company has very littleeffect on the standard errors (results available from the author).
38The “between estimator” uses only the between group – i.e., cross-sectional –information contained in a panel data set (in contrast to the within-group, or time series,variation). Absent within-group-varying explanatory variables (such as contracted days andrevenue per day), Donald and Lang’s two-step method, which I employ below, produces the“between-groups” estimator (Donald and Lang 2007, 22).
39I use Stata for my estimates. If I instead estimate a probit model on company-specificaverages (i.e., one observation per company), I obtain qualitatively equivalent results.
19
observations per group.37 I have eight groups with roughly 250 observations each, rendering
clustering inappropriate. Instead, I employ a “between-group” estimator.38 I use a linear
probability model, because a between-groups estimator cannot be estimated using probit
analysis.39 One may think of this latter approach as complementing the probit results shown to
the left – an “upper bound” to the probit’s “lower bound” on the value of the standard errors.
The results are shown in the middle columns of Table 7. The marginal effects implied by
the point estimates are roughly the same (not surprisingly) – the coefficients continue to imply
that cinema ownership is associated with a nine-to-ten percent increase in the likelihood of a film
run being abbreviated. The standard errors on the “integrated” coefficients are now substantially
larger, reflecting the fact that the estimation accounts for the presence of common group effects.
Nonetheless, the coefficient estimates remain statistically significant at the five percent level.
An alternative means of accounting for group effects is the two-step approach proposed
by Donald and Lang (2007). The first step is to estimate by OLS:
Abbreviateig = dg + Zig( + ,ig
40By definition, the fitted values of d equal^ – – dg = Aig - Zig(
where – – Aig , Zig
are the average values of A and Z in the sample for each producer.
41A fourth approach is a minimum distance estimator, which produces qualitativelyequivalent results (not shown). In the first step, I estimate for each different producer a probit(using “abbreviated”) on the two film quality variables and the cinema and time dummyvariables. Then with the eight intercepts, I estimate a weighted least squares (minimum distance)specification, with the weights equal to the inverse of the sampling variances. The differencebetween this approach and Donald and Lang’s is that the resulting t-statistics are distributedapproximately standard normal. It also allows a test of overidentifying restrictions (six in thiscase), and of whether the restriction that producers only differ by "integrated" status isappropriate. Finally, the minimum distance approach does not require normality of the producereffects. I thank Jeff Wooldridge for this suggestion.
20
where dg are dummy variables for each producer.40 The second step estimates the effect of
integration as follows:
^ dg = a + Ig$ + :g
Donald and Lang demonstrate that under the assumption that the error terms "g and ,ig are
normally distributed with 0 mean, constant variance, and 0 covariance for all i and g, the test
statistics for this second stage estimator will be t-distributed, with g-2 degrees of freedom.
The results of this third approach are shown in the far right-hand column in Table 7. The
point estimate implies that integration is associated with an 8 percent greater likelihood of
abbreviation. Assuming that the test statistic has a t-distribution with 6 degrees of freedom, the
coefficient is significant at better than the five percent level.41
In short, in all three estimations, the results are consistent with the hypothesis that cinema
ownership promotes post-contractual changes in run lengths.

42Cinemas would contract for a slate of films at the start of the film season, but would notagree the actual dates until several weeks before a film’s first-run release – most films had notbeen finished when the original exhibition contract was signed (many had not even begunfilming, and were identified simply as “a Clark Gable” picture, or a “Lana Turner” picture). Similar practices exist today – agreements to show films are made well in advance of the film’srelease, and the specific date is set close to the release time. See Fellman (2004).
21
B. Abbreviations and Film Length
This paper proposes that vertical integration into exhibition was driven by a lack of
information – not enough was known about films being booked to set the run length accurately.
As a result, ex post adjustments in run length enhanced efficiency, by better matching run length
and revealed demand. An indirect test of this hypothesis is to examine whether abbreviations
were fewer where the information problem was less severe. This is only a partial test: If I find
this was so, it does not speak to the rationale for vertical integration, per se. However, if I find
no relationship between the severity of the information problems and abbreviations, it would
suggest the argument underlying this paper’s hypothesis may not be correct (or is incomplete).
To define a set of films for which the information problem was less severe, I make use of
the fact that the “movie palaces” discussed above exhibited films prior to the first-run during
what was called a “pre-release” (pre-release attendance results were tracked weekly by Variety
for the benefit of cinemas). Only a subset of films were exhibited in pre-release – the most
expensive, star-filled productions. Pre-releases lasted several weeks, and the preliminary results,
at least, would have pre-dated most run bookings.42 I do not know whether pre-release
information was available by the time any given film entered its first-run. I also do not know
precisely which films were exhibited in pre-release. However, I do know that only the most
expensive films were shown in pre-release. And although I do not have the budgets for (all) the
43Using budget data from the William Schaeffer ledger (which lists negative costs for allWarner Brothers feature films produced from 1922 through 1960) and film length from theInternet Movie Data Base, I find that, for the set of films in my sample, the correlation is betweenfilm cost and film length is 0.83. See Glancy (1995) for a discussion of the data in the Schaefferledger.
44The last group includes such then (and still) popular films as The Adventures of RobinHood with Errol Flynn, Jezebel with Bette Davis, and Stella Dallas with Barbara Stanwyck.
45Including minutes in the regressions shown in Table 8 has no effect on the coefficienton integration (the correlation between integration and minutes is -0.08), but produces astatistically significant coefficient on minutes, of such magnitude as to imply that each additionalminute in length is associated with a decline of 0.3 percent in the likelihood a run is abbreviated.
22
films in my sample, I am able to obtain film lengths (in minutes), and film length and budget
were highly correlated.43
Table 8 breaks down the sample by the running time of the film screened. As the top half
of the table shows, roughly the same proportion of abbreviations for all films of less than 90
minutes – 14-16 percent. Such shorter films were very unlikely to have been shown in pre-
release. The proportion then falls to less than 10 percent for films of 90-100 minutes in length,
and to 5 percent for films of more than 100 minutes.44 Assuming that film length is a reasonable
proxy for budget, these results are consistent with the argument underlying this paper’s
hypothesis. Where the information problems were less severe (i.e., where the sample of films
consists of those more likely to have been screened before the first-run showing was booked),
there were fewer abbreviations.45
C. The Mechanism
There are two, non-mutually exclusive, ways in which cinema ownership could affect ex
post run length adjustments: 1) directly, by promoting more renegotiations, or 2) indirectly, by
46This oversimplifies – A-films included both big budget extravaganza and middle-of-the-road potboiler, while B-movies included well-loved series (e.g., Sherlock Holmes, Andy Hardy,Charlie Chan) as well as stock Westerns and gangster films.
47Low budget films have always existed, but the heyday of the B-film began with theemergence of the double feature as a standard mode of exhibition in the early 1930s. The doublefeature was a product of the Great Depression, the 1931 creation of a New England exhibitor as away of attracting audiences during the early part of the Great Depression. Exhibitors tried manysuch fan-attractors, including raffles and crockery give-aways, but double features proved themost durable, remaining the norm in most cinemas through the 1940s. See Izod (1988, 98).
48See Izod (1988, 99). See Hanssen (2002) for an investigation of the rationale for flatfees versus revenue sharing in movie exhibition contracts.
23
leading to specialization in types of film more likely to require renegotiation. Which effect
dominated in the Hollywood Studio Era?
There were two broad film types during the Hollywood studio era: A-films and B-films.46
A-films had relatively high budgets, starred well-known actors, and were long in duration; B-
films had relatively low budgets, lesser/unknown actors, and short running times. B-films served
primarily as the second feature in double bills, and as the occasional lead film in a subsequent
run.47 B-films also tended to be priced differently, being leased to cinemas for flat fees rather
than on a revenue sharing basis.48 Although all of the eight Paramount defendants – whether
vertically integrated into exhibition or not – produced both A-films and B-films, a greater
proportion of the Big Five’s production was devoted to A-films, while a larger proportion of the
Little Three’s – more specifically, of Columbia’s and Universal’s – production was devoted to
B-films. This is evident in the data set, as summarized in Table 9. Compared to the fully
integrated Big Five, Columbia and Universal had substantially smaller proportions of their films
49Balio (1990, 4) writes, “Although in total their production represented at most 50percent of the industry’s annual output [of feature films], about three-quarters of the class-Afeatures, the ones that played in the best theaters and received top billing, were made anddistributed by the Big Five. . . . Universal and Columbia . . . were useful to the majors insupplying low-cost pictures for frequent program changes and double features.” (Although thiswould not have been true of United Artists, which released A-films exclusively during thisperiod, abbreviations were no more common among UA films then among Columbia films.)
50While the majority of first-run cinemas were owned by the major film companies, asubstantial minority – circa 30 percent – were owned by independent chains. In these instances,flexibility was promoted by contractual clauses. (Interestingly, these clauses became more fullydeveloped after the Paramount court mandated divestiture – see next section.) Specifically,“overage” and “underage” provisions allowed exhibitors to charge deficits in playing time in one
24
booked on a percentage basis, and substantially larger proportions of their films ran for less than
70 minutes.49
But was this specialization congruent with the information problem? As also can be seen
in Table 9 (and on the bottom of Table 8), the Big Five collectively produced more short
(ostensibly B) films in total than Universal and Columbia, who together accounted for only 36
percent of the total of films of less than 70 minutes. And as the top of Table 8 shows (and was
discussed above), films under 70 minutes in length were no less likely to have their runs
abbreviated than longer films. When I estimate the association between run abbreviation and
integration leaving the longest (and thus least likely to be abbreviated films) out of the sample,
the association strengthens – films released by integrated producers are 10 to 13 percent more
likely to be abbreviated. (Results available upon request.)
In short, it appears that the relationship between abbreviation and integration did not
result from the fact that the Big Five and the Little Three (or at least Columbia and Universal)
made different types of films, but rather from the fact that otherwise similar films released by the
Big Five were more frequently abbreviated.50

theater against another (De Vany and Eckert 1991, 80). For example, if one of a circuit’scinemas abbreviated a Fox motion picture and a second of its cinema extended its showing of a(presumably different) Fox film by the same number of days, the result was a wash. Althoughthis may not have been as efficient (from the perspective of maximizing total exhibitionrevenues) as unconstrained replacement (the days contractually allocated to each company’sfilms had to remain constant even if a particular company was having an off-year), it did at leastreduce the magnitude of the problem.
51See also, e.g., Klein (1996), MacLeod and Malcomson (1989), and Telser (1981).
25
D. A Self-Enforcing Agreement?
Baker, Gibbons, and Murphy (2002, 40) write, “relational contracts cannot be enforced by
a third party and so must be self-enforcing.”51 They develop a model showing how vertical
integration can support a relational contract. Consider the relational contract I propose for the
motion picture industry. If ex ante contracted run lengths reflected unbiased expectations about
film performance, the hazard rate for terminations should be roughly the same across the Big
Five producers (ignoring differences in number and nature of films produced). If, in addition,
each of the Big Five generated the same amount of revenues from their theater chains, roughly
equal abbreviation rates would imply roughly equal abbreviation counts. And with roughly equal
abbreviation counts, it would not benefit any individual firm to cheat on the implicit arrangement
to allow unpenalized abbreviations. If a firm insisted that, to the contrary, it be paid the
contractually-required termination penalty, other firms could retaliate by following suit, netting
out to a transfer of zero. If instead a firm attempted to cheat by abbreviating film runs
opportunistically (in response to a bribe, for example), the cheating would be revealed over time
by a higher abbreviation count, and other firms could then impose the contractually-specified
termination fee. An implication is that a prohibitively high early termination penalty may have
been optimal, serving as an effective deterrent to support the implicit contract.
52The revenues are only those from films released by the eight Paramount defendants(which would have comprised the vast majority of total cinema revenues, in any case).
53According to a 1947 article in Fortune magazine (June 1947, p. 92), Paramount ownedstakes of greater than 95 percent in 155 cinemas, stakes of 50-95 percent in 755 cinemas, stakesof 25-50 percent in 275 cinemas, and stakes of less than 25 percent in 25 cinemas. (Note thatthis adds up to a different number of cinemas than listed in Table 1 – getting precise totals wasdifficult, especially given that sales and purchases of individual cinemas were common). Takingthe midpoint of each range and weighting by number of cinemas in each category produces anoverall average ownership stake of about 66 percent. Partial ownership was employed much lessfrequently by the Big Five other firms.
26
My sample reveals a number of consistent details. First the majority of early terminations
by the Warner Brothers cinemas in the sample consisted of films released by other members of
the Big Five, rather than Warner Brothers’ own films – see Table 5. This suggests some sort of
arrangement, in which only (or largely) members of the Big Five participated (not members of
the Little Three). Second, Big Five firms generated roughly equal revenues in their theater
chains (despite differences in cinema numbers, because of corresponding differences in the size
and location of owned-cinemas). Table 10 presents the percentage of 1943-4 rental revenues
generated by each chain – the percentages do not differ substantially across firms, with the
exception of RKO, which was slowly going bankrupt.52 (The Paramount number is overstated
because Paramount’s partial ownership of the majority of its cinemas is not taken into account).53
Third, the 65 percent early termination penalty contained in the Standard Form Exhibition
Contract may indeed have been “prohibitively high” (as discussed above, the majority of early
terminations would have generated negative returns for the terminating cinemas if the penalty
was enforced). Finally, although the number and proportions of abbreviations differed across
members of the Big Five – see Table 5 – so did the mix of films. As discussed in Section B
above, the best A-films would have been shown in pre-releases at movie palaces, reducing the
54The Supreme Court had concluded that integration into exhibition was not illegal per se,but that, depending upon its purpose and the market power that resulted, it might be so, and thatthis was a matter for the District Court to decide. The Supreme Court chose to reject competitivefilm-by-film bidding – the District Court’s proposed remedy – on the grounds such a system waslikely to work to the benefit of those with the “longest purse” (i.e., the defendants).
27
information problem that made ex post adjustments in run length optimal. Correspondingly,
longer A-films were less likely to be abbreviated – see Table 8. MGM released by far the largest
proportion of A-films (see Table 9), and also had the smallest percentage of films abbreviated
(see Table 5). Fox and Paramount fell in the middle in both respects, while RKO and Warner
Brothers released the smallest proportion (among the Big Five) of A-films and had the largest
proportions of abbreviations. The simple correlation between proportion A-films and percent
abbreviations for these five companies is -0.90.
V. PARAMOUNT’S AFTERMATH
The New York District Court responsible for the Paramount case issued a ruling in
December of 1946 banning a number of vertical practices and limiting expansion of theater
holdings. However, the Court did not require divestiture, noting that the defendants owned less
than 17 percent of U.S. theaters in total. On appeal, the U.S. Supreme Court affirmed most
District Court’s judgements, but directed the Court to reconsider divestiture of theater chains,
ruling that first-run theaters (not total theaters) was the relevant market.54 The District Court
handed down its final decision on July 25, 1949, concluding that the divorcement of production
and exhibition was necessary. In 1950, the Paramount defendants signed consent decrees, under
55Even before the District Court issued its opinion, Paramount and RKO had agreed todivest their theaters.
56One of the few studies purporting to show an actual effect from the Paramount decisionis De Vany and McMillan (2004), which finds that the share prices of the integrated Paramountdefendants fell by 4 to 12 percent when the Supreme Court handed down its 1948 decision, andthat the share prices of both the non-integrated defendants and independent producers who werenot defendants fell by just as much. The authors conclude that this supports the hypothesis thatthe disputed vertical practices were not anticompetitive. More typical are Crandall (1975) andConant (1981), who harbor no doubts that the Paramount defendants were behavinganticompetitively (on page 54, Crandall writes, “A more successful cartel could hardly beimagined”), yet acknowledge nonetheless (in a somewhat puzzled fashion) that the Paramount
28
the terms of which they agreed (effective immediately) to begin the process of divestiture.55 By
February 1953, all but Loew’s had formally divested (Loew’s continued to operate its theaters on
an arm’s length basis until 1959 – see Crandall 1975, 53).
Examining the period following the Paramount decrees would appear the ideal test of this
paper’s hypothesis. It is, in fact, problematic. First, a variety of vertical practices were banned,
making it difficult to determine what changes (if any) followed from vertical dis-integration
specifically. Second, the Paramount decision was handed down at a time of tremendous social
and economic change – service men and women were returning home from war, the baby boom
had commenced, the suburbs were growing rapidly, and (very importantly) television was on the
rise. The motion picture industry changed dramatically, too. As Balio (1990, 3) writes,
After World War II, things were never the same for the motion picture industry. Beginning in 1947, Hollywood entered a recession that lasted for ten years; movieattendance dropped by half, four thousand theaters closed their doors, and profitsplummeted. In foreign markets, governments erected trade barriers to limit theimportation of motion pictures. Thus, instead of enjoying sustained prosperityafter the war, which many had predicted, Hollywood retrenched. Production wasseverely cut back; ‘B’ pictures, shorts, cartoons, and newsreels were dropped, andthe studios concentrated their efforts on fewer and fewer ‘A’ pictures. The studiosystem went by the board as companies disposed of their back lots, film libraries,and other assets and pared producers, stars, and directors from their payrolls.56

consent decree appears to have had little effect on the industry.
57Crandall (1975, 52) reviews the evidence for the post-Paramount period and concludes“Distributors [principally, the former Paramount defendants] still control the number ofproductions and often exert an influence over the artistic details since it is they who underwritethe pictures. The distributors provide financing for the productions in return for the right todistribute the finished product. Similarly, Balio (1990, 10) writes, “By 1970, the majorsfunctioned essentially as bankers supplying financing and landlords renting studio space. Distribution now became the name of the game . . . but as financiers, the studios were able toretain ultimate discretionary power.”
58See, e.g., De Vany and Eckert (1991) and De Vany and Walls (1996) for more detail onthese practices. For a copy of a 1980 exhibition contract, see May (1983).
29
For the most part, these changes did not appear to hurt the Paramount defendants, who
maintained their dominant position in the industry, now as “distributors” rather than
“producer/distributors,” albeit distributors who financed film production.57 But in the absence of
cinema ownership, how were post contract adjustments of run lengths dealt with? The answer is
that exhibition contracts changed in fundamental ways that made such ex post adjustments less
costly.58
The pre-Paramount exhibition contracts had specified how long a run would last and
included a penalty clause for early termination, but nothing else – ex post adjustments (of which,
as we have seen, there were many) were handled outside the formal framework of the contract.
The post-Paramount exhibition contracts also specified a basic run length and a penalty for early
termination, but for the first time included several clauses that formally linked the duration of the
run to the performance of the film. Foremost was the “holdover” clause, which automatically
extended the length of a screening if weekly attendance revenues exceeded a specified target
(which differed by cinema). Given the existence of the holdover clause, it became less important
to agree a specific duration for a run (recall that in the pre-Paramount days, cinemas booked

59Today, the period is three weeks for cinemas that open as part of the national run, whichis most all of them.
60By 1955, the number of four-wall cinemas had fallen by nearly 3000 units, 17 percent ofthe 1948 total, and by 1960, by more than 5000 units, 30 percent of the 1948 total. (Four-wallcinema numbers actually peaked in 1945, and declined subsequently.) Some of the fall wasoffset by the substantial rise in drive-in theaters that occurred over the same period. Evencounting drive-ins, the total number of cinemas fell by nearly 10 percent between 1948 and 1960. See Steinberg (1980, 40-1).
61According to Steinberg (1980, 39), the first multiplex was built in 1963 in Kansas City,and by the late 1970s accounted for about 25 percent of all screens. In addition, ex postadjustments in other dimensions increased. For example, see Filson, Switzer, and Besocke(2005) for a discussion of ex post adjustments in sharing percentages, which tend to favorexhibitors when films do more poorly then expected, and favor distributors when films do betterthan expected.
30
films for varying periods, depending upon how the film was expected to perform), and an initial
run of one week became the norm (regardless of the size, location, or priority of the cinema).59 In
addition, the number of screens on which a film was shown could be more quickly adjusted,
because by the mid-1950s, the elaborate system of runs had shrunk to a first-run and a
subsequent-run (smaller cinemas either upgraded or disappeared).60 Thus, film roll-outs could be
gradual – commencing in large cities and expanding (or not) as the popularity of the film was
revealed. It also became common for a distributor to allow a cinema to split scheduled screening
times between motion pictures (the alternate feature being supplied by the same distributor) if an
originally-booked film performed poorly. The appearance of the multiplex (multiple screen
cinema) in the early-1960s furthered the process, by allowing cinemas to open films on several
screens (or in larger screening rooms) and downgrade to fewer screens (or smaller screening
rooms) as dictated by consumer demand.61
62For example, from the mid-1980s until 2002, the cinema chain Loews and filmproducer/distributor TriStar Pictures shared common ownership (and, after purchase by Sony,were linked with Columbia Pictures, too). However, in 2002 the Loews chain was spun off toprivate investors.
31
In an earlier paper (Hanssen 2000), I concluded that the booking practices that developed
after the Paramount decrees managed largely to replicate the outcome of block-booking,
although presumably at higher cost. The same appears to have occurred with respect to
managing the ex post revelation of film quality. Whether these later practices were as effective
as cinema ownership cannot be determined – certainly, film companies fought the forced
divestiture of their theater chains vigorously. That said, the film industry has changed
profoundly since 1948. Several firms reintegrated exhibition with production/distribution (a
legal stricture binds only a sub-set of the Paramount defendants), but have since dis-integrated
voluntarily.62 No fully integrated company exists today.
VI. CONCLUSION
During the Hollywood studio era, the largest motion picture producers owned cinemas.
In this paper, I have sought to explain why. Investigating a unique sample of cinema booking
sheets from the 1930s, I find evidence supportive of the hypothesis that integration supported ex
post changes in film run lengths, a desirable but potentially difficult-to-implement feature of
movie contracts. My findings for this sample of Warner Brothers theaters from the 1930s are
consistent with those of Gil (2007), who analyzes today’s Spanish film industry. However, while
Gil finds that part of the relationship between cinema ownership and renegotiation is induced by
the type of films vertically integrated firms choose to distribute (specifically, higher variance

32
films), I find little evidence of selection in film types, but rather conclude that cinema ownership
helped maintain a relational/implicit contract.
33
BIBLIOGRAPHY
Balio, Tino S. 1985. “Struggles for Control, 1908-1930”, in Tino S. Balio, ed., The AmericanFilm Industry, University of Wisconsin Press: Madison, WI
Baker, George, Robert Gibbons, and Kevin J. Murphy. 2002. “Relational Contracts and theTheory of the Firm”, Quarterly Journal of Economics, 117: 39-84
Balio, Tino S. 1990. “Introduction” in Balio, T. ed., Hollywood in the Age of Television,Boston: Unwin Hyman 3-40
Bull, Clive. 1987. “The Existence of Self-Enforcing Implicit Contracts”, Quarterly Journal ofEconomics, 102: 147-159
Cassady, Ralph jr. 1958. “The Impact of the Paramount Decision on Motion PictureDistribution and Price Making”, 31 Southern California Law Review 150-181
Chipty, Tasneem. 2001. “Vertical Integration, Market Foreclosure, and Consumer Welfare inthe Cable Television Industry”, American Economic Review, 91: 428-453
Conant, Michael. 1960. Antitrust in the Motion Picture Industry, University of California Press: Berkeley
Conant, Michael. 1981. “The Paramount Decrees Reconsidered”, Law and ContemporaryProblems, 44: 79-107
Crandall, Robert W. 1975. “The Postwar Performance of the Motion Picture Industry”, AntitrustBulletin, 20: 49
De Vany, Arthur, and Ross D. Eckert. 1991. “Motion Picture Antitrust: The Paramount CasesRevisited”, Research in Law and Economics, 14: 51-112
De Vany, Arthur, and W. Daniel Walls. 1996. “Bose-Einstein Dynamics and AdaptiveContracting in the Motion Picture Industry”, The Economic Journal, 106: 1493-1514
De Vany, Arthur, and Henry McMillan. 2004. “Was the Antitrust Action that Broke Up theMovie Studios Good for the Movies? Evidence from the Stock Market”, American Law andEconomics Review, 6: 135-153
Donald, Stephen G., and Kevin Lang. 2007. “Inference with Difference in Differences andOther Panel Data”, Review of Economics and Statistics, 89: 221-233
34
Felman, Daniel R. 2004. “Theatrical Distribution”, in Squires, Jason E., ed., The MovieBusiness Book (third edition)
Filson, Darren. 2005. “Dynamic Common Agency and Investment: The Economics of MovieDistribution”, Economic Inquiry, 43: 773-784
Filson, Darren, David Switzer, and Portia Besocke. 2005. “At the Movies: The Economics ofExhibition Contracts”, Economic Inquiry, 43: 354-369
Gil, Ricard. 2007. “‘Make or Buy in Movies’: Integration and Ex Post Renegotiation”,International Journal of Industrial Organization, 25: 643-655
Glancy, H. Mark. 1995. “Warner Bros Film Grosses, 1921-51: The William Schaefer Ledger.”Historical Journal of Film, Radio, and Television, 15: 55-73.
Hanssen, F. Andrew. 2000. “The Block Booking of Films: A Re-Examination”, Journal of Lawand Economics, 18: 297-328
Hanssen, F. Andrew. 2002. “Revenue-Sharing in Movie Exhibition and the Arrival of Sound”,Economic Inquiry, 40: 380-402
Huettig, Mae D. 1944. Economic Control of the Motion Picture Industry, University ofPennsylvania Press: Philadelphia
Kenney, Roy W., and Benjamin Klein. 1983. “The Economics of Block Booking”, Journal ofLaw and Economics, 26: 497-540
Klein, Benjamin. 1996. “Why Hold-ups Occur: The Self-Enforcing Range of ContractualRelationships”, Economic Inquiry, 34: 444-463
Klein, Benjamin and Keith B. Leffler. 1981. “The Role of Market Forces in AssuringContractual Performance”, Journal of Political Economy, 89: 615-641
Lewis, Howard T. 1933. The Motion Picture Industry, D. Van Nostrand Co., Inc.: New York
MacLeod, W. Bentley, and James M. Malcomson. 1989. “Implicit Contracts, IncentiveCompatibility, and Voluntary Unemployment”, Econometrica, 57: 447-480
May, Richard P. 1983. “Sample Exhibition Contract”, in Squires, Jason E., ed., The MovieBusiness Book (first edition)
Moulton, Brent R. 1990. “An Illustration of a Pitfall in Estimating the Effects of AggregateVariables on Micro Units”, Review of Economics and Statistics, 72: 334-338
35
Orbach, Barak Y., and Liran Einav. forthcoming. “Uniform Prices for Differentiated Goods:The Case of the Movie Theater Industry”, International Review of Law and Economics
Ordover, Janusz, Garth Saloner, and Steven C. Salop. 1990. “Equilibrium Market Foeclosure”,American Economic Review, 80: 127-142
Raskovich, Alexander. 2003. “Pivotal Buyers and Bargaining Power”, Journal of IndustrialEconomics, 51: 405-420.
Riordan, Michael H. 1998. “Anticompetitive Vertical Integration by a Dominant Firm”.American Economic Review, 88: 1232-1248
Salinger, Michael A. 1988. “Vertical Mergers and Market Foreclosure” Quarterly Journal ofEconomics, 77: 345-356
Schatz, Thomas. 1988. The Genius of the System: Hollywood Filmmaking in the Studio Era,Holt and Company: New York
Simon, Herbert A. 1951. “A Formal Theory Model of the Employment Relationship”,Econometrica, 19: 293-305
Steinberg, Cobbett S. 1980. Film Facts, Facts on File, Inc: New York.
Telser, Lester G. 1981. “A Theory of Self-Enforcing Agreements”, Journal of Business, 53: 27-44
Waterman, David and Andrew A. Weiss. 1996. “The Effects of Vertical Integration BetweenCable Television Systems and Pay Cable Networks”, Journal of Econometrics, 72: 357-395
Williamson, Oliver E. 1985. The Economic Institutions of Capitalism, Free Press: New York
Williamson, Oliver E. 1975. Markets and Hierarchies: Analysis and Antitrust Implications,Free Press: New York

36
TABLE 1: CINEMAS OWNED BY THE BIG FIVE
Company Totalcinemas
Palaces* Palaces**
20th Century Fox 575 19 35
MGM 143 20 29
Paramount 1165 40 29
RKO 105 19 23
Warner Brothers 443 20 19
Total 2431 118 135
Palaces* = “Metropolitan deluxe theaters, as listed in the DOJ complaint of 1938, pp 63-67
Palaces** = cinemas tracked by “Variety” in January 1940.
37
TABLE 2: WARNER BROTHERS-OWNED THEATERS (1937-8 film season)
Producer No. ofscreenings
No. of films Days played Percent of totaldays
Columbia 224 40 1531 10%
20th Century Fox 294 55 2367 16%
MGM 319 45 2659 18%
Paramount 337 52 2382 16%
RKO 245 46 1872 12%
United Artists 87 15 769 5%
Universal 180 38 1119 7%
Warner Brothers 264 56 2346 16%
Total 1950 347 15045 100%
Based on 23 Wisconsin-based cinemas that showed first-run films. Source: Warner BrothersArchives, University of Southern California Film School.

38
TABLE 3: FIXED VERSUS VARIABLE CONTRACTUAL RUN LENGTHS
Fixed Number of Days Range of Days
Contract (# Days) # Films Contract (# Days) # Films
1 4 1-3 3
2 28 2-3 433
3 32 2-4 511
4 209 2-5 1
5 22 3-4 596
6 3 3-5 12
7 96 4-5 1
total fixed 394 total range 1556

39
TABLE 4: DAYS BOOKED VERSUS DAYS PLAYED
Actual Days Played
Contracted Days < Contract Contract > Contract % Within Contract
1 NA 3 1 75%
1-3 NA 0 3 0%
2 4 23 1 82%
2-3 66 358 8 83%
2-4 12 404 94 79%
3 12 20 0 63%
3-4 124 349 123 59%
4 19 76 115 36%
3-5 2 8 2 67%
5 7 15 1 65%
6 1 2 0 67%
7 11 82 3 85%
total 258 1340 352 69%
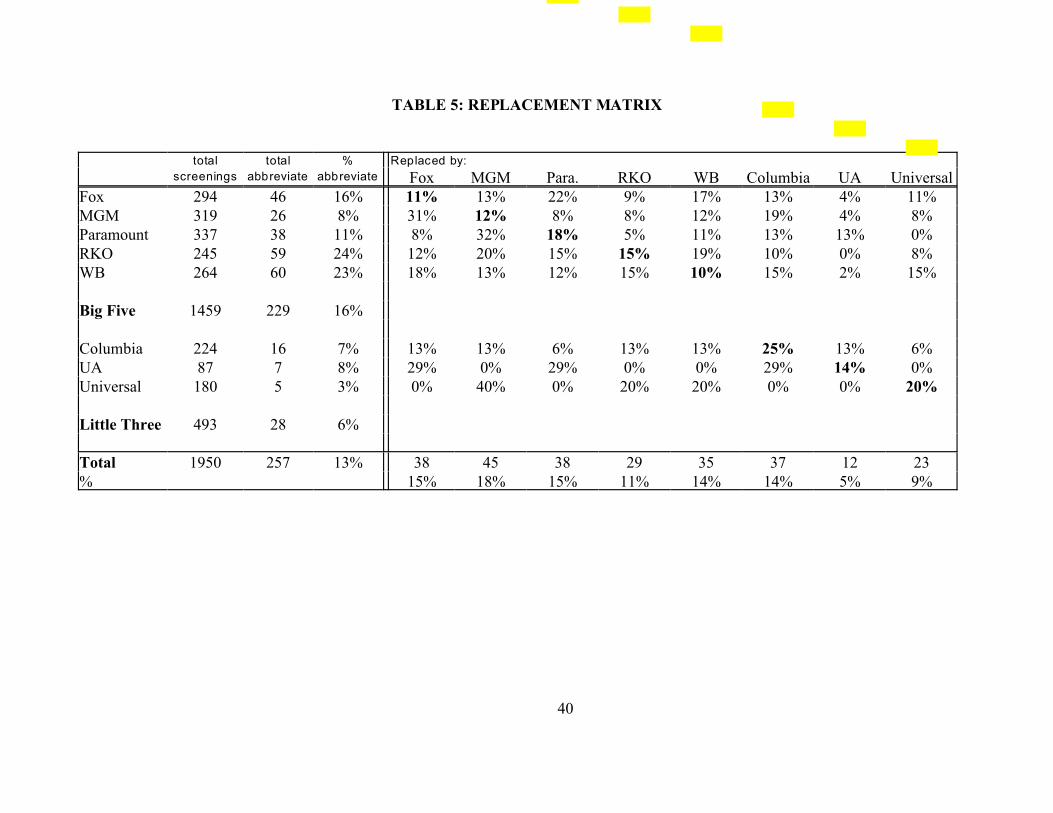
40
TABLE 5: REPLACEMENT MATRIX
total
screenings
total
abbreviate
%
abbreviate
Replaced by:
Fox MGM Para. RKO WB Columbia UA UniversalFox 294 46 16% 11% 13% 22% 9% 17% 13% 4% 11%MGM 319 26 8% 31% 12% 8% 8% 12% 19% 4% 8%Paramount 337 38 11% 8% 32% 18% 5% 11% 13% 13% 0%RKO 245 59 24% 12% 20% 15% 15% 19% 10% 0% 8%WB 264 60 23% 18% 13% 12% 15% 10% 15% 2% 15%
Big Five 1459 229 16%
Columbia 224 16 7% 13% 13% 6% 13% 13% 25% 13% 6%UA 87 7 8% 29% 0% 29% 0% 0% 29% 14% 0%Universal 180 5 3% 0% 40% 0% 20% 20% 0% 0% 20%
Little Three 493 28 6%
Total 1950 257 13% 38 45 38 29 35 37 12 23% 15% 18% 15% 11% 14% 14% 5% 9%
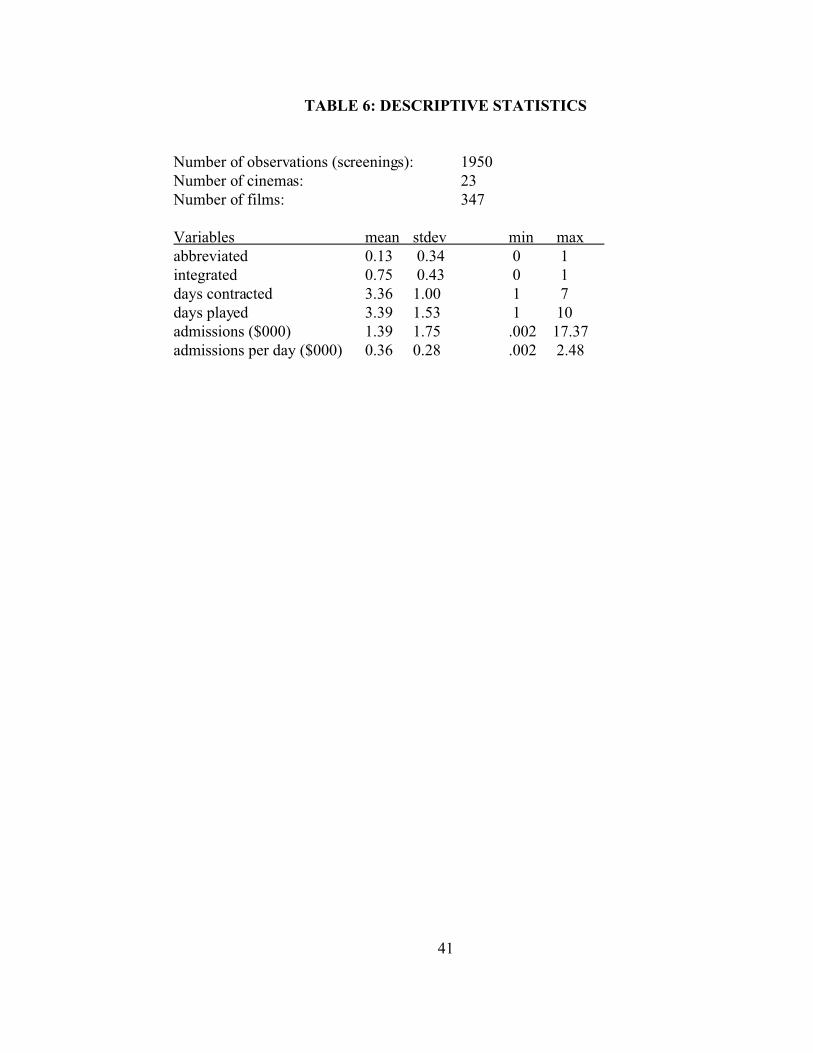
41
TABLE 6: DESCRIPTIVE STATISTICS
Number of observations (screenings): 1950Number of cinemas: 23Number of films: 347
Variables mean stdev min maxabbreviated 0.13 0.34 0 1integrated 0.75 0.43 0 1days contracted 3.36 1.00 1 7days played 3.39 1.53 1 10admissions ($000) 1.39 1.75 .002 17.37admissions per day ($000) 0.36 0.28 .002 2.48
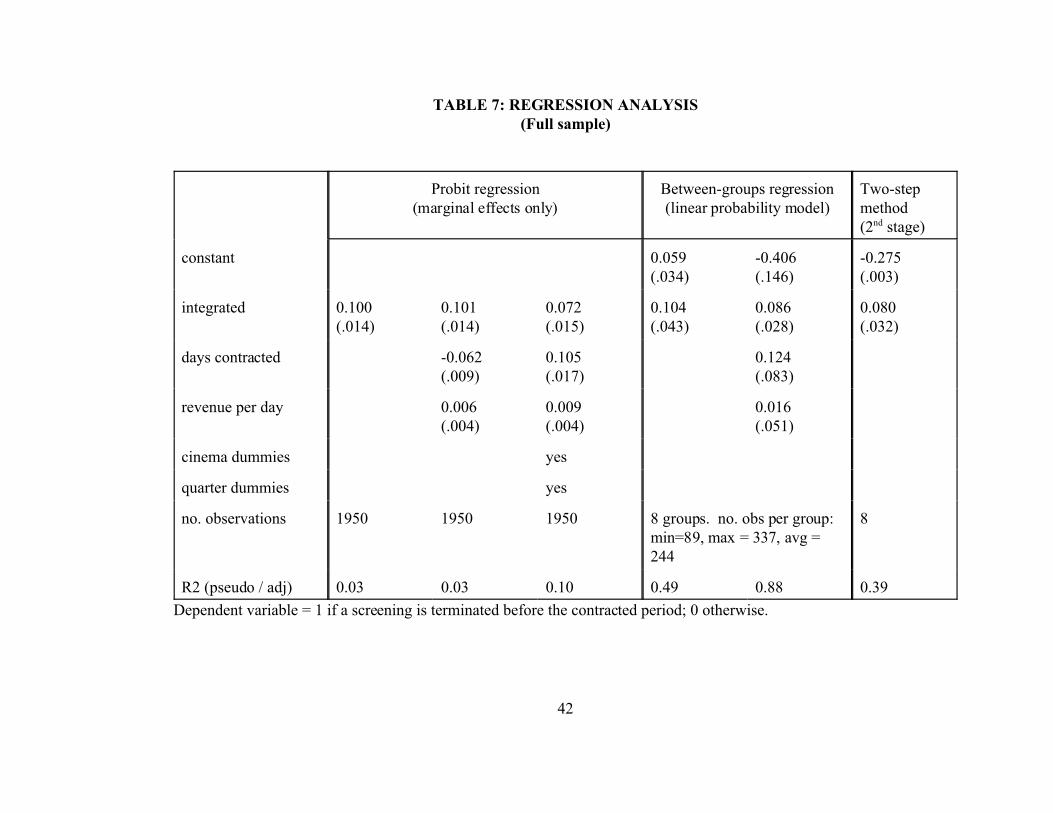
42
TABLE 7: REGRESSION ANALYSIS(Full sample)
Probit regression(marginal effects only)
Between-groups regression(linear probability model)
Two-stepmethod(2nd stage)
constant 0.059(.034)
-0.406(.146)
-0.275(.003)
integrated 0.100(.014)
0.101(.014)
0.072(.015)
0.104(.043)
0.086(.028)
0.080(.032)
days contracted -0.062(.009)
0.105(.017)
0.124(.083)
revenue per day 0.006(.004)
0.009(.004)
0.016(.051)
cinema dummies yes
quarter dummies yes
no. observations 1950 1950 1950 8 groups. no. obs per group: min=89, max = 337, avg =244
8
R2 (pseudo / adj) 0.03 0.03 0.10 0.49 0.88 0.39
Dependent variable = 1 if a screening is terminated before the contracted period; 0 otherwise.
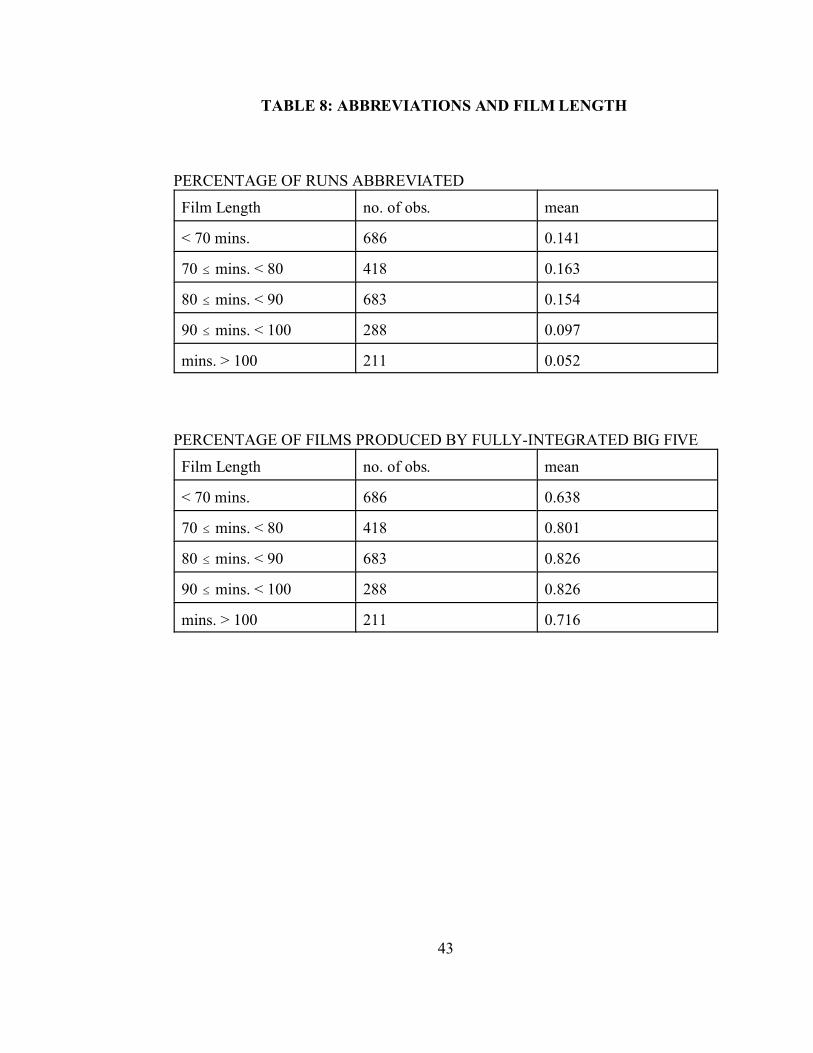
43
TABLE 8: ABBREVIATIONS AND FILM LENGTH
PERCENTAGE OF RUNS ABBREVIATED
Film Length no. of obs. mean
< 70 mins. 686 0.141
70 # mins. < 80 418 0.163
80 # mins. < 90 683 0.154
90 # mins. < 100 288 0.097
mins. > 100 211 0.052
PERCENTAGE OF FILMS PRODUCED BY FULLY-INTEGRATED BIG FIVE
Film Length no. of obs. mean
< 70 mins. 686 0.638
70 # mins. < 80 418 0.801
80 # mins. < 90 683 0.826
90 # mins. < 100 288 0.826
mins. > 100 211 0.716

44
TABLE 9: A-FILMS VERSUS B-FILMS
#
screenings
#
films
%
sharing
contract
avg running
length
(mins.)
#
films less
than 70'
%
films less
than 70'
#
screenings
of films less
than 70'
%
screenings
of films less
than 70'
Big
Five
Fox 294 55 38% 75.98 17 31% 88 30%
MGM 320 45 41% 88.35 3 7% 21 7%
Paramount 337 52 36% 78.96 22 42% 119 35%
RKO 245 46 34% 73.45 22 48% 96 39%
W B 263 56 49% 78.31 28 50% 114 43%
Little
Three
Columbia 224 40 13% 69.91 29 73% 142 63%
Universal 180 38 23% 73.75 26 68% 106 59%
UA 87 15 48% 94.43 0 0% 0 0%
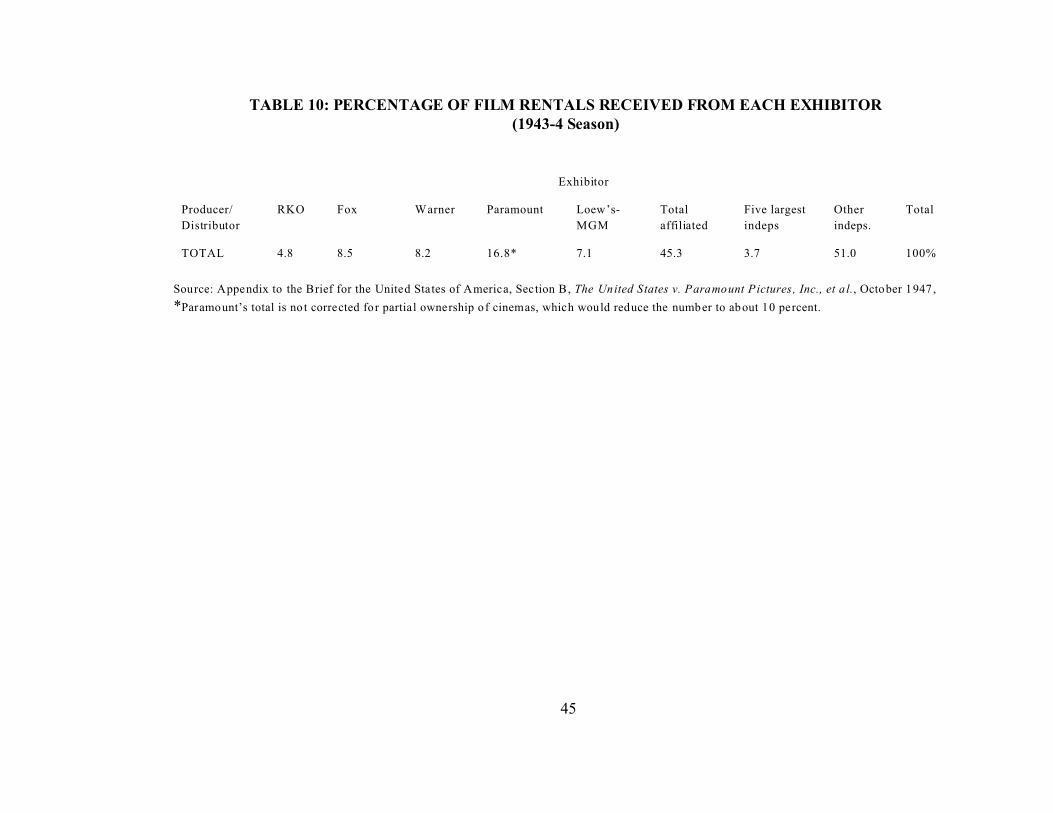
45
TABLE 10: PERCENTAGE OF FILM RENTALS RECEIVED FROM EACH EXHIBITOR(1943-4 Season)
Exhibitor
Producer/
Distributor
RKO Fox Warner Paramount Loew’s-
MGM
Total
affiliated
Five largest
indeps
Other
indeps.
Total
TOTAL 4.8 8.5 8.2 16.8* 7.1 45.3 3.7 51.0 100%
Source: Appendix to the Brief for the United States of America, Section B, The United States v. Paramount P ictures, Inc., et a l., October 1947 ,
*Paramount’s total is no t corrected for partial ownership of cinemas, which would reduce the number to about 10 percent.
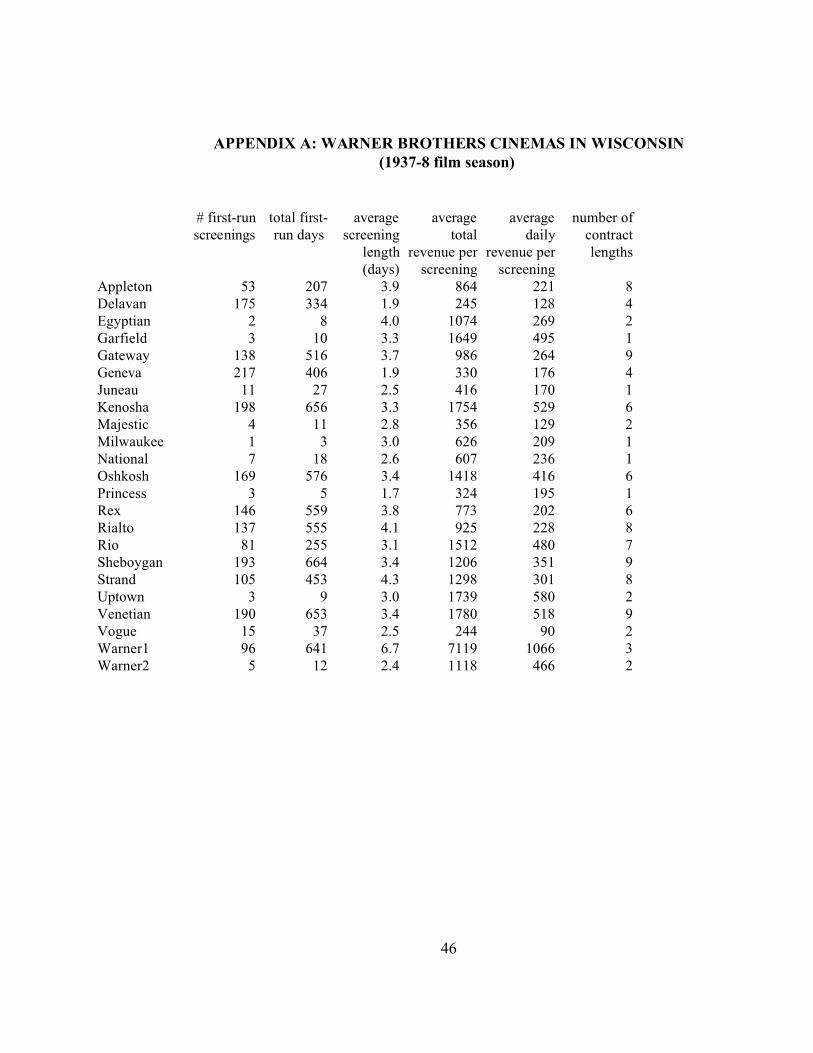
46
APPENDIX A: WARNER BROTHERS CINEMAS IN WISCONSIN(1937-8 film season)
# first-runscreenings
total first-run days
averagescreening
length(days)
averagetotal
revenue perscreening
averagedaily
revenue perscreening
number ofcontractlengths
Appleton 53 207 3.9 864 221 8Delavan 175 334 1.9 245 128 4Egyptian 2 8 4.0 1074 269 2Garfield 3 10 3.3 1649 495 1Gateway 138 516 3.7 986 264 9Geneva 217 406 1.9 330 176 4Juneau 11 27 2.5 416 170 1Kenosha 198 656 3.3 1754 529 6Majestic 4 11 2.8 356 129 2Milwaukee 1 3 3.0 626 209 1National 7 18 2.6 607 236 1Oshkosh 169 576 3.4 1418 416 6Princess 3 5 1.7 324 195 1Rex 146 559 3.8 773 202 6Rialto 137 555 4.1 925 228 8Rio 81 255 3.1 1512 480 7Sheboygan 193 664 3.4 1206 351 9Strand 105 453 4.3 1298 301 8Uptown 3 9 3.0 1739 580 2Venetian 190 653 3.4 1780 518 9Vogue 15 37 2.5 244 90 2Warner1 96 641 6.7 7119 1066 3Warner2 5 12 2.4 1118 466 2