VERSION 5 - ACHS · 1.1 Registered nurses with paediatric basic life support ... registered nurses...
27
PAEDIATRICS VERSION 5 Retrospective data in full ACIR 2008 - 2015
Transcript of VERSION 5 - ACHS · 1.1 Registered nurses with paediatric basic life support ... registered nurses...

PAEDIATRICS VERSION 5
Retrospective data in full ACIR 2008 - 2015

Australasian Clinical Indicator Report 2008–2015 © ACHS. This work is copyright. Requests and inquiries concerning reproduction and rights should be addressed to [email protected]
Contents
Paediatrics, version 5 1
Appropriateness ................................................................................................................................. 1
1.1 Registered nurses with paediatric basic life support qualifications (H) 1 1.2 Medical practitioners with paediatric basic life support qualifications (H) 2 1.3 Paediatric patients admitted to a paediatric ward/area (H) 3
Adverse events ................................................................................................................................... 4
2.1 Medication errors (L) 4 2.2 Adverse events when not in a paediatric ward/area (L) 6 2.3 Adverse events in a paediatric ward/area (L) 7
Documentation ................................................................................................................................... 8
3.1 Completed asthma action plan – paediatrics (H) 8 3.2 Paediatric surgery post-procedural report (H) 9 3.3 Physical assessment completed by medical practitioner and documented (H) 10 3.4 Physical assessment completed by registered nurse and documented (H) 11 3.5 Medical discharge summary completed – paediatrics (H) 12
Paediatric ICU ................................................................................................................................... 13
4.1 Unplanned return to PICU (L) 13 4.2 Adverse events - PICU clinical handover between registered nurses (L) 14 4.3 Adverse events - PICU clinical handover between medical practitioners (L) 15 4.4 Adverse events - PICU clinical handover to another area (L) 15
Paediatric anaesthesia..................................................................................................................... 16
5.1 Paediatric patients who fast 6 hours prior to anaesthesia (H) 16 5.2 Adverse event due to non-adherence to paediatric fasting guidelines (L) 17 5.3 Parent/guardian present at induction of anaesthesia (N) 18
Characteristics of contributing HCOs ............................................................................................ 19
Summary of Results 21
Appropriateness 21 Adverse events 21 Documentation 21 Paediatric ICU 22 Paediatric anaesthesia 22
Expert Commentary 23
Paediatrics and Child Health Division of The Royal Australasian
College of Physicians (RACP) ......................................................................................................... 23
Introductory comments 23 Appropriateness 23 Adverse events 23 Documentation 23 Paediatric ICU 23 Paediatric anaesthesia 23 General/closing comments 23
Australian College of Children and Young People’s Nurses (ACCYPN) ..................................... 24
Appropriateness 24 Adverse events 24 Documentation 24 Paediatric ICU 24 Paediatric anaesthesia 24 General/closing comments 24
Australasian Clinical Indicator Report 2008–2015 Page 1
© ACHS. This work is copyright. Requests and inquiries concerning reproduction and rights should be addressed to [email protected]
Paediatrics, version 5
Appropriateness
1.1 Registered nurses with paediatric basic life support qualifications (H)
Rationale
The appropriate care of paediatric patients is an important measure of quality in acute care settings.
To effectively care and provide better patient outcomes for this specific population, medical
practitioners and registered nurses should have up-to-date paediatric CPR qualifications and
paediatric patients should be located in paediatric wards / areas.
Numerator Number of registered nurses caring for paediatric patients that have up-to-date paediatric
basic life support qualifications.
Denominator Number of registered nurses caring for paediatric patients.
Desirable level: Low High Not specified
Type of Indicator: Process Outcome Structure
Year
No.
HCOs
Total
numerator
Total
denominator Rate#
Rate#
(20)
Rate#
(80)
Centile
Gains
Stratum
Gains
Outlier
Gains
2014 6 301 320 94.1 86.1 97.8 12
2015 12 373 402 92.8 88.3 98.0 21 5
# per 100 registered nurses
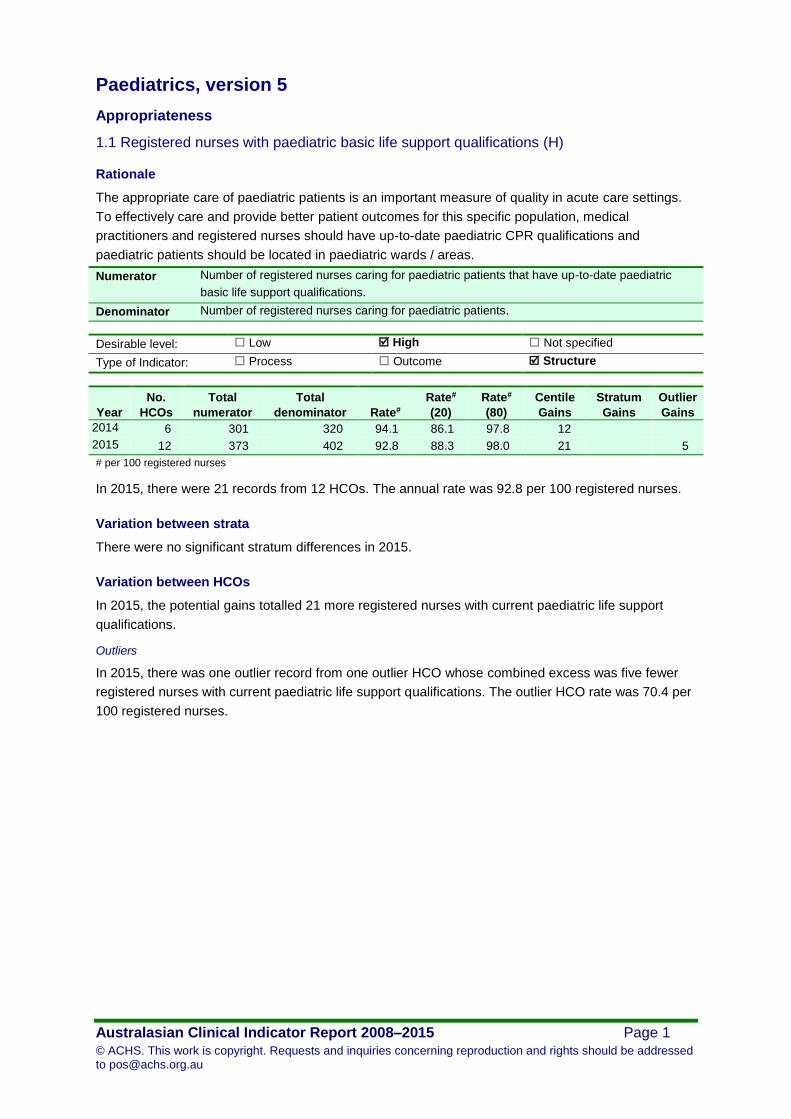
In 2015, there were 21 records from 12 HCOs. The annual rate was 92.8 per 100 registered nurses.
Variation between strata
There were no significant stratum differences in 2015.
Variation between HCOs
In 2015, the potential gains totalled 21 more registered nurses with current paediatric life support
qualifications.
Outliers
In 2015, there was one outlier record from one outlier HCO whose combined excess was five fewer
registered nurses with current paediatric life support qualifications. The outlier HCO rate was 70.4 per
100 registered nurses.

Paediatrics, version 5
Australasian Clinical Indicator Report 2008–2015 Page 2
© ACHS. This work is copyright. Requests and inquiries concerning reproduction and rights should be addressed to [email protected]
1.2 Medical practitioners with paediatric basic life support qualifications (H)
Numerator Number of medical practitioners caring for paediatric patients that have up-to-date paediatric
basic life support qualifications.
Denominator Number of medical practitioners caring for paediatric patients.
Desirable level: Low High Not specified
Type of Indicator: Process Outcome Structure
Year
No.
HCOs
Total
numerator
Total
denominator Rate#
Rate#
(20)
Rate#
(80)
Centile
Gains
Stratum
Gains
Outlier
Gains
2015 3 89 89 100 100 100
# per 100 medical practitioners
In 2015, there were five records from three HCOs. The annual rate was 100 per 100 medical
practitioners.
Variation between strata
There were no significant stratum differences in 2015.
Variation between HCOs
There were no potential gains in 2015.
Outliers
There were no outlier HCOs in 2015.

Paediatrics, version 5
Australasian Clinical Indicator Report 2008–2015 Page 3
© ACHS. This work is copyright. Requests and inquiries concerning reproduction and rights should be addressed to [email protected]
1.3 Paediatric patients admitted to a paediatric ward/area (H)
Numerator Number of paediatric patients admitted to a dedicated paediatric ward/area.
Denominator Number of paediatric patient admissions.
Desirable level: Low High Not specified
Type of Indicator: Process Outcome Structure
Year
No.
HCOs
Total
numerator
Total
denominator Rate#
Rate#
(20)
Rate#
(80)
Centile
Gains
Stratum
Gains
Outlier
Gains
2014 5 13,273 16,512 80.4 61.4 93.8 2,219 1,384
2015 14 19,392 21,831 88.8 77.2 100 2,430 1,085
# per 100 paediatric admissions
In 2015, there were 19 records from 14 HCOs. The annual rate was 88.8 per 100 paediatric
admissions.
Variation between strata
There were no significant stratum differences in 2015.
Variation between HCOs
In 2015, the potential gains totalled 2,430 more paediatric patients admitted to a dedicated paediatric
ward/area.
Outliers
In 2015, there were four outlier records from three outlier HCOs whose combined excess was 1,085
fewer paediatric patients admitted to a dedicated paediatric ward/area. The outlier HCO rate was 68.8
per 100 paediatric admissions.
Funnel plot of excess events

Paediatrics, version 5
Australasian Clinical Indicator Report 2008–2015 Page 4
© ACHS. This work is copyright. Requests and inquiries concerning reproduction and rights should be addressed to [email protected]
Adverse events
2.1 Medication errors (L)
Rationale
Medication errors are prevalent in paediatric patients due to their variations in physical size and
physiological capacities, which causes difficulties in determining paediatric dosages. These
medication errors can result in adverse events depending on the magnitude of the medication error
and the timeliness of the response of the ward staff.
Numerator Number of adverse medication incidents involving paediatric patients where the incorrect
dose of medication was administered.
Denominator Number of paediatric patient admissions.
Desirable level: Low High Not specified
Type of Indicator: Process Outcome Structure
Year
No.
HCOs
Total
numerator
Total
denominator Rate#
Rate#
(20)
Rate#
(80)
Centile
Gains
Stratum
Gains
Outlier
Gains
2014 4 7 3,396 0.21 0.076 0.20 4
2015 12 55 19,088 0.29 0.11 0.47 34 33 4
# per 100 paediatric admissions
In 2015, there were 21 records from 12 HCOs. The annual rate was 0.29 per 100 paediatric
admissions.
Variation between strata
Rates by Public / Private
Year Stratum
No.
HCOs
Total
numerator
Total
denominator
Stratum
rate#
Standard
error
Stratum
gains
2015 Private 5 2 4,427 0.13 0.084
Public 7 53 14,661 0.35 0.047 33
# per 100 paediatric admissions
Boxplot of Rates by Public / Private
Variation between HCOs
In 2015, the potential gains totalled 34 fewer paediatric adverse medication incidents due to incorrect
dose, corresponding to a reduction by approximately one-half.

Paediatrics, version 5
Australasian Clinical Indicator Report 2008–2015 Page 5
© ACHS. This work is copyright. Requests and inquiries concerning reproduction and rights should be addressed to [email protected]
Outliers
In 2015, there was one outlier record from one outlier HCO whose combined excess was four more
paediatric adverse medication incidents due to incorrect dose. The outlier HCO rate was 1.0 per 100
paediatric admissions.

Paediatrics, version 5
Australasian Clinical Indicator Report 2008–2015 Page 6
© ACHS. This work is copyright. Requests and inquiries concerning reproduction and rights should be addressed to [email protected]
2.2 Adverse events when not in a paediatric ward/area (L)
Numerator Number of adverse events involving paediatric patients that occur in a ward/area that is not
specifically dedicated to paediatric patients.
Denominator Number of paediatric patient admissions.
Desirable level: Low High Not specified
Type of Indicator: Process Outcome Structure
Year
No.
HCOs
Total
numerator
Total
denominator Rate#
Rate#
(20)
Rate#
(80)
Centile
Gains
Stratum
Gains
Outlier
Gains
2015 4 139 7,402 1.88 0.037 2.30 136 26
# per 100 paediatric admissions
In 2015, there were seven records from four HCOs. The annual rate was 1.88 per 100 paediatric
admissions.
Variation between strata
There were no significant stratum differences in 2015.
Variation between HCOs
In 2015, the potential gains totalled 136 fewer adverse events involving paediatric patients,
corresponding to a reduction by approximately four-fifths.
Outliers
In 2015, there was one outlier record from one outlier HCO whose combined excess was 26 more
adverse events involving paediatric patients. The outlier HCO rate was 2.9 per 100 paediatric
admissions.

Paediatrics, version 5
Australasian Clinical Indicator Report 2008–2015 Page 7
© ACHS. This work is copyright. Requests and inquiries concerning reproduction and rights should be addressed to [email protected]
2.3 Adverse events in a paediatric ward/area (L)
Numerator Number of adverse events involving paediatric patients that occur in a ward/area that is
specifically dedicated to paediatric patients.
Denominator Number of paediatric patient admissions.
Desirable level: Low High Not specified
Type of Indicator: Process Outcome Structure
Year
No.
HCOs
Total
numerator
Total
denominator Rate#
Rate#
(20)
Rate#
(80)
Centile
Gains
Stratum
Gains
Outlier
Gains
2015 5 420 13,858 3.03 0.070 5.89 410 211
# per 100 paediatric admissions
In 2015, there were 10 records from five HCOs. The annual rate was 3.03 per 100 paediatric
admissions.
Variation between strata
There were no significant stratum differences in 2015.
Variation between HCOs
In 2015, the potential gains totalled 410 fewer adverse events involving paediatric patients,
corresponding to a reduction by approximately four-fifths.
Outliers
In 2015, there were two outlier records from one outlier HCO whose combined excess was 211 more
adverse events involving paediatric patients. The outlier HCO rate was 7.0 per 100 paediatric
admissions.
Funnel plot of excess events

Paediatrics, version 5
Australasian Clinical Indicator Report 2008–2015 Page 8
© ACHS. This work is copyright. Requests and inquiries concerning reproduction and rights should be addressed to [email protected]
Documentation
3.1 Completed asthma action plan – paediatrics (H)
Rationale
Effective communication through completed documentation is essential for physicians to provide the
most safe and effective care for their patients. This process may reduce the incidence of adverse
outcomes resulting in fewer visits to the emergency department and further hospitalisation.
Numerator Number of paediatric patient separations with a primary diagnosis of asthma who are
discharged with a completed asthma action plan.
Denominator Number of paediatric patient separations with a primary diagnosis of asthma.
Desirable level: Low High Not specified
Type of Indicator: Process Outcome Structure
Year
No.
HCOs
Total
numerator
Total
denominator Rate#
Rate#
(20)
Rate#
(80)
Centile
Gains
Stratum
Gains
Outlier
Gains
2014 3 217 247 87.9 80.3 99.5 29
2015 3 388 415 93.5 80.4 100 27 22
# per 100 separations
In 2015, there were five records from three HCOs. The annual rate was 93.5 per 100 separations.
Variation between strata
There were no significant stratum differences in 2015.
Variation between HCOs
In 2015, the potential gains totalled 27 more paediatrics discharged with asthma action plans.
Outliers
In 2015, there was one outlier record from one outlier HCO whose combined excess was 22 fewer
paediatrics discharged with asthma action plans. The outlier HCO rate was 60.9 per 100 separations.

Paediatrics, version 5
Australasian Clinical Indicator Report 2008–2015 Page 9
© ACHS. This work is copyright. Requests and inquiries concerning reproduction and rights should be addressed to [email protected]
3.2 Paediatric surgery post-procedural report (H)
Numerator Number of paediatric patients where the post-procedural instructions are documented on the
Surgeon's/Operation Report.
Denominator Number of paediatric patient surgical separations.
Desirable level: Low High Not specified
Type of Indicator: Process Outcome Structure
Year
No.
HCOs
Total
numerator
Total
denominator Rate#
Rate#
(20)
Rate#
(80)
Centile
Gains
Stratum
Gains
Outlier
Gains
2014 1 343 343 100 100 100
2015 1 170 170 100 100 100
# per 100 separations
In 2015, there were two records from one HCO. The annual rate was 100 per 100 separations.
Variation between strata
There were no significant stratum differences in 2015.
Variation between HCOs
There were no potential gains in 2015.
Outliers
There were no outlier HCOs in 2015.

Paediatrics, version 5
Australasian Clinical Indicator Report 2008–2015 Page 10
© ACHS. This work is copyright. Requests and inquiries concerning reproduction and rights should be addressed to [email protected]
3.3 Physical assessment completed by medical practitioner and documented (H)
Numerator Number of paediatric patients with a completed documented physical assessment conducted
by a medical practitioner within 4 hours of admission, over a consecutive 7-day period in May
or November.
Denominator Number of paediatric patient admissions, over a consecutive 7-day period in May or
November.
Desirable level: Low High Not specified
Type of Indicator: Process Outcome Structure
Year
No.
HCOs
Total
numerator
Total
denominator Rate#
Rate#
(20)
Rate#
(80)
Centile
Gains
Stratum
Gains
Outlier
Gains
2015 2 116 123 94.3 85.0 98.1 5
# per 100 paediatric admissions
In 2015, there were four records from two HCOs. The annual rate was 94.3 per 100 paediatric
admissions.
Variation between strata
There were no significant stratum differences in 2015.
Variation between HCOs
There was relatively little variation between HCOs and so the potential gains were small in 2015.
Outliers
There were no outlier HCOs in 2015.

Paediatrics, version 5
Australasian Clinical Indicator Report 2008–2015 Page 11
© ACHS. This work is copyright. Requests and inquiries concerning reproduction and rights should be addressed to [email protected]
3.4 Physical assessment completed by registered nurse and documented (H)
Numerator Number of paediatric patients with a completed documented physical assessment conducted
by a registered nurse within 4 hours of admission, over a consecutive 7-day period in May or
November.
Denominator Number of paediatric patient admissions, over a consecutive 7-day period in May or
November.
Desirable level: Low High Not specified
Type of Indicator: Process Outcome Structure
Year
No.
HCOs
Total
numerator
Total
denominator Rate#
Rate#
(20)
Rate#
(80)
Centile
Gains
Stratum
Gains
Outlier
Gains
2015 2 87 123 70.7 57.1 98.1 34
# per 100 paediatric admissions
In 2015, there were four records from two HCOs. The annual rate was 70.7 per 100 paediatric
admissions.
Variation between strata
There were no significant stratum differences in 2015.
Variation between HCOs
In 2015, the potential gains totalled 34 more paediatrics given a physical assessment.
Outliers
There were no outlier HCOs in 2015.

Paediatrics, version 5
Australasian Clinical Indicator Report 2008–2015 Page 12
© ACHS. This work is copyright. Requests and inquiries concerning reproduction and rights should be addressed to [email protected]
3.5 Medical discharge summary completed – paediatrics (H)
Numerator Number of paediatric patients with a completed medical discharge summary in their medical
record, within the time specified in your healthcare organisation’s guidelines.
Denominator Number of paediatric patient separations.
Desirable level: Low High Not specified
Type of Indicator: Process Outcome Structure
Year
No.
HCOs
Total
numerator
Total
denominator Rate#
Rate#
(20)
Rate#
(80)
Centile
Gains
Stratum
Gains
Outlier
Gains
2015 1 846 846 100 100 100
# per 100 separations
In 2015, there were two records from one HCO. The annual rate was 100 per 100 separations.
Variation between strata
There were no significant stratum differences in 2015.
Variation between HCOs
There were no potential gains in 2015.
Outliers
There were no outlier HCOs in 2015.

Paediatrics, version 5
Australasian Clinical Indicator Report 2008–2015 Page 13
© ACHS. This work is copyright. Requests and inquiries concerning reproduction and rights should be addressed to [email protected]
Paediatric ICU
4.1 Unplanned return to PICU (L)
Rationale
Unplanned returns to a paediatric intensive care unit (PICU) may reflect less than optimal
management of the paediatric patient. This can be attributed to premature discharge as a
consequence of inadequate resources or miscommunication between healthcare professionals during
clinical handover.
Numerator Number of unplanned returns to the paediatric intensive care unit (PICU) during the same
admission.
Denominator Number of paediatric admissions to the paediatric intensive care unit (PICU).
Desirable level: Low High Not specified
Type of Indicator: Process Outcome Structure
Year
No.
HCOs
Total
numerator
Total
denominator Rate#
Rate#
(20)
Rate#
(80)
Centile
Gains
Stratum
Gains
Outlier
Gains
2014 1 1 185 0.54 0.54 0.54
2015 2 17 639 2.66 1.06 45.1 10 2
# per 100 paediatric admissions
In 2015, there were four records from two HCOs. The annual rate was 2.66 per 100 paediatric
admissions.
Variation between strata
There were no significant stratum differences in 2015.
Variation between HCOs
In 2015, the potential gains totalled 10 fewer unplanned returns to the PICU, corresponding to a
reduction by approximately one-half.
Outliers
In 2015, there was one outlier record from one outlier HCO whose combined excess was two more
unplanned returns to the PICU.

Paediatrics, version 5
Australasian Clinical Indicator Report 2008–2015 Page 14
© ACHS. This work is copyright. Requests and inquiries concerning reproduction and rights should be addressed to [email protected]
4.2 Adverse events - PICU clinical handover between registered nurses (L)
Numerator Number of paediatric intensive care unit (PICU) patients that had an adverse event relating to
clinical handover from registered nurse to registered nurse.
Denominator Number of paediatric intensive care unit (PICU) patients that underwent clinical handover.
Desirable level: Low High Not specified
Type of Indicator: Process Outcome Structure
Year
No.
HCOs
Total
numerator
Total
denominator Rate#
Rate#
(20)
Rate#
(80)
Centile
Gains
Stratum
Gains
Outlier
Gains
2014 1 0 185 0 0 0
2015 1 0 10 0 0 0
# per 100 paediatric patients
In 2015, there were two records from one HCO. The annual rate was 0 per 100 paediatric patients.
Variation between strata
There were no significant stratum differences in 2015.
Variation between HCOs
There were no potential gains in 2015.
Outliers
There were no outlier HCOs in 2015.

Paediatrics, version 5
Australasian Clinical Indicator Report 2008–2015 Page 15
© ACHS. This work is copyright. Requests and inquiries concerning reproduction and rights should be addressed to [email protected]
4.3 Adverse events - PICU clinical handover between medical practitioners (L)
Numerator Number of paediatric intensive care unit (PICU) patients that had an adverse event relating to
clinical handover from medical practitioner to medical practitioner.
Denominator Number of paediatric intensive care unit (PICU) patients that underwent clinical handover.
Desirable level: Low High Not specified
Type of Indicator: Process Outcome Structure
Year
No.
HCOs
Total
numerator
Total
denominator Rate#
Rate#
(20)
Rate#
(80)
Centile
Gains
Stratum
Gains
Outlier
Gains
2014 1 0 185 0 0 0
# per 100 paediatric patients
No data was submitted in 2015.
4.4 Adverse events - PICU clinical handover to another area (L)
Numerator Number of paediatric intensive care unit (PICU) patients that had an adverse event relating to
clinical handover to another area.
Denominator Number of paediatric intensive care unit (PICU) patients that underwent clinical handover.
Desirable level: Low High Not specified
Type of Indicator: Process Outcome Structure
Year
No.
HCOs
Total
numerator
Total
denominator Rate#
Rate#
(20)
Rate#
(80)
Centile
Gains
Stratum
Gains
Outlier
Gains
2014 1 0 185 0 0 0
# per 100 paediatric patients
No data was submitted in 2015.

Paediatrics, version 5
Australasian Clinical Indicator Report 2008–2015 Page 16
© ACHS. This work is copyright. Requests and inquiries concerning reproduction and rights should be addressed to [email protected]
Paediatric anaesthesia
5.1 Paediatric patients who fast 6 hours prior to anaesthesia (H)
Rationale
Fasting prior to the induction of anaesthesia is recommended to minimise the occurrence of residual
gastric volume and acidity prior to surgery. Non-adherence to the fasting guidelines has been found to
result in perioperative respiratory adverse events. Therefore, parents/guardians should ensure that
they comply with the recommended guidelines and report if they have not adhered to them. They may
also wish to be present to reassure the child during the induction of anaesthesia.
Numerator Number of paediatric patients who fast for more than 6 hours prior to induction of
anaesthesia.
Denominator Number of paediatric patients undergoing surgery who were administered general
anaesthesia.
Desirable level: Low High Not specified
Type of Indicator: Process Outcome Structure
Year
No.
HCOs
Total
numerator
Total
denominator Rate#
Rate#
(20)
Rate#
(80)
Centile
Gains
Stratum
Gains
Outlier
Gains
2015 4 1,413 1,553 91.0 69.6 100 140 105
# per 100 paediatric patients
In 2015, there were seven records from four HCOs. The annual rate was 91.0 per 100 paediatric
patients.
Variation between strata
There were no significant stratum differences in 2015.
Variation between HCOs
In 2015, the potential gains totalled 140 more paediatrics fasting for more than six hours prior to
anaesthesia.
Outliers
In 2015, there were two outlier records from one outlier HCO whose combined excess was 105 fewer
paediatrics fasting for more than six hours prior to anaesthesia. The outlier HCO rate was 63.6 per
100 paediatric patients.
Funnel plot of excess events

Paediatrics, version 5
Australasian Clinical Indicator Report 2008–2015 Page 17
© ACHS. This work is copyright. Requests and inquiries concerning reproduction and rights should be addressed to [email protected]
5.2 Adverse event due to non-adherence to paediatric fasting guidelines (L)
Numerator Number of adverse events involving paediatric patients due to non-adherence to fasting
guidelines.
Denominator Number of paediatric patients undergoing surgery who were administered general
anaesthesia.
Desirable level: Low High Not specified
Type of Indicator: Process Outcome Structure
Year
No.
HCOs
Total
numerator
Total
denominator Rate#
Rate#
(20)
Rate#
(80)
Centile
Gains
Stratum
Gains
Outlier
Gains
2014 1 0 988 0 0 0
2015 3 0 1,168 0 0 0
# per 100 paediatric patients
In 2015, there were five records from three HCOs. The annual rate was 0 per 100 paediatric patients.
Variation between strata
There were no significant stratum differences in 2015.
Variation between HCOs
There were no potential gains in 2015.
Outliers
There were no outlier HCOs in 2015.

Paediatrics, version 5
Australasian Clinical Indicator Report 2008–2015 Page 18
© ACHS. This work is copyright. Requests and inquiries concerning reproduction and rights should be addressed to [email protected]
5.3 Parent/guardian present at induction of anaesthesia (N)
Numerator Number of paediatric patients where their parent/s or guardian was present at the time of
induction of anaesthesia.
Denominator Number of paediatric patients undergoing surgery who were administered general
anaesthesia.
Desirable level: Low High Not specified
Type of Indicator: Process Outcome Structure
Year
No.
HCOs
Total
numerator
Total
denominator Rate#
Rate#
(20)
Rate#
(80)
*Centile
Gains
*Stratum
Gains
*Outlier
Gains
2015 2 162 163 99.4 99.4 99.4
# per 100 paediatric patients *Gains are not calculated when the desirable level is not specified.
In 2015, there were three records from two HCOs. The annual rate was 99.4 per 100 paediatric
patients.
Variation between strata
There were no significant stratum differences in 2015.
Variation between HCOs
Outliers
Since it has not been specified whether high or low rates are desirable, outlier HCOs are not reported.

Paediatrics, version 5
Australasian Clinical Indicator Report 2008–2015 Page 19
© ACHS. This work is copyright. Requests and inquiries concerning reproduction and rights should be addressed to [email protected]
Characteristics of contributing HCOs
Public/ Private and Metropolitan/ Non-metro total denominators and number of HCOs by clinical indicator
All indicators Combined
Public % Private % Metropolitan % Non-metro % Total
Paediatrics Indicators Combined HCOs 19 66% 10 34% 20 69% 9 31% 29
Indicators by Topic
Appropriateness
Clinical Indicator Public % Private % Metropolitan % Non-metro % Total
1.1 Registered nurses with paediatric basic life support qualifications (H)
HCOs 7 58% 5 42% 9 75% 3 25% 12
Denominator 220 55% 182 45% 333 83% 69 17% 402
1.2 Medical practitioners with paediatric basic life support qualifications (H)
HCOs 3 100% - 0% 2 67% 1 33% 3
Denominator 89 100% - 0% 78 88% 11 12% 89
1.3 Paediatric patients admitted to a paediatric ward/area (H)
HCOs 14 100% - 0% 10 71% 4 29% 14
Denominator 21,831 100% - 0% 19,241 88% 2,590 12% 21,831
Adverse events
Clinical Indicator Public % Private % Metropolitan % Non-metro % Total
2.1 Medication errors (L) HCOs 7 58% 5 42% 9 75% 3 25% 12
Denominator 14,661 77% 4,427 23% 12,852 67% 6,236 33% 19,088
2.2 Adverse events when not in a paediatric ward/area (L) HCOs 4 100% - 0% 1 25% 3 75% 4
Denominator 7,402 100% - 0% 1,145 15% 6,257 85% 7,402
2.3 Adverse events in a paediatric ward/area (L) HCOs 5 100% - 0% 3 60% 2 40% 5
Denominator 13,858 100% - 0% 7,651 55% 6,207 45% 13,858

Paediatrics, version 5
Australasian Clinical Indicator Report 2008–2015 Page 20
© ACHS. This work is copyright. Requests and inquiries concerning reproduction and rights should be addressed to [email protected]
cumentation
Clinical Indicator Public % Private % Metropolitan % Non-metro % Total
3.1 Completed asthma action plan - paediatrics (H) HCOs 3 100% - 0% 2 67% 1 33% 3
Denominator 415 100% - 0% 378 91% 37 9% 415
3.2 Paediatric surgery post-procedural report (H) HCOs 1 100% - 0% - 0% 1 100% 1
Denominator 170 100% - 0% - 0% 170 100% 170
3.3 Physical assessment completed by medical practitioner and documented (H)
HCOs 2 100% - 0% 1 50% 1 50% 2
Denominator 123 100% - 0% 88 72% 35 28% 123
3.4 Physical assessment completed by registered nurse and documented (H)
HCOs 2 100% - 0% 1 50% 1 50% 2
Denominator 123 100% - 0% 88 72% 35 28% 123
3.5 Medical discharge summary completed - paediatrics (H) HCOs 1 100% - 0% - 0% 1 100% 1
Denominator 846 100% - 0% - 0% 846 100% 846
Paediatric ICU
Clinical Indicator Public % Private % Metropolitan % Non-metro % Total
4.1 Unplanned return to PICU (L) HCOs 2 100% - 0% - 0% 2 100% 2
Denominator 639 100% - 0% - 0% 639 100% 639
4.2 Adverse events - PICU clinical handover between registered nurses (L)
HCOs 1 100% - 0% - 0% 1 100% 1
Denominator 10 100% - 0% - 0% 10 100% 10
Paediatric anaesthesia
Clinical Indicator Public % Private % Metropolitan % Non-metro % Total
5.1 Paediatric patients who fast 6 hours prior to anaesthesia (H)
HCOs 2 50% 2 50% 1 25% 3 75% 4
Denominator 163 10% 1,390 90% 1,005 65% 548 35% 1,553
5.2 Adverse event due to non-adherence to paediatric fasting guidelines (L)
HCOs 2 67% 1 33% 1 33% 2 67% 3
Denominator 163 14% 1,005 86% 1,005 86% 163 14% 1,168
5.3 Parent/guardian present at induction of anaesthesia (N) HCOs 2 100% - 0% - 0% 2 100% 2
Denominator 163 100% - 0% - 0% 163 100% 163
Paediatrics, version 5
Australasian Clinical Indicator Report 2008–2015 Page 21
© ACHS. This work is copyright. Requests and inquiries concerning reproduction and rights should be addressed to [email protected]
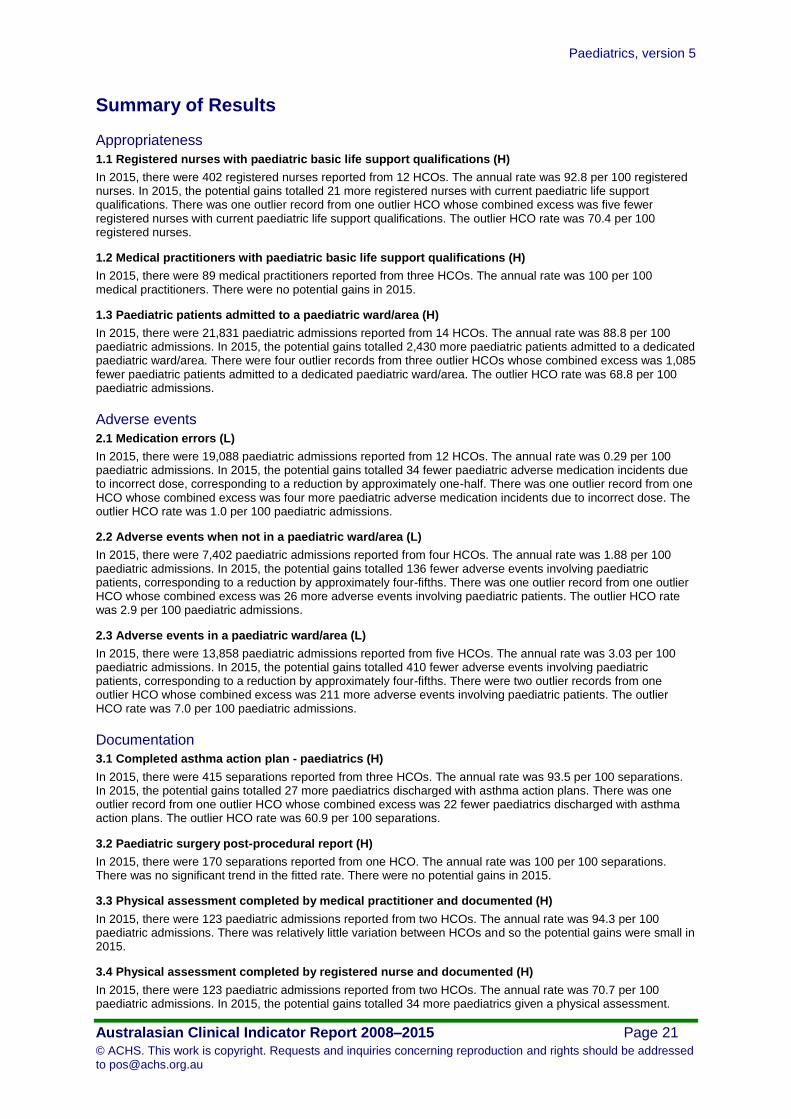
Summary of Results
Appropriateness
1.1 Registered nurses with paediatric basic life support qualifications (H)
In 2015, there were 402 registered nurses reported from 12 HCOs. The annual rate was 92.8 per 100 registered nurses. In 2015, the potential gains totalled 21 more registered nurses with current paediatric life support qualifications. There was one outlier record from one outlier HCO whose combined excess was five fewer registered nurses with current paediatric life support qualifications. The outlier HCO rate was 70.4 per 100 registered nurses.
1.2 Medical practitioners with paediatric basic life support qualifications (H)
In 2015, there were 89 medical practitioners reported from three HCOs. The annual rate was 100 per 100 medical practitioners. There were no potential gains in 2015.
1.3 Paediatric patients admitted to a paediatric ward/area (H)
In 2015, there were 21,831 paediatric admissions reported from 14 HCOs. The annual rate was 88.8 per 100 paediatric admissions. In 2015, the potential gains totalled 2,430 more paediatric patients admitted to a dedicated paediatric ward/area. There were four outlier records from three outlier HCOs whose combined excess was 1,085 fewer paediatric patients admitted to a dedicated paediatric ward/area. The outlier HCO rate was 68.8 per 100 paediatric admissions.
Adverse events
2.1 Medication errors (L)
In 2015, there were 19,088 paediatric admissions reported from 12 HCOs. The annual rate was 0.29 per 100 paediatric admissions. In 2015, the potential gains totalled 34 fewer paediatric adverse medication incidents due to incorrect dose, corresponding to a reduction by approximately one-half. There was one outlier record from one HCO whose combined excess was four more paediatric adverse medication incidents due to incorrect dose. The outlier HCO rate was 1.0 per 100 paediatric admissions.
2.2 Adverse events when not in a paediatric ward/area (L)
In 2015, there were 7,402 paediatric admissions reported from four HCOs. The annual rate was 1.88 per 100 paediatric admissions. In 2015, the potential gains totalled 136 fewer adverse events involving paediatric patients, corresponding to a reduction by approximately four-fifths. There was one outlier record from one outlier HCO whose combined excess was 26 more adverse events involving paediatric patients. The outlier HCO rate was 2.9 per 100 paediatric admissions.
2.3 Adverse events in a paediatric ward/area (L)
In 2015, there were 13,858 paediatric admissions reported from five HCOs. The annual rate was 3.03 per 100 paediatric admissions. In 2015, the potential gains totalled 410 fewer adverse events involving paediatric patients, corresponding to a reduction by approximately four-fifths. There were two outlier records from one outlier HCO whose combined excess was 211 more adverse events involving paediatric patients. The outlier HCO rate was 7.0 per 100 paediatric admissions.
Documentation
3.1 Completed asthma action plan - paediatrics (H)
In 2015, there were 415 separations reported from three HCOs. The annual rate was 93.5 per 100 separations. In 2015, the potential gains totalled 27 more paediatrics discharged with asthma action plans. There was one outlier record from one outlier HCO whose combined excess was 22 fewer paediatrics discharged with asthma action plans. The outlier HCO rate was 60.9 per 100 separations.
3.2 Paediatric surgery post-procedural report (H)
In 2015, there were 170 separations reported from one HCO. The annual rate was 100 per 100 separations. There was no significant trend in the fitted rate. There were no potential gains in 2015.
3.3 Physical assessment completed by medical practitioner and documented (H)
In 2015, there were 123 paediatric admissions reported from two HCOs. The annual rate was 94.3 per 100 paediatric admissions. There was relatively little variation between HCOs and so the potential gains were small in 2015.
3.4 Physical assessment completed by registered nurse and documented (H)
In 2015, there were 123 paediatric admissions reported from two HCOs. The annual rate was 70.7 per 100 paediatric admissions. In 2015, the potential gains totalled 34 more paediatrics given a physical assessment.

Paediatrics, version 5
Australasian Clinical Indicator Report 2008–2015 Page 22
© ACHS. This work is copyright. Requests and inquiries concerning reproduction and rights should be addressed to [email protected]
3.5 Medical discharge summary completed - paediatrics (H)
In 2015, there were 846 separations reported from one HCO. The annual rate was 100 per 100 separations. There were no potential gains in 2015.
Paediatric ICU
4.1 Unplanned return to PICU (L)
In 2015, there were 639 paediatric admissions reported from two HCOs. The annual rate was 2.66 per 100 paediatric admissions. In 2015, the potential gains totalled 10 fewer unplanned returns to the PICU, corresponding to a reduction by approximately one-half. There was one outlier record from one outlier HCO whose combined excess was two more unplanned returns to the PICU.
4.2 Adverse events - PICU clinical handover between registered nurses (L)
In 2015, there were 10 paediatric patients reported from one HCO. The annual rate was 0 per 100 paediatric patients. There was no significant trend in the fitted rate. There were no potential gains in 2015.
4.3 Adverse events - PICU clinical handover between medical practitioners (L)
No data was submitted in 2015.
4.4 Adverse events - PICU clinical handover to another area (L)
No data was submitted in 2015.
Paediatric anaesthesia
5.1 Paediatric patients who fast 6 hours prior to anaesthesia (H)
In 2015, there were 1,553 paediatric patients reported from four HCOs. The annual rate was 91.0 per 100 paediatric patients. In 2015, the potential gains totalled 140 more paediatrics fasting for more than six hours prior to anaesthesia. There were two outlier records from one outlier HCO whose combined excess was 105 fewer paediatrics fasting for more than six hours prior to anaesthesia. The outlier HCO rate was 63.6 per 100 paediatric patients.
5.2 Adverse event due to non-adherence to paediatric fasting guidelines (L)
In 2015, there were 1,168 paediatric patients reported from three HCOs. The annual rate was 0 per 100 paediatric patients. There were no potential gains in 2015.
5.3 Parent/guardian present at induction of anaesthesia (N)
In 2015, there were 163 paediatric patients reported from two HCOs. The annual rate was 99.4 per 100 paediatric patients.

Paediatrics, version 5
Australasian Clinical Indicator Report 2008–2015 Page 23
© ACHS. This work is copyright. Requests and inquiries concerning reproduction and rights should be addressed to [email protected]
Expert Commentary
Paediatrics and Child Health Division of The Royal Australasian College of Physicians
(RACP)
Introductory comments
Once again the minimal number of healthcare organisations (HCOs) responding makes this data
interesting, but difficult to interpret.
Appropriateness
The clinical indicators (CIs) chosen are valid but not comprehensive and this may be why the
engagement of HCOs is low.
Adverse events
It is interesting to note that adverse events in children admitted to paediatric units (CI 2.3) were higher
than those admitted to non-paediatric units (CI 2.2), although numbers are too low for statistically
valid conclusions to be drawn.
Documentation
Of note is that not all children are comprehensively admitted or examined by either medical or nursing
staff. Although there appears to be no progress in having one set of admission documentation by
healthcare professionals.
Paediatric ICU
Paediatric ICU unplanned returns (CI 4.1) appear to have trended down and there were no data
submitted for adverse events.
Paediatric anaesthesia
It appears that adherence to six hours fasting (CI 5.1) has improved, but it would be interesting to
know how many children have fasted for too long, which is a distressing and at times clinically
disadvantageous situation.
General/closing comments
Few HCOs are now submitting data, which may be because of the more comprehensive data
collection now undertaken by the Children’s Healthcare Australasia (CHA). Perhaps the ACHS should
consider working with the CHA to share and improve on data collection and therefore validity.

Paediatrics, version 5
Australasian Clinical Indicator Report 2008–2015 Page 24
© ACHS. This work is copyright. Requests and inquiries concerning reproduction and rights should be addressed to [email protected]
Australian College of Children and Young People’s Nurses (ACCYPN)
Appropriateness
The rate of qualification of 92.8% for registered nurses (CI 1.1) and 100% for medical practitioners is
a positive result (CI 1.2), yet some HCOs need to improve the nurses’ compliance rate. There is also
a need to follow the Australian Resuscitation Council (ARC) guidelines and provide further categories
to differentiate cardiopulmonary resuscitation (CPR) competency levels according to the child’s age
(e.g. infants versus children or adolescents). The annual rate of 88.8 per 100 paediatric admissions to
a paediatric ward/area (CI 1.3) is acceptable compared to previous years. However HCOs need to be
aiming for 100% in order to reduce adverse events i.e. medication errors as well as to ensure a well-
established family centred care environment for the child and their family.
Adverse events
It is unclear where and how the medication errors (CI 2.1) were reported. There is a need for further
clarification regarding whether the medication errors were mainly related to errors in prescription of
doses by medical practitioners or by nurses during the preparation and administration stages. In
addition the location of where medication errors were reported is also significant for interpretation of
the results (e.g. Emergency Department, PICU, NICU or general paediatric ward). The significant
differences in medication errors reported by the private and public hospital sector is also worthy of
further investigation; in particular accuracy of reporting.
It is noted that the rate of adverse events involving paediatric patients in a paediatric ward (CI 2.3) is
higher than those that occurred in a ward/area that was not specifically dedicated to paediatric
patients (CI 2.2). It would be helpful to obtain data that details the nature of these adverse events.
One HCO had 26 more adverse events involving paediatric patients when not in a dedicated
paediatric ward/area, which supports the aim of CI 1.3 to have all children cared for in a dedicated
paediatric ward/area.
Documentation
The reporting rate for asthma management plans (CI 3.1) is positive, and demonstrates an
improvement when compared to previous years. The reporting rate for post-surgical documentation
(CI 3.2) is positive and well-maintained for the periods indicated. The reporting rate for physical
assessment completed by registered nurses (CI 3.4) is low (70.7%) compared to the 94.3% reporting
rate by medical practitioners (CI 3.3). HCOs need to be aiming for an improvement in nurses’
documentation. The reporting rate for medical discharge summary (CI 3.5) is exceptional and reflects
good documentation; however, this rate is based on one HCO.
Paediatric ICU
There is a distinct lack of reporting of adverse events at the paediatric intensive care unit (PICU). It is
noted that there is a reduction by half for returns to the PICU (CI 4.1).
Paediatric anaesthesia
The reporting rate for parent/guardian present at induction of anaesthesia (CI 5.3) is positive, but
could be improved, as could the figures for children fasting for more than six hours (CI 5.1). However
the rate of reporting of adverse events due to non-adherence to fasting guidelines (CI 5.2)
demonstrated no potential gains in 2015 and should be carefully monitored.
General/closing comments
The majority of reporting rates of CIs are positive, yet it cannot be extrapolated to the general
child/young person population as there are a limited number of records from participating HCOs.
Paediatrics, version 5
Australasian Clinical Indicator Report 2008–2015 Page 25
© ACHS. This work is copyright. Requests and inquiries concerning reproduction and rights should be addressed to [email protected]
References
1. The Australian Resuscitation Council. ANZCOR Guideline 12.1 - Introduction to Paediatric Advanced Life Support.
Accessed from http://resus.org.au/guidelines/ on 4/05/2016.
2. Hill MK, Pawsey M, Cutler A et al. Consensus standards for the care of children and adolescents in Australian health
services. The Medical Journal of Australia 2011; 194(2): 78-82.
3. The Royal Australasian College of Physicians (RACP). Policy on the co-location of adults with children and adolescents in
healthcare settings. Sydney NSW; Paediatrics & Child Health Division, RACP. Accessed from
https://www.racp.edu.au/index.cfm?objectid=74ABBD76-CF93-A9A6-C9EFADC99AD1690 on 10/05/2015.