VERITIV CORPORATIONd18rn0p25nwr6d.cloudfront.net/CIK-0001599489/24850812-e... · 2017-11-07 · ......
44
UNITED STATES SECURITIES AND EXCHANGE COMMISSION Washington, D.C. 20549 FORM 10-Q ☒ QUARTERLY REPORT PURSUANT TO SECTION 13 OR 15(d) OF THE SECURITIES EXCHANGE ACT OF 1934 For the quarterly period ended September 30, 2017 OR ☐ TRANSITION REPORT PURSUANT TO SECTION 13 OR 15(d) OF THE SECURITIES EXCHANGE ACT OF 1934 For the transition period from ________ to _________ Commission file number 001-36479 VERITIV CORPORATION (Exact name of registrant as specified in its charter) Delaware 46-3234977 (State or other jurisdiction of incorporation or organization) (I.R.S. Employer Identification Number) 1000 Abernathy Road NE Building 400, Suite 1700 Atlanta, Georgia 30328 (Address of principal executive offices) (Zip Code) (770) 391-8200 (Registrant's telephone number, including area code) Not Applicable (Former name, former address and former fiscal year, if changed since last report) Indicate by check mark whether the registrant (1) has filed all reports required to be filed by Section 13 or 15(d) of the Securities Exchange Act of 1934 during the preceding 12 months (or for such shorter period that the registrant was required to file such reports), and (2) has been subject to such filing requirements for the past 90 days. Yes ☒ No ☐ Indicate by check mark whether the registrant has submitted electronically and posted on its corporate Web site, if any, every Interactive Data File required to be submitted and posted pursuant to Rule 405 of Regulation S-T (§232.405 of this chapter) during the preceding 12 months (or for such shorter period that the registrant was required to submit and post such files). Yes ☒ No ☐ Indicate by check mark whether the registrant is a large accelerated filer, an accelerated filer, a non-accelerated filer, smaller reporting company, or an emerging growth company. See the definitions of "large accelerated filer", "accelerated filer", "smaller reporting company", and "emerging growth company" in Rule 12b-2 of the Exchange Act. Large accelerated filer ☐ Accelerated filer ☒ Non-accelerated filer ☐ (Do not check if a smaller reporting company) Smaller reporting company ☐ Emerging growth company ☐ If an emerging growth company, indicate by check mark if the registrant has elected not to use the extended transition period for complying with any new or revised financial accounting standards provided pursuant to Section 13(a) of the Exchange Act. ☐ Indicate by check mark whether the registrant is a shell company (as defined in Rule 12b-2 of the Act). Yes ☐ No ☒ The number of shares outstanding of the registrant's common stock as of November 2, 2017 was 15,700,204 .
Transcript of VERITIV CORPORATIONd18rn0p25nwr6d.cloudfront.net/CIK-0001599489/24850812-e... · 2017-11-07 · ......

UNITED STATESSECURITIES AND EXCHANGE COMMISSION
Washington, D.C. 20549
FORM 10-Q☒☒ QUARTERLY REPORT PURSUANT TO SECTION 13 OR 15(d) OF THE SECURITIES EXCHANGE ACT OF 1934
For the quarterly period ended September 30, 2017
OR
☐☐ TRANSITION REPORT PURSUANT TO SECTION 13 OR 15(d) OF THE SECURITIES EXCHANGE ACT OF 1934For the transition period from ________ to _________
Commission file number 001-36479
VERITIV CORPORATION(Exact name of registrant as specified in its charter)
Delaware 46-3234977(State or other jurisdiction of incorporation or
organization) (I.R.S. Employer Identification
Number)
1000 Abernathy Road NE Building 400, Suite 1700
Atlanta, Georgia 30328
(Address of principal executive offices) (Zip Code)
(770) 391-8200(Registrant's telephone number, including area code)
Not Applicable(Former name, former address and former fiscal year, if changed since last report)
Indicate by check mark whether the registrant (1) has filed all reports required to be filed by Section 13 or 15(d) of the Securities Exchange Act of 1934 during thepreceding 12 months (or for such shorter period that the registrant was required to file such reports), and (2) has been subject to such filing requirements for thepast 90 days. Yes ☒☒ No ☐☐
Indicate by check mark whether the registrant has submitted electronically and posted on its corporate Web site, if any, every Interactive Data File required to besubmitted and posted pursuant to Rule 405 of Regulation S-T (§232.405 of this chapter) during the preceding 12 months (or for such shorter period that theregistrant was required to submit and post such files). Yes ☒☒ No ☐☐
Indicate by check mark whether the registrant is a large accelerated filer, an accelerated filer, a non-accelerated filer, smaller reporting company, or an emerginggrowth company. See the definitions of "large accelerated filer", "accelerated filer", "smaller reporting company", and "emerging growth company" in Rule 12b-2of the Exchange Act.
Large accelerated filer ☐☐ Accelerated filer ☒☒
Non-accelerated filer☐☐ (Do not check if a smaller reporting company)
Smaller reporting company ☐☐
Emerging growth company ☐☐
If an emerging growth company, indicate by check mark if the registrant has elected not to use the extended transition period for complying with any new orrevised financial accounting standards provided pursuant to Section 13(a) of the Exchange Act. ☐☐
Indicate by check mark whether the registrant is a shell company (as defined in Rule 12b-2 of the Act). Yes ☐☐ No ☒☒
The number of shares outstanding of the registrant's common stock as of November 2, 2017 was 15,700,204 .

TABLE OF CONTENTS
PagePart I: FINANCIAL INFORMATION Item 1. Financial Statements (Unaudited) 1 Condensed Consolidated Statements of Operations for the three and nine months ended September 30, 2017 and 2016 1
Condensed Consolidated Statements of Comprehensive Income (Loss) for the three and nine months ended September 30, 2017 and2016
2
Condensed Consolidated Balance Sheets as of September 30, 2017 and December 31, 2016 3 Condensed Consolidated Statements of Cash Flows for the nine months ended September 30, 2017 and 2016 4 Notes to Condensed Consolidated Financial Statements 5Item 2. Management's Discussion and Analysis of Financial Condition and Results of Operations 24Item 3. Quantitative and Qualitative Disclosures About Market Risk 35Item 4. Controls and Procedures 35
Part II: OTHER INFORMATION Item 1. Legal Proceedings 36Item 1A. Risk Factors 36Item 6. Exhibits 36SIGNATURES 37

Table of Contents
PART I. FINANCIAL INFORMATION
ITEM 1. FINANCIAL STATEMENTS (UNAUDITED)
VERITIV CORPORATIONCONDENSED CONSOLIDATED STATEMENTS OF OPERATIONS
(in millions, except per share data, unaudited)
Three Months Ended
September 30,Nine Months Ended
September 30, 2017 2016 2017 2016
Net sales (including sales to related party of $8.6, $8.5, $24.9 and $26.6,respectively) $ 2,116.8 $ 2,126.6 $ 6,140.3 $ 6,207.2
Cost of products sold (including purchases from related party of $45.7,$71.4, $138.0 and $174.3, respectively) (exclusive of depreciation andamortization shown separately below)
1,736.6 1,743.8 5,026.4 5,086.2
Distribution expenses 132.0 126.0 380.9 375.2Selling and administrative expenses 228.7 207.3 650.4 615.9Depreciation and amortization 13.1 13.4 39.9 40.5Acquisition and integration expenses 14.2 7.3 28.1 19.6Restructuring charges 2.7 5.8 30.0 7.2Operating income (loss) (10.5) 23.0 (15.4) 62.6Interest expense, net 8.3 8.2 22.1 21.1Other expense, net (0.5) 1.2 1.2 6.3Income (loss) before income taxes (18.3) 13.6 (38.7) 35.2Income tax expense (benefit) (4.0) 8.0 (13.1) 18.4Net income (loss) $ (14.3) $ 5.6 $ (25.6) $ 16.8
Earnings (loss) per share:
Basic earnings (loss) per share $ (0.91) $ 0.35 $ (1.63) $ 1.05 Diluted earnings (loss) per share $ (0.91) $ 0.34 $ (1.63) $ 1.04
Weighted average shares outstanding: Basic 15.70 16.00 15.70 16.00Diluted 15.70 16.27 15.70 16.05
See accompanying Notes to Condensed Consolidated Financial Statements.
1

Table of Contents
VERITIV CORPORATIONCONDENSED CONSOLIDATED STATEMENTS OF COMPREHENSIVE INCOME (LOSS)
(in millions, unaudited)
Three Months Ended
September 30, Nine Months Ended
September 30, 2017 2016 2017 2016Net income (loss) $ (14.3) $ 5.6 $ (25.6) $ 16.8Other comprehensive income (loss): Foreign currency translation adjustments 2.4 (1.6) 7.8 0.6Change in fair value of cash flow hedge, net of $0.1, $0.0, $0.1 and $0.2tax, respectively 0.1 0.0 0.0 (0.3)
Pension liability adjustments, net of $0.0, $0.0, $0.0 and $0.1 tax,respectively 0.0 0.0 0.1 0.2
Other comprehensive income (loss) 2.5 (1.6) 7.9 0.5
Total comprehensive income (loss) $ (11.8) $ 4.0 $ (17.7) $ 17.3
See accompanying Notes to Condensed Consolidated Financial Statements.
2

Table of Contents
VERITIV CORPORATIONCONDENSED CONSOLIDATED BALANCE SHEETS
(dollars in millions, except par value, unaudited)
September 30, 2017 December 31, 2016Assets Current assets: Cash $ 76.5 $ 69.6Accounts receivable, less allowances of $45.2 and $34.5, respectively 1,165.1 1,048.3Related party receivable 3.8 3.9Inventories 772.6 707.9Other current assets 134.7 118.9
Total current assets 2,152.7 1,948.6Property and equipment (net of depreciation and amortization of $317.9 and $292.8, respectively) 341.5 371.8Goodwill 105.3 50.2Other intangibles, net 68.3 21.0Deferred income tax assets 76.3 61.8Other non-current assets 31.0 30.3
Total assets $ 2,775.1 $ 2,483.7
Liabilities and shareholders' equity Current liabilities: Accounts payable $ 696.3 $ 654.1
Related party payable 11.2 9.0
Accrued payroll and benefits 61.5 84.4Other accrued liabilities 130.1 102.5Current maturities of long-term debt 1.8 2.9Financing obligations, current portion (including obligations to related party of $10.4 and$14.9, respectively) 11.1 14.9
Total current liabilities 912.0 867.8Long-term debt, net of current maturities 972.0 749.2Financing obligations, less current portion (including obligations to related party of $155.2 and$176.1, respectively) 181.9 176.1
Defined benefit pension obligations 25.3 27.6Other non-current liabilities 148.2 121.2Total liabilities 2,239.4 1,941.9
Commitments and contingencies (Note 12) Shareholders' equity: Preferred stock, $0.01 par value, 10.0 million shares authorized, none issued — —Common stock, $0.01 par value, 100.0 million shares authorized, 16.0 million shares issued;shares outstanding - 15.7 million at September 30, 2017 and December 31, 2016 respectively 0.2 0.2
Additional paid-in capital 586.1 574.5Accumulated earnings (deficit) (5.9) 19.7Accumulated other comprehensive loss (31.1) (39.0)
Treasury stock at cost - 0.3 million shares at September 30, 2017 and December 31, 2016 (13.6) (13.6)Total shareholders' equity 535.7 541.8
Total liabilities and shareholders' equity $ 2,775.1 $ 2,483.7
See accompanying Notes to Condensed Consolidated Financial Statements.
3

Table of Contents
VERITIV CORPORATIONCONDENSED CONSOLIDATED STATEMENTS OF CASH FLOWS
(in millions, unaudited)
Nine Months Ended September 30,Operating activities 2017 2016Net income (loss) $ (25.6) $ 16.8Depreciation and amortization 39.9 40.5
Amortization of deferred financing fees 1.9 4.9
Net losses (gains) on dispositions of property and equipment (4.0) (2.7)
Long-lived asset impairment charges 8.4 4.0
Provision for allowance for doubtful accounts 11.6 0.4
Deferred income tax provision (benefit) (14.3) 8.1
Stock-based compensation 11.6 7.2
Other non-cash items, net 2.5 4.7
Changes in operating assets and liabilities
Accounts receivable and related party receivable (87.5) (48.6)
Inventories (17.9) 19.9Other current assets (6.7) (8.5)Accounts payable and related party payable 69.6 38.5
Accrued payroll and benefits (23.4) (39.9)Other accrued liabilities 8.9 3.6Other 7.3 11.0
Net cash provided by (used for) operating activities (17.7) 59.9Investing activities Property and equipment additions (26.0) (29.8)Proceeds from asset sales 23.1 5.1Cash paid for purchase of business, net of cash acquired (144.8) —
Net cash used for investing activities (147.7) (24.7)Financing activities Change in book overdrafts (43.9) 32.9Borrowings of long-term debt 3,685.2 3,394.4Repayments of long-term debt (3,446.5) (3,439.0)Payments under equipment capital lease obligations (2.2) (2.3)Payments under financing obligations (including obligations to related party of $11.5 and $14.4,respectively) (12.9) (14.4)
Deferred financing fees — (2.0)Payments under Tax Receivable Agreement (8.5) —
Net cash provided by (used for) financing activities 171.2 (30.4)Effect of exchange rate changes on cash 1.1 0.0Net change in cash 6.9 4.8Cash at beginning of period 69.6 54.4Cash at end of period $ 76.5 $ 59.2
Supplemental cash flow information
Cash paid for income taxes, net of refunds $ 3.2 $ 3.1Cash paid for interest 19.4 15.5
Non-cash investing and financing activitiesNon-cash additions to property and equipment $ 8.6 $ 12.3Contingent consideration for purchase of business: Earn-out 30.0 —
See accompanying Notes to Condensed Consolidated Financial Statements.
4


Table of ContentsVERITIV CORPORATION
NOTES TO CONDENSED CONSOLIDATED FINANCIAL STATEMENTS
1. BUSINESS AND SUMMARY OF SIGNIFICANT ACCOUNTING POLICIES
Description of Business
Veritiv Corporation ("Veritiv" or the "Company") is a North American business-to-business distributor of packaging, facility solutions, print andpublishing products and services. Additionally, Veritiv provides logistics and supply chain management solutions to its customers. Veritiv was established in 2014,following the merger (the "Merger") of International Paper Company's xpedx distribution solutions business ("xpedx") and UWW Holdings, Inc. ("UWWH"), theparent company of Unisource Worldwide, Inc. ("Unisource").
Veritiv operates from approximately 170 distribution centers primarily throughout the U.S., Canada and Mexico.
Basis of Presentation
The accompanying unaudited Condensed Consolidated Financial Statements have been prepared in accordance with U.S. generally accepted accountingprinciples ("U.S. GAAP") for interim financial information and with the instructions to Article 10 of Regulation S-X. Accordingly, they do not include all of theinformation and footnotes required by U.S. GAAP for a complete set of annual audited financial statements.
The accompanying unaudited financial information should be read in conjunction with the Consolidated and Combined Financial Statements and Notescontained in the Company's Annual Report on Form 10-K filed with the Securities and Exchange Commission for the year ended December 31, 2016 . In theopinion of management, all adjustments, including normal recurring accruals and other adjustments, considered necessary for a fair presentation of the interimfinancial information have been included. The operating results for the interim periods are not necessarily indicative of results for the full year.
All significant intercompany transactions between Veritiv's businesses have been eliminated.
Use of Estimates
The preparation of unaudited financial statements in conformity with U.S. GAAP requires management to make estimates and assumptions that affect thereported amounts of assets and liabilities, revenue and expenses and certain financial statement disclosures. Estimates and assumptions are used for, but not limitedto, revenue recognition, accounts receivable valuation, inventory valuation, employee benefit plans, income tax contingency accruals and valuation allowances,multi-employer pension plan withdrawal liabilities and goodwill and other intangible asset valuations. Although these estimates are based on management'sknowledge of current events and actions it may undertake in the future, actual results may ultimately differ from these estimates and assumptions. Estimates arerevised as additional information becomes available.
5

Table of Contents
RecentlyIssuedAccountingStandardsNotYetAdopted
Standard Description Effective Date Effect on the Financial Statements or Other
Significant Matters
Accounting Standards Update("ASU") 2014-09, Revenue fromContracts with Customers(Topic 606)
The standard will replace existing revenue recognitionstandards and significantly expand the disclosurerequirements for revenue arrangements. It may be adoptedeither retrospectively or on a modified retrospective basisto new contracts and existing contracts with remainingperformance obligations as of the effective date.
January 1, 2018;early adoption dateis no earlier than theannual periodbeginning afterDecember 15, 2016
The Company’s analysis of the impact of this standardis ongoing. Focus areas include the impacts ofaccounting for customer dedicated inventory andprincipal/agent considerations. During the third quarter,work continued on the disclosure requirements andinternal control assessments. As the analysis is not yetcomplete, the Company cannot provide a financialimpact assessment at this time, nor provide adetermination as to the effect of the new standard on itsinternal control over financial reporting and otherchanges in business practices and processes. TheCompany anticipates applying the modifiedretrospective method of adoption. The Company willadopt this ASU on January 1, 2018.
ASU 2016-02, Leases (Topic842)
The standard requires lessees to put most leases on theirbalance sheet but recognize expenses in their statement ofoperations in a manner similar to current accountingguidance. The new standard also eliminates the currentguidance related to real estate specific provisions. Theguidance requires application on a modified retrospectivebasis to leases that existed at the beginning of the earliestperiod presented and those entered into thereafter but priorto the effective date. The standard permits entities to elect apackage of practical expedients which must be appliedconsistently to all leases that commenced prior to theeffective date. If the package of practical expedients iselected, entities do not need to reassess: (i) whether expiredor existing contracts contain leases; (ii) lease classificationfor any expired or existing leases; and (iii) initial directcosts for any existing leases. The guidance also allowsentities to make certain policy elections under the newstandard, including: (i) the use of hindsight to determinelease term and when assessing existing right of use assetsfor impairment; (ii) a policy to not record short-term leaseson the balance sheet; and (iii) a policy to not separate leaseand non-lease components.
January 1, 2019;early adoption ispermitted
The Company is currently evaluating this standard andanticipates that its adoption will have a material impacton the Consolidated Financial Statements and relateddisclosures as it will result in recording virtually alloperating leases on the balance sheet as a leaseobligation and right of use asset. The Company’spreliminary assessment has focused on systemreadiness and the policy elections and practicalexpedients permitted by the standard. Lease softwarehas been implemented that will better enable theCompany to implement the standard. The Companycurrently anticipates electing to apply the package ofpractical expedients to all leases that commenced priorto the date of adoption. Based on the analysisperformed to date, the Company anticipates making apolicy election to not include short-term leases on theConsolidated Balance Sheets and to separate lease andnon-lease components. A decision has not been maderegarding the use of hindsight when determining leaseterm and assessing existing right of use assets forimpairment. The assessment is ongoing and thepreliminary conclusions are subject to change. At thistime the Company is unable to quantify the impact thatthe adoption of this standard will have on theConsolidated Financial Statements and relateddisclosures. The Company currently plans to adopt thisASU on January 1, 2019.
6

Table of Contents
RecentlyIssuedAccountingStandardsNotYetAdopted(continued)
Standard Description Effective Date Effect on the Financial Statements or Other
Significant Matters
ASU 2016-13, FinancialInstruments-Credit Losses(Topic 326)
The standard will replace the currently required incurredloss impairment methodology with guidance that reflectsexpected credit losses and requires consideration of abroader range of reasonable and supportable information tobe considered in making credit loss estimates. Theguidance requires application on a modified retrospectivebasis. Other application requirements exist for specificassets impacted by a more-than-insignificant creditdeterioration since origination.
January 1, 2020;early adoption ispermitted for fiscalyears beginningafter December 15,2018
The Company is currently evaluating the impact thisASU will have on its Consolidated FinancialStatements and related disclosures. The Companycurrently plans to adopt this ASU on January 1, 2020.
ASU 2016-15, Statement ofCash Flows (Topic 230)
The standard addresses eight specific cash flow issues andis intended to reduce diversity in practice in how certaincash receipts and cash payments are presented andclassified in the statement of cash flows. The guidancerequires application on a retrospective basis.
January 1, 2018;early adoption ispermitted (earlyadoption requiresthe adoption of allamendments in thesame period)
The Company is currently evaluating the impact thisASU will have on its Consolidated FinancialStatements and related disclosures; the impact is notexpected to be material. The Company will adopt thisASU on January 1, 2018.
ASU 2017-01, BusinessCombinations (Topic 805)
The standard clarifies the definition of a business with theobjective of adding guidance to assist entities withevaluating whether transactions should be accounted for asacquisitions (or disposals) of assets or businesses. Theguidance requires application on a prospective basis.
January 1, 2018;early adoption ispermitted
The Company will adopt this ASU on January 1, 2018.
ASU 2017-07, Compensation-Retirement Benefits (Topic 715)
The standard requires employers to disaggregate theservice cost component from the other components of netbenefit cost and disclose the amount of net benefit cost thatis included in the income statement or capitalized in assets,by line item. The standard requires employers to report theservice cost component in the same line item(s) as othercompensation costs and to report other pension-relatedcosts (which include interest costs, amortization ofpension-related costs from prior periods and the gains orlosses on plan assets) separately and exclude them from thesubtotal of operating income. The standard also allows onlythe service cost component to be eligible for capitalizationwhen applicable. The guidance requires application on aretrospective basis for the presentation of the service costcomponent and the other components of net periodicpension cost and net periodic postretirement benefit cost inthe income statement and on a prospective basis for thecapitalization of the service cost component of net periodicpension cost and net periodic postretirement benefit inassets.
January 1, 2018;early adoption ispermitted as of thefirst interim periodof an annual periodfor which interim orannual financialstatements have notbeen issued
The Company is currently making its assessment of theimpact that this ASU will have on its ConsolidatedFinancial Statements and related disclosures usingresults from 2016 and year-to-date 2017; the impact isnot expected to be material. The Company will adoptthis ASU on January 1, 2018.
7

Table of Contents
RecentlyAdoptedAccountingStandards
Standard Description Effective Date Effect on the Financial Statements or
Other Significant Matters
ASU 2015-11, Inventory -Simplifying the Measurement ofInventory (Topic 330)
The standard requires companies to measure inventory at the lower ofcost and net realizable value, thereby simplifying the current guidanceunder which an entity must measure inventory at the lower of cost ormarket. This ASU does not apply to inventories measured by either thelast-in first-out ("LIFO") method or retail inventory method. Theguidance requires application on a prospective basis.
January 1, 2017
The Company adopted this ASU onJanuary 1, 2017. The adoption did notmaterially impact its ConsolidatedFinancial Statements or relateddisclosures. As of September 30, 2017,approximately 87% of the inventorybalance was measured using LIFO.
ASU 2017-04, Intangibles -Goodwill and Other (Topic 350)
The standard simplifies how an entity is required to test goodwill forimpairment by eliminating Step 2 from the goodwill impairment test.Step 2 measures a goodwill impairment loss by comparing the impliedfair value of a reporting unit’s goodwill with the carrying amount ofthat goodwill. The guidance requires application on a prospective basis.
January 1, 2020;early adoption ispermitted
The Company adopted this ASU onJanuary 1, 2017.
ASU 2017-09, Compensation -Stock Compensation (Topic 718)
The standard clarifies the changes to the terms and conditions of ashare-based payment award that require an entity to apply modificationaccounting. The guidance requires application on a prospective basis.
January 1, 2018;early adoption is
permitted
The Company adopted this ASU on April1, 2017. The adoption did not materiallyimpact its Consolidated FinancialStatements or related disclosures.
2. 2017 ACQUISITION
Acquisition of All American Containers - August 2017
On August 31, 2017 (the "Acquisition Date"), Veritiv completed its acquisition of 100% of the equity interest in various All American Containers entities(collectively, "AAC"), a family owned and operated distributor of rigid packaging, including plastic, glass and metal containers, caps, closures and plastic pouches.The acquisition of AAC aligns with the Company's strategy of investing in higher growth and higher margin segments of the business. Through the acquisition,Veritiv gains expertise in rigid plastic, glass and metal packaging that complements its portfolio of packaging products and services. This acquisition also providesVeritiv with additional marketing, selling and distribution channels into the growing U.S. rigid packaging market. The rigid packaging market's primary productcategories include paperboard, plastics, metals and glass.
Acquisition-related costs of approximately $6.3 million were expensed as incurred. These costs were recognized in acquisition and integration expenses
on the Condensed Consolidated Statements of Operations for the three and nine months ended September 30, 2017 . These charges are included in the table in Note3, Acquisition, Integration and Restructuring Charges and related primarily to legal, consulting and other professional fees, and retention.
The acquisition of AAC was accounted for in the Company's financial statements using the acquisition method of accounting. The total consideration tocomplete the acquisition was approximately $176.6 million . Due to the limited amount of time since the acquisition of AAC, the valuation of certain assets andliabilities is preliminary and, as management receives additional information during the measurement period, these assets and liabilities may be adjusted. Thepreliminary purchase price was allocated to tangible and intangible assets and liabilities based upon their respective estimated fair values. The following tablesummarizes the components of the preliminary estimated purchase price for AAC:
8

Table of Contents
Preliminary estimated purchase price:
(in millions)Cash consideration $ 112.0Repayment of loans 34.3Contingent consideration: Earn-out 30.0Contingent bonus tax payment 0.3
Total preliminary estimated purchase price $ 176.6
The following table summarizes the allocation of the preliminary estimated purchase price to assets acquired and liabilities assumed as of the AcquisitionDate based on valuation information, estimates and assumptions available on September 30, 2017 . See Note 4, Goodwill and Other Intangible Assets , foradditional information related to the goodwill and intangible assets acquired in the AAC acquisition. See Note 9, Fair Value Measurements , for additionalinformation related to the fair value of the contingent consideration related to the earn-out.
Preliminary allocation:
(in millions)Cash $ 1.5Accounts receivable 30.4Inventories 39.2Other current assets 5.7Property and equipment 2.2Goodwill 61.2Other intangible assets 51.2Other non-current assets 0.9Accounts payable (12.4)Other current liabilities (2.7)Other non-current liabilities (0.6)
Total preliminary estimated purchase price $ 176.6
The amounts shown above may change as the purchase price will be based upon finalization of customary working capital adjustments and valuation ofthe contingent liability associated with the earn-out. The Company is still in the process of verifying data and finalizing information related to the valuation andexpects to finalize these matters within the measurement period as final asset and liability valuations are completed.
Actual and Pro Forma Impact (unaudited)
The operating results of AAC are included in the Company's financial statements from September 1, 2017 through September 30, 2017 . Net sales andpre-tax loss attributable to AAC during this period and included in the Company's Condensed Consolidated Statements of Operations were $16.0 million and ($0.9)million , respectively.
The following unaudited pro forma financial information presents results as if the acquisition of AAC occurred on January 1, 2016. The historicalconsolidated financial information of the Company and AAC has been adjusted in the pro forma information to give effect to pro forma events that are directlyattributable to the transaction and are factually supportable. The unaudited pro forma results do not reflect events that have occurred or may occur after thetransaction, including the impact of any synergies expected to result from the acquisition. Accordingly, the unaudited pro forma financial information is notnecessarily indicative of the results of operations as they would have been had the transaction been effected on the assumed date, nor is it necessarily an indicationof future operating results.
9

Table of Contents
(Unaudited) Three Months Ended September 30, Nine Months Ended September 30,(in millions, except share and per share data) 2017 2016 2017 2016Net sales $ 2,157.8 $ 2,181.9 $ 6,303.2 $ 6,378.3Net income (loss) (11.3) 5.4 (21.5) 12.0Earnings (loss) per share: Basic earnings (loss) per share $ (0.72) $ 0.34 $ (1.37) $ 0.75Diluted earnings (loss) per share $ (0.72) $ 0.33 $ (1.37) $ 0.75
Weighted-average shares outstanding Basic 15.70 16.00 15.70 16.00Diluted 15.70 16.27 15.70 16.05
The unaudited pro forma information reflects primarily the following pre-tax adjustments for the respective periods:- Acquisition and integration expenses: Acquisition and integration expenses of $6.9 million and $7.4 million incurred during
the three and nine months ended September 30, 2017 , respectively, have been eliminated. Pro forma net income for the three and nine monthsended September 30, 2016 includes acquisition and integration expenses of $0.0 million and $7.4 million , respectively.
- Incremental amortization expense: Pro forma net income for the three and nine months ended September 30, 2017 includesincremental amortization expense of $1.1 million and $4.4 million , respectively. Pro forma net income for the three and nine months endedSeptember 30, 2016 includes incremental amortization expense of $1.7 million and $5.0 million , respectively.
- Interest expense: Pro forma net income for the three and nine months ended September 30, 2017 includes incremental interest expenseof $0.5 million and $2.0 million , respectively. Pro forma net income for the three and nine months ended September 30, 2016 includesincremental interest expense of $0.6 million and $1.8 million , respectively.
A combined U.S. federal statutory and state rate of 39.0% was used to determine the after-tax impact on net income of the pro forma adjustments.
3. ACQUISITION, INTEGRATION AND RESTRUCTURING CHARGES
Merger of xpedx and Unisource
The Company currently expects net costs and charges associated with achieving anticipated cost savings and other synergies from the Merger (excludingcharges relating to the complete or partial withdrawal from multi-employer pension plans ("MEPP"), some of which are uncertain at this time, and including cashproceeds from sales of assets related to consolidation), to be approximately $225 million to $250 million through December 31, 2018. Included in the estimate isapproximately $105 million for capital expenditures, primarily consisting of information technology infrastructure, systems integration and planning. ThroughSeptember 30, 2017 , the Company has incurred approximately $233 million in costs and charges, including approximately $78 million for capital expenditures.
During the three and nine months ended September 30, 2017 and 2016 , Veritiv incurred costs and charges related primarily to: internally dedicated
integration management resources, retention compensation, information technology conversion costs, rebranding, professional services and other costs to integrateits businesses.
10

Table of Contents
The following table summarizes the components of acquisition and integration expenses:
Three Months Ended
September 30, Nine Months Ended
September 30,(in millions) 2017 2016 2017 2016Integration management $ 3.8 $ 2.2 $ 10.5 $ 6.0Retention compensation — 0.4 0.2 2.4Information technology conversion costs 2.8 1.9 6.8 4.3Rebranding 0.1 0.9 0.4 2.1Legal, consulting and other professional fees 0.4 0.8 1.3 1.8Other 0.6 1.1 2.4 3.0AAC acquisition and integration 6.5 — 6.5 —
Total acquisition and integration expenses $ 14.2 $ 7.3 $ 28.1 $ 19.6
Veritiv Restructuring Plan
As part of the Merger, the Company is executing on a multi-year restructuring program of its North American operations intended to integrate the legacyxpedx and Unisource operations, generate cost savings and capture synergies across the combined company. The restructuring plan includes initiatives to: (i)consolidate warehouse facilities in overlapping markets, (ii) improve efficiency of the delivery network, (iii) consolidate customer service centers, (iv) reorganizethe field sales and operations functions and (v) restructure the corporate general and administrative functions. As part of its restructuring efforts, the Companycontinues to evaluate its operations outside of North America to identify additional cost saving opportunities. The Company may elect to restructure its operationsin specific countries, which may include staff reductions, lease terminations and facility closures or the complete exit of a market. The Company may continue torecord restructuring charges in the future as restructuring activities progress, which may include gains or losses from the disposition of assets. As of September 30,2017 , the Company held for sale $4.2 million in assets related to these activities, which are included in other current assets on the Condensed ConsolidatedBalance Sheets.
Related to these company-wide initiatives, the Company recorded restructuring charges of $2.7 million and $5.8 million for the three months endedSeptember 30, 2017 and 2016 , respectively, and restructuring charges of $30.0 million and $7.2 million for the nine months ended September 30, 2017 and 2016 ,respectively. The increase in charges for the nine months ended September 30, 2017 over the same period in 2016 primarily related to: (i) an estimated $15.5million in MEPP withdrawals, (ii) $4.1 million in severance costs and (iii) other facility relocation and related support costs. See Note 13, Segment Information,for the impact these charges had on the Company's reportable segments. Other direct costs reported in the tables below include facility closing costs and otherincidental costs associated with the development, communication, administration and implementation of these initiatives.
The following is a summary of the Company's restructuring activity for the three and nine months ended September 30, 2017 :
(in millions)Severance and Related
Costs Other Direct
Costs TotalBalance at December 31, 2016 $ 1.8 $ 8.0 $ 9.8
Costs incurred 1.4 3.1 4.5Payments (1.2) (2.8) (4.0)
Balance at March 31, 2017 2.0 8.3 10.3Costs incurred 3.9 19.7 23.6Payments (2.0) (5.4) (7.4)
Balance at June 30, 2017 3.9 22.6 26.5Costs incurred 0.7 3.8 4.5Payments (0.7) (4.7) (5.4)
Balance at September 30, 2017 $ 3.9 $ 21.7 $ 25.6
11

Table of Contents
In addition, the Company recognized net non-cash gains of $1.8 million and $2.6 million related to vacating certain of its facilities for the three and ninemonths ended September 30, 2017 , respectively.
The following is a summary of the Company's restructuring activity for the three and nine months ended September 30, 2016 :
(in millions)Severance and Related
Costs Other Direct Costs TotalBalance at December 31, 2015 $ 1.7 $ 0.4 $ 2.1
Costs incurred 0.7 0.3 1.0Payments (0.9) (0.4) (1.3)
Balance at March 31, 2016 1.5 0.3 1.8Costs incurred 0.9 1.5 2.4Payments (0.6) (1.0) (1.6)
Balance at June 30, 2016 1.8 0.8 2.6Costs incurred 0.3 5.4 5.7Payments (1.0) (0.7) (1.7)
Balance at September 30, 2016 $ 1.1 $ 5.5 $ 6.6
In addition, the Company recognized a net non-cash loss of $0.1 million and a net non-cash gain of $1.9 million related to vacating certain of its facilitiesfor the three and nine months ended September 30, 2016 , respectively.
4. GOODWILL AND OTHER INTANGIBLE ASSETS
Goodwill
At September 30, 2017 , the Company's net goodwill balance was $105.3 million . The following table sets forth the changes in the carrying amount ofgoodwill during the three and nine months ended September 30, 2017 :
(in millions) Packaging Corporate & Other TotalBalance at December 31, 2016: Goodwill $ 44.1 $ 6.1 $ 50.2 Accumulated impairment losses — — — Net goodwill 2016 44.1 6.1 50.22017 Activity: Goodwill acquired 61.2 — 61.2 Impairment of goodwill — (6.1) (6.1)Balance at September 30, 2017: Goodwill 105.3 6.1 111.4 Accumulated impairment losses — (6.1) (6.1)
Net goodwill at September 30, 2017 $ 105.3 $ — $ 105.3
Preliminary goodwill of $61.2 million arising from the acquisition of AAC, as described in Note 2, 2017 Acquisition , consists largely of the expectedsynergies and other benefits from combining operations and is expected to be deductible for tax purposes. The goodwill was allocated 100% to the Company'sPackaging segment.
During the third quarter of 2017, as part of the Company's review for possible goodwill impairment indicators, management determined that the goodwillallocated to the logistics solutions business was fully impaired. The impairment was recorded as selling and administrative expense in the Condensed ConsolidatedStatements of Operations. See Note 9,
12

Table of Contents
Fair Value Measurements , for additional information related to the impairment. As the asset had no remaining net book value or useful life, both the gross valueand accumulated amortization value were removed from the Company’s ledger.
Other Intangible Assets
The components of the Company's other intangible assets were as follows:
September 30, 2017 December 31, 2016
(in millions)Gross Carrying
Amount AccumulatedAmortization Net
Gross CarryingAmount
AccumulatedAmortization Net
Customer relationships $ 64.9 $ 5.0 $ 59.9 $ 23.6 $ 4.0 $ 19.6Trademarks/Trade names 7.8 1.9 5.9 2.7 1.3 1.4Non-compete agreements 2.6 0.1 2.5 — — —
Total $ 75.3 $ 7.0 $ 68.3 $ 26.3 $ 5.3 $ 21.0
The gross carrying amount of other intangible assets increased by $51.2 million as a result of the acquisition of AAC. Due to the limited amount of time
since the acquisition of AAC, the valuation of the identifiable intangible assets is preliminary and based on market benchmark studies. These assets are included inother intangibles, net on the Condensed Consolidated Balance Sheets and are being amortized to operating expense on a straight-line basis ov er their estimateduseful lives. Preliminary allocated values from the AAC acquisition are as follows:
Gross Value (in millions) Estimated Useful Life (in
years)Customer relationships $ 43.5 10Trademarks/Trade names 5.1 5Non-compete agreements 2.6 2
Total identifiable intangible assets acquired $ 51.2
During the third quarter of 2017, the Company recognized a $1.6 million non-restructuring asset impairment charge related to its logistics solutionsbusiness's customer relationship intangible asset, which was recorded in selling and administrative expenses. See Note 9, Fair Value Measurements , for additionalinformation related to the impairment.
5. DEBT AND OTHER OBLIGATIONS
The Company's long-term debt obligations were as follows:
(in millions) September 30, 2017 December 31, 2016Asset-Based Lending Facility (the "ABL Facility") $ 969.3 $ 726.9Equipment capital lease and other obligations 4.5 25.2Total debt 973.8 752.1Less: current maturities of long-term debt (1.8) (2.9)
Long-term debt, net of current maturities $ 972.0 $ 749.2
Availability under the ABL Facility is determined based upon a monthly borrowing base calculation which includes eligible customer receivables andinventory, less outstanding borrowings, letters of credit and certain designated reserves. As of September 30, 2017 , the available additional borrowing capacityunder the ABL Facility was approximately $272.3 million .
The equipment capital lease and other obligations reported in the table above includes $19.1 million related to the accumulated construction costs for theToronto build-to-suit arrangement as of December 31, 2016. This project was completed during the second quarter of 2017 and is accounted for as a financingobligation. As such, for periods beginning
13

Table of Contents
with the second quarter of 2017 the obligation value is shown in the table below as other financing, in addition to the Company's related party financingobligations.
The Company's long-term financing obligations were as follows:
(in millions) September 30, 2017 December 31, 2016Obligations to related party $ 165.6 $ 191.0Obligations - other financing 27.4 —Total financing obligations 193.0 191.0Less: current portion of financing obligations (11.1) (14.9)
Financing obligations, less current portion $ 181.9 $ 176.1
From the Merger through September 30, 2017 , the Company has terminated agreements for 11 of the related party financed properties and thereforetriggered an early termination of each respective property's financing agreement. One of these terminations also involved the purchase of a facility in Austin,Texas. See Note 7, Related Party Transactions , for additional information related to that purchase. Upon termination of a property's financing agreement, theCompany recognizes the non-cash effects of the derecognition of (i) the property and equipment and (ii) the corresponding financing obligation, as other non-cashitems, net, on the Condensed Consolidated Statements of Cash Flows. Any gain or loss realized upon derecognition has been included in other expense, net orrestructuring charges on the Condensed Consolidated Statements of Operations, based upon the rationale for the termination. For the three and nine months endedSeptember 30, 2017 , the non-cash effects related to the derecognition of (i) the property and equipment totaled $5.3 million and $14.6 million , respectively, and(ii) the corresponding financing obligations totaled $5.6 million and $15.2 million respectively. For the nine months ended September 30, 2016 , there was onetermination related to these financed properties, which was the Austin, Texas facility purchase noted above. Unless terminated early, upon the expiration of theterm of the remaining related party financing agreements, the net remaining financing obligation of $155.2 million will be settled by the return of the assets to theowner and has been included in other non-current liabilities on the Condensed Consolidated Balance Sheets.
In May 2017, the Company entered into a purchase and sale agreement under which Veritiv agreed to sell the previously acquired Austin, Texas facilityto an unrelated third party. Upon the closing of the sale, Veritiv entered into a lease of the facility for an initial period of ten years with two optional five -yearrenewal terms. The sale-leaseback transaction does not provide for any continuing involvement by the Company other than a normal lease for use of the propertyduring the lease term. The transaction resulted in net cash proceeds of $9.1 million and a related deferred gain of $5.4 million . The Company expects to recognizethe gain over the initial ten -year lease period on a straight-line basis as a reduction to selling and administrative expenses in the Condensed ConsolidatedStatements of Operations. The current portion of the deferred gain is included in other accrued liabilities and the non-current portion of the deferred gain isincluded in other non-current liabilities on the Condensed Consolidated Balance Sheets.
6. INCOME TAXES
The Company’s provision (benefit) for income taxes for the three and nine months ended September 30, 2017 and 2016 is based on the estimated annualeffective tax rate, plus any discrete items.
The following table presents the provision for income taxes and the effective tax rates for the three and nine months ended September 30, 2017 and 2016 :
Three Months Ended September 30, Nine Months Ended September 30,(in millions) 2017 2016 2017 2016Income (loss) before income taxes $ (18.3) $ 13.6 $ (38.7) $ 35.2Income tax expense (benefit) (4.0) 8.0 (13.1) 18.4Effective tax rate 21.9% 58.8% 33.9% 52.3%
The difference between the Company’s effective tax rates for the three and nine months ended September 30, 2017 and 2016 and the U.S. statutory taxrate of 35.0% primarily relates to non-deductible expenses, state income taxes (net of
14

Table of Contents
federal income tax benefit), and the Company's income (loss) by jurisdiction. Additionally, the effective tax rates for the three and nine months ended September30, 2017 include the benefit of tax credits and the impact of impairing non-deductible goodwill.
In conjunction with the third quarter of 2017 filing of Veritiv's 2016 U.S. federal tax return and amended 2015 and 2014 U.S. federal tax returns, theCompany recognized a $3.1 million benefit for credits related to foreign taxes and research and experimentation activities. Additionally, an estimate of 2017 taxcredits is included in our estimated annual effective tax rate.
The effective tax rate may vary significantly due to potential fluctuations in the amount and source, including both foreign and domestic, of pre-taxincome and changes in amounts of non-deductible expenses and other items.
7. RELATED PARTY TRANSACTIONS
Agreements with the UWWH Stockholder
On March 22, 2017, UWW Holdings, LLC (the "UWWH Stockholder"), one of Veritiv's existing stockholders and the former sole stockholder ofUWWH, sold 1.80 million shares of Veritiv common stock in a block trade. The Company did not sell any shares and did not receive any of the proceeds. Inconjunction with this transaction, Veritiv incurred approximately $0.2 million in transaction-related fees, which are included in selling and administrative expenseson the Condensed Consolidated Statements of Operations. The UWWH Stockholder beneficially owned 27.3% of Veritiv's outstanding common stock as ofSeptember 30, 2017, based on publicly available data.
In January 2017, in connection with the Tax Receivable Agreement ("TRA") executed at the time of the Merger, Veritiv paid $8.7 million total, of which$8.5 million was the principal amount, to the UWWH Stockholder for the utilization of pre-merger net operating losses ("NOL" or "NOLs") in its 2015 federal andstate tax returns. See Note 9, Fair Value Measurements , for additional information regarding the TRA.
Transactions with Georgia-Pacific
Veritiv purchases certain inventory items from, and sells certain inventory items to, Georgia-Pacific in the normal course of business. As a result of theMerger and related private placement, Georgia-Pacific, as joint owner of the UWWH Stockholder, is a related party.
The following tables summarize the financial impact of these related party transactions with Georgia-Pacific:
Three Months Ended September
30, Nine Months Ended
September 30,(in millions) 2017 2016 2017 2016Sales to Georgia-Pacific, reflected in net sales $ 8.6 $ 8.5 $ 24.9 $ 26.6Purchases of inventory from Georgia-Pacific, recognized in cost ofproducts sold 45.7 71.4 138.0 174.3
(in millions) September 30, 2017 December 31, 2016Inventories purchased from Georgia-Pacific that remained on Veritiv's balancesheet $ 23.5 $ 24.8
Related party payable to Georgia-Pacific 11.2 9.0Related party receivable from Georgia-Pacific 3.8 3.9
15
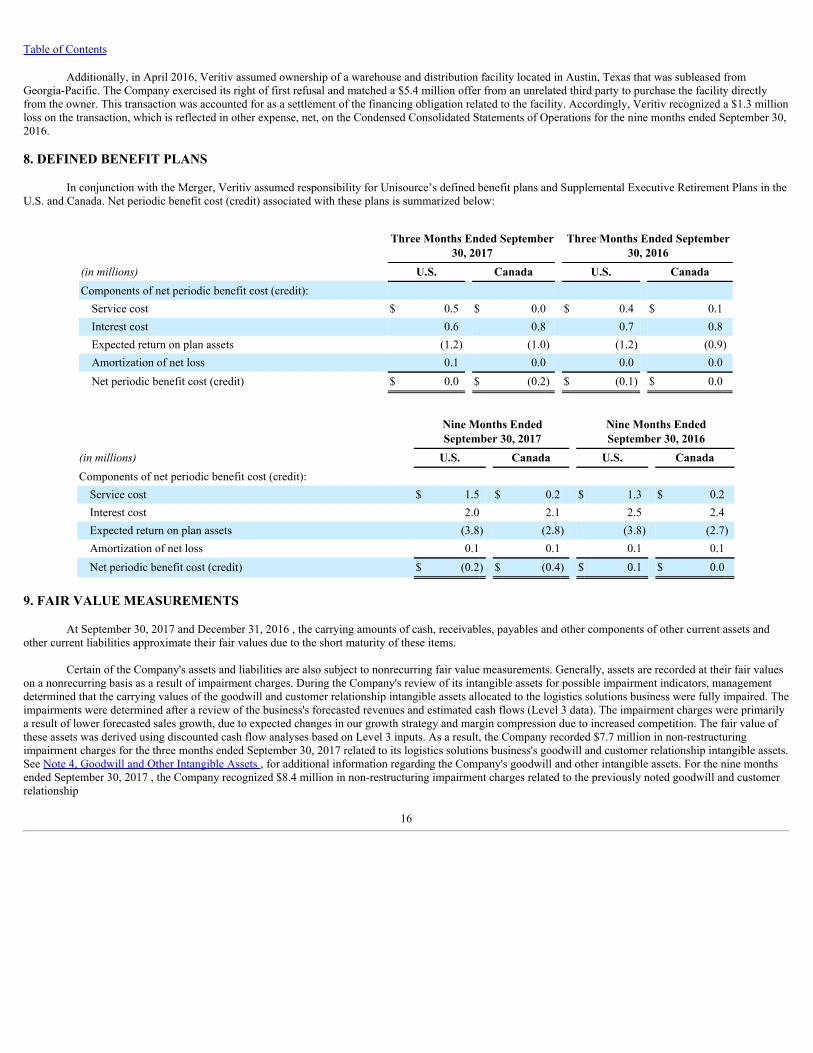
Table of Contents
Additionally, in April 2016, Veritiv assumed ownership of a warehouse and distribution facility located in Austin, Texas that was subleased fromGeorgia-Pacific. The Company exercised its right of first refusal and matched a $5.4 million offer from an unrelated third party to purchase the facility directlyfrom the owner. This transaction was accounted for as a settlement of the financing obligation related to the facility. Accordingly, Veritiv recognized a $1.3 millionloss on the transaction, which is reflected in other expense, net, on the Condensed Consolidated Statements of Operations for the nine months ended September 30,2016.
8. DEFINED BENEFIT PLANS
In conjunction with the Merger, Veritiv assumed responsibility for Unisource’s defined benefit plans and Supplemental Executive Retirement Plans in theU.S. and Canada. Net periodic benefit cost (credit) associated with these plans is summarized below:
Three Months Ended September
30, 2017 Three Months Ended September
30, 2016(in millions) U.S. Canada U.S. CanadaComponents of net periodic benefit cost (credit): Service cost $ 0.5 $ 0.0 $ 0.4 $ 0.1Interest cost 0.6 0.8 0.7 0.8Expected return on plan assets (1.2) (1.0) (1.2) (0.9)Amortization of net loss 0.1 0.0 0.0 0.0Net periodic benefit cost (credit) $ 0.0 $ (0.2) $ (0.1) $ 0.0
Nine Months EndedSeptember 30, 2017
Nine Months EndedSeptember 30, 2016
(in millions) U.S. Canada U.S. CanadaComponents of net periodic benefit cost (credit): Service cost $ 1.5 $ 0.2 $ 1.3 $ 0.2Interest cost 2.0 2.1 2.5 2.4Expected return on plan assets (3.8) (2.8) (3.8) (2.7)Amortization of net loss 0.1 0.1 0.1 0.1Net periodic benefit cost (credit) $ (0.2) $ (0.4) $ 0.1 $ 0.0
9. FAIR VALUE MEASUREMENTS
At September 30, 2017 and December 31, 2016 , the carrying amounts of cash, receivables, payables and other components of other current assets andother current liabilities approximate their fair values due to the short maturity of these items.
Certain of the Company's assets and liabilities are also subject to nonrecurring fair value measurements. Generally, assets are recorded at their fair valueson a nonrecurring basis as a result of impairment charges. During the Company's review of its intangible assets for possible impairment indicators, managementdetermined that the carrying values of the goodwill and customer relationship intangible assets allocated to the logistics solutions business were fully impaired. Theimpairments were determined after a review of the business's forecasted revenues and estimated cash flows (Level 3 data). The impairment charges were primarilya result of lower forecasted sales growth, due to expected changes in our growth strategy and margin compression due to increased competition. The fair value ofthese assets was derived using discounted cash flow analyses based on Level 3 inputs. As a result, the Company recorded $7.7 million in non-restructuringimpairment charges for the three months ended September 30, 2017 related to its logistics solutions business's goodwill and customer relationship intangible assets.See Note 4, Goodwill and Other Intangible Assets , for additional information regarding the Company's goodwill and other intangible assets. For the nine monthsended September 30, 2017 , the Company recognized $8.4 million in non-restructuring impairment charges related to the previously noted goodwill and customerrelationship
16

Table of Contents
intangible asset impairments, as well as a software asset which will not be placed into service and has no alternative use. For the three and nine months endedSeptember 30, 2016 , the Company recognized $3.1 million and $4.0 million , respectively, in non-restructuring impairment charges related to its Publishingsegment's customer relationship intangible asset, software assets and the sale of a facility. The impairment charges for 2017 and 2016 were recorded in selling andadministrative expenses on the Condensed Consolidated Statements of Operations.
The Company's liabilities disclosed at fair value at September 30, 2017 were as follows:
(in millions) Total Level 1 Level 2 Level 3ABL Facility $ 969.3 $ 969.3 Tax Receivable Agreement 61.0 61.0Contingent Consideration: Earn-out 30.0 30.0
The Company's liabilities disclosed at fair value at December 31, 2016 were as follows:
(in millions) Total Level 1 Level 2 Level 3ABL Facility $ 726.9 $ 726.9 Tax Receivable Agreement 67.9 67.9
Borrowings under the ABL Facility are at variable market interest rates and, accordingly, the carrying amount approximates fair value.
At the time of the Merger, the Company recorded a $59.4 million contingent liability associated with the TRA at fair value using a discounted cash flowmodel that reflected management's expectations about probability of payment. The fair value of the TRA is a Level 3 measurement, which relied upon both Level 2data (publicly observable data such as market interest rates) and Level 3 data (internal data such as the Company’s projected revenues, taxable income andassumptions about the utilization of Unisource’s NOLs, attributable to taxable periods prior to the Merger, by the Company). The amount payable under the TRAis contingent on the Company generating a certain level of taxable income prior to the expiration of the NOL carryforwards. Moreover, future trading of Companystock by significant stockholders may result in additional ownership changes as defined under Section 382 of the Internal Revenue Code, further limiting the use ofUnisource's NOLs and the amount ultimately payable under the TRA. The contingent liability is remeasured at fair value at each reporting period end with thechange in fair value recognized in other expense, net on the Condensed Consolidated Statements of Operations. At September 30, 2017 , the Company remeasuredthe contingent liability using a discount rate of 4.3% (Moody's daily long-term corporate BAA bond yield).
The following table provides a reconciliation of the beginning and ending balance of the TRA contingent liability for the three and nine months endedSeptember 30, 2017 :
(in millions) TRA Contingent LiabilityBalance at December 31, 2016 $ 67.9Change in fair value adjustment recorded in other expense, net 0.9Principal payment (8.5)Balance at March 31, 2017 60.3Change in fair value adjustment recorded in other expense, net 1.1Balance at June 30, 2017 61.4Change in fair value adjustment recorded in other expense, net (0.4)
Balance at September 30, 2017 $ 61.0
17

Table of Contents
The following table provides a reconciliation of the beginning and ending balance of the TRA contingent liability for the three and nine months endedSeptember 30, 2016 :
(in millions) TRA Contingent LiabilityBalance at December 31, 2015 $ 63.0Change in fair value adjustment recorded in other expense, net 1.8Balance at March 31, 2016 64.8Change in fair value adjustment recorded in other expense, net 2.0Balance at June 30, 2016 66.8Change in fair value adjustment recorded in other expense, net 1.0
Balance at September 30, 2016 $ 67.8
For the TRA contingent liability, there have been no transfers between the fair value measurement levels for the three and nine months ended September30, 2017 . The Company recognizes transfers between the fair value measurement levels at the end of the reporting period.
The preliminary purchase price allocation for the acquisition of AAC, described in Note 2, 2017 Acquisition , includes $30.0 million for the estimated fairvalue of an earn-out liability. The maximum amount payable for the earn-out is $50.0 million payable in increments at the first and second anniversaries of theAcquisition Date. The final earn-out amount will be determined based on actual growth rates in revenue and gross profit. The preliminary fair value estimate wasbased on historic growth patterns and future forecasts, which are Level 3 data. Valuation inputs also included a discount rate of 8.3% . Actual results may differfrom these estimates.
10. EARNINGS (LOSS) PER SHARE
Basic earnings (loss) per share for Veritiv common stock is calculated by dividing net income (loss) by the weighted average number of shares ofcommon stock outstanding during the period. Diluted earnings per share is similarly calculated, except that the denominator is increased to include the number ofadditional common shares that would have been outstanding if the dilutive potential common shares had been issued, except where the inclusion of such commonshares would have an antidilutive impact.
18

Table of Contents
A summary of the numerators and denominators used in the basic and diluted earnings (loss) per share calculations is as follows:
Three Months Ended
September 30, Nine Months Ended
September 30,(in millions, except per share data) 2017 2016 2017 2016Numerator: Net income (loss) $ (14.3) $ 5.6 $ (25.6) $ 16.8
Denominator: Weighted average number of shares outstanding – basic 15.70 16.00 15.70 16.00Dilutive effect of stock-based awards — 0.27 — 0.05
Weighted average number of shares outstanding – diluted 15.70 16.27 15.70 16.05
Earnings (loss) per share: Basic earnings (loss) per share $ (0.91) $ 0.35 $ (1.63) $ 1.05 Diluted earnings (loss) per share $ (0.91) $ 0.34 $ (1.63) $ 1.04
Antidilutive stock-based awards excluded from computation of diluted earnings per share("EPS") 0.68 0.00 0.66 0.20
Performance stock-based awards excluded from computation of diluted EPS becauseperformance conditions had not been met 0.48 0.33 0.48 0.33
11. ACCUMULATED OTHER COMPREHENSIVE LOSS
The following table provides the components of accumulated other comprehensive loss ("AOCL") at September 30, 2017 (amounts are shown net of theirrelated income tax effect, if any):
(in millions)
Foreign currencytranslation
adjustments Retirementliabilities
Interest rateswap AOCL
Balance at December 31, 2016 $ (29.2) $ (9.1) $ (0.7) $ (39.0) Unrealized net gains (losses) arising during the period 2.8 0.1 (0.1) 2.8Net current period other comprehensive income (loss) 2.8 0.1 (0.1) 2.8Balance at March 31, 2017 (26.4) (9.0) (0.8) (36.2) Unrealized net gains (losses) arising during the period 2.6 — — 2.6Net current period other comprehensive income (loss) 2.6 — — 2.6Balance at June 30, 2017 (23.8) (9.0) (0.8) (33.6) Unrealized net gains (losses) arising during the period 2.4 — — 2.4 Amounts reclassified from AOCL — — 0.1 0.1Net current period other comprehensive income (loss) 2.4 — 0.1 2.5
Balance at September 30, 2017 $ (21.4) $ (9.0) $ (0.7) $ (31.1)
19

Table of Contents
The following table provides the components of AOCL at September 30, 2016 (amounts are shown net of their related income tax effect, if any):
(in millions)
Foreign currencytranslation
adjustments Retirementliabilities
Interest rateswap AOCL
Balance at December 31, 2015 $ (27.1) $ (7.4) $ (0.5) $ (35.0) Unrealized net gains (losses) arising during the period 3.8 — (0.3) 3.5 Amounts reclassified from AOCL — 0.1 — 0.1Net current period other comprehensive income (loss) 3.8 0.1 (0.3) 3.6Balance at March 31, 2016 (23.3) (7.3) (0.8) (31.4) Unrealized net gains (losses) arising during the period (1.6) — 0.0 (1.6) Amounts reclassified from AOCL — 0.1 — 0.1Net current period other comprehensive income (loss) (1.6) 0.1 — (1.5)Balance at June 30, 2016 (24.9) (7.2) (0.8) (32.9) Unrealized net gains (losses) arising during the period (1.6) — — (1.6)Net current period other comprehensive income (loss) (1.6) — — (1.6)
Balance at September 30, 2016 $ (26.5) $ (7.2) $ (0.8) $ (34.5)
12. COMMITMENTS AND CONTINGENCIES
Legal Proceedings
From time to time, the Company is involved in various lawsuits, claims and regulatory and administrative proceedings arising out of its business relatingto general commercial and contractual matters, governmental regulations, intellectual property rights, labor and employment matters, tax and other actions.
Although the ultimate outcome of any legal proceeding or investigation cannot be predicted with certainty, based on present information, including theCompany's assessment of the merits of the particular claim, the Company does not expect that any asserted or unasserted legal claims or proceedings, individuallyor in the aggregate, will have a material adverse effect on its results of operations, financial condition or cash flows.
Escheat Audit
During 2013, Unisource was notified by the State of Delaware that it intended to examine the books and records of Unisource to determine compliancewith Delaware escheat laws. Since that date, seven other states have joined with Delaware in the audit process, which is conducted by an outside firm on behalf ofthe states. While the original time period for the audit was from 1981 to present, recent legal developments have resulted in Delaware narrowing the time periodfrom 1998 to present. The Company has been informed that similar audits have generally taken four years or more to complete.
In the third quarter of 2017, the Company recorded an estimated liability with respect to certain transactions in connection with the pending audit. TheCompany does not consider this amount to be material to the Company’s results of operations or financial condition. There are other transactions under audit basedupon which potential liability cannot be reasonably estimated at this time. Any claims or liabilities resulting from the audit could have a material impact on theCompany’s results of operations, financial condition or cash flows. The Company will continue to monitor the matter for any developments that would make theloss contingency associated with other transactions under audit probable or reasonably estimable.
20

Table of Contents
New England Teamsters and Trucking Industry Pension Fund
During the second quarter of 2017, the Company closed its facility in Wilmington, Massachusetts as part of its plan to consolidate operations in thenortheastern United States. In connection with this closure, the Company ceased contributions to the New England Teamsters and Trucking Industry Pension Fund(the “NE Fund”), a multi-employer pension plan, for participating employees who previously worked at this facility. In June 2017, the Company was presentedwith a Demand for Payment of Withdrawal Liability (the “Demand”) from the NE Fund in the amount of $10.9 million , payable in 240 equal monthly installmentsbeginning in August 2017. The Company has assessed the merits of the Demand and, pursuant to Employee Retirement Income Security Act of 1974 ("ERISA")regulations, requested review of the Demand. The NE Fund responded, confirming its Demand and the Company is considering arbitration. A charge for theDemand was recorded as a component of restructuring charges in the Condensed Consolidated Statements of Operations for the nine months ended September 30,2017 . Depending on the Company's decision whether or not to arbitrate and the decision of such arbitration, an adjustment to the charge recorded for thewithdrawal liability contained in the Demand may be required.
Also as part of this same consolidation, the Company's Windsor and Middletown, Connecticut facilities were closed and relocated to Enfield,Connecticut. Employees at both the Windsor and Middletown locations were covered by separate collective bargaining agreements. Employees at the Middletownlocation and those subject to this agreement also participate in the NE Fund. The Company is currently negotiating a new collective bargaining agreement for theEnfield, Connecticut facility to replace the legacy Windsor and Middletown, Connecticut agreements. If, as a result of these negotiations, participation in the NEFund ends, the Company may incur an additional withdrawal liability charge.
13. SEGMENT INFORMATION
Veritiv's business is organized under four reportable segments: Packaging, Facility Solutions, Print, and Publishing and Print Management ("Publishing").This segment structure is consistent with the way the Chief Operating Decision Maker, who is Veritiv's Chief Executive Officer, makes operating decisions andmanages the growth and profitability of the Company’s business. The Company also has a Corporate & Other category, which includes certain assets and costs notprimarily attributable to any of the reportable segments, as well as the Veritiv logistics solutions business, which provides transportation and warehousingsolutions.
The following tables present net sales, Adjusted EBITDA (earnings before interest, income taxes, depreciation and amortization, restructuring charges
(income), acquisition and integration expenses and other similar charges including any severance costs, costs associated with warehouse and office openings orclosings, consolidation, and relocation and other business optimization expenses, stock-based compensation expense, changes in the LIFO reserve, non-restructuring asset impairment charges, non-restructuring severance charges, non-restructuring pension charges, fair value adjustments on the contingent liabilityassociated with the TRA and certain other adjustments), which is the metric management uses to assess operating performance of the segments, and certain othermeasures for each of the reportable segments and Corporate & Other for the periods presented:
21

Table of Contents
(in millions) Packaging Facility
Solutions Print Publishing
TotalReportableSegments
Corporate &Other Total
Three Months EndedSeptember 30, 2017 Net sales $ 799.6 $ 339.6 $ 701.6 $ 238.7 $ 2,079.5 $ 37.3 $ 2,116.8Adjusted EBITDA 62.1 10.3 13.1 5.5 91.0 (46.9) Depreciation andamortization 4.0 1.6 2.7 0.2 8.5 4.6 13.1Restructuring charges 5.8 1.9 5.9 0.0 13.6 (10.9) 2.7
Three Months EndedSeptember 30, 2016 Net sales $ 730.1 $ 328.7 $ 788.2 $ 248.4 $ 2,095.4 $ 31.2 $ 2,126.6Adjusted EBITDA 59.5 13.0 20.0 6.6 99.1 (42.0) Depreciation andamortization 3.1 1.5 3.1 0.8 8.5 4.9 13.4Restructuring charges 2.2 1.0 2.6 0.0 5.8 0.0 5.8
Nine Months EndedSeptember 30, 2017 Net sales $ 2,266.0 $ 975.5 $ 2,095.1 $ 696.6 $ 6,033.2 $ 107.1 $ 6,140.3Adjusted EBITDA 166.7 25.1 44.8 17.6 254.2 (137.8) Depreciation andamortization 10.5 4.5 7.9 1.3 24.2 15.7 39.9Restructuring charges 12.3 5.2 12.2 0.0 29.7 0.3 30.0
Nine Months EndedSeptember 30, 2016 Net sales $ 2,106.4 $ 951.6 $ 2,299.0 $ 763.2 $ 6,120.2 $ 87.0 $ 6,207.2Adjusted EBITDA 165.4 34.3 55.7 16.4 271.8 (129.7) Depreciation andamortization 9.3 4.5 9.5 2.5 25.8 14.7 40.5Restructuring charges 2.6 1.5 2.9 0.0 7.0 0.2 7.2
22

Table of Contents
The table below presents a reconciliation of income (loss) before income taxes as reflected in the Condensed Consolidated Statements of Operations toAdjusted EBITDA for the reportable segments:
Three Months Ended
September 30, Nine Months Ended
September 30,(in millions) 2017 2016 2017 2016Income (loss) before income taxes $ (18.3) $ 13.6 $ (38.7) $ 35.2Interest expense, net 8.3 8.2 22.1 21.1Depreciation and amortization 13.1 13.4 39.9 40.5Restructuring charges 2.7 5.8 30.0 7.2Stock-based compensation 3.8 2.1 11.6 7.2LIFO reserve increase (decrease) 3.7 0.4 3.4 (2.7)Non-restructuring asset impairment charges 7.7 3.1 8.4 4.0Non-restructuring severance charges 0.5 0.2 1.5 2.4Non-restructuring pension charges 3.2 2.3 2.1 2.3Acquisition and integration expenses 14.2 7.3 28.1 19.6Fair value adjustments on TRA contingent liability (0.4) 1.0 1.6 4.8Other 5.6 (0.3) 6.4 0.5Adjustment for Corporate & Other 46.9 42.0 137.8 129.7
Adjusted EBITDA for reportable segments $ 91.0 $ 99.1 $ 254.2 $ 271.8
The following table summarizes total assets as of September 30, 2017 :
(in millions) September 30, 2017 December 31, 2016Packaging $ 1,137.3 $ 875.9Facility Solutions 424.1 397.9Print 883.6 874.1Publishing 178.3 170.0Corporate & Other 151.8 165.8
Total assets $ 2,775.1 $ 2,483.7
23

Table of Contents
ITEM 2. MANAGEMENT’S DISCUSSION AND ANALYSIS OF FINANCIAL CONDITION AND RESULTS OF OPERATIONS
Certain statements contained in this report regarding the Company’s future operating results, performance, business plans, prospects, guidance and anyother statements not constituting historical fact are "forward-looking statements" subject to the safe harbor created by the Private Securities Litigation Reform Actof 1995. Where possible, the words "believe," "expect," "anticipate," "continue," "intend," "should," "will," "would," "planned," "estimated," "potential," "goal,""outlook," "may," "predicts," "could," or the negative of such terms, or other comparable expressions, as they relate to the Company or its business, have beenused to identify such forward-looking statements. All forward-looking statements reflect only the Company’s current beliefs and assumptions with respect to futureoperating results, performance, business plans, prospects, guidance and other matters, and are based on information currently available to the Company.Accordingly, the statements are subject to significant risks, uncertainties and contingencies, which could cause the Company’s actual operating results,performance, business plans or prospects to differ materially from those expressed in, or implied by, these statements.
Factors that could cause actual results to differ materially from current expectations include risks and other factors described under "Risk Factors" inour Annual Report on Form 10-K and elsewhere in the Company’s publicly available reports filed with the Securities and Exchange Commission ("SEC"), whichcontain a discussion of various factors that may affect the Company’s business or financial results. Such risks and other factors, which in some instances arebeyond the Company’s control, include: the industry-wide decline in demand for paper and related products; increased competition from existing and non-traditional sources; adverse developments in general business and economic conditions as well as conditions in the global capital and credit markets; foreigncurrency fluctuations; our ability to collect trade receivables from customers to whom we extend credit; our ability to attract, train and retain highly qualifiedemployees; the effects of work stoppages, union negotiations and labor disputes; the loss of any of our significant customers; changes in business conditions in ourinternational operations; procurement and other risks in obtaining packaging, paper and facility products from our suppliers for resale to our customers; changesin prices for raw materials; fuel cost increases; inclement weather, anti-terrorism measures and other disruptions to the transportation network; our dependenceon a variety of IT and telecommunications systems and the Internet; our reliance on third party vendors for various services; cyber-security risks; costs to complywith laws, rules and regulations, including environmental, health and safety laws, and to satisfy any liability or obligation imposed under such laws; regulatorychanges and judicial rulings impacting our business; adverse results from litigation, governmental investigations or audits, or tax-related proceedings or audits;our inability to renew existing leases on acceptable terms, negotiate rent decreases or concessions and identify affordable real estate; our ability to adequatelyprotect our material intellectual property and other proprietary rights, or to defend successfully against intellectual property infringement claims by third parties;our pension and health care costs and participation in multi-employer pension, health and welfare plans; increasing interest rates; our ability to generatesufficient cash to service our debt; our ability to comply with the covenants contained in our debt agreements; our ability to refinance or restructure our debt onreasonable terms and conditions as might be necessary from time to time; changes in accounting standards and methodologies; our ability to realize theanticipated synergies, cost savings and growth opportunities from the merger transaction and our ability to integrate the xpedx business with the Unisourcebusiness; the possibility of incurring expenditures in excess of those currently budgeted in connection with the integration; and other events of which we arepresently unaware or that we currently deem immaterial that may result in unexpected adverse operating results.
For a more detailed discussion of these factors, see the information under the heading "Risk Factors" in our Annual Report on Form 10-K and in otherfilings we make with the SEC. Forward-looking statements are made only as of the date hereof, and the Company undertakes no obligation to update or revise theforward-looking statements, whether as a result of new information, future events or otherwise, except as required by law. In addition, historical informationshould not be considered as an indicator of future performance.
The following discussion of the Company’s results of operations for the three and nine months ended September 30, 2017 should be read in conjunction
with the Condensed Consolidated Financial Statements and Notes thereto, included elsewhere in this report.
24

Table of Contents
Executive Overview
BusinessOverview
Veritiv Corporation ("Veritiv" or the "Company") is a leading North American business-to-business distributor of packaging, facility solutions, print andpublishing products and services. Additionally, Veritiv provides logistics and supply chain management solutions to its customers. Veritiv was established in 2014,following the merger (the "Merger") of International Paper Company's xpedx distribution solutions business and UWW Holdings, Inc., the parent company ofUnisource Worldwide, Inc.
As described in Note 2, 2017 Acquisition , on August 31, 2017 , Veritiv completed the acquisition of All American Containers ("AAC"), a family-ownedand operated distributor of rigid packaging, including plastic, glass and metal containers, caps, closures and plastic pouches.
Veritiv operates from approximately 170 distribution centers primarily throughout the U.S., Canada and Mexico.
Veritiv's business is organized under four reportable segments: Packaging, Facility Solutions, Print, and Publishing and Print Management ("Publishing").This segment structure is consistent with the way the Chief Operating Decision Maker, who is Veritiv's Chief Executive Officer, makes operating decisions andmanages the growth and profitability of the Company’s business. The Company also has a Corporate & Other category, which includes certain assets and costs notprimarily attributable to any of the reportable segments, as well as the Veritiv logistics solutions business, which provides transportation and warehousingsolutions. The following summary describes the products and services offered in each of the reportable segments:
• Packaging– The Packaging segment provides standard as well as custom and comprehensive packaging solutions for customers based in North Americaand in key global markets. The business is strategically focused on higher growth industries including light industrial/general manufacturing, foodproduction, fulfillment and internet retail, as well as niche verticals based on geographical and functional expertise. Veritiv’s packaging professionalscreate customer value through supply chain solutions, structural and graphic packaging design and engineering, automation, workflow and equipmentservices, contract packaging and kitting and fulfillment.
• FacilitySolutions– The Facility Solutions segment sources and sells cleaning, break-room and other supplies such as towels, tissues, wipers anddispensers, can liners, commercial cleaning chemicals, soaps and sanitizers, sanitary maintenance supplies and equipment, safety and hazard supplies, andshampoos and amenities primarily in the U.S., Canada and Mexico. Veritiv is a leading distributor in the Facility Solutions segment. Through thissegment, Veritiv manages a world class network of leading suppliers in most facilities solutions categories. Additionally, the Company offers total cost ofownership solutions with re-merchandising, budgeting and compliance reporting, inventory management and a sales-force trained to bring leading verticalexpertise to the major North American geographies.
• Print– The Print segment sells and distributes commercial printing, writing, copying, digital, wide format and specialty paper products, graphicsconsumables and graphics equipment primarily in the U.S., Canada and Mexico. This segment also includes customized paper conversion services ofcommercial printing paper for distribution to document centers and form printers. Veritiv's broad geographic platform of operations coupled with thebreadth of paper and graphics products, including exclusive private brand offerings, provides a foundation to service national, regional and localcustomers across North America.
• Publishing– The Publishing segment sells and distributes coated and uncoated commercial printing papers to publishers, retailers, converters, printersand specialty businesses for use in magazines, catalogs, books, directories, gaming, couponing, retail inserts and direct mail. This segment also providesprint management, procurement and supply chain management solutions to simplify paper and print procurement processes for Veritiv's customers.
Seasonality
The Company’s operating results are subject to seasonal influences. Historically, the Company's higher consolidated net sales occur during the third andfourth quarters while the lowest consolidated net sales occur during the first quarter. The Packaging segment net sales tend to increase each quarter throughout theyear and net sales for the first quarter are typically less than net sales for the fourth quarter of the preceding year. Production schedules for non-durable goods thatbuild up to the holidays and peak in the fourth quarter drive this seasonal net sales pattern. Net sales for the Facility Solutions segment tend to be highest during thethird and fourth quarters due to increased summer demand in the away-from-home resort, cruise and
25

Table of Contents
hospitality markets, activities related to back-to-school and increased retail activity during the holidays. Within the Print and Publishing segments, seasonality isdriven by increased magazine advertising page counts, retail inserts, catalogs and direct mail primarily due to back-to-school, political election and holiday-relatedadvertising and promotions in the second half of the year.
Results of Operations, Including Business Segments
The following discussion compares the consolidated operating results of Veritiv for the three and nine months ended September 30, 2017 and 2016 :
Three Months Ended
September 30, Increase (Decrease) Nine Months Ended
September 30, Increase (Decrease)(in millions) 2017 2016 $ % 2017 2016 $ %Net sales $ 2,116.8 $ 2,126.6 $ (9.8) (0.5)% $ 6,140.3 $ 6,207.2 $ (66.9) (1.1)%Cost of products sold (exclusive ofdepreciation and amortizationshown separately below) 1,736.6 1,743.8 (7.2) (0.4)% 5,026.4 5,086.2 (59.8) (1.2)%
Distribution expenses 132.0 126.0 6.0 4.8 % 380.9 375.2 5.7 1.5 %Selling and administrativeexpenses 228.7 207.3 21.4 10.3 % 650.4 615.9 34.5 5.6 %
Depreciation and amortization 13.1 13.4 (0.3) (2.2)% 39.9 40.5 (0.6) (1.5)%Acquisition and integrationexpenses 14.2 7.3 6.9 94.5 % 28.1 19.6 8.5 43.4 %
Restructuring charges 2.7 5.8 (3.1) (53.4)% 30.0 7.2 22.8 *Operating income (loss) (10.5) 23.0 (33.5) * (15.4) 62.6 (78.0) *Interest expense, net 8.3 8.2 0.1 1.2 % 22.1 21.1 1.0 4.7 %Other expense, net (0.5) 1.2 (1.7) * 1.2 6.3 (5.1) (81.0)%Income (loss) before income taxes (18.3) 13.6 (31.9) * (38.7) 35.2 (73.9) *Income tax expense (benefit) (4.0) 8.0 (12.0) * (13.1) 18.4 (31.5) *Net income (loss) $ (14.3) $ 5.6 $ (19.9) * $ (25.6) $ 16.8 $ (42.4) *
* - not meaningful
Net Sales For the three and nine months ended September 30, 2017 , net sales declined primarily due to decreased net sales in the Print and Publishing segments,
partially offset by increased net sales in the Packaging and Facility Solutions segments and Veritiv's logistics solutions business. See the "Segment Results" sectionfor additional information.
Cost of Products Sold (exclusive of depreciation and amortization shown separately below) For the three and nine months ended September 30, 2017 , cost of products sold decreased primarily due to the lower net sales.
Distribution Expenses For the three months ended September 30, 2017 , total distribution expenses increased by $ 6.0 million . Distribution expenses increased $4.9 million due
to an increase in freight and logistics expenses, driven mostly by increased third party freight, transfer expenses and diesel fuel prices. The remaining increase indistribution expenses is largely the result of the acquisition of AAC .
For the nine months ended September 30, 2017 , distribution expenses increased by $ 5.7 million . Distribution expenses increased $10.8 million from anincrease in freight and logistics expenses, due mostly to increased third party freight, transfer expense and diesel fuel prices and $1.2 million as a result of theacquisition of AAC . These increases were partially offset by (i) a $2.1 million decrease in facilities rent and other expense, (ii) a $1.4 million decrease in insuranceexpense, (iii) a $1.2 million decrease in maintenance and material expense and (iv) a $0.8 million decrease in personnel expenses. The offsetting decreases weredriven primarily by warehouse consolidations.
26

Table of Contents
Selling and Administrative Expenses For the three months ended September 30, 2017 , selling and administrative expenses increased by $ 21.4 million due to (i) a $6.3 million increase in
personnel expenses due in part to increased headcount to support the Company's growth strategy and increased commission expense, which was primarily due tolower expense in 2016 resulting from the recovery of a $4.9 million commission advance, (ii) a $4.8 million increase in bad debt expense, (iii) a $4.7 millionincrease in asset impairments primarily related to the goodwill and customer relationships in the Veritiv logistics solutions business and (iv) a $2.0 million increaserelated to the acquisition of AAC .
For the nine months ended September 30, 2017 , selling and administrative expenses increased by $ 34.5 million due to (i) an $11.1 million increase inbad debt expense, (ii) an $11.0 million increase in personnel expenses, (iii) a $5.3 million increase in asset impairments primarily related to the goodwill andcustomer relationships in the Veritiv logistics solutions business, and (iv) a $2.0 million increase related to the acquisition of AAC . The increase in bad debtexpense was primarily due to additional reserves related to certain customers with declining financial conditions during the current period combined with favorablecollections experience in the prior period. The increase in personnel expenses was primarily driven by an increase in headcount to support the Company's growthstrategy as well as lower commissions in 2016 due to the commission advance recovery, partially offset by a $7.5 million decrease in incentive compensation.
Depreciation and Amortization
For the three and nine months ended September 30, 2017 , depreciation and amortization decreased $ 0.3 million and $ 0.6 million, respectively.
Acquisition and Integration Expenses
See Note 2, 2017 Acquisition , and Note 3, Acquisition, Integration and Restructuring Charges , to the Condensed Consolidated Financial Statements forinformation related to the Company's acquisition and integration efforts.
Restructuring Charges
For the three and nine months ended September 30, 2017 , restructuring charges decreased $ 3.1 million and increased $ 22.8 million , respectively. SeeNote 3, Acquisition, Integration and Restructuring Charges , to the Condensed Consolidated Financial Statements for additional information related to theCompany's restructuring efforts. The Company may continue to record restructuring charges in the future as restructuring activities progress, which may includegains or losses from the disposition of assets.
Interest Expense, Net
For the three and nine months ended September 30, 2017 , interest expense increased $ 0.1 million and $ 1.0 million , respectively. Interest expenseincreased due to (i) an increased average balance on the Company's asset-based lending facility (the "ABL Facility") and (ii) increased interest rates. See Note 5,Debt and Other Obligations , to the Condensed Consolidated Financial Statements for information related to the ABL Facility.
Other Expense, Net
For the three and nine months ended September 30, 2017 , other expense, net, decreased $ 1.7 million and $ 5.1 million , respectively. These decreaseswere primarily driven by decreased expense associated with the tax receivable agreement, decreased foreign currency losses, and a loss on debt extinguishment inthe second quarter of 2016.
Effective Tax Rate
Veritiv's effective tax rates were 21.9% and 58.8% for the three months ended September 30, 2017 and 2016 , respectively. Veritiv's effective tax rateswere 33.9% and 52.3% for the nine months ended September 30, 2017 and 2016 , respectively.
The difference between the Company’s effective tax rates and the U.S. statutory tax rate of 35.0% primarily relates to non-deductible expenses, stateincome taxes (net of federal income tax benefit), and the Company's income (loss) by jurisdiction. Additionally, the effective tax rate for the three and nine monthsended September 30, 2017 includes the benefit of tax credits and the impact of impairing non-deductible goodwill.
27

Table of Contents
In conjunction with the third quarter 2017 filing of Veritiv's 2016 U.S. federal tax return and amended 2015 and 2014 U.S. federal tax returns, theCompany recognized a $3.1 million benefit for credits related to foreign taxes and research and experimentation activities. Additionally, an estimate of 2017 taxcredits is included in our estimated annual effective tax rate.
The historic volatility of the Company's effective tax rate has been primarily due to both the level of pre-tax income as well as variations in theCompany's income (loss) by jurisdiction. Over time and with increasing pre-tax income, the Company estimates its effective tax rate will trend towardapproximately 40%. However, the effective tax rate may vary significantly due to potential fluctuations in the amount and source, including both foreign anddomestic, of pre-tax income and changes in amounts of non-deductible expenses and other items.
SegmentResults
Adjusted EBITDA is the primary financial performance measure Veritiv uses to manage its businesses, to monitor its results of operations, to measure itsperformance against the ABL Facility and to incentivize its management. This common metric is intended to align stockholders, debt holders and management.Adjusted EBITDA is a non-GAAP financial measure and is not an alternative to net income, operating income or any other measure prescribed by U.S. generallyaccepted accounting principles ("U.S. GAAP").
Veritiv uses Adjusted EBITDA (earnings before interest, income taxes, depreciation and amortization, restructuring charges (income), acquisition andintegration expenses and other similar charges including any severance costs, costs associated with warehouse and office openings or closings, consolidation, andrelocation and other business optimization expenses, stock-based compensation expense, changes in the LIFO reserve, non-restructuring asset impairment charges,non-restructuring severance charges, non-restructuring pension charges, fair value adjustments on the contingent liability associated with the Tax ReceivableAgreement ("TRA") and certain other adjustments) because Veritiv believes investors commonly use Adjusted EBITDA as a key financial metric for valuingcompanies. In addition, the credit agreement governing the ABL Facility permits the Company to exclude these and other charges in calculating ConsolidatedEBITDA, as defined in the ABL Facility.
Adjusted EBITDA has limitations as an analytical tool and should not be considered in isolation or as a substitute for analysis of Veritiv’s results asreported under U.S. GAAP. For example, Adjusted EBITDA:
• Does not reflect the Company’s income tax expenses or the cash requirements to pay its taxes; and• Although depreciation and amortization charges are non-cash charges, it does not reflect that the assets being depreciated and amortized will often
have to be replaced in the future and the foregoing metrics do not reflect any cash requirements for such replacements.
Other companies in the industry may calculate Adjusted EBITDA differently than Veritiv does, limiting its usefulness as a comparative measure. Becauseof these limitations, Adjusted EBITDA should not be considered as a measure of discretionary cash available to Veritiv to invest in the growth of its business.Veritiv compensates for these limitations by relying on the Company's U.S. GAAP results and by using Adjusted EBITDA for supplemental purposes.Additionally, Adjusted EBITDA is not an alternative measure of financial performance under U.S. GAAP and therefore should be considered in conjunction withnet income and other performance measures such as operating income or net cash provided by operating activities and not as an alternative to such U.S. GAAPmeasures.
Due to the shared nature of the distribution network, distribution expenses are not a specific charge to each segment, but are instead allocated to eachsegment based primarily on operational metrics that correlate with changes in volume. Accordingly, distribution expenses allocated to each segment are highlyinterdependent on the results of other segments. Lower volume in any segment that is not offset by a reduction in distribution expenses can result in the othersegments absorbing a larger share of distribution expenses. Conversely, higher volume in any segment can result in the other segments absorbing a smaller share ofdistribution expenses. The impact of this at the segment level is that the changes in distribution expense trends may not correspond with volume trends within aparticular segment.
The Company sells thousands of products. In the Packaging, Facility Solutions and Print segments, Veritiv is unable to compute the impact of changes insales volume based on changes in sales of each individual product. Rather, the Company assumes that the margin stays constant and estimates the volume impactbased on changes in cost of products sold as a proxy for the change in sales volume. After any other significant sales variances are identified, the remaining salesvariance is attributed to price/mix.
The Company approximates foreign currency effects by applying the foreign currency exchange rate for the prior period to the local currency results forthe current period. We believe the elimination of the foreign currency translation impact provides better year-to-year comparability without the distortion offoreign currency fluctuations.
28
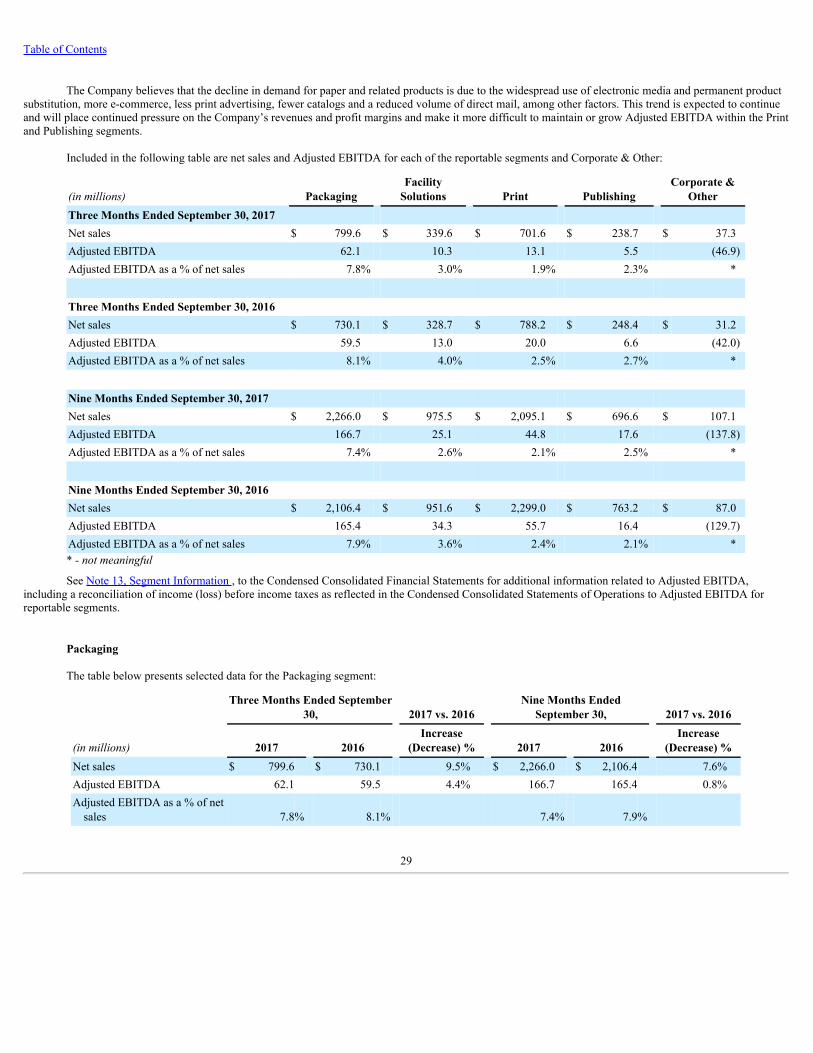
Table of Contents
The Company believes that the decline in demand for paper and related products is due to the widespread use of electronic media and permanent productsubstitution, more e-commerce, less print advertising, fewer catalogs and a reduced volume of direct mail, among other factors. This trend is expected to continueand will place continued pressure on the Company’s revenues and profit margins and make it more difficult to maintain or grow Adjusted EBITDA within the Printand Publishing segments.
Included in the following table are net sales and Adjusted EBITDA for each of the reportable segments and Corporate & Other:
(in millions) Packaging Facility
Solutions Print Publishing Corporate &
OtherThree Months Ended September 30, 2017 Net sales $ 799.6 $ 339.6 $ 701.6 $ 238.7 $ 37.3Adjusted EBITDA 62.1 10.3 13.1 5.5 (46.9)Adjusted EBITDA as a % of net sales 7.8% 3.0% 1.9% 2.3% *
Three Months Ended September 30, 2016 Net sales $ 730.1 $ 328.7 $ 788.2 $ 248.4 $ 31.2Adjusted EBITDA 59.5 13.0 20.0 6.6 (42.0)Adjusted EBITDA as a % of net sales 8.1% 4.0% 2.5% 2.7% *
Nine Months Ended September 30, 2017 Net sales $ 2,266.0 $ 975.5 $ 2,095.1 $ 696.6 $ 107.1Adjusted EBITDA 166.7 25.1 44.8 17.6 (137.8)Adjusted EBITDA as a % of net sales 7.4% 2.6% 2.1% 2.5% *
Nine Months Ended September 30, 2016 Net sales $ 2,106.4 $ 951.6 $ 2,299.0 $ 763.2 $ 87.0Adjusted EBITDA 165.4 34.3 55.7 16.4 (129.7)Adjusted EBITDA as a % of net sales 7.9% 3.6% 2.4% 2.1% ** - not meaningful
See Note 13, Segment Information , to the Condensed Consolidated Financial Statements for additional information related to Adjusted EBITDA,including a reconciliation of income (loss) before income taxes as reflected in the Condensed Consolidated Statements of Operations to Adjusted EBITDA forreportable segments.
Packaging
The table below presents selected data for the Packaging segment:
Three Months Ended September
30, 2017 vs. 2016 Nine Months Ended
September 30, 2017 vs. 2016
(in millions) 2017 2016 Increase
(Decrease) % 2017 2016 Increase
(Decrease) %Net sales $ 799.6 $ 730.1 9.5% $ 2,266.0 $ 2,106.4 7.6%Adjusted EBITDA 62.1 59.5 4.4% 166.7 165.4 0.8%Adjusted EBITDA as a % of netsales 7.8% 8.1% 7.4% 7.9%
29

Table of Contents
The table below presents the components of the net sales change compared to the prior year:
Increase (Decrease)
Three Months Ended
September 30, Nine Months Ended
September 30,(in millions) 2017 vs. 2016 2017 vs. 2016Volume $ 71.0 $ 177.1Foreign currency 3.8 (0.9)Price/Mix (5.3) (16.6)
Total change $ 69.5 $ 159.6ComparisonoftheThreeMonthsEndedSeptember30,2017andSeptember30,2016
Net sales increased $69.5 million , or 9.5% , compared to the same period in 2016. The net sales increase was primarily attributable to an increase in salesof corrugated products, films and folding cartons due to increases in volume and market prices as well as $16.0 million of rigid packaging products sales in thecurrent period relating to the AAC business acquired in 2017.
Adjusted EBITDA increased $2.6 million, or 4.4% , compared to the same period in 2016. The increase in Adjusted EBITDA was primarily attributableto the increase in net sales. The increase in net sales was partially offset by increases in distribution expenses, cost of products sold increasing at a faster rate thannet sales and an increase in selling and administrative expenses. Distribution expenses increased $6.5 million primarily driven by increased utilization of ourdistribution network, which is reflected in (i) increased freight and logistics expenses driven mostly by increased third party freight and transfer expenses, (ii)increased personnel expenses and (iii) increased facilities rent and other expenses. Selling and administrative expenses increased $3.4 million primarily driven byincreased personnel expenses associated with increased headcount to support our growth strategy. The acquisition of AAC resulted in a $1.2 million increase indistribution expenses and a $2.0 million increase in selling and administrative expenses.
ComparisonoftheNineMonthsEndedSeptember30,2017andSeptember30,2016
Net sales increased $159.6 million , or 7.6% , compared to the same period in 2016. The net sales increase was primarily attributable to an increase insales of corrugated products, films and folding cartons due to increases in volume and market prices as well as $16.0 million of rigid packaging products sales inthe current period relating to the AAC business acquired in 2017.
Adjusted EBITDA increased $1.3 million, or 0.8% , compared to the same period in 2016. The increase in net sales was mostly offset by an increase indistribution expenses, cost of products sold increasing at a faster rate than net sales and an increase in selling and administrative expenses. Distribution expensesincreased $14.0 million primarily driven by increased utilization of our distribution network, which is reflected in (i) increased freight and logistics expensesdriven mostly by increased third party freight, transfer expenses and diesel fuel prices, (ii) increased personnel expenses and (iii) increased facilities rent and otherexpenses. Selling and administrative expenses increased $10.1 million primarily driven by increased personnel expenses associated with increased headcount tosupport our growth strategy. The acquisition of AAC resulted in a $1.2 million increase in distribution expenses and a $2.0 million increase in selling andadministrative expenses.
Facility Solutions The table below presents selected data for the Facility Solutions segment:
Three Months Ended September
30, 2017 vs. 2016 Nine Months Ended
September 30, 2017 vs. 2016
(in millions) 2017 2016 Increase
(Decrease) % 2017 2016 Increase
(Decrease) %Net sales $ 339.6 $ 328.7 3.3 % $ 975.5 $ 951.6 2.5 %Adjusted EBITDA 10.3 13.0 (20.8)% 25.1 34.3 (26.8)%Adjusted EBITDA as a % of netsales 3.0% 4.0% 2.6% 3.6%
30

Table of Contents
The table below presents the components of the net sales change compared to the prior year:
Increase (Decrease)
Three Months Ended
September 30, Nine Months Ended
September 30,(in millions) 2017 vs. 2016 2017 vs. 2016Volume $ 9.4 $ 28.5Foreign currency 2.9 1.9Price/Mix (1.4) (6.5)
Total change $ 10.9 $ 23.9ComparisonoftheThreeMonthsEndedSeptember30,2017andSeptember30,2016
Net sales increased $10.9 million , or 3.3% , compared to the same period in 2016. The net sales increase was primarily attributable to increased sales offood service products, chemicals and safety supplies.
Adjusted EBITDA decreased $2.7 million, or 20.8% , compared to the same period in 2016. The increase in net sales was more than offset by (i) a $2.4million increase in distribution expenses, (ii) a $1.6 million increase in selling and administrative expenses and (iii) cost of products sold increasing at a faster ratethan net sales. The increase in distribution expenses was primarily driven by increased utilization of our distribution network and is evidenced in (i) increasedfreight and logistics expenses driven mostly by increased third party freight and transfer expenses and (ii) increased personnel expenses. The increase in selling andadministrative expenses was largely a result of a $1.0 million increase in personnel expenses, generally due to increased headcount to support our growth strategy,and a $0.8 million increase in bad debt expense.
ComparisonoftheNineMonthsEndedSeptember30,2017andSeptember30,2016
Net sales increased $23.9 million , or 2.5% , compared to the same period in 2016. The net sales increase was primarily attributable to increased sales offood service products and chemicals.
Adjusted EBITDA decreased $9.2 million, or 26.8% , compared to the same period in 2016. The increase in net sales was more than offset by (i) cost ofproducts sold increasing at a faster rate than net sales, (ii) a $4.8 million increase in distribution expenses and (iii) a $4.8 million increase in selling andadministrative costs. The increase in distribution expenses was primarily driven by increased utilization of our distribution network and is evidenced in (i)increased freight and logistics expenses driven mostly by increased third party freight, transfer expenses and diesel fuel prices and (ii) increased personnelexpenses. The increase in selling and administrative expenses was primarily driven by (i) a $1.9 million increase in personnel expenses primarily due to increasedheadcount to support our growth strategy and (ii) a $1.9 million increase in bad debt expense.
The table below presents selected data for the Print segment:
Three Months Ended September
30, 2017 vs. 2016 Nine Months Ended September
30, 2017 vs. 2016
(in millions) 2017 2016 Increase
(Decrease) % 2017 2016 Increase
(Decrease) %Net sales $ 701.6 $ 788.2 (11.0)% $ 2,095.1 $ 2,299.0 (8.9)%Adjusted EBITDA 13.1 20.0 (34.5)% 44.8 55.7 (19.6)%Adjusted EBITDA as a % of netsales 1.9% 2.5% 2.1% 2.4%
31

Table of Contents
The table below presents the components of the net sales change compared to the prior year:
Increase (Decrease)
Three Months Ended
September 30, Nine Months Ended
September 30,(in millions) 2017 vs. 2016 2017 vs. 2016Volume $ (89.9) $ (211.5)Foreign currency 2.0 1.1Price/Mix 1.3 6.5
Total change $ (86.6) $ (203.9)
ComparisonoftheThreeMonthsEndedSeptember30,2017andSeptember30,2016
Net sales decreased $86.6 million , or 11.0% , compared to the same period in 2016. The net sales decrease was primarily attributable to the continuedsecular decline in the paper industry.
Adjusted EBITDA decreased $6.9 million, or 34.5% , compared to the same period in 2016. The Adjusted EBITDA decrease was primarily attributable tothe decline in net sales. The decline in net sales was partially offset by (i) a $3.8 million decrease in distribution expenses and (ii) cost of products sold decreasingat a faster rate than net sales. The decrease in distribution expenses was primarily due to decreased utilization of our distribution network and was evidenced in (i) adecrease in personnel expenses and (ii) a decrease in facilities rent and other related expenses. Selling and administrative expenses were flat as lower personnelexpenses of $3.2 million were offset by a $3.8 million increase in bad debt expense.
ComparisonoftheNineMonthsEndedSeptember30,2017andSeptember30,2016
Net sales decreased $203.9 million , or 8.9% , compared to the same period in 2016. The net sales decrease was primarily attributable to the continuedsecular decline in the paper industry.
Adjusted EBITDA decreased $10.9 million, or 19.6% , compared to the same period in 2016. The Adjusted EBITDA decrease was largely attributable tothe decline in net sales. The decline in net sales was partially offset by (i) a $10.3 million decrease in distribution expenses, (ii) cost of products sold declining at afaster rate than net sales and (iii) a $2.5 million decrease in selling and administrative expenses. The decrease in distribution expenses was primarily driven bydecreased utilization of our distribution network which is reflected in (i) a decrease in facilities rent (ii) a decrease in personnel expense and (iii) a decrease infreight and logistics expenses. The decrease in selling and administrative expenses was primarily driven by a $5.9 million decrease in personnel expenses and a$0.8 million decrease in professional and communication expenses, partially offset by a $5.3 million increase in bad debt expense.
Publishing
The table below presents selected data for the Publishing segment:
Three Months Ended September
30, 2017 vs. 2016 Nine Months Ended
September 30, 2017 vs. 2016
(in millions) 2017 2016 Increase
(Decrease) % 2017 2016 Increase
(Decrease) %Net sales $ 238.7 $ 248.4 (3.9)% $ 696.6 $ 763.2 (8.7)%Adjusted EBITDA 5.5 6.6 (16.7)% 17.6 16.4 7.3 %Adjusted EBITDA as a % of netsales 2.3% 2.7% 2.5% 2.1%
32

Table of Contents
The table below presents the components of the net sales change compared to the prior year:
Increase (Decrease)
Three Months Ended
September 30, Nine Months Ended
September 30,(in millions) 2017 vs. 2016 2017 vs. 2016Volume $ (12.3) $ (84.0)Foreign currency 0.3 0.2Price/Mix 2.3 17.2
Total change $ (9.7) $ (66.6)
ComparisonoftheThreeMonthsEndedSeptember30,2017andSeptember30,2016
Net sales decreased $9.7 million , or 3.9% , compared to the same period in 2016. The net sales decrease was primarily attributable to a decline involume.
Adjusted EBITDA decreased $1.1 million, or 16.7% , compared to the same period in 2016. The Adjusted EBITDA decrease was primarily attributable tolower net sales and cost of products sold decreasing at a slower rate than net sales.
ComparisonoftheNineMonthsEndedSeptember30,2017andSeptember30,2016
Net sales decreased $66.6 million , or 8.7% , compared to the same period in 2016. The net sales decrease was primarily attributable to a decline involume.
Adjusted EBITDA increased $1.2 million, or 7.3% , compared to the same period in 2016. The decrease in net sales was more than offset by cost ofproducts sold decreasing at a faster rate than net sales. The increase in Adjusted EBITDA was also attributable to a $1.0 million decrease in selling andadministrative expenses, primarily driven by decreased personnel expenses.
Corporate & Other
The table below presents selected data for Corporate & Other:
Three Months Ended September
30, 2017 vs. 2016 Nine Months Ended
September 30, 2017 vs. 2016
(in millions) 2017 2016 Increase
(Decrease) % 2017 2016 Increase
(Decrease) %Net sales $ 37.3 $ 31.2 19.6 % $ 107.1 $ 87.0 23.1 %Adjusted EBITDA (46.9) (42.0) (11.7)% (137.8) (129.7) (6.2)%
ComparisonoftheThreeMonthsEndedSeptember30,2017andSeptember30,2016
Net sales increased $6.1 million, or 19.6% , compared to the same period in 2016. The net sales increase was primarily attributable to an increase infreight brokerage services.
Adjusted EBITDA decreased $4.9 million compared to the same period in 2016. The increase in net sales was more than offset by (i) a $5.3 millionincrease in selling and administrative expenses and (ii) cost of products sold increasing at a faster rate than net sales. The increase in selling and administrativeexpenses was primarily driven by a $5.0 million increase in personnel expenses primarily related to the commission advance recovery in 2016, as discussed above.
ComparisonoftheNineMonthsEndedSeptember30,2017andSeptember30,2016
Net sales increased $20.1 million, or 23.1% , compared to the same period in 2016. The net sales increase was primarily attributable to an increase infreight brokerage services.
33

Table of Contents
Adjusted EBITDA decreased $8.1 million compared to the same period in 2016. The increase in net sales and a $2.3 million decrease in distributionexpenses were more than offset by (i) cost of products sold increasing at a faster rate than net sales and (ii) a $7.5 million increase in selling and administrativecosts. The increase in selling and administrative costs was driven by (i) a $5.5 million increase in personnel expenses and (ii) a $1.3 million increase in insuranceexpense. The increase in personnel expenses was primarily driven by lower commission expense in 2016 as a result of the commission advance recovery andincreased headcount to support the Company's growth strategy, partially offset by a decrease in incentive compensation as discussed above.
Liquidity and Capital Resources
The cash requirements of the Company are provided by cash flows from operations and borrowings under the ABL Facility. The following table sets fortha summary of cash flows:
Nine Months Ended September 30,(in millions) 2017 2016Net cash provided by (used for):
Operating activities $ (17.7) $ 59.9Investing activities (147.7) (24.7)Financing activities 171.2 (30.4)
Operating Activities
Net cash provided by operating activities decreased by $77.6 million compared to the prior year. Most of the decrease resulted from the decline inoperating results and increase in working capital. The increase in working capital was primarily due to increases in accounts receivable and inventories which morethan offset an increase in accounts payable. These increases were due to increases in the number of days sales in accounts receivable and the number of days ofinventory on hand, which more than offset an increase in the number of days of accounts payable on hand.
Investing Activities
Net cash used for investing activities increased by $123.0 million compared to the prior year primarily due to the acquisition of AAC in the third quarterof 2017. Proceeds from asset sales increased in 2017 due to $9.1 million received from the sale of the Austin, Texas facility in May 2017 and $11.4 millionreceived from the sale of the Hensall facility in Canada in July 2017. See Note 5, Debt and Other Obligations for additional information regarding the Company'sdebt position.
Financing Activities
Net cash provided by financing activities increased by $201.6 million compared to the prior year. The increase was used primarily for the purchase ofAAC. Also, in the first quarter of 2017, the Company made a payment against the TRA contingent liability. In addition, the Company experienced a change inbook overdrafts due to the timing of payments. In 2016 the cash provided by operating activities was used to pay down the borrowings on the ABL Facility.
Funding and Liquidity Strategy
On August 11, 2016, the Company amended its ABL Facility to, among other things, extend the maturity date to August 11, 2021. All other significantterms remained consistent. See Note 5, Debt and Other Obligations , for additional information regarding the Company's debt position.
Availability under the ABL Facility is determined based upon a monthly borrowing base calculation which includes eligible customer receivables and
inventory, less outstanding borrowings, letters of credit and certain designated reserves. As of September 30, 2017 , the available additional borrowing capacityunder the ABL Facility was approximately $272.3 million .
The ABL Facility has a springing minimum fixed charge coverage ratio of at least 1.00 to 1.00 on a trailing four-quarter basis, which will be tested onlywhen specified availability is less than limits outlined under the ABL Facility. At September 30, 2017 , the above test was not applicable and is not expected to beapplicable in the next 12 months.
Veritiv's ability to fund its capital needs will depend on its ongoing ability to generate cash from operations, borrowings under the ABL Facility and fundsreceived from capital market offerings. If Veritiv's cash flows from operating activities are lower than expected, the Company will need to borrow under the ABLFacility and may need to incur additional debt or issue additional equity. Although management believes that the arrangements currently in place will permitVeritiv to finance its
34

Table of Contents
operations on acceptable terms and conditions, the Company’s access to, and the availability of, financing on acceptable terms and conditions in the future will beimpacted by many factors, including the liquidity of the overall capital markets and the current state of the economy.
Veritiv's management expects that the Company's primary future cash needs will be for working capital, capital expenditures, contractual commitments
and strategic investments. Additionally, management expects that cash provided by operating activities and available capacity under the ABL Facility will providesufficient funds to operate the business and meet other liquidity needs.
Off-Balance Sheet Arrangements
Veritiv does not have any off-balance sheet arrangements as of September 30, 2017 , other than operating lease obligations and the letters of credit underthe ABL Facility. The Company does not have any off-balance sheet arrangements that have or are reasonably likely to have a material current or future effect onits financial condition, revenues or expenses, results of operations, liquidity, capital expenditures or capital resources.
Contractual Obligations There have been no material changes to the Company's contractual obligations from those disclosed in Veritiv's Annual Report on Form 10-K for the year
ended December 31, 2016 , as adjusted for obligations resulting from the acquisition of AAC (see Note 2, 2017 Acquisition )
Critical Accounting Policies and Estimates There have been no material changes to the Company's critical accounting policies and estimates from those disclosed in Veritiv's Annual Report on
Form 10-K for the year ended December 31, 2016 .
Recently Issued Accounting Standards
See Note 1, Business and Summary of Significant Accounting Policies, to the Condensed Consolidated Financial Statements for information regardingrecently issued accounting standards.
ITEM 3. QUANTITATIVE AND QUALITATIVE DISCLOSURES ABOUT MARKET RISK
There have been no material changes in market risk from the information provided in Item 7A "Quantitative and Qualitative Disclosures about MarketRisk" of the Company's Annual Report on Form 10-K for the year ended December 31, 2016 .
ITEM 4. CONTROLS AND PROCEDURES
Evaluation of Disclosure Controls and Procedures
The Company’s management has carried out an evaluation, with the participation of its Chief Executive Officer and Chief Financial Officer, of theeffectiveness of the Company’s disclosure controls and procedures as defined in Rules 13a-15(e) and 15d-15(e) of the Securities Exchange Act of 1934, asamended. Based upon such evaluation, management has concluded that the Company’s disclosure controls and procedures were effective as of September 30, 2017.
Changes in Internal Control over Financial Reporting
There have been no changes in the Company's internal control over financial reporting that occurred during the quarter ended September 30, 2017 that hasmaterially affected, or is likely to materially affect, the Company's internal control over financial reporting. During the third quarter of 2017, the Companycompleted the acquisition of AAC. As permitted by SEC staff interpretive guidance that an assessment of a recently acquired business may be omitted from thescope of evaluation in the year of acquisition, management excluded AAC from its interim evaluation of internal control over financial reporting.
35

Table of Contents
PART II. OTHER INFORMATION
ITEM 1. LEGAL PROCEEDINGS
Refer to Note 12, Commitments and Contingencies, to the Condensed Consolidated Financial Statements.
ITEM 1A. RISK FACTORS
There have been no material changes from the risk factors previously disclosed in the Company's Annual Report on Form 10-K for the year endedDecember 31, 2016 .
ITEM 6. EXHIBITS
Exhibit No. Description 31.1* Rule 13a-14(a) Certification of the Chief Executive Officer. 31.2* Rule 13a-14(a) Certification of the Chief Financial Officer. 32.1* Section 1350 Certification of the Chief Executive Officer. 32.2* Section 1350 Certification of the Chief Financial Officer. 101.INS* XBRL Instance Document. 101.SCH* XBRL Taxonomy Extension Schema Document. 101.CAL* XBRL Taxonomy Extension Calculation Linkbase Document. 101.DEF* XBRL Taxonomy Extension Definition Linkbase Document. 101.LAB* XBRL Taxonomy Extension Label Linkbase Document. 101.PRE* XBRL Taxonomy Extension Presentation Linkbase Document.
* Filed herewith
36

Table of Contents
SIGNATURESPursuant to the requirements of the Securities Exchange Act of 1934, the Registrant has duly caused this report to be signed on its behalf by the undersignedthereunto duly authorized.
VERITIV CORPORATION (Registrant)
Date: November 7, 2017 By: /s/ Stephen J. Smith Name: Stephen J. Smith Title: Senior Vice President and Chief Financial Officer (Principal Financial Officer)
Date: November 7, 2017 By: /s/ W. Forrest Bell Name: W. Forrest Bell Title: Chief Accounting Officer (Principal Accounting Officer)
37

EXHIBIT 31.1
CERTIFICATION PURSUANT TOSECTION 302 OF THE SARBANES-OXLEY ACT OF 2002
I, Mary A. Laschinger, certify that:
1. I have reviewed this Quarterly Report on Form 10-Q of Veritiv Corporation; 2. Based on my knowledge, this report does not contain any untrue statement of a material fact or omit to state a material fact necessary to make the
statements made, in light of the circumstances under which such statements were made, not misleading with respect to the period covered by this report; 3. Based on my knowledge, the financial statements, and other financial information included in this report, fairly present in all material respects the
financial condition, results of operations and cash flows of the registrant as of, and for, the periods presented in this report; 4. The registrant’s other certifying officer(s) and I are responsible for establishing and maintaining disclosure controls and procedures (as defined in
Exchange Act Rules 13a-15(e) and 15d-15(e)) and internal control over financial reporting (as defined in Exchange Act Rules 13a-15(f) and 15d-15(f))for the registrant and have:
(a) Designed such disclosure controls and procedures, or caused such disclosure controls and procedures to be designed under our supervision, toensure that material information relating to the registrant, including its consolidated subsidiaries, is made known to us by others within thoseentities, particularly during the period in which this report is being prepared;
(b) Designed such internal control over financial reporting, or caused such internal control over financial reporting to be designed under oursupervision, to provide reasonable assurance regarding the reliability of financial reporting and the preparation of financial statements for externalpurposes in accordance with generally accepted accounting principles;
(c) Evaluated the effectiveness of the registrant’s disclosure controls and procedures and presented in this report our conclusions about the
effectiveness of the disclosure controls and procedures, as of the end of the period covered by this report based on such evaluation; and
(d) Disclosed in this report any change in the registrant’s internal control over financial reporting that occurred during the registrant’s most recent fiscalquarter (the registrant’s fourth fiscal quarter in the case of an annual report) that has materially affected, or is reasonably likely to materially affect,the registrant’s internal control over financial reporting; and
5. The registrant’s other certifying officer(s) and I have disclosed, based on our most recent evaluation of internal control over financial reporting, to the
registrant’s auditors and the audit committee of the registrant’s board of directors (or persons performing the equivalent functions):
(a) All significant deficiencies and material weaknesses in the design or operation of internal control over financial reporting which are reasonably
likely to adversely affect the registrant’s ability to record, process, summarize and report financial information; and
(b) Any fraud, whether or not material, that involves management or other employees who have a significant role in the registrant’s internal control
over financial reporting.
Date: November 7, 2017
/s/ Mary A. LaschingerMary A. LaschingerChairman and Chief Executive Officer

EXHIBIT 31.2
CERTIFICATION PURSUANT TOSECTION 302 OF THE SARBANES-OXLEY ACT OF 2002
I, Stephen J. Smith, certify that:
1. I have reviewed this Quarterly Report on Form 10-Q of Veritiv Corporation; 2. Based on my knowledge, this report does not contain any untrue statement of a material fact or omit to state a material fact necessary to make the
statements made, in light of the circumstances under which such statements were made, not misleading with respect to the period covered by this report; 3. Based on my knowledge, the financial statements, and other financial information included in this report, fairly present in all material respects the
financial condition, results of operations and cash flows of the registrant as of, and for, the periods presented in this report; 4. The registrant’s other certifying officer(s) and I are responsible for establishing and maintaining disclosure controls and procedures (as defined in
Exchange Act Rules 13a-15(e) and 15d-15(e)) and internal control over financial reporting (as defined in Exchange Act Rules 13a-15(f) and 15d-15(f))for the registrant and have:
(a) Designed such disclosure controls and procedures, or caused such disclosure controls and procedures to be designed under our supervision, to
ensure that material information relating to the registrant, including its consolidated subsidiaries, is made known to us by others within thoseentities, particularly during the period in which this report is being prepared;
(b) Designed such internal control over financial reporting, or caused such internal control over financial reporting to be designed under our
supervision, to provide reasonable assurance regarding the reliability of financial reporting and the preparation of financial statements for externalpurposes in accordance with generally accepted accounting principles;
(c) Evaluated the effectiveness of the registrant’s disclosure controls and procedures and presented in this report our conclusions about the
effectiveness of the disclosure controls and procedures, as of the end of the period covered by this report based on such evaluation; and
(d) Disclosed in this report any change in the registrant’s internal control over financial reporting that occurred during the registrant’s most recent fiscalquarter (the registrant’s fourth fiscal quarter in the case of an annual report) that has materially affected, or is reasonably likely to materially affect,the registrant’s internal control over financial reporting; and
5. The registrant’s other certifying officer(s) and I have disclosed, based on our most recent evaluation of internal control over financial reporting, to the
registrant’s auditors and the audit committee of the registrant’s board of directors (or persons performing the equivalent functions): (a) All significant deficiencies and material weaknesses in the design or operation of internal control over financial reporting which are reasonably
likely to adversely affect the registrant’s ability to record, process, summarize and report financial information; and (b) Any fraud, whether or not material, that involves management or other employees who have a significant role in the registrant’s internal control
over financial reporting.
Date: November 7, 2017
/s/ Stephen J. SmithStephen J. SmithSenior Vice President and Chief Financial Officer

EXHIBIT 32.1
CERTIFICATION PURSUANT TO18 U.S.C. SECTION 1350,
AS ADOPTED PURSUANT TOSECTION 906 OF THE SARBANES-OXLEY ACT OF 2002
In connection with the Quarterly Report on Form 10-Q of Veritiv Corporation (the “Company”) for the period ended September 30, 2017 as filed with theSecurities and Exchange Commission on the date hereof (the “Report”), I, Mary A. Laschinger, Chairman and Chief Executive Officer of the Company, certify,pursuant to 18 U.S.C. § 1350, as adopted pursuant to § 906 of the Sarbanes-Oxley Act of 2002, to my knowledge, that:
(1) The Report fully complies with the requirements of Section 13(a) or 15(d) of the Securities Exchange Act of 1934, as amended; and (2) The information contained in the Report fairly presents, in all material respects, the financial condition and results of operations of the Company.
/s/ Mary A. LaschingerMary A. LaschingerChairman and Chief Executive OfficerNovember 7, 2017

EXHIBIT 32.2
CERTIFICATION PURSUANT TO18 U.S.C. SECTION 1350,
AS ADOPTED PURSUANT TOSECTION 906 OF THE SARBANES-OXLEY ACT OF 2002
In connection with the Quarterly Report on Form 10-Q of Veritiv Corporation (the “Company”) for the period ended September 30, 2017 as filed with theSecurities and Exchange Commission on the date hereof (the “Report”), I, Stephen J. Smith, Senior Vice President and Chief Financial Officer of the Company,certify, pursuant to 18 U.S.C. § 1350, as adopted pursuant to § 906 of the Sarbanes-Oxley Act of 2002, to my knowledge, that:
(1) The Report fully complies with the requirements of Section 13(a) or 15(d) of the Securities Exchange Act of 1934, as amended; and (2) The information contained in the Report fairly presents, in all material respects, the financial condition and results of operations of the Company.
/s/ Stephen J. SmithStephen J. SmithSenior Vice President and Chief Financial OfficerNovember 7, 2017