Verdicts Arizona 1983-85 · The Honorable Doug Walgren Chairman, ... Processing Time Appendix II...
23
GAO .. October1990 It GAO/1fRD.91·7 United States General Accounting Office .'_, . " Report to Congressional Committees PRODUCT LIABILITY Verdicts in Arizona for 1983-85
-
Upload
nguyendieu -
Category
Documents
-
view
221 -
download
1
Transcript of Verdicts Arizona 1983-85 · The Honorable Doug Walgren Chairman, ... Processing Time Appendix II...
GAO
.. October1990
It
GAO/1fRD.91·7
United States General Accounting Office .'_, . "
Report to Congressional Committees
PRODUCT LIABILITY
Verdicts in Arizona for 1983-85
GAO United States General Accounting Office Washington, D.C. 20548
Human Resources Division
B-240754
October 25, 1990
The Honorable Richard H. Bryan Chairman, Subcommittee on Consumer Committee on Commerce, Science,
and Transportation United States Senate
The Honorable Doug Walgren Chairman, Subcommittee on Commerce,
Consumer Protection, and Competitiveness Committee on Energy and Commerce House of Representatives
In the mid-1980s, businesses and other organizations reported problems obtaining adequate, affordable liability insurance. In response, nationwide attention was focused on the role of litigation, especially trends in the frequency and size of damage awards in court cases, in contributing to problems concerning the cost and availability of liability insurance. At the same time, the Congress and state legislatures debated whether reforming the tort system (the legal rules and judicial procedures for compensating injured parties) would remedy the insurance problems.
Last year, GAO issued Product Liability: Verdicts and Case Resolution in Five States (GAO/HRD-89-99, Sept. 1989) to assist the Congress in its deliberations on uniform product liability law at the federallevel.1 Currently, however, each state establishes its own legal standards for product liability cases. Reform advocates, therefore, have focused much of their efforts on changing state laws. The resultant activity in the states has been widespread, but has varied considerably from state to state.
In general, policymakers and researchers have noted a persistent lack of information, especially at the state level, on awards and the bases of liability. This lack of information makes both congressional and state deliberations about needed reforms difficult. To facilitate these deliberations, for four of the five states reviewed in our earlier report, we are providing detailed state-level information on verdicts in product liability
I Manufacturers involved in interstate commerce have contended that as a result of variations in state laws. they are being held to different liability rules in different states, further complicating estimation of risk for insurance purposes. We found that federal reforms, if sufficiently clear, would make the application of product liability law more uniform in the 50 states. The impact of such federal reforms would, however, depend on the specifics of the legislation enacted.
Page 1 GAO/HRI).91-7 Product Liability Verdicts for Arizona

Background
8-240754
cases.2 We are addressing these reports to you because the Subcommittees you chair have recently held hearings and the full Committees have reported favorably the proposed legislation to establish uniform product liability laws.3 In this report, we present information for Arizona.
Generally, proposed reforms have been designed to remedy alleged problems in the tort system, including increasingly large awards and high litigation costs. Defendants have claimed that the basis of liability has shifted from liability based on intent or negligence toward a de facto no-fault liability system financed entirely by manufacturers. Data limitations have fueled debate on (1) the magnitude of these problems and (2) whether reforms would alleviate them.
In our earlier report on product liability, we analyzed data on (1) the frequency and size of awards and payments, (2) liability standards used to decide cases, (3) posttrial activities and adjustments to awards, (4) time and cost of litigation, and (5) potential effects of federal reform measures. We collected these data for cases in Arizona, Massachusetts, Missouri, North Dakota, and South Carolina.' Not surprisingly, we found significant differences from state to state.
We concluded that, in general, (1) damage awards in the five states were strongly associated with severity of the injury and, presumably, the underlying economic loss and (2) liability was still based largely on negligence. We found that appeals and posttrial settlement negotiations reduced the size of the majority of awards over $1 million. Appellate courts also eliminated many punitive damage awards (which are designed to punish flagrant or intentional wrongdoing and to deter others from similar conduct). These activities, however, added to the substantial cost and time required to resolve claims.
2We are not issuing a separate report for one of the states, North Dakota, because of the small number of cases in that state
3In May 1990, the Committee on Commerce, Science, and Transportation reported S. 1400, the Product Liability Reform Act of 1989, favorably to the Senate. In June 1988, the Committee on Energy and Commerce reported H.R. 1115, the Uniform Product Safety Act of 1988, favorably to the House. In December 1987, the Subcommittee on Commerce, Consumer Protection, and Competitiveness had approved that bill.
'We based our selection of states on (1) whether product liability cases could be identified without manually searching thousands of case files, (2) the amount of information already published on product liability litigation in the jurisdictions, and (3) the relative costs associated with obtaining the information. The five states offer a mix in terms of region of the country, degree of urbanization, numbers of manufacturers and manufacturing employees, and tort laws (see Product Liability: Verdicts and Case Resolution in Five States, pp. 76-77).
Page 2 GAO;1lRD-91-7 Product IJabllity Verdicts for Arizona
Product Liability in Arizona
B-2407M
Tort reform advocates do not consider the state of Arizona to be a problem state in terms of excessive damage awards or inappropriate bases of liability. Little effort, therefore, has been expended to reform product liability law in the state. No bill specifically targeting product liability has been proposed.
Some efforts have been made, however, to change personal injury law; such changes would affect the large majority of product liability cases since these cases are usually brought for personal injury (that is, bodily harm as opposed to contracts, real property, or property damage cases). Most important, in 1987, the legislature abolished the doctrine of joint and several liability in personal injury cases, except in cases of intentional wrongdoing or hazardous waste. Under the doctrine, a defendant may be held responsible for all of a plaintiff's damages even though some degree of fault is attributable to others. The plaintiff cannot collect more than the total amount of damages awarded, but may collect all damages from any defendant(s) found liable. With abolition of the doctrine, each defendant is now responsible for paying only his or her share of responsibility for the injury.5
In several respects, our findings in Arizona were distinct from those in the other four states we reviewed and in other studies.6 First, the average award in Arizona was $1.5 million, double the average of $685,000 for the other four states combined. Second, Arizona and two of the other states had a high rate of punitive damage awards relative to the remaining two states and to jurisdictions reported on in other studies.7 Finally, cases in Arizona were appealed less often than average; posttrial reductions to awards of compensatory damages, designed to replace the losses caused by injuries, were smaller.
5In 1986, a general referendum failed to abolish the constitutional prohibition against any limitation on damage awards in personal injury cases.
6See Mark Peterson, Syam Sarma, and Michael Shanley, Punitive Damages: Empirical Findings (Santa Monica, Calif.: The Rand Corporation, The Institute for Civil Justice, 1987) and Stephen Daniels, "Punitive Damages: The Real Story," ABA Journal (Aug. 1, 1986).
7In our 1989 report, 25 percent of awards in Arizona and South Carolina included punitive damages, as did 18 percent in Missouri. In contrast, only one award in North Dakota included punitive damages and no punitive damages were awarded in Massachusetts (see Product Liability: Verdicts and Case Resolution in Five States, p. 29). In another study, punitive damages were awarded in only six product liability cases in Cook County and San Francisco in the 25-year period ending in 1984 (see Peterson, Sarma, and Shanley, Punitive Damages: Empirical Findings, pp. 12-15). Only 2 of 32 jurisdictions in another study showed a rate of punitive damage awards as high as Arizona (see Daniels, "Punitive Damages: The Real Story," pp. 60-63).
Page 3 GAO/HRI>-91-7 Product LIability Verdicts for ArIzona
Scope and Methodology
80240754
In this report, we provide information for 59 product liability cases that were resolved through verdicts in 1983-85 in 9 of Arizona's 15 state superior courts and in the U.S. District Court (federal court) in Arizona. Of the 59 cases we studied, 56 were heard in state courts. The 9 state superior courts cover 88 percent of the state's population and nine counties, encompassing the largest urban counties of Maricopa (including Phoenix) and Pima (including Tucson). We describe
• the accidents giving rise to product liability cases, the parties to the cases, the allegations and demands contained in plaintiffs' complaints, and the amount of time spent at each stage of cases - from the accidents to final court actions (see app.I);
• the percentage of cases in which defendants were found liable, the bases of liability, and the amount of compensatory and punitive damages awarded (see app. II); and
• the frequency of posttrial adjustments to awards and actual payments made to plaintiffs after verdict (see app. III).
For a discussion of the methodology used to identify cases and collect data, see appendix IV.
We are sending copies of this report to members of Congress, state legislators and officials, and other interested parties. The report is also available on request. If you have any questions, please call me on (202) 275-6193. Other major contributors are listed in appendix V.
~7,2J~ Joseph F. Delfico Director, Income Security Issues
Page 4 GAO/1fRD.91·7 Product Liability Verdicts for Arizona

Page 5 GAO/IJRD.91-7 Product Liability Verdicts for Arizona
Contents
Letter
Appendix I Cases That Went to Verdict: Accidents, Parties, Demands, and Processing Time
Appendix II Verdicts: Rate and Size of Awards
Appendix III Payments: Effects of Statutes and Posttrial Activities
Appendix IV Methodology
Appendix V Major Contributors to This Report
Tables Table 1.1: Large Minority of Accidents Involved Machinery
Table 1.2: Majority of Injured Parties Suffered Personal Injury
Table 1.3: Typical Injured Party an Adult Male, Married, and Working
Table 1.4: Higher Proportion of Plaintiffs Than Defendants Went to Verdict
Table 1.5: Majority of Plaintiffs Who Went to Verdict Were Those Harmed by Products
1
8
13
16
19
21
8
8
9
9
10
Page 6 GAOjHRJ).91-7 Product Liability Verdicts for Arizona
Figure
Contents
Table 1.6: Majority of Defendants Who Went to Verdict Were Manufacturers
Table 1.7: Most Plaintiffs Resided in Arizona and Most Defendants Were Headquartered in Other States
Table 1.8: Monetary Demands Increased With h\iury Severity
Table 1.9: Neligence the Predominant Basis of Liability Claimed by Plaintiffs
Table ILl: Defendants Found Liable in Just Under OneHalf of Cases
Table II.2: Liability Rates for Key Defendant Types Similar
Table II.3: Extremely Large Awards Accounted for Majority of Total Amount Awarded
Table II.4: Total Award Amount for Compensatory and Punitive Damages Varied by Type and Severity of Injury
Table II.5: Compensatory Damages Varied by Type and Severity of Injury
Table II.6: Punitive Damages Large Table II.7: Negligence a Basis of Liability in 3 of Every 4
Cases in Which Defendants Found Liable Table II1.l: Defendents' Payments to Plaintiffs May Differ
From Initial Awards as a Result of Statutory Limits and Posttrial Activities
Table IlI.2: Adjustments to Awards by Trial Court Judges Reduced the Total Amount Awarded by 16 Percent
Table III.3: Appeals More Frequent in Cases Plaintiffs Won Than Those Defendants Won
Table IlI.4: Appeals Rate Varied by Size and Type of Award
Table II1.5: Net Effect of Posttrial Actions Reduced Payments by 40 Percent
Table II1.6: Cases With Reduced Awards Most Often Resolved by Posttrial Settlements
Figure Ll: On Average, Cases Took 2-1/2 Years to Reach Verdict and Appeals 1 Year to Resolve
10
10
11
11
13
13
13
14
14
15 15
16
16
17
17
18
18
12
Page 7 GAOjHRI)-91·7 Product IJabllity Verdiets for Arizona
Appendix I
Cases That Went to Verdict: Accidents, Parties, Demands, and Processing Time
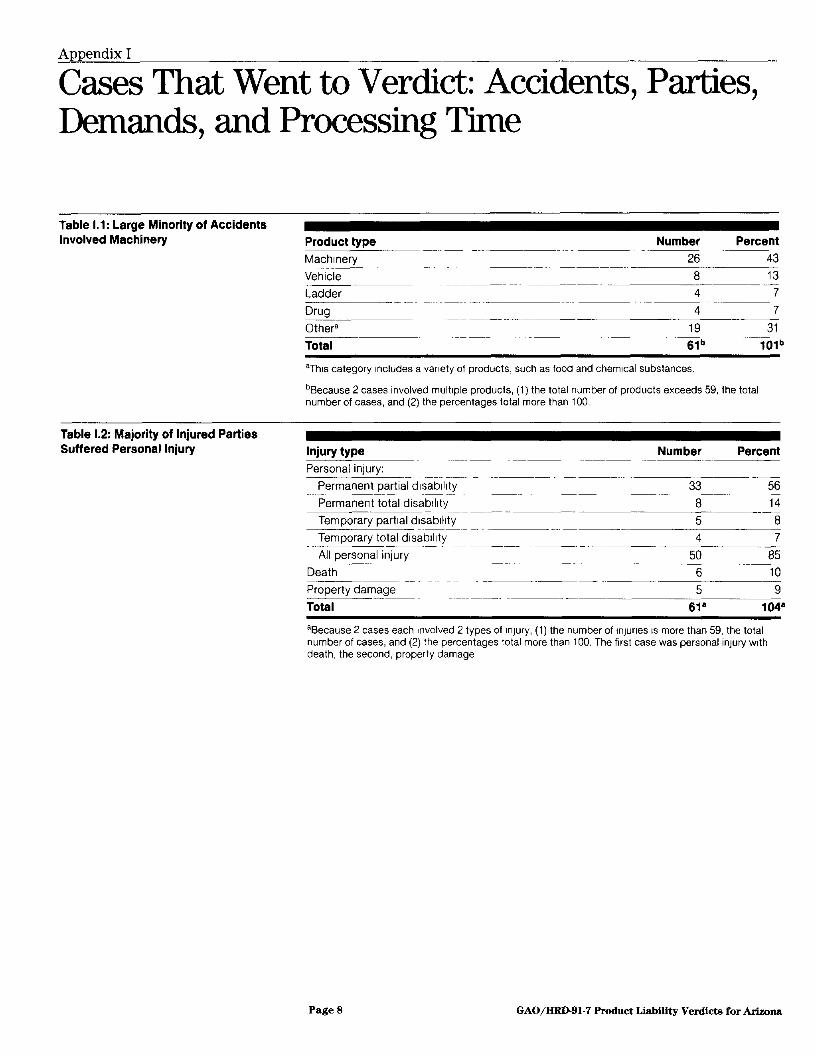
Table 1.1: Large Minority of Accidants Involved Machinery
Table 1.2: Majority of Injured Parties Suffered Personal Injury
Product type Number Percent ----~~~~~~. ~~~-
Machinery -:----'-~~~
Vehicle
26 43
8 13
Ladder 4 7
Drug 4 7 ~~~~-
Othera 19 31 ~.~-~~-~~~--
Total 61 b 101 b
aThlS category Includes a variety of products. such as food and chemical substances.
bBecause 2 cases involved multiple products, (1) the total number of products exceeds 59, the total number of cases, and (2) the percentages total more than 100.
Injury type Number Percent Personal injury:
Permanent partial disability 33 Permanent total disability
----~--cc-
8 . -~- ~--.~ ---
Temporary partial disability .--
Temporary total disability
All personal injury
Death
5 4
50 6
~ ----~---~ ~--- -~~-
5
56 14
8 7
85 10
9 Property damage
Total 61 8 1048
aBecause 2 cases each involved 2 types of Injury, (1) the number of injuries IS more than 59, the total number of cases, and (2) the percentages total more than 100. The first case was personal injury With death, the second, property damage
PageS GAO /HRD-91-7 Product Liability Verdicts for Arizona
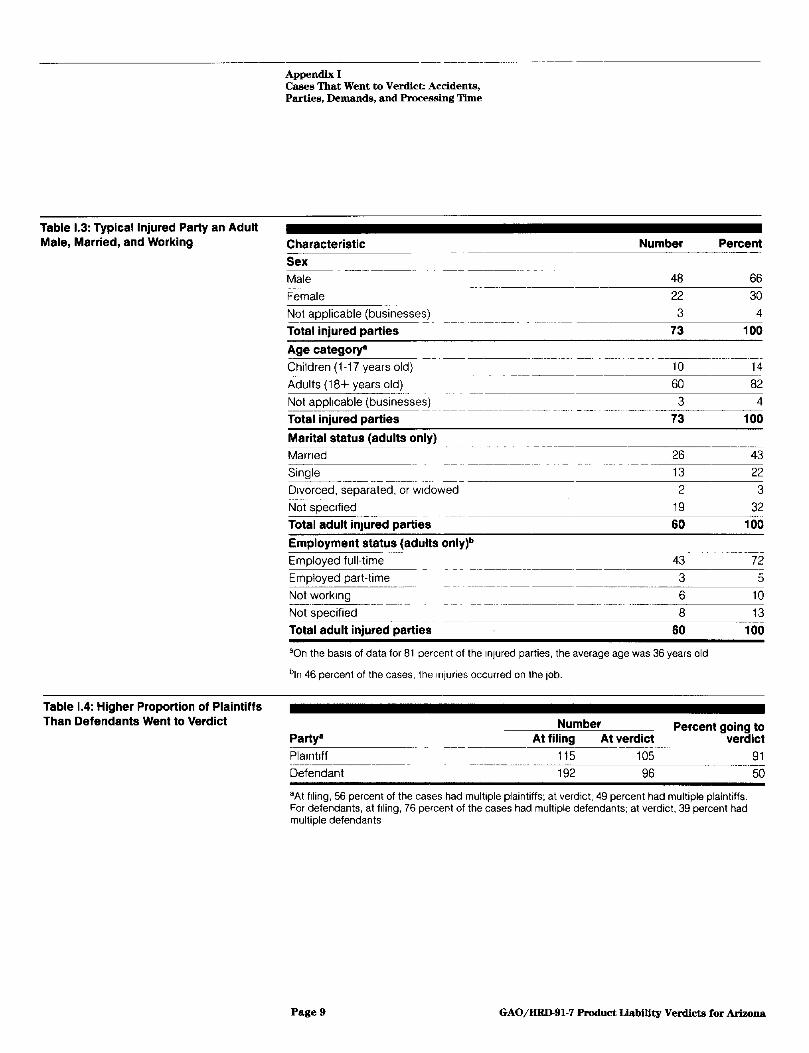
Table 1.3: Typical Injured Party an Adult Male, Married, and Working
Table 1.4: Higher Proportion of Plaintiffs Than Defendants Went to Verdict
Appendix I Cases That Went to Verdict: Accidents, Parties, Demands, and Processing Time
Characteristic
Sex
Male
Female
Not applicable (businesses)
Total injured parties
Age category"
Children (1-17 years old)
Adults (18+ years old)
Not applicable (businesses)
Total injured parties
Marital status (adults only)
Marned ------
Single
Divorced, separated, or widowed
Not specified
Total adult inJured parties
Employment status (adults only)b
Employed full-time
Employed part-time
Not working -.-----~- ---
Not specified
Total adult injured parties
Number
48 66
22 30
3 4
73 100
---------10 14
60 82
3 4
73 100
26 43
13 22
2 3
19 32
60 100
43 72
3 5
6 10
8 13
60 100
aOn the baSIS of data for 81 percent of the Injured parties, the average age was 36 years old
bin 46 percent of the cases, the Injuries occurred on the job.
Number Percent going to Party" At filing At verdict verdict
------~--------
Plaintiff 115 105 91 ---,---
Defendant 192 96 50
aAt filing, 56 percent of the cases had multiple plaintiffs; at verdict, 49 percent had multiple plaintiffs. For defendants, at filing, 76 percent of the cases had multiple defendants; at verdict, 39 percent had multiple defendants
Page 9 GAO/1lRD-91-7 Product Liability Verdicts for Arizona
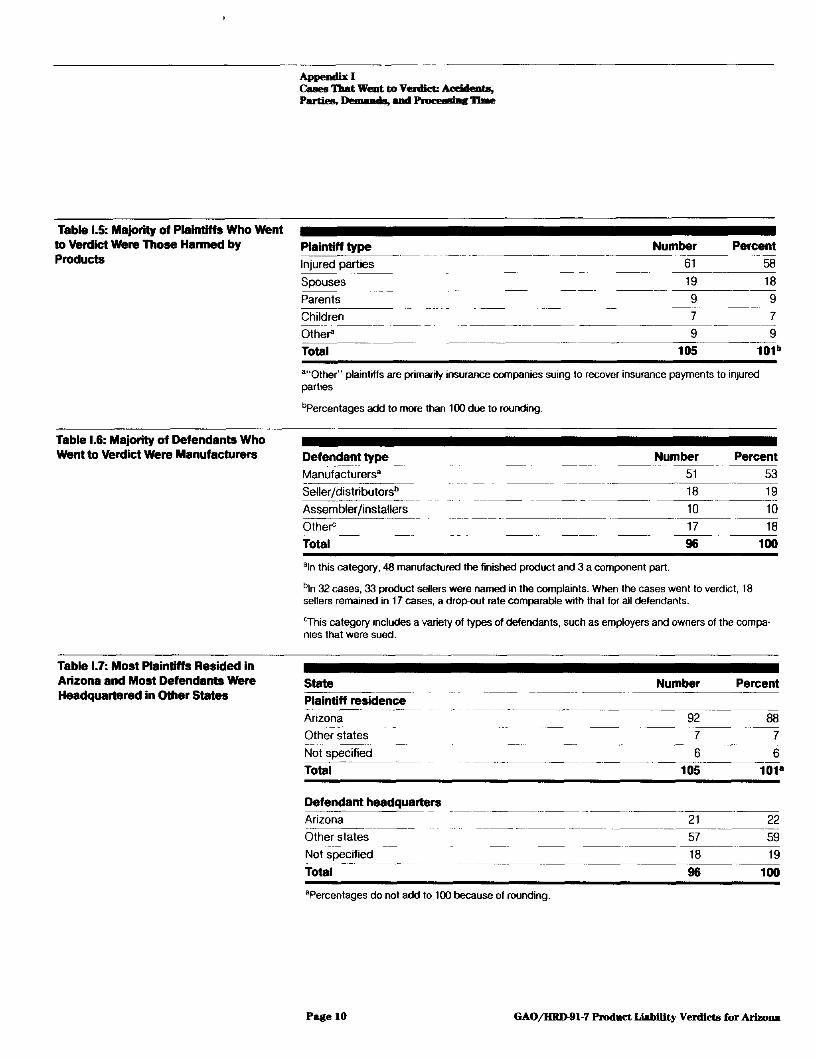
Table 1.5: Majority of Plaintiffs Who Went to Verdict Were Those Hanned by Products
Table 1.6: Majority of Defendants Who Went to Verdict Were Manufacturers
Table 1.7: Most Plaintiffs Resided in Arizona and Most Defendants Were Headquartered in Other States
AppendiIl Cases Tbat Went to VenIict:: Acddenbl, Parties, Denumds, ................... g11me
Plaintiff type
Injured parties
Spouses -'------- --
Parents
Children
Other"
Total
---------
Number Percent
61 58
19 18 9 9 7 7 9 9
105 101 b
'''Other'' plaintiffs are primarily insurance companies suing to recover insurance payments to injured parties
bpercentages add to more than 100 due to rounding.
Defendant type
Manufacturers'
Number
Seller /distributorsb
Assembler/installers
Other"
Total
------ --- _._---
.------- -.--- ._---
"In this category, 48 manufactured the finished product and 3 a component part.
51 18 10 17 96
Percent
53 ._---
19 --
10 -----
18 100
bin 32 cases, 33 product sellers were named in the complaints. When the cases went to verdict, 1 B seliers remained in 17 cases, a drop-out rate comparable with that for ali defendants.
"This category .ncludes a variety of types of defendants, such as employers and owners of the companoes that were sued.
State
Plaintiff residence
Arizona -------Other states ---Not specified
Total
Defendant headquarters
Arizona -------
Other states
Not specified
Total
Number Percent
92 88 7 7 6 6
--------105 101"
21 22 -------- ---- ---
57 59 -----
18 19 96 100
"Percentages do not add to 100 because of rounding.
Page 10 GAO/HIID-91-7 Product Liability Verdicts for Arizona
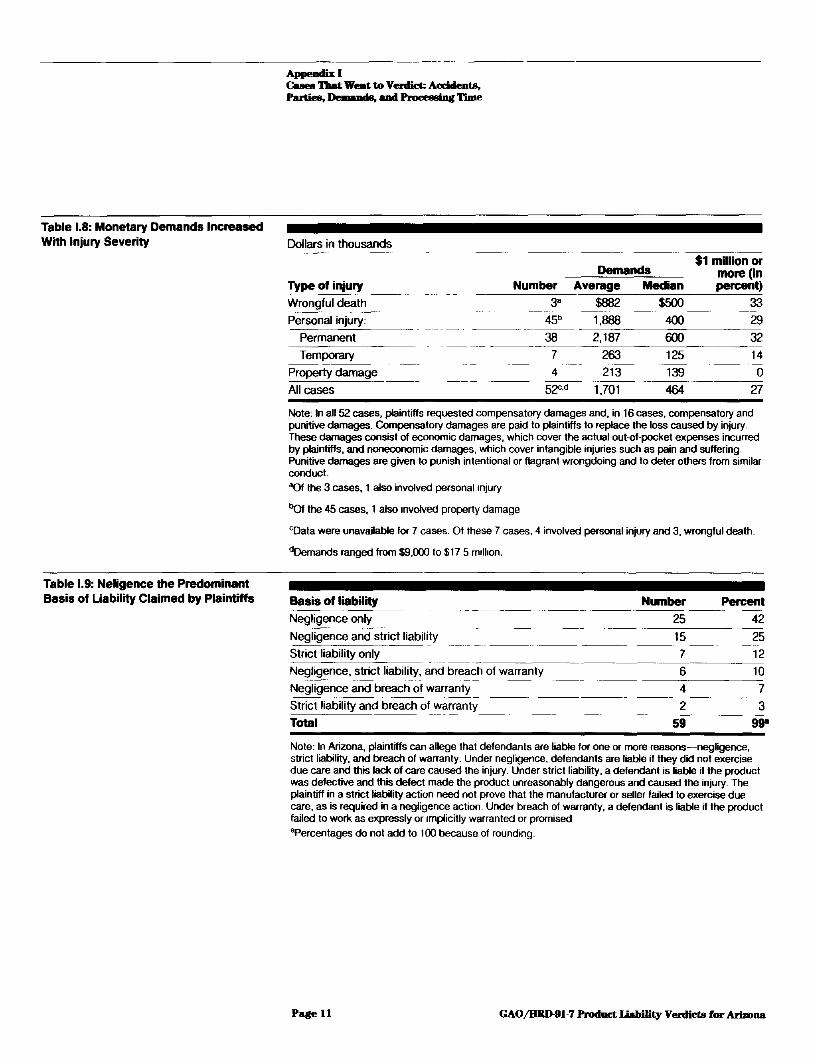
Table 1.8: Monetary Demands Increased With Injury Severity
Table 1.9: Neligence the Predominant Basis of Liability Claimed by Plaintiffs
AppeDdlII Cases 'l1Iat Weat ... Venlkt: Atx:identB, Parties, Demaads, ..... ProeeIIsiDg TIme
Dollars in thousands --_.
Demands Type of in;ury Number Average Median Wrongful death
Personal injury:
Permanent
Temporary
Property damage
All cases
.. ----
--------
3"
45b .----
38 7
4
52"'"
$882 $500
1.888 400
2.187 600 263 125
213 139
1.701 464
$1 million or more (in percent)
33
29
32
14
0
27
Note: In all 52 cases. plaintiffs requested compensatory damages and, in 16 cases, compensatory and punitive damages. Compensatory damages are paid to plaintiffs to replace the loss caused by injury. These damages consist of economic damages, which cover the actual out-of-pocket expenses incurred by plaintiffs, and noneconomic damages, which cover intangible injuries such as pain and suffering. Punitive damages are given to punish intentional or flagrant wrongdoing and to deter others from similar conduct "Of the 3 cases, 1 also involved personal Injury
"01 the 45 cases, 1 also Involved property damage
CData were unavailable for 7 cases. 01 these 7 cases, 4 involved personal injury and 3, wrongful death.
"Demands ranged from $9,000 to $17 5 mIllIon.
Basis of liability Number Percent -- -- ---_._--------=-------:-::-
Negligence only 25 42 --_. __ . Negligence and strict liability 15 25
- ---.--. ---- ---- ------c=---Strict liability only 7 12
Negligence. strict liability, and breach of warranty 6 10 -----
Negligence and breach of warranty 4 7 -- . -_. ---- ------ --------.
Strict liability and breach of warranty 2 3 ----.---- -----
Total 59 99"
Note: In Arizona, plaintiffs can allege that defendants are liable for one or more reasons-negligence, strict liability, and breach of warranty. Under negligence, defendants are liable if they did not exercise due care and this lack of care caused the injury. Under strict liability, a defendant is liable if the product was defective and this defect made the product unreasonably dangerous and caused the injury. The plaintiff in a strict liability action need not prove that the manufacturer or seller failed to exercise due care, as is required in a negligence action. Under breach of warranty, a defendant is liable if the product failed to work as expressly or Implicitly warranted or promised
"Percentages do not add to 100 because of rounding.
Page 11 GA0/BRD-91-7 Product Liability Verdicts for Arizona
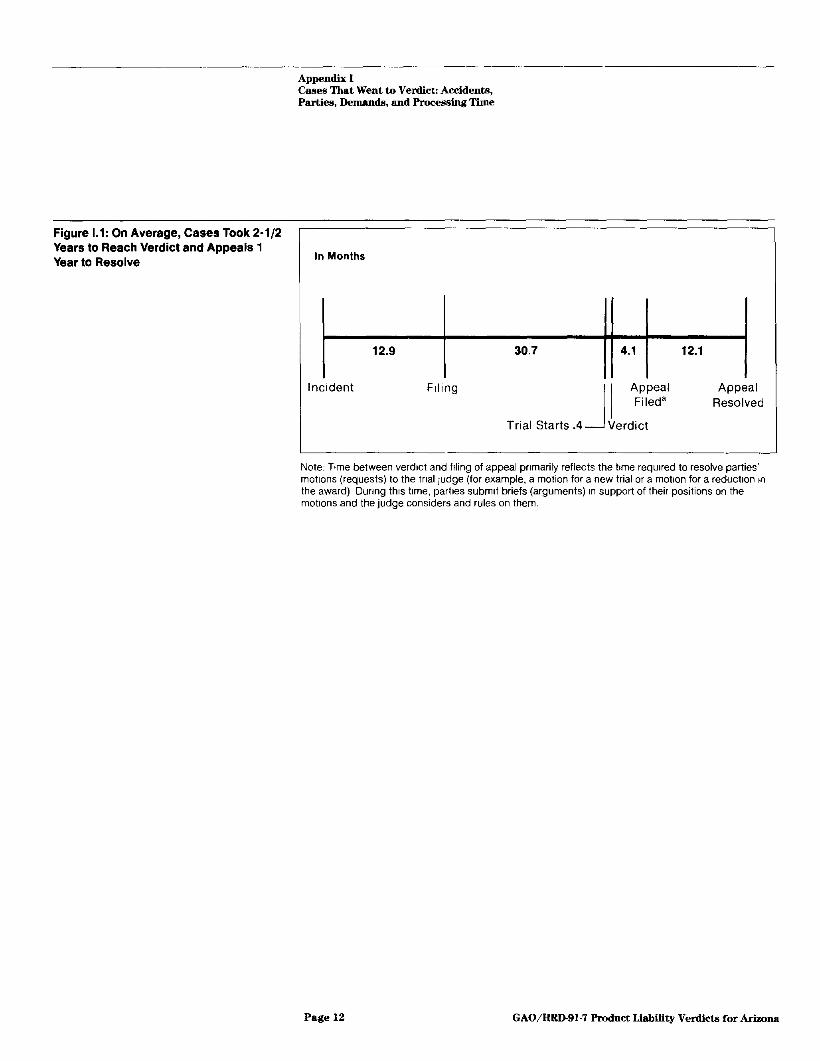
Figure 1.1: On Average, Cases Took 2-1/2 Years to Reach Verdict and Appeals 1 Year to Resolve
Appendix I Cases That Went to Verdict: Accidents, Parties, Demands, and Processing Time
In Months
12.9
Incident Filing
30.7 4.1
J I Appeal Fileda
Trial Starts .4 Verdict
12.1
Appeal Resolved
Note: Time between verdict and filing of appeal primarily reflects the time required to resolve parties' motions (requests) to the tnal Judge (for example, a motion for a new trial or a motion for a reduction In the award) DUring thiS time, parties submit briefs (arguments) In support of their positions on the motions and the judge considers and rules on them
Page 12 GA0/1fRD.91·7 Product Liability Verdicts for Arizona
Appendix II
Verdicts: Rate and Size of Awards
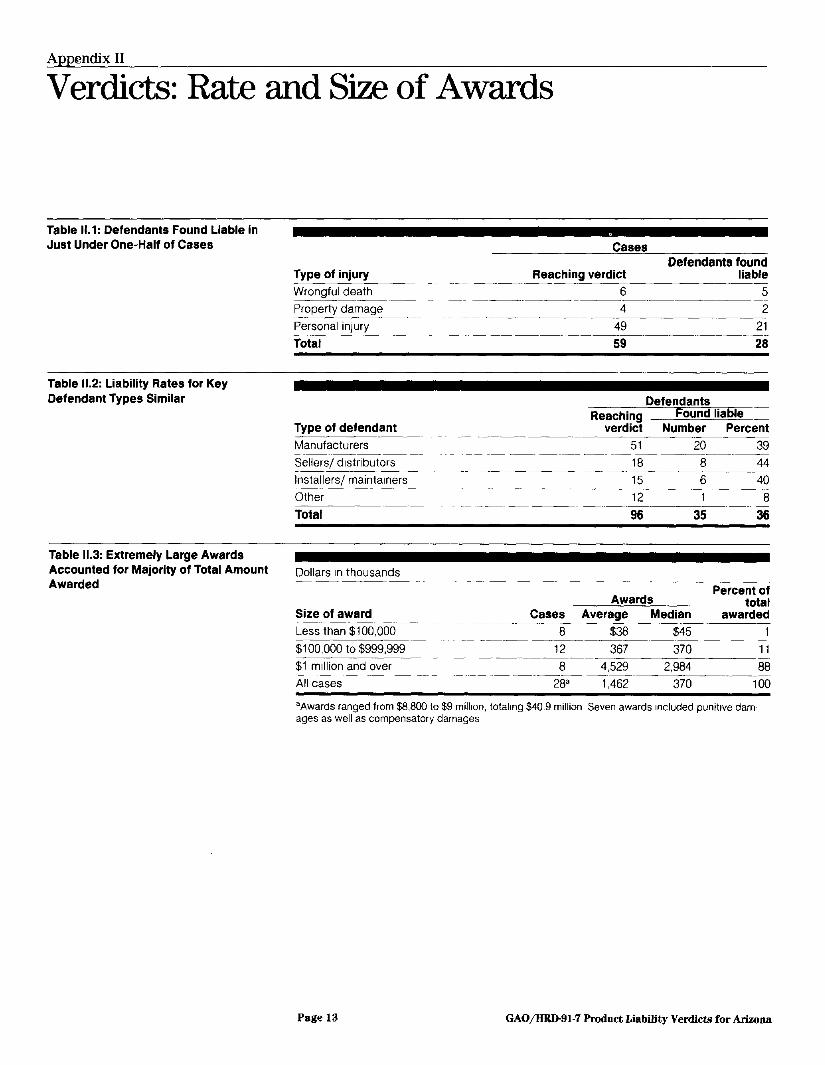
Table 11.1: Defendants Found Liable in Just Under One-Half of Cases
Table 11.2: Liability Rates for Key Defendant Types Similar
Table 11.3: Extremely Large Awards Accounted for Majority of Total Amount Awarded
Type of injury Wrongful death ----,----,-Property damage
Personal injury ~---
Total
Type of defendant Manufacturers
Sellers/ distributors
Installers/ maintalners ~---~-------
Other
Total
Dollars In thousands
Size of award Less than $100,000
$100,000 to $999,999
$1 million and over -----
All cases
Cases Defendants found
Reaching verdict liable ~---------~--,---~--~---
6 5 -----"-------,---~--~---
4 2 -- ----_._---------- ----
49 21 -, ~------- -------,~~-
59 28
Defendants Reaching Found liable
verdict Number Percent 51 20 39
- ----~-------------,---,-~
lB B 44 ---- ------ ---' ------ ,--,~----
15 6 40 ~----
12 1 B - -- ------- ------ -, --
96 35 36
Awards Cases Average
---~-,~~-- -----B $38
Median $45
12 367 370
8 4,529 2,9B4
Percent of total
awarded 1
11
BB ---- --~ ------ -'---~---=:::-- ----
28" 1 ,462 370 100
"Awards ranged from $8,800 to $9 million, totaling $40,9 million Seven awards Included punitive damages as well as compensatory damages
Page 13 GAO;1lRD-91-7 Product Liability Verdicts for Arizona
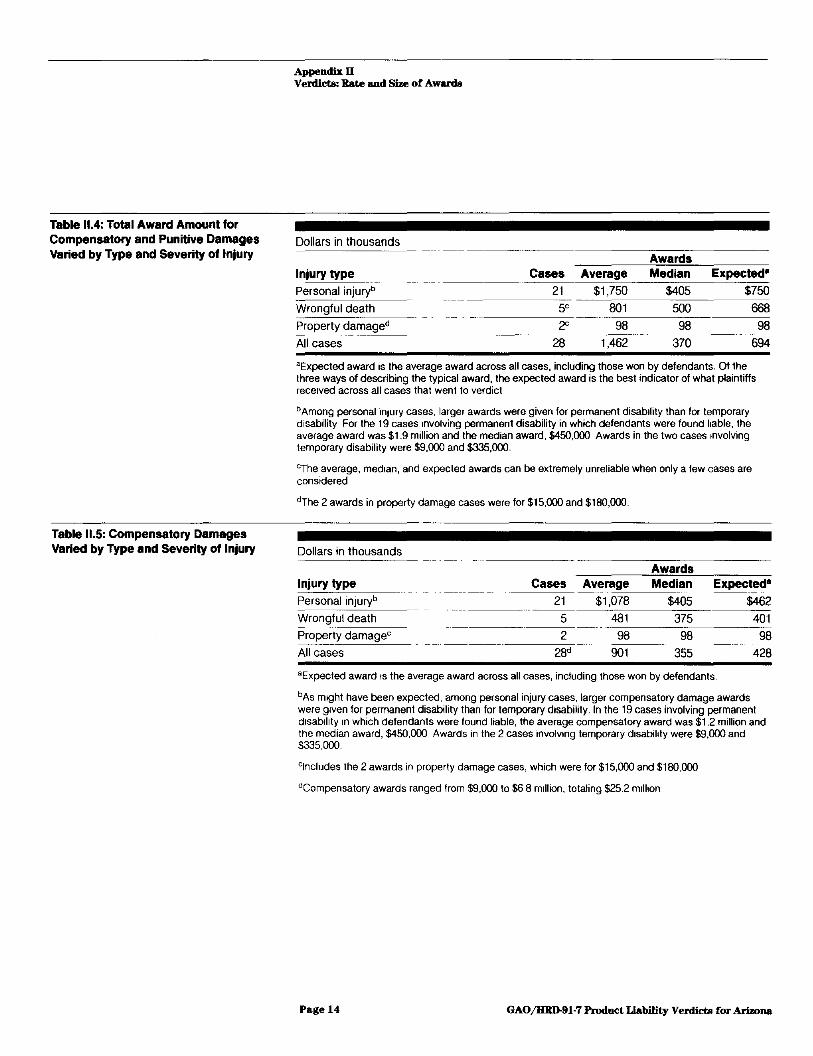
Table 11.4: Total Award Amount for Compensatory and Punitive Damages Varied by Type and Severity of Injury
Table 11.5: Compensatory Damages Varied by Type and Severity of Injury
AppendixU Verdicts: Rate and Size of AWlU'ds
Dollars in thousands ---- ------_ ..
Awards Injury type Cases Average Median Expected" Personal injuryb 21 $1,750 $405 $750 Wrongful death 5c 801 500 668 Property damaged 2" 98 98 98 All cases 28 1,462 370 694
aExpected award is the average award across all cases, including those won by defendants. Of the three ways of describing the typical award, the expected award is the best indicator of what plaintiffs received across all cases that went to verdict
b Among personal injUry cases, larger awards were given for permanent disability than for temporary disability For the 19 cases Involving permanent disability in which defendants were found liable, the average award was $1.9 million and the median award, $450,000 Awards in the two cases Involving temporary disability were $9,000 and $335,000.
cThe average, median, and expected awards can be extremely unreliable when only a few cases are considered
dThe 2 awards in property damage cases were for $15,000 and $180,000.
Dollars in thousands
Awards Injury type Cases Average Median Expected" Personal injuryb
Wrongful death
Property damageC
All cases
21 5 2
----_.------:=-=-28d
$1,078 $405 481 375 98 98
901 355
aExpected award IS the average award across all cases, including those won by defendants.
$462 401 98
428
bAs might have been expected, among personal injury cases, larger compensatory damage awards were given for permanent disability than for temporary disability. In the 19 cases involving permanent disability In which defendants were found liable, the average compensatory award was $1.2 million and the median award, $450,000 Awards in the 2 cases involVing temporary disability were $9,000 and $335,000.
Clncludes the 2 awards in property damage cases, which were for $15,000 and $180,000
dCompensatory awards ranged from $9,000 to $6 8 million, totaling $25.2 million
Page 14 GAO/HIID-91-7 Product Liability Verdicts for Arizona
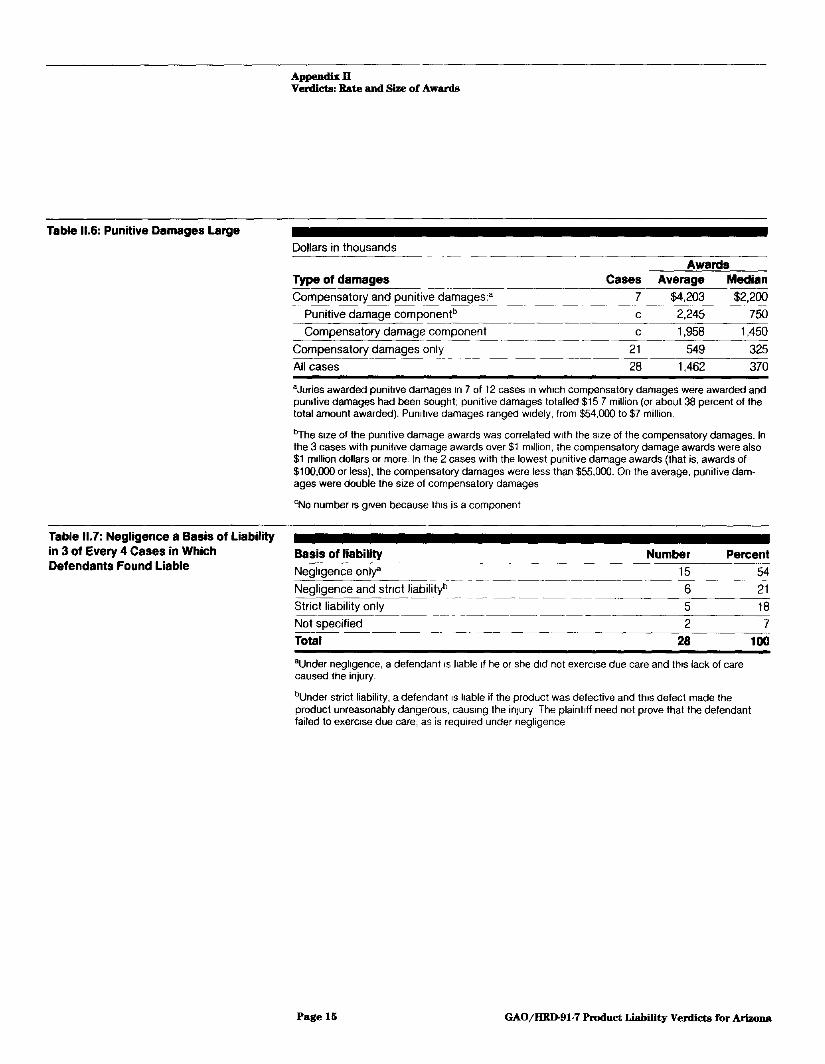
Table 11.6: Punitive Damages Large
Table 11.7: Negligence a Basis of Liability in 3 of Every 4 Cases in Which Defendants Found Liable
Appendixll Verdicts: Rate and Size of Awards
Dollars in thousands
Type of damages ---'-''------'~-- ----------Compensatory and punitive damages:"
'---------Punitive damage componentb
Compensatory damage component
Cases
7
c c
-- --._--,-------Compensatory damages only
- ----- -----
All cases
21
28
Awards Average Median
$4,203 $2,200
2,245 750
1,958 1,450
549 325
1,462 370
a Juries awarded punitive damages In 7 of 12 cases In which compensatory damages were awarded and pUnitive damages had been sought: punitive damages totalled $15 7 million (or about 38 percent of the total amount awarded). Punitive damages ranged Widely, from $54,000 to $7 million.
"The size of the punitive damage awards was correlated with the sIZe of the compensatory damages. In the 3 cases with punitive damage awards over $1 million, the compensatory damage awards were also $1 million dollars or more. In the 2 cases with the lowest punitive damage awards (that is, awards of $HlO,OOO or less), the compensatory damages were less than $55,000. On the average, punitive damages were double the size of compensatory damages
eNo number IS given because this is a component
Basis of liability -----Negligence only"
Negligence and stnct liabilityb
Number ---- ---._---
15 -------------------
6
Percent
54 21
5 18 Strict liability only c----~_c_--=---- -----------. Not specified 2 7
Total 28 100
"Under negligence, a defendant IS liable If he or she did not exercise due care and this lack of care caused the injury.
bUnder strict liability, a defendant IS liable if the product was defective and thiS defect made the product unreasonably dangerous, causing the injury The plaintiff need not prove that the defendant failed to exerCise due care, as is required under negligence
Page III GAO/HRD-91-7 Product Liability Verdicts for Arizona
Appendix III
Payments: Effects of Statutes and Posttrial Activities
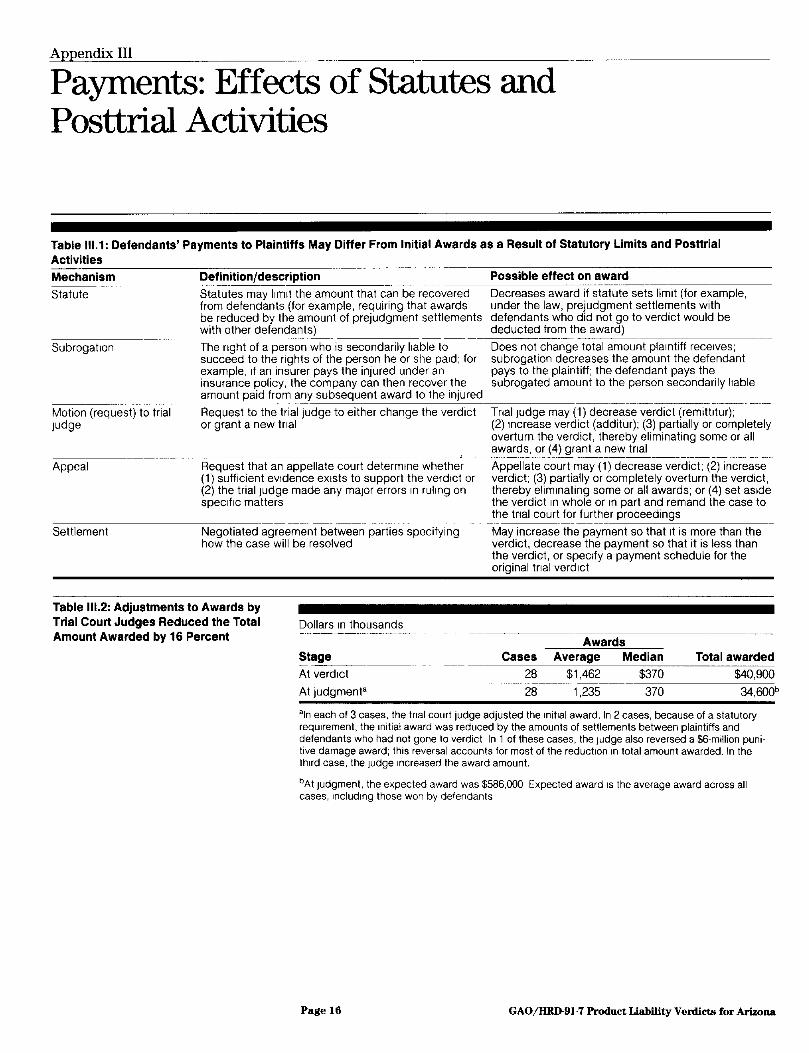
Table 111.1: Defendants' Payments to Plaintiffs May Differ From Initial Awards as a Result of Statutory Limits and Posttrial Activities Mechanism Definition/description ~----------------~----~. ~~----~~~ Statute Statutes may limit the amount that can be recovered
from defendants (for example, requiring that awards be reduced by the amount of prejudgment settlements with other defendants)
Subrogation
Motion (request) to trial Judge
Appeal
Settlement
The nght of a person who is secondarily liable to succeed to the rights of the person he or she paid; for example, If an insurer pays the injured under an insurance policy, the company can then recover the amount paid from any subsequent award to the injured
Request to the trial judge to either change the verdict or grant a new tnal
Request that an appellate court determine whether (1) sufficient eVidence eXists to support the verdict or (2) the trial Judge made any major errors In ruling on speCifiC matters
Negotiated agreement between parties specifying how the case will be resolved
Table 111.2: Adjustments to Awards by Trial Court Judges Reduced the Total Amount Awarded by 16 Percent
Dollars In thousands
Stage
At verdict
At judgmenta
Possible effect on award
Decreases award if statute sets limit (for example, under the law, prejudgment settlements with defendants who did not go to verdict would be deducted from the award)
Does not change total amount plaintiff receives; subrogation decreases the amount the defendant pays to the plaintiff; the defendant pays the subrogated amount to the person secondarily liable
Trial Judge may (1) decrease verdict (remittitur); (2) increase verdict (additur); (3) partially or completely overturn the verdict, thereby eliminating some or all awards, or (4) grant a new tnal
Appellate court may (1) decrease verdict; (2) increase verdict; (3) partially or completely overturn the verdict, thereby eliminating some or all awards; or (4) set aSide the verdict In whole or In part and remand the case to the tnal court for further proceedings
~~~~--~~~ May increase the payment so that It is more than the verdict, decrease the payment so that it is less than the verdict, or speCify a payment schedule for the original tnal verdict
Awards Cases Average Median Total awarded
28 $1,462 $370 $40,900 .. --.... --_._...... --::c::-::-----------::--::-:-c.
28 1,235 370 34,600b
aln each of 3 cases, the tnal court judge adjusted the initial award. In 2 cases, because of a statutory requirement, the Initial award was reduced by the amounts of settlements between plaintiffs and defendants who had not gone to verdict In 1 of these cases. the judge also reversed a $6·million puni· tive damage award; this reversal accounts for most of the reduction In total amount awarded. In the third case, the judge Increased the award amount.
bAt judgment, the expected award was $586,000 Expected award IS the average award across all cases, Including those won by defendants
Page 16 GAOjHRD-91·7 Product Liability Verdicts for Arizona
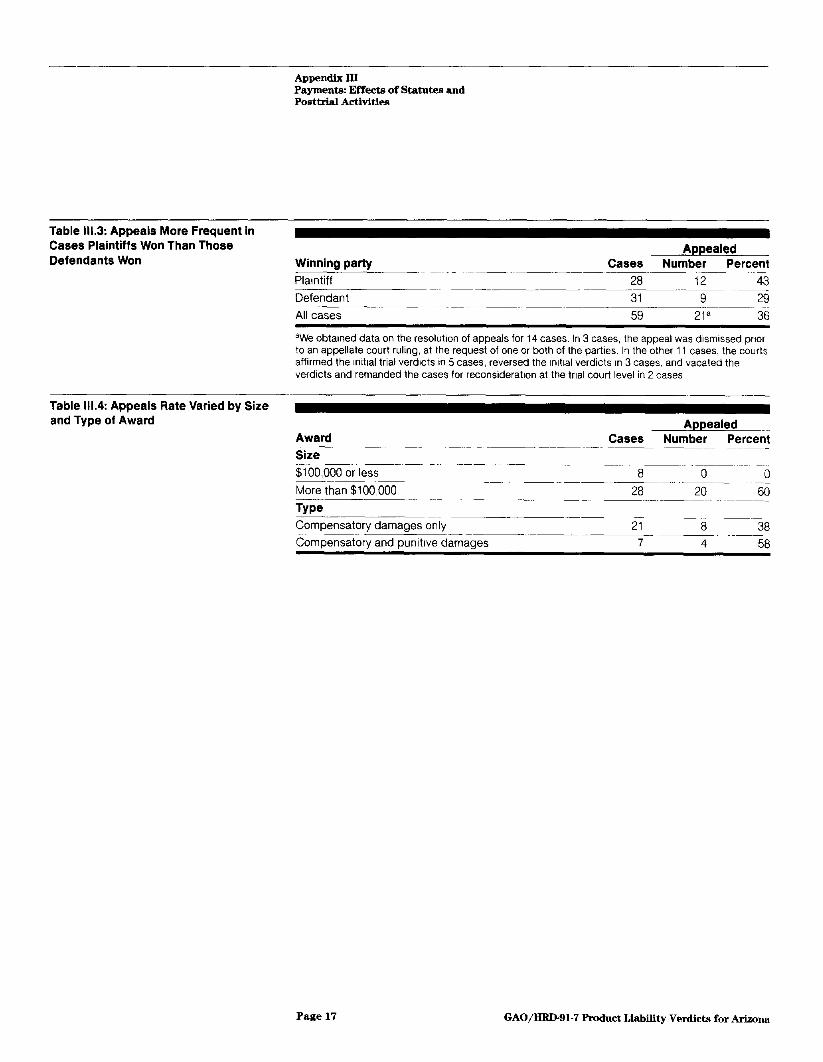
Table 111.3: Appeals More Frequent in Cases Plaintiffs Won Than Those Defendants Won
Table 111.4: Appeals Rate Varied by Size and Type of Award
Appendix III Payments: Effects of Statutes and Posttrial ActIvities
Appealed Winning party Cases Number Percent
--~ .---------------~.-
Plaintiff 28 12 43 ----------- ---------------
Defendant 31 9 29 ---~----- --------""----- --
All cases 59 21 a 36
aWe obtained data on the resolution of appeals for 14 cases. In 3 cases. the appeal was dismissed prior to an appellate court ruling. at the request of one Or both of the parties. In the other 11 cases, the courts affirmed the Initial trial verdicts in 5 cases, reversed the Initial verdicts In 3 cases, and vacated the verdicts and remanded the cases for reconsideration at the trial court level in 2 cases
Award
Size
$100,000 or less
More than $100,000
Type
Compensatory damages only
Appealed Cases Number Percent
------------ ---- ----- ------
----_._--8
28 o
20 o
60 -------_.- ------
21;---8~- 38 -----.. ---- --------=c- ._--
Compensatory and punitive damages 7 4 58
Page 17 GAO/HRI).91-7 Product Liability Venlicts for Arizona
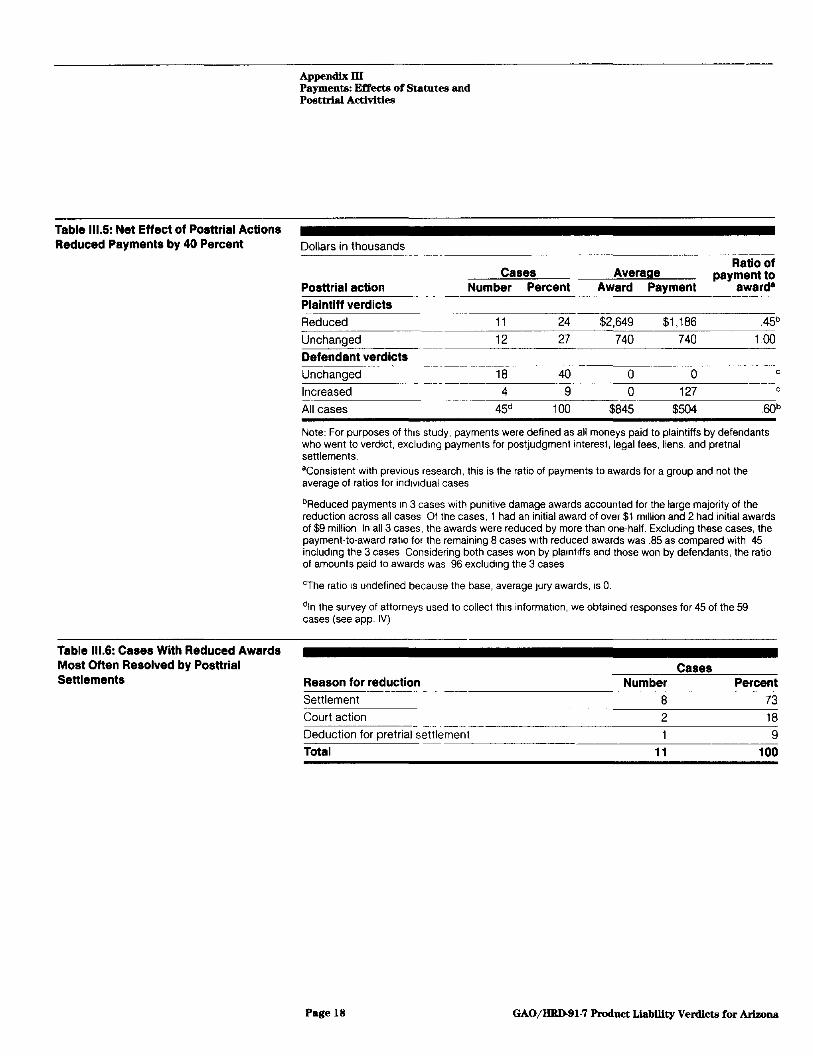
Table 111.5: Net Effect of Posttrial Actions Reduced Payments by 40 Percent
Table 111.6: Cases With Reduced Awards Most Often Resolved by Posttrial Settlements
Appendix ill Payments: Effects of Statutes and Posttrial Activities
Dollars in thousands
Cases Posttrial action Number Percent
Average Award Payment
Ratio of payment to
award" Plaintiff verdicts
Reduced
Unchanged
Defendant verdicts
Unchanged
Increased
All cases
11 24
12 27
18 40
4 9
45d 100
$2,649 $1,186
740 740 100
0 0
0 127
$845 $504 ,6Qb
Note: For purposes of this study, payments were defined as all moneys paid to plaintiffs by defendants who went to verdict, excluding payments for post judgment interest, legal fees, liens, and pretnal settlements,
'Consistent with previous research, this is the ratio of payments to awards for a group and not the average of ratios for individual cases
bReduced payments In 3 cases with punitive damage awards accounted for the large majority of the reduction across all caSes Of the cases, 1 had an initial award of over $1 million and 2 had initial awards of $9 million, In all 3 cases, the awards were reduced by more than one-half, Excluding these cases, the payment-to-award ratio for the remaining 8 cases with reduced awards was .85 as compared with 45 including the 3 cases Considering both cases won by plaintiffs and those won by defendants, the ratio of amounts paid to awards was .96 excluding the 3 cases
cThe ratio IS undefined because the base, average Jury awards, IS 0,
din the survey of attorneys used to collect thiS information, we obtained responses for 45 of the 59 cases (see app. IV)
Cases Reason for reduction Number Percent Settlement 8 73
Court action 2 18
Deduction for pretrial settlement 1 9 Total ---------------::1-:-1-------1:-::0"'"0
Page 18 GAO/HRD-91-7 Product Liability Verdicts for Arizona
~endixIV
Methodology
Selection of Cases
Data Collection
We gathered data on product liability cases resolved in 1983-85 by a judge or jury verdict. To ensure a sufficient number of cases for our analyses, we examined those that went to verdict during a 3-year period; that is, we treat the 3 years as one period, not three consecutive periods. Since appeals can take years to resolve, we estimated that cases closed in 1985 were the most recent for which we could reasonably expect all appeals to have been resolved. We examined cases that were resolved in 9 of Arizona's 15 state superior courts and in the U.S. District Court (that is, federal court) for Arizona. '
We used two jury verdict reporters to identify product liability cases that had been tried in state superior courts.2 These reporters cover the courts in nine counties: Cochise; Gila; Graham; Greenlee; Maricopa, including Phoenix; Pima, including Tucson; Pinal; Santa Cruz; and Yuma; 88 percent of the state's population live in these counties. The reporters listed 56 cases that went to verdict in 1983-85. The large majority of these cases came from Maricopa (39 cases) and Pima (16 cases) counties. We obtained a listing of cases that were resolved in federal court from the Administrative Office of the U.S. Courts.3 The Administrative Office's listing indicated that only 3 cases had gone to verdict in 1983-85.
We were unable to examine (1) any cases that may have been resolved by a judge in state court because our sources were limited to jury verdicts and (2) any cases tried by justices of the peace, who, rather than judges in superior courts, may have tried some cases with small claims (under $2,500).4
From the jury verdict reporters and case files maintained by the courts, we obtained background information, including descriptions of accidents and parties to the lawsuits; the disposition of the cases against each
lCases involving state law can be heard in federal court if (I) all defendants are citizens of states different from all plaintiffs and (2) during 1983-85, at least $10,000 was claimed in damages. Since April 1989, to be heard in federal court, the amount in controversy must be at least $50,000.
2Reporters are listings or digests of court activities prepared by the U.s. government, state governments, or private organizations. usually for subscription sale.
3The Administrative Office's data are generally considered to be the best source for information on product liability cases.
4Superior courts hear all cases with claimed damages of $2,500 or more and share jurisdiction with justices of the peace for claims between $500 and $2,499. Claims under $500 are the exclusive jurisdiction of justices of the peace
Page 19 GAO/HRD-91-7 Product Liability Verdicts for ArIzona

Appen<lixIV Methodology
defendant; the amount of compensatory and punitive damages demanded and awarded; and dates of various stages of case processing, from the date of the accident to final resolution. We also recorded information on posttrial activities, including appeals and settlement negotiations, as well as, when available, their outcomes. To supplement information on appeals, we searched appellate court records, when available, and a computer database that includes nationwide information on appeals (WESTLAW).
To gather information not consistently available from court files and reporters, we sent copies of a questionnaire to plaintiff and defendant attorneys who represented the parties in the cases. Attorneys were asked to report the status of the cases, payments made to date, and how the amounts were determined. Concerning payments, the questionnaire was designed so that a response from only one side in the dispute provided complete case data. We obtained complete payment data for 45 ca..<;es, 76 percent of the 59 cases.
Page 20 GAO/HRJ).91-7 Product Liability Verdicts for Arizona
Appendix V
Major Contributors to This Report
Human Resources Division, Washington, D.C.
(105536)
Cynthia A. Bascetta, Assistant Director, (202) 275-0020 Susan E. Arnold, Assignment Manager Laurel H. Rabin, Reports Analyst
Page 21 GAO;HRD-91-7 Product Liability Verdicts for Arizona
' . . ,~ ..
~~------------------------------------------------------------------------------.'
Ordering Infonnation
The rll'St five copies of each GAO report are free. Additional copies are $2 each. Orders should be sent to the following address, accompanied by a check or money order made out to the Superintendent of Documents, when necessary. Orders for 100 or more copies to be mailed to a single address are discounted 25 percent.
U.S. General Accounting Office P.O. Box 6015 Gaithersburg, MD 20877
Orders may also be placed by calling (202) 275-6241.