Ventilator Waveforms Graphical Presentation - … · Ventilator Waveforms Graphical Presentation ....
52
Ventilator Waveforms Graphical Presentation
Transcript of Ventilator Waveforms Graphical Presentation - … · Ventilator Waveforms Graphical Presentation ....
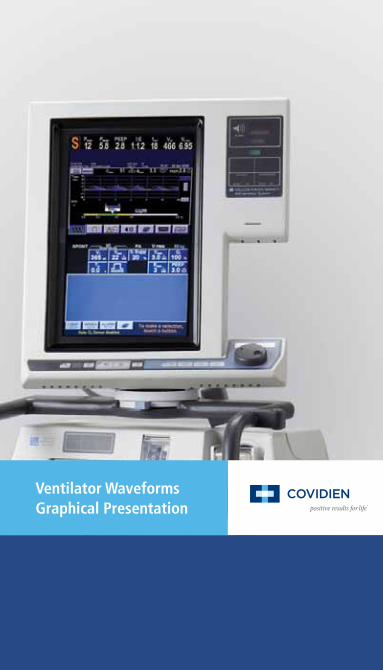
Ventilator WaveformsGraphical Presentation
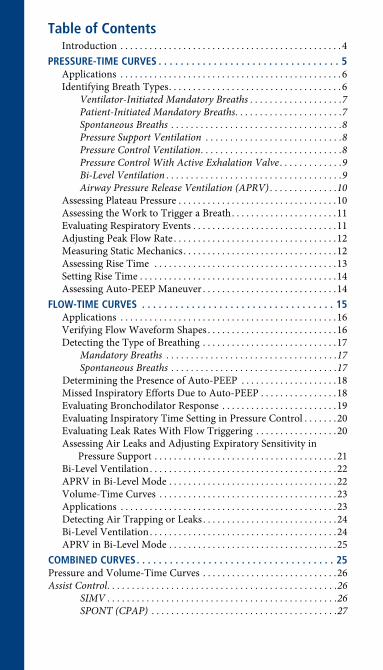
Table of ContentsIntroduction. . . . . . . . . . . . . . . . . . . . . . . . . . . . . . . . . . . . . . . . . . . . . . . 4
Pressure-Time CurVes . . . . . . . . . . . . . . . . . . . . . . . . . . . . . . . . . 5Applications . . . . . . . . . . . . . . . . . . . . . . . . . . . . . . . . . . . . . . . . . . . . . . . 6Identifying.Breath.Types. . . . . . . . . . . . . . . . . . . . . . . . . . . . . . . . . . . . . 6
Ventilator-Initiated Mandatory Breaths . . . . . . . . . . . . . . . . . . .7Patient-Initiated Mandatory Breaths . . . . . . . . . . . . . . . . . . . . . .7Spontaneous Breaths . . . . . . . . . . . . . . . . . . . . . . . . . . . . . . . . . . .8Pressure Support Ventilation . . . . . . . . . . . . . . . . . . . . . . . . . . . .8Pressure Control Ventilation . . . . . . . . . . . . . . . . . . . . . . . . . . . . .8Pressure Control With Active Exhalation Valve . . . . . . . . . . . . .9Bi-Level Ventilation . . . . . . . . . . . . . . . . . . . . . . . . . . . . . . . . . . . .9Airway Pressure Release Ventilation (APRV) . . . . . . . . . . . . . .10
Assessing.Plateau.Pressure. . . . . . . . . . . . . . . . . . . . . . . . . . . . . . . . . .10Assessing.the.Work.to.Trigger.a.Breath. . . . . . . . . . . . . . . . . . . . . . .11Evaluating.Respiratory.Events. . . . . . . . . . . . . . . . . . . . . . . . . . . . . . .11Adjusting.Peak.Flow.Rate. . . . . . . . . . . . . . . . . . . . . . . . . . . . . . . . . . .12Measuring.Static.Mechanics. . . . . . . . . . . . . . . . . . . . . . . . . . . . . . . . .12Assessing.Rise.Time.. . . . . . . . . . . . . . . . . . . . . . . . . . . . . . . . . . . . . . .13Setting.Rise.Time. . . . . . . . . . . . . . . . . . . . . . . . . . . . . . . . . . . . . . . . . .14Assessing.Auto-PEEP.Maneuver. . . . . . . . . . . . . . . . . . . . . . . . . . . . .14
FloW-Time CurVes . . . . . . . . . . . . . . . . . . . . . . . . . . . . . . . . . . . 15Applications . . . . . . . . . . . . . . . . . . . . . . . . . . . . . . . . . . . . . . . . . . . . . .16Verifying.Flow.Waveform.Shapes. . . . . . . . . . . . . . . . . . . . . . . . . . . .16Detecting.the.Type.of.Breathing. . . . . . . . . . . . . . . . . . . . . . . . . . . . .17
Mandatory Breaths . . . . . . . . . . . . . . . . . . . . . . . . . . . . . . . . . . .17Spontaneous Breaths . . . . . . . . . . . . . . . . . . . . . . . . . . . . . . . . . .17
Determining.the.Presence.of.Auto-PEEP . . . . . . . . . . . . . . . . . . . . .18Missed.Inspiratory.Efforts.Due.to.Auto-PEEP. . . . . . . . . . . . . . . . .18Evaluating.Bronchodilator.Response . . . . . . . . . . . . . . . . . . . . . . . . .19Evaluating.Inspiratory.Time.Setting.in.Pressure.Control. . . . . . . .20Evaluating.Leak.Rates.With.Flow.Triggering . . . . . . . . . . . . . . . . . .20Assessing.Air.Leaks.and.Adjusting.Expiratory.Sensitivity.in.
Pressure.Support. . . . . . . . . . . . . . . . . . . . . . . . . . . . . . . . . . . . . . .21Bi-Level.Ventilation. . . . . . . . . . . . . . . . . . . . . . . . . . . . . . . . . . . . . . . .22APRV.in.Bi-Level.Mode. . . . . . . . . . . . . . . . . . . . . . . . . . . . . . . . . . . .22Volume-Time.Curves . . . . . . . . . . . . . . . . . . . . . . . . . . . . . . . . . . . . . .23Applications . . . . . . . . . . . . . . . . . . . . . . . . . . . . . . . . . . . . . . . . . . . . . .23Detecting.Air.Trapping.or.Leaks. . . . . . . . . . . . . . . . . . . . . . . . . . . . .24Bi-Level.Ventilation. . . . . . . . . . . . . . . . . . . . . . . . . . . . . . . . . . . . . . . .24APRV.in.Bi-Level.Mode. . . . . . . . . . . . . . . . . . . . . . . . . . . . . . . . . . . .25
Combined CurVes . . . . . . . . . . . . . . . . . . . . . . . . . . . . . . . . . . . . 25Pressure.and.Volume-Time.Curves . . . . . . . . . . . . . . . . . . . . . . . . . . . . .26Assist Control . . . . . . . . . . . . . . . . . . . . . . . . . . . . . . . . . . . . . . . . . . . . . . .26
SIMV . . . . . . . . . . . . . . . . . . . . . . . . . . . . . . . . . . . . . . . . . . . . . . .26SPONT (CPAP) . . . . . . . . . . . . . . . . . . . . . . . . . . . . . . . . . . . . . .27

Pressure Support . . . . . . . . . . . . . . . . . . . . . . . . . . . . . . . . . . . . . .28Pressure Control . . . . . . . . . . . . . . . . . . . . . . . . . . . . . . . . . . . . . .28Bi-Level Ventilation . . . . . . . . . . . . . . . . . . . . . . . . . . . . . . . . . . .29APRV . . . . . . . . . . . . . . . . . . . . . . . . . . . . . . . . . . . . . . . . . . . . . . .30
Volume.and.Flow-Time.Curves. . . . . . . . . . . . . . . . . . . . . . . . . . . . . .30Assist Control . . . . . . . . . . . . . . . . . . . . . . . . . . . . . . . . . . . . . . . .30SIMV . . . . . . . . . . . . . . . . . . . . . . . . . . . . . . . . . . . . . . . . . . . . . . .31SPONT . . . . . . . . . . . . . . . . . . . . . . . . . . . . . . . . . . . . . . . . . . . . . .32Pressure Support Ventilation . . . . . . . . . . . . . . . . . . . . . . . . . . .32Pressure Control Ventilation . . . . . . . . . . . . . . . . . . . . . . . . . . . .33Bi-Level . . . . . . . . . . . . . . . . . . . . . . . . . . . . . . . . . . . . . . . . . . . . .34APRV . . . . . . . . . . . . . . . . . . . . . . . . . . . . . . . . . . . . . . . . . . . . . . .34
Pressure.and.Flow-Time.Curves. . . . . . . . . . . . . . . . . . . . . . . . . . . . .35Assist Control . . . . . . . . . . . . . . . . . . . . . . . . . . . . . . . . . . . . . . . . . . . .35
SIMV . . . . . . . . . . . . . . . . . . . . . . . . . . . . . . . . . . . . . . . . . . . . . . .36SPONT . . . . . . . . . . . . . . . . . . . . . . . . . . . . . . . . . . . . . . . . . . . . . .36Pressure Support Ventilation . . . . . . . . . . . . . . . . . . . . . . . . . . .37Pressure Control Ventilation . . . . . . . . . . . . . . . . . . . . . . . . . . . .38Bi-Level . . . . . . . . . . . . . . . . . . . . . . . . . . . . . . . . . . . . . . . . . . . . .39APRV . . . . . . . . . . . . . . . . . . . . . . . . . . . . . . . . . . . . . . . . . . . . . . .39
Pressure-Volume looP . . . . . . . . . . . . . . . . . . . . . . . . . . . . . . . 40Introduction. . . . . . . . . . . . . . . . . . . . . . . . . . . . . . . . . . . . . . . . . . . . . .40Inspiratory.Area. . . . . . . . . . . . . . . . . . . . . . . . . . . . . . . . . . . . . . . . . . .40Breath.Types. . . . . . . . . . . . . . . . . . . . . . . . . . . . . . . . . . . . . . . . . . . . . .41
Mandatory Breaths . . . . . . . . . . . . . . . . . . . . . . . . . . . . . . . . . . .41Spontaneous Breaths . . . . . . . . . . . . . . . . . . . . . . . . . . . . . . . . . .42Assisted Breaths . . . . . . . . . . . . . . . . . . . . . . . . . . . . . . . . . . . . . .42Bi-Level Ventilation Without Spontaneous Breathing . . . . . . .43Bi-Level/APRV Ventilation With Spontaneous Breathing . . . .43
Applications . . . . . . . . . . . . . . . . . . . . . . . . . . . . . . . . . . . . . . . . . . . . . .44Assessing the Work to Trigger a Breath . . . . . . . . . . . . . . . . . . .45Assessing Compliance . . . . . . . . . . . . . . . . . . . . . . . . . . . . . . . . . .46Assessing Decreased Compliance . . . . . . . . . . . . . . . . . . . . . . . .46Assessing Resistance . . . . . . . . . . . . . . . . . . . . . . . . . . . . . . . . . . .47Detecting Lung Overdistention . . . . . . . . . . . . . . . . . . . . . . . . . .47Determining the Effects of Flow Pattern on the P-V Loop . . . .48Adjusting Inspiratory Flow . . . . . . . . . . . . . . . . . . . . . . . . . . . . .48Detecting Air Leaks or Air Trapping . . . . . . . . . . . . . . . . . . . . .49
FloW-Volume looP . . . . . . . . . . . . . . . . . . . . . . . . . . . . . . . . . . . 50Application. . . . . . . . . . . . . . . . . . . . . . . . . . . . . . . . . . . . . . . . . . . . . . .50
Evaluating the Effect of Bronchodilators . . . . . . . . . . . . . . . . . .50

4
introductionThis.pocket.guide.will.help.you.identify.different.ventila-tory.waveform.patterns.and.show.you.how.to.use.them.when.making.ventilator.adjustments ..Graphically.displayed.waveforms.can.help.you.better.understand.the.patient-.ventilator.relationship.and.the.patient’s.response.to.the.many.types.of.ventilatory.support .
Waveforms.are.graphical.representations.of.data.collected.by.the.ventilator.either.integrated.with.changes.in.time.(as.in.Pressure-Time,.Flow-Time.or.Volume-Time.curves).or.with.one.another.(as.in.Pressure-Volume.or.Flow-Volume.loops) .
Waveforms.offer.the.user.a.“window”.into.what.is.hap-pening.to.the.patient.in.real.time.in.the.form.of.pictures ..The.digital.values.generated.and.displayed.by.the.ventilator.generally.lag.by.at.least.one.breath.and.in.some.cases.four.to.eight.breaths .
Waveforms.can.help.the.clinician.evaluate.the.effects.of.pressure,.flow.and.volume.on.the.following.four.aspects.of.ventilatory.support:
•. Oxygenation.and.ventilation•. .Lung.damage.secondary.to.mechanical.ventilation.
(barotraumas/volutrauma)•. Patient.rest.and/or.reconditioning•. Patient.comfort
Waveform.analysis.can.also.help.the.clinician.detect.circuit.and.airway.leaks,.estimate.imposed.ventilatory.work,.and.aid.in.assessing.the.efficacy.of.bronchodilator.therapy .
In.this.workbook,.all.waveforms.depicted.are.color-coded.to.represent.the.different.types.of.breaths.or.breath.phases.represented.by.the.waveforms.displayed ..
– GREEN.represents.a.mandatory.inspiration .
–. RED.represents.a.spontaneous.inspiration .
–. YELLOW.represents.exhalation .
5
Pressure-Time CurVes
6S5 4321
P CIRC
CM H2O50
40
30
20
10
0
-10
Mean Airway Pressure (PMEAN)
PPEAK
Baseline
CBA
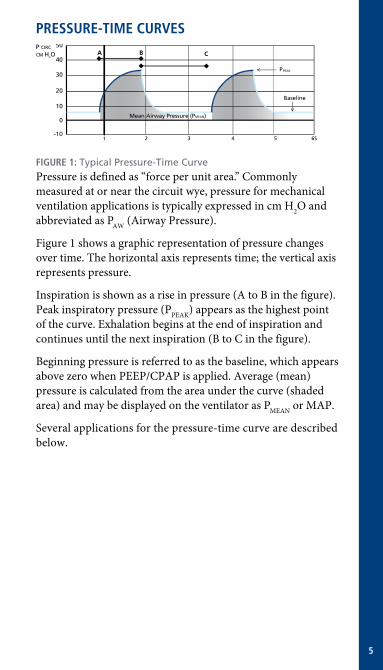
FiGure 1: Typical Pressure-Time Curve Pressure.is.defined.as.“force.per.unit.area .”.Commonly.measured.at.or.near.the.circuit.wye,.pressure.for.mechanical.ventilation.applications.is.typically.expressed.in.cm.H2O.and.abbreviated.as.PAW.(Airway.Pressure) .
Figure.1.shows.a.graphic.representation.of.pressure.changes.over.time ..The.horizontal.axis.represents.time;.the.vertical.axis.represents.pressure .
Inspiration.is.shown.as.a.rise.in.pressure.(A.to.B.in.the.figure) ..Peak.inspiratory.pressure.(PPEAK).appears.as.the.highest.point.of.the.curve ..Exhalation.begins.at.the.end.of.inspiration.and.continues.until.the.next.inspiration.(B.to.C.in.the.figure) .
Beginning.pressure.is.referred.to.as.the.baseline,.which.appears.above.zero.when.PEEP/CPAP.is.applied ..Average.(mean).pressure.is.calculated.from.the.area.under.the.curve.(shaded.area).and.may.be.displayed.on.the.ventilator.as.PMEAN.or.MAP .
Several.applications.for.the.pressure-time.curve.are.described.below .
6
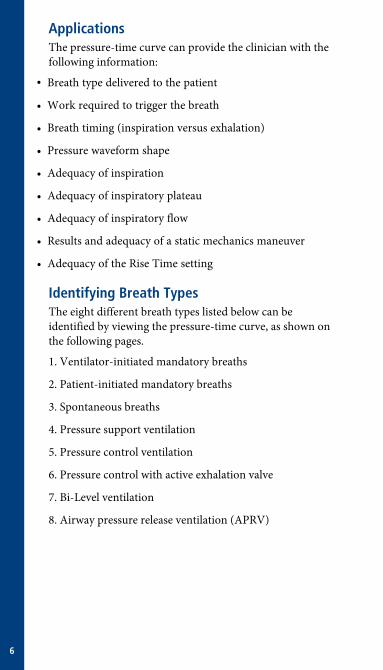
ApplicationsThe.pressure-time.curve.can.provide.the.clinician.with.the.following.information:
•. Breath.type.delivered.to.the.patient
•. Work.required.to.trigger.the.breath
•. Breath.timing.(inspiration.versus.exhalation)
•. Pressure.waveform.shape
•. Adequacy.of.inspiration
•. Adequacy.of.inspiratory.plateau
•. Adequacy.of.inspiratory.flow
•. .Results.and.adequacy.of.a.static.mechanics.maneuver
•. Adequacy.of.the.Rise.Time.setting
identifying breath TypesThe.eight.different.breath.types.listed.below.can.be.identified.by.viewing.the.pressure-time.curve,.as.shown.on.the.following.pages .
1 ..Ventilator-initiated.mandatory.breaths
2 ..Patient-initiated.mandatory.breaths
3 ..Spontaneous.breaths
4 ..Pressure.support.ventilation
5 ..Pressure.control.ventilation
6 ..Pressure.control.with.active.exhalation.valve
7 ..Bi-Level.ventilation
8 ..Airway.pressure.release.ventilation.(APRV)
7
Ventilator-initiated mandatory breaths
6S54321
P CIRCcm H2O
50
40
30
20
10
0
-10
A
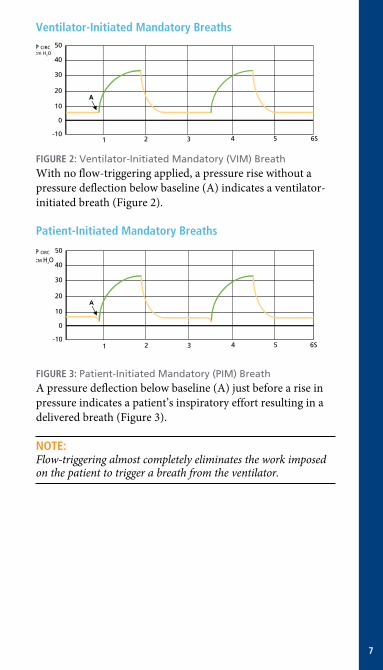
FiGure 2: Ventilator-Initiated Mandatory (VIM) BreathWith.no.flow-triggering.applied,.a.pressure.rise.without.a.pressure.deflection.below.baseline.(A).indicates.a.ventilator-initiated.breath.(Figure.2) .
Patient-initiated mandatory breaths
6S54321
P CIRC
CM H2O50
40
30
20
10
0
-10
A
FiGure 3: Patient-Initiated Mandatory (PIM) BreathA.pressure.deflection.below.baseline.(A).just.before.a.rise.in.pressure.indicates.a.patient’s.inspiratory.effort.resulting.in.a.delivered.breath.(Figure.3) .
noTe:Flow-triggering almost completely eliminates the work imposed on the patient to trigger a breath from the ventilator .
8
spontaneous breaths
6S54321
P CIRC
CM H2O50
40
30
20
10
0
-10
AB
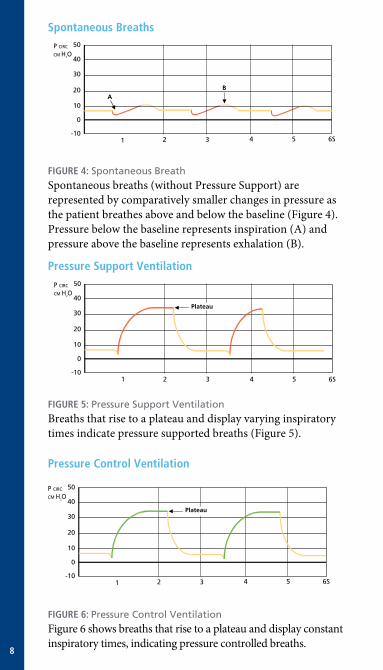
FiGure 4: Spontaneous BreathSpontaneous.breaths.(without.Pressure.Support).are.represented.by.comparatively.smaller.changes.in.pressure.as.the.patient.breathes.above.and.below.the.baseline.(Figure.4) ..Pressure.below.the.baseline.represents.inspiration.(A).and.pressure.above.the.baseline.represents.exhalation.(B) .
Pressure support Ventilation
6S54321
P CIRC
CM H2O50
40
30
20
10
0
-10
Plateau
FiGure 5: Pressure Support VentilationBreaths.that.rise.to.a.plateau.and.display.varying.inspiratory.times.indicate.pressure.supported.breaths.(Figure.5) .
Pressure Control Ventilation
6S54321
P CIRC
CM H2O50
40
30
20
10
0
-10
Plateau
FiGure 6: Pressure Control VentilationFigure.6.shows.breaths.that.rise.to.a.plateau.and.display.constant.inspiratory.times,.indicating.pressure.controlled.breaths .
9
Pressure Control With Active exhalation Valve
6S54321
P CIRC
CM H2O50
40
30
20
10
0
-10
A A
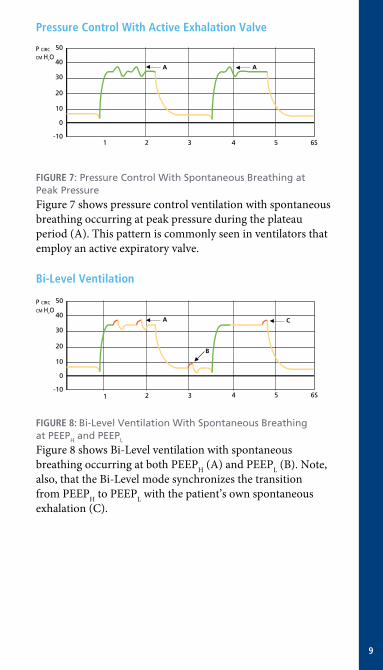
FiGure 7: Pressure Control With Spontaneous Breathing at Peak PressureFigure.7.shows.pressure.control.ventilation.with.spontaneous.breathing.occurring.at.peak.pressure.during.the.plateau.period.(A) ..This.pattern.is.commonly.seen.in.ventilators.that.employ.an.active.expiratory.valve .
bi-level Ventilation
6S54321
P CIRC
CM H2O50
40
30
20
10
0
-10
A C
B
FiGure 8: Bi-Level Ventilation With Spontaneous Breathing at PEEPH and PEEPL
Figure.8.shows.Bi-Level.ventilation.with.spontaneous.breathing.occurring.at.both.PEEPH.(A).and.PEEPL.(B) ..Note,.also,.that.the.Bi-Level.mode.synchronizes.the.transition.from.PEEPH.to.PEEPL.with.the.patient’s.own.spontaneous.exhalation.(C) .
10
Airway Pressure release Ventilation (APrV)
6S54321
P CIRC
CM H2O50
40
30
20
10
0
-10
A
B
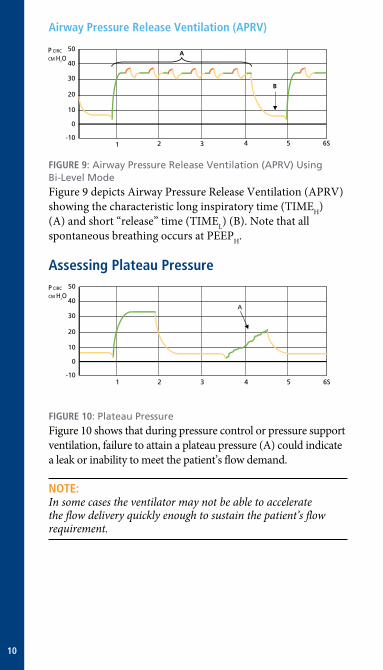
FiGure 9: Airway Pressure Release Ventilation (APRV) Using Bi-Level Mode Figure.9.depicts.Airway.Pressure.Release.Ventilation.(APRV).showing.the.characteristic.long.inspiratory.time.(TIMEH).(A).and.short.“release”.time.(TIMEL).(B) ..Note.that.all.spontaneous.breathing.occurs.at.PEEPH .
Assessing Plateau Pressure
6S54321
P CIRC
CM H2O50
40
30
20
10
0
-10
A
FiGure 10: Plateau PressureFigure.10.shows.that.during.pressure.control.or.pressure.support.ventilation,.failure.to.attain.a.plateau.pressure.(A).could.indicate.a.leak.or.inability.to.meet.the.patient’s.flow.demand .
noTe:In some cases the ventilator may not be able to accelerate the flow delivery quickly enough to sustain the patient’s flow requirement .

11
Assessing the Work to Trigger a breath
21
50
40
30
20
10
0
-10
Pressure�PT
DTOT
Time
P CIRC
CM H2O
FiGure 11: Work to TriggerIn.Figure.11,.the.depth.of.the.pressure.deflection.below.the.baseline.(PT).and.the.time.the.pressure.remains.below.the.baseline.(DTOT).indicates.the.patient’s.effort.to.trigger.a.breath ..Larger.trigger.pressures.(PT).and/or.longer.trigger.delay.times.(DT).may.also.indicate.an.inadequate.trigger.sensitivity.setting.on.the.ventilator.or.a.slow.response.time.by.the.ventilator.itself .
evaluating respiratory events
6S54321
P CIRC
CM H2O50
40
30
20
10
0
-10
CBA
FiGure 12: Respiratory Time CalculationsFigure.12.shows.several.respiratory.events ..A.to.B.indicates..the.inspiratory.time;.B.to.C.indicates.the.expiratory.time .
If.the.pressure.during.exhalation.does.not.return.to.baseline.before.the.next.inspiration.is.delivered,.the.expiratory.time..may.not.be.adequate ..
12
Adjusting Peak Flow rate
6S54321
P CIRC
CM H2O50
40
30
20
10
0
-10
B
A
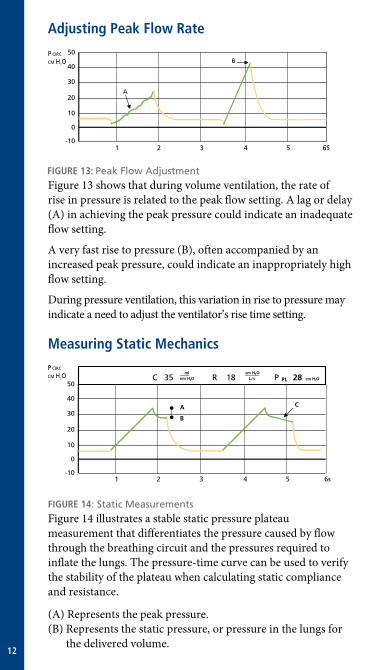
FiGure 13: Peak Flow AdjustmentFigure.13.shows.that.during.volume.ventilation,.the.rate.of..rise.in.pressure.is.related.to.the.peak.flow.setting ..A.lag.or.delay.(A).in.achieving.the.peak.pressure.could.indicate.an.inadequate.flow.setting ..
A.very.fast.rise.to.pressure.(B),.often.accompanied.by.an.increased.peak.pressure,.could.indicate.an.inappropriately.high.flow.setting .
During.pressure.ventilation,.this.variation.in.rise.to.pressure.may.indicate.a.need.to.adjust.the.ventilator’s.rise.time.setting .
measuring static mechanics
6s 54321
50
40
30
20
10
0
-10
P CIRC
CM H2O
A
B
C
C 35 R 18 P PL 28 cm H2O mlcm H2O
cm H2O L/s
FiGure 14: Static MeasurementsFigure.14.illustrates.a.stable.static.pressure.plateau.measurement.that.differentiates.the.pressure.caused.by.flow.through.the.breathing.circuit.and.the.pressures.required.to.inflate.the.lungs ..The.pressure-time.curve.can.be.used.to.verify.the.stability.of.the.plateau.when.calculating.static.compliance.and.resistance ..
(A).Represents.the.peak.pressure ..(B)..Represents.the.static.pressure,.or.pressure.in.the.lungs.for.
the.delivered.volume .
13
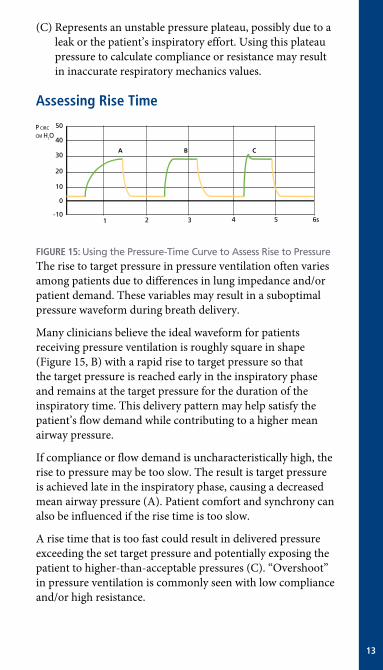
(C)..Represents.an.unstable.pressure.plateau,.possibly.due.to.a.leak.or.the.patient’s.inspiratory.effort ..Using.this.plateau.pressure.to.calculate.compliance.or.resistance.may.result.in.inaccurate.respiratory.mechanics.values .
Assessing rise Time
6s 54321
P CIRC
CM H2O50
40
30
20
10
0
-10
A B C
FiGure 15: Using the Pressure-Time Curve to Assess Rise to Pressure The.rise.to.target.pressure.in.pressure.ventilation.often.varies.among.patients.due.to.differences.in.lung.impedance.and/or.patient.demand ..These.variables.may.result.in.a.suboptimal.pressure.waveform.during.breath.delivery .
Many.clinicians.believe.the.ideal.waveform.for.patients.receiving.pressure.ventilation.is.roughly.square.in.shape.(Figure.15,.B).with.a.rapid.rise.to.target.pressure.so.that.the.target.pressure.is.reached.early.in.the.inspiratory.phase.and.remains.at.the.target.pressure.for.the.duration.of.the.inspiratory.time ..This.delivery.pattern.may.help.satisfy.the.patient’s.flow.demand.while.contributing.to.a.higher.mean.airway.pressure .
If.compliance.or.flow.demand.is.uncharacteristically.high,.the.rise.to.pressure.may.be.too.slow ..The.result.is.target.pressure.is.achieved.late.in.the.inspiratory.phase,.causing.a.decreased.mean.airway.pressure.(A) ..Patient.comfort.and.synchrony.can.also.be.influenced.if.the.rise.time.is.too.slow .
A.rise.time.that.is.too.fast.could.result.in.delivered.pressure.exceeding.the.set.target.pressure.and.potentially.exposing.the.patient.to.higher-than-acceptable.pressures.(C) ..“Overshoot”.in.pressure.ventilation.is.commonly.seen.with.low.compliance.and/or.high.resistance ..
14
setting rise Time
6s 54321
P CIRC
CM H2O50
40
30
20
10
0
-10
A B C
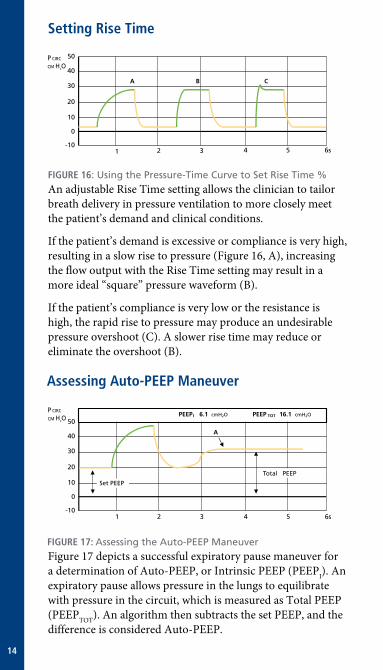
FiGure 16: Using the Pressure-Time Curve to Set Rise Time %An.adjustable.Rise.Time.setting.allows.the.clinician.to.tailor.breath.delivery.in.pressure.ventilation.to.more.closely.meet.the.patient’s.demand.and.clinical.conditions .
If.the.patient’s.demand.is.excessive.or.compliance.is.very.high,.resulting.in.a.slow.rise.to.pressure.(Figure.16,.A),.increasing.the.flow.output.with.the.Rise.Time.setting.may.result.in.a.more.ideal.“square”.pressure.waveform.(B) .
If.the.patient’s.compliance.is.very.low.or.the.resistance.is.high,.the.rapid.rise.to.pressure.may.produce.an.undesirable.pressure.overshoot.(C) ..A.slower.rise.time.may.reduce.or.eliminate.the.overshoot.(B) .
Assessing Auto-PeeP maneuver
6s 54321
P CIRC
CM H2O 50
40
30
20
10
0
-10
Total PEEP
A
PEEP I 6.1 cmH2O PEEP TOT 16.1 cmH2O
Set PEEP
FiGure 17: Assessing the Auto-PEEP ManeuverFigure.17.depicts.a.successful.expiratory.pause.maneuver.for.a.determination.of.Auto-PEEP,.or.Intrinsic.PEEP.(PEEPI) ..An.expiratory.pause.allows.pressure.in.the.lungs.to.equilibrate.with.pressure.in.the.circuit,.which.is.measured.as.Total.PEEP.(PEEPTOT) ..An.algorithm.then.subtracts.the.set.PEEP,.and.the.difference.is.considered.Auto-PEEP .
15
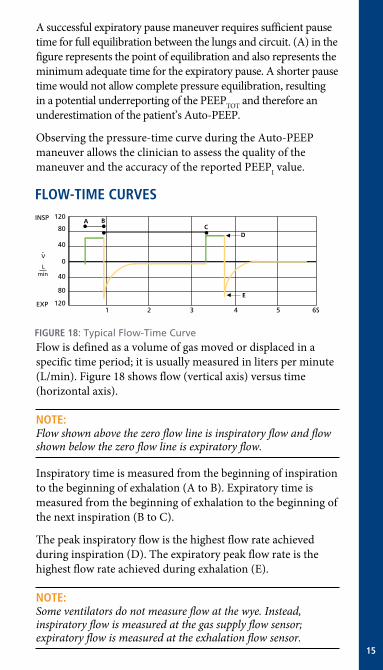
A.successful.expiratory.pause.maneuver.requires.sufficient.pause.time.for.full.equilibration.between.the.lungs.and.circuit ..(A).in.the.figure.represents.the.point.of.equilibration.and.also.represents.the.minimum.adequate.time.for.the.expiratory.pause ..A.shorter.pause.time.would.not.allow.complete.pressure.equilibration,.resulting.in.a.potential.underreporting.of.the.PEEPTOT.and.therefore.an.underestimation.of.the.patient’s.Auto-PEEP .
Observing.the.pressure-time.curve.during.the.Auto-PEEP.maneuver.allows.the.clinician.to.assess.the.quality.of.the.maneuver.and.the.accuracy.of.the.reported.PEEPI.value .
FloW-Time CurVes
EXP
.
80
40
0
40
80
120
1206S54321
V
Lmin
INSP
DC
BA
E
FiGure 18: Typical Flow-Time Curve Flow.is.defined.as.a.volume.of.gas.moved.or.displaced.in.a.specific.time.period;.it.is.usually.measured.in.liters.per.minute.(L/min) ..Figure.18.shows.flow.(vertical.axis).versus.time.(horizontal.axis) ..
noTe:Flow shown above the zero flow line is inspiratory flow and flow shown below the zero flow line is expiratory flow .
Inspiratory.time.is.measured.from.the.beginning.of.inspiration.to.the.beginning.of.exhalation.(A.to.B) ..Expiratory.time.is.measured.from.the.beginning.of.exhalation.to.the.beginning.of.the.next.inspiration.(B.to.C) .
The.peak.inspiratory.flow.is.the.highest.flow.rate.achieved.during.inspiration.(D) ..The.expiratory.peak.flow.rate.is.the.highest.flow.rate.achieved.during.exhalation.(E) .
noTe:Some ventilators do not measure flow at the wye . Instead, inspiratory flow is measured at the gas supply flow sensor; expiratory flow is measured at the exhalation flow sensor .
16
ApplicationsThe.flow-time.curve.can.be.used.to.detect:
•. Waveform.shape
•. Type.of.breathing.
•. Presence.of.Auto-PEEP.(Intrinsic.PEEP)
•. Patient’s.response.to.bronchodilators.
•. .Adequacy.of.inspiratory.time.in.pressure.control.ventilation
•. Presence.and.rate.of.continuous.air.leaks
Verifying Flow Waveform shapes
EXP
.
80
40
0
40
80
120
1206S54321
V
Lmin
INSPSQUARE DESCENDING RAMP SINE DECELERATING
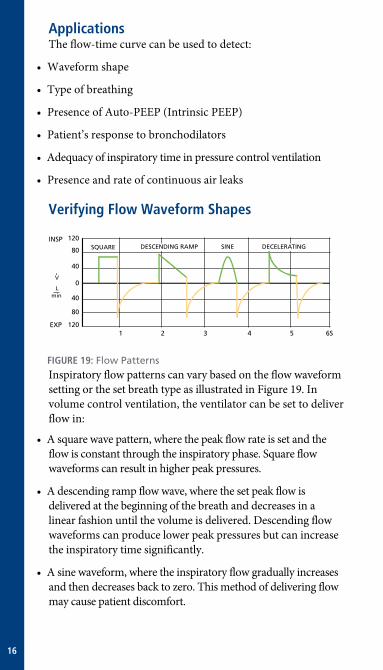
FiGure 19: Flow Patterns Inspiratory.flow.patterns.can.vary.based.on.the.flow.waveform.setting.or.the.set.breath.type.as.illustrated.in.Figure.19 ..In.volume.control.ventilation,.the.ventilator.can.be.set.to.deliver.flow.in:
•. A.square.wave.pattern,.where.the.peak.flow.rate.is.set.and.the.flow.is.constant.through.the.inspiratory.phase ..Square.flow.waveforms.can.result.in.higher.peak.pressures .
•. A.descending.ramp.flow.wave,.where.the.set.peak.flow.is.delivered.at.the.beginning.of.the.breath.and.decreases.in.a.linear.fashion.until.the.volume.is.delivered ..Descending.flow.waveforms.can.produce.lower.peak.pressures.but.can.increase.the.inspiratory.time.significantly .
•. A.sine.waveform,.where.the.inspiratory.flow.gradually.increases.and.then.decreases.back.to.zero ..This.method.of.delivering.flow.may.cause.patient.discomfort .
17
•. A.decelerating.flow.waveform,.where.the.flow.is.highest.at.the.beginning.of.inspiration.but.decelerates.exponentially.over.the.course.of.inspiration.due.to.the.effects.of.lung.impedance ..Decelerating.flow.is.generated.in.pressure.ventilation.modalities,.such.as.pressure.control.or.pressure.support .
detecting the Type of breathing
EXP
.
80
40
0
40
80
120
1206S54321
V
Lmin
INSPDESCENDING DECELERATING-DECELERATING-
SINE
Mandatory Breaths Spontaneous Breaths
RAMP PRESSURE SUPPORTPRESSURE CONTROLSQUARE
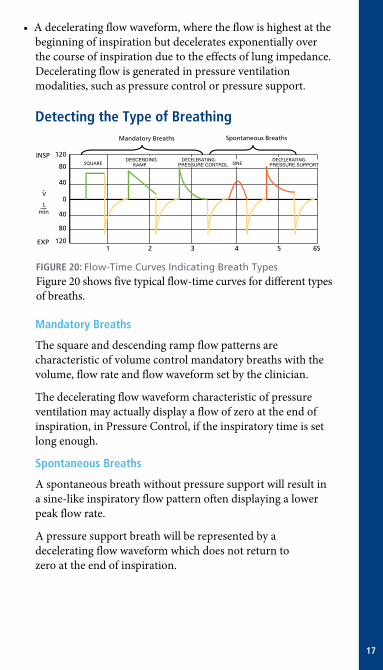
FiGure 20: Flow-Time Curves Indicating Breath Types Figure.20.shows.five.typical.flow-time.curves.for.different.types.of.breaths ..
mandatory breaths
The.square.and.descending.ramp.flow.patterns.are.characteristic.of.volume.control.mandatory.breaths.with.the.volume,.flow.rate.and.flow.waveform.set.by.the.clinician .
The.decelerating.flow.waveform.characteristic.of.pressure.ventilation.may.actually.display.a.flow.of.zero.at.the.end.of.inspiration,.in.Pressure.Control,.if.the.inspiratory.time.is.set.long.enough .
spontaneous breaths
A.spontaneous.breath.without.pressure.support.will.result.in.a.sine-like.inspiratory.flow.pattern.often.displaying.a.lower.peak.flow.rate .
A.pressure.support.breath.will.be.represented.by.a.decelerating.flow.waveform.which.does.not.return.to..zero.at.the.end.of.inspiration .
18
determining the Presence of Auto-PeeP
EXP
.
80
40
0
40
80
120
1206S54321
V
Lmin
INSP
CA B
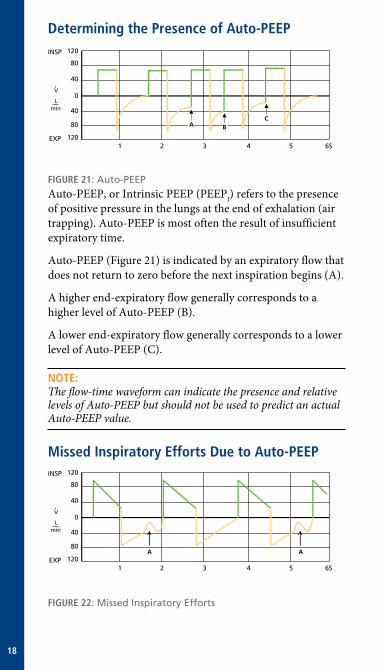
FiGure 21: Auto-PEEP Auto-PEEP,.or.Intrinsic.PEEP.(PEEPI).refers.to.the.presence.of.positive.pressure.in.the.lungs.at.the.end.of.exhalation.(air.trapping) ..Auto-PEEP.is.most.often.the.result.of.insufficient.expiratory.time .
Auto-PEEP.(Figure.21).is.indicated.by.an.expiratory.flow.that.does.not.return.to.zero.before.the.next.inspiration.begins.(A) ..
A.higher.end-expiratory.flow.generally.corresponds.to.a.higher.level.of.Auto-PEEP.(B) .
A.lower.end-expiratory.flow.generally.corresponds.to.a.lower.level.of.Auto-PEEP.(C) .
noTe:The flow-time waveform can indicate the presence and relative levels of Auto-PEEP but should not be used to predict an actual Auto-PEEP value .
missed inspiratory efforts due to Auto-PeeP
EXP
.
80
40
0
40
80
120
1206S54321
V
Lmin
INSP
A A
FiGure 22: Missed Inspiratory Efforts
19
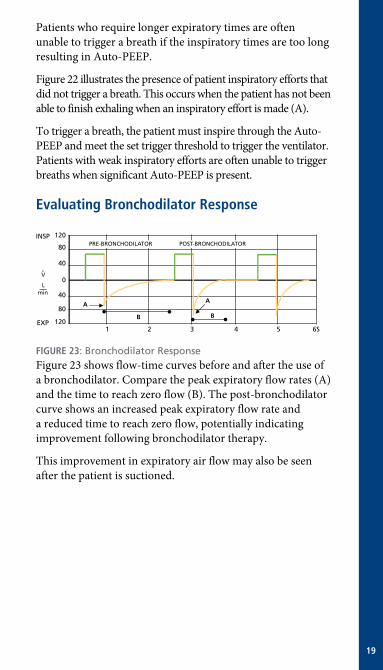
Patients.who.require.longer.expiratory.times.are.often.unable.to.trigger.a.breath.if.the.inspiratory.times.are.too.long.resulting.in.Auto-PEEP ..
Figure.22.illustrates.the.presence.of.patient.inspiratory.efforts.that.did.not.trigger.a.breath ..This.occurs.when.the.patient.has.not.been.able.to.finish.exhaling.when.an.inspiratory.effort.is.made.(A) .
To.trigger.a.breath,.the.patient.must.inspire.through.the.Auto-PEEP.and.meet.the.set.trigger.threshold.to.trigger.the.ventilator ..Patients.with.weak.inspiratory.efforts.are.often.unable.to.trigger.breaths.when.significant.Auto-PEEP.is.present .
evaluating bronchodilator response
EXP
.
80
40
0
40
80
120
1206S54321
V
Lmin
INSP
A
BB
A
PRE-BRONCHODILATOR POST-BRONCHODILATOR
FiGure 23: Bronchodilator Response Figure.23.shows.flow-time.curves.before.and.after.the.use.of.a.bronchodilator ..Compare.the.peak.expiratory.flow.rates.(A).and.the.time.to.reach.zero.flow.(B) ..The.post-bronchodilator.curve.shows.an.increased.peak.expiratory.flow.rate.and.a.reduced.time.to.reach.zero.flow,.potentially.indicating.improvement.following.bronchodilator.therapy ..
This.improvement.in.expiratory.air.flow.may.also.be.seen.after.the.patient.is.suctioned .
20
evaluating inspiratory Time setting in Pressure Control
EXP
.
80
40
0
40
80
120
1206S54321
V
Lmin
INSP
A B C
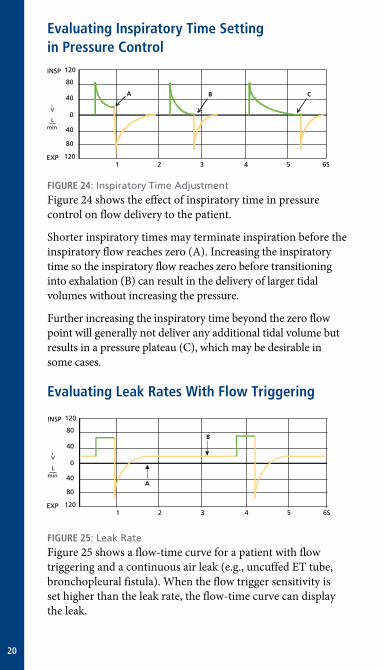
FiGure 24: Inspiratory Time Adjustment Figure.24.shows.the.effect.of.inspiratory.time.in.pressure.control.on.flow.delivery.to.the.patient ..
Shorter.inspiratory.times.may.terminate.inspiration.before.the.inspiratory.flow.reaches.zero.(A) ..Increasing.the.inspiratory.time.so.the.inspiratory.flow.reaches.zero.before.transitioning.into.exhalation.(B).can.result.in.the.delivery.of.larger.tidal.volumes.without.increasing.the.pressure .
Further.increasing.the.inspiratory.time.beyond.the.zero.flow.point.will.generally.not.deliver.any.additional.tidal.volume.but.results.in.a.pressure.plateau.(C),.which.may.be.desirable.in.some.cases .
evaluating leak rates With Flow Triggering
EXP
.
80
40
0
40
80
120
1206S54321
V
Lmin
INSP
A
B
FiGure 25: Leak Rate Figure.25.shows.a.flow-time.curve.for.a.patient.with.flow.triggering.and.a.continuous.air.leak.(e .g .,.uncuffed.ET.tube,.bronchopleural.fistula) ..When.the.flow.trigger.sensitivity.is..set.higher.than.the.leak.rate,.the.flow-time.curve.can.display.the.leak .

21
The.leak.allows.some.of.the.ventilator’s.base.flow.to.escape.the.circuit.during.the.expiratory.phase,.as.shown.on.the.flow-time.curve.(B) .
The.distance.between.the.zero.flow.baseline.(A).and.the.flow.curve.(B).represents.the.actual.leak.rate.in.L/min .
Assessing Air leaks and Adjusting expiratory sensitivity in Pressure support
EXP
.
80
40
0
40
80
120
1206S54321
V
Lmin
INSP
AC
B
FiGure 26: Setting Expiratory Sensitivity (ESENS) Figure.26.displays.how.leaks.can.affect.the.inspiratory.time.of.pressure.support.breaths ..Typically,.pressure.support.breaths.cycle.into.exhalation.when.the.inspiratory.flow.decelerates.to.a.termination.threshold ..With.some.ventilators.this.breath.termination.criteria.(or.expiratory.sensitivity).is.fixed.at.a.value.typically.expressed.as.a.percent.of.the.peak.flow.delivered.for.that.breath.(10%,.25%) ..Other.ventilators.allow.the.clinician.to.vary.the.breath.termination.criteria.to.compensate.for.the.effects.of.leaks.or.variations.in.lung.impedance.on.inspiratory.time ..
Air.leaks.can.often.prevent.the.flow.rate.from.decelerating.to.the.set.termination.threshold.(A),.resulting.in.a.long.inspiratory.time.(B) ..Adjusting.the.expiratory.sensitivity.level.to.a.higher.percentage.of.peak.flow.(C).permits.the.breath.to.terminate.earlier,.decreasing.the.patient’s.inspiratory.time.and.helping.to.restore.patient-ventilator.synchrony .
22
bi-level Ventilation
EXP
.
80
40
0
40
80
120
1206S54321
V
Lmin
INSPA
D
CB
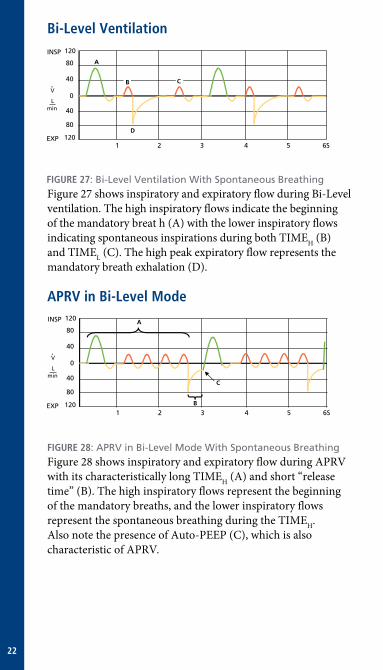
FiGure 27: Bi-Level Ventilation With Spontaneous BreathingFigure.27.shows.inspiratory.and.expiratory.flow.during.Bi-Level.ventilation ..The.high.inspiratory.flows.indicate.the.beginning.of.the.mandatory.breat.h.(A).with.the.lower.inspiratory.flows.indicating.spontaneous.inspirations.during.both.TIMEH.(B).and.TIMEL.(C) ..The.high.peak.expiratory.flow.represents.the.mandatory.breath.exhalation.(D) .
APrV in bi-level mode
EXP
.
80
40
0
40
80
120
1206S54321
V
Lmin
INSP A
C
B
FiGure 28: APRV in Bi-Level Mode With Spontaneous BreathingFigure.28.shows.inspiratory.and.expiratory.flow.during.APRV.with.its.characteristically.long.TIMEH.(A).and.short.“release.time”.(B) ..The.high.inspiratory.flows.represent.the.beginning.of.the.mandatory.breaths,.and.the.lower.inspiratory.flows.represent.the.spontaneous.breathing.during.the.TIMEH ..Also.note.the.presence.of.Auto-PEEP.(C),.which.is.also.characteristic.of.APRV ..

23
Volume-Time Curves
Volume.is.defined.as.a.quantity.of.gas.in.liters ..Figure.29.shows.a.typical.volume-time.curve ..The.upslope.(A).indicates.inspiratory.volume.while.the.downslope.(B).indicates.expiratory.volume ..Inspiratory.time.(I.Time).is.measured.from.the.beginning.of.inspiration.to.the.beginning.of.exhalation ..Expiratory.time.(E.Time).is.measured.from.the.beginning.of.exhalation.to.the.beginning.of.inspiration .
400
300
200
100
0
500
1006S54321
VT
mL
A B
I Time
E Time
C
FiGure 29: Typical Volume-Time CurveIn.Figure.29,.the.patient.has.exhaled.fully.after.1 .7.seconds.and.again.after.3 .3.seconds ..Because.of.the.significant.time.between.the.end.of.exhalation.and.the.beginning.of.the.next.inspiration,.increasing.the.respiratory.rate.in.this.example.would.probably.not.cause.air.trapping .
ApplicationsThe.volume-time.curves.may.be.used.to.detect:
•. .Air.trapping
•. Leaks.in.the.patient.circuit
24
detecting Air Trapping or leaks
400
300
200
100
0
500
1006S54321
VT
mL
A
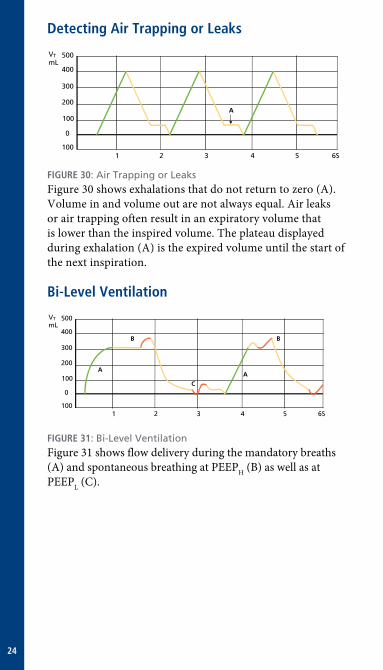
FiGure 30: Air Trapping or LeaksFigure.30.shows.exhalations.that.do.not.return.to.zero.(A) ..Volume.in.and.volume.out.are.not.always.equal ..Air.leaks.or.air.trapping.often.result.in.an.expiratory.volume.that.is.lower.than.the.inspired.volume ..The.plateau.displayed.during.exhalation.(A).is.the.expired.volume.until.the.start.of.the.next.inspiration .
bi-level Ventilation
400
300
200
100
0
500
1006S54321
VT
mL
AA
B B
C
FiGure 31: Bi-Level VentilationFigure.31.shows.flow.delivery.during.the.mandatory.breaths.(A).and.spontaneous.breathing.at.PEEPH.(B).as.well.as.at.PEEPL.(C) .

25
APrV in bi-level mode
400
300
200
100
0
500
1006S54321
VT
mL
FiGure 32: APRV Using Bi-Level VentilationFigure.32.shows.APRV.using.Bi-Level.ventilation.with.spontaneous.breathing.at.PEEPH ..
Combined CurVesMany.conditions.can.be.identified.by.viewing.two.curves.simultaneously ..The.curve.examples.that.follow.show.combined.pressure,.flow.and.volume-time.curves.in.these.five.ventilatory.modalities:
•. Assist.Control.(A/C.or.CMV)
•. Synchronized.Intermittent.Mandatory.Ventilation.(SIMV)
•. Spontaneous.(SPONT.or.CPAP)
•. Pressure.Support
•. Pressure.Control
•. Bi-Level
•. APRV

26
Pressure and Volume-Time Curves
Figures.33-39.compare.pressure.and.volume.over.time .
Assist Control
40
30
20
10
0
50
-106S54321
6S54321
400
300
200
100
0
500
100
VT
mL
P CIRC
CM H2O
A
FiGure 33: Assist Control Figure.33.shows.volume.and.pressure.during.A/C.ventilation ..Note.that.volume.and.pressure.rise.simultaneously ..A.patient-initiated.breath.is.indicated.by.a.slight.negative.deflection.in.pressure.(A) .
simV
40
30
20
10
0
50
-106S54321
6S54321
400
300
200
100
0
500
100
VT
mL
P CIRC
CM H2O
A B
FiGure 34: SIMV
27
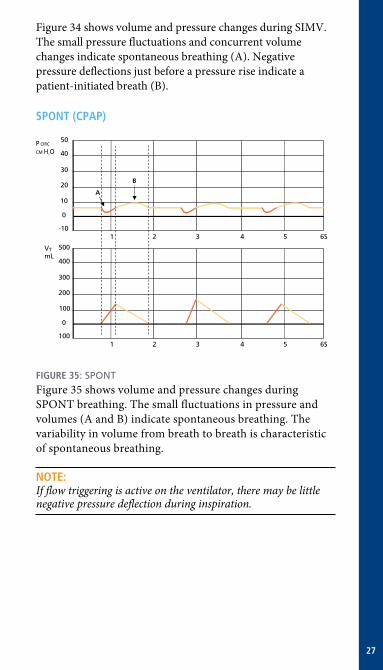
Figure.34.shows.volume.and.pressure.changes.during.SIMV ..The.small.pressure.fluctuations.and.concurrent.volume.changes.indicate.spontaneous.breathing.(A) ..Negative.pressure.deflections.just.before.a.pressure.rise.indicate.a.patient-initiated.breath.(B) .
sPonT (CPAP)
40
30
20
10
0
50
-106S54321
6S54321
400
300
200
100
0
500
100
VT
mL
P CIRC
CM H2O
A
B
FiGure 35: SPONT Figure.35.shows.volume.and.pressure.changes.during.SPONT.breathing ..The.small.fluctuations.in.pressure.and.volumes.(A.and.B).indicate.spontaneous.breathing ..The.variability.in.volume.from.breath.to.breath.is.characteristic.of.spontaneous.breathing .
noTe:If flow triggering is active on the ventilator, there may be little negative pressure deflection during inspiration .
28
Pressure support
40
30
20
10
0
50
-106S54321
6S54321
400
300
200
100
0
500
100
VT
mL
P CIRC
CM H2O
A
A
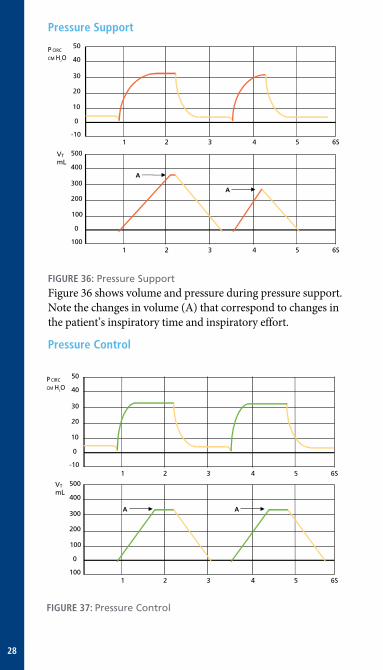
FiGure 36: Pressure Support Figure.36.shows.volume.and.pressure.during.pressure.support ..Note.the.changes.in.volume.(A).that.correspond.to.changes.in.the.patient’s.inspiratory.time.and.inspiratory.effort ..
Pressure Control
40
30
20
10
0
50
-106S54321
6S54321
400
300
200
100
0
500
100
VT
mL
P CIRC
CM H2O
A A
FiGure 37: Pressure Control
29
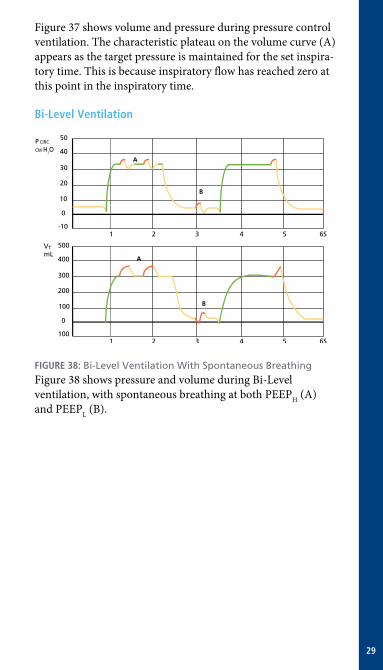
Figure.37.shows.volume.and.pressure.during.pressure.control.ventilation ..The.characteristic.plateau.on.the.volume.curve.(A).appears.as.the.target.pressure.is.maintained.for.the.set.inspira-tory.time ..This.is.because.inspiratory.flow.has.reached.zero.at.this.point.in.the.inspiratory.time .
bi-level Ventilation
40
30
20
10
0
50
-106S54321
6S54321
400
300
200
100
0
500
100
VT
mL
P CIRC
CM H2OA
B
B
A
FiGure 38: Bi-Level Ventilation With Spontaneous Breathing Figure.38.shows.pressure.and.volume.during.Bi-Level.ventilation,.with.spontaneous.breathing.at.both.PEEPH.(A).and.PEEPL.(B) .
30
APrV
40
30
20
10
0
50
-106S54321
6S54321
400
300
200
100
0
500
100
VT
mL
P CIRC
CM H2O
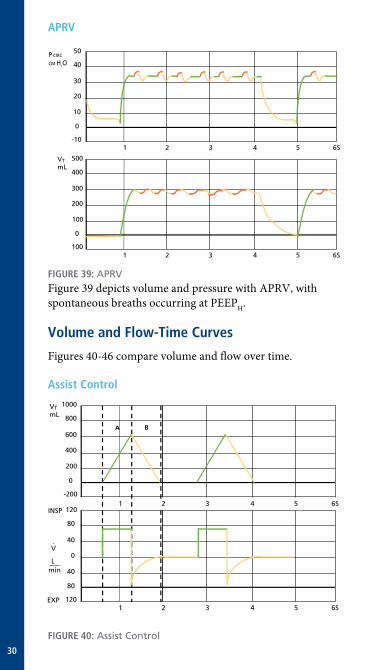
FiGure 39: APRVFigure.39.depicts.volume.and.pressure.with.APRV,.with.spontaneous.breaths.occurring.at.PEEPH .
Volume and Flow-Time Curves
Figures.40-46.compare.volume.and.flow.over.time ..
Assist Control
A B
6S54321
6S54321
800
600
400
200
0
VTmL
1000
-200
EXP
.
80
40
0
40
80
120
120
V Lmin
INSP
FiGure 40: Assist Control
31
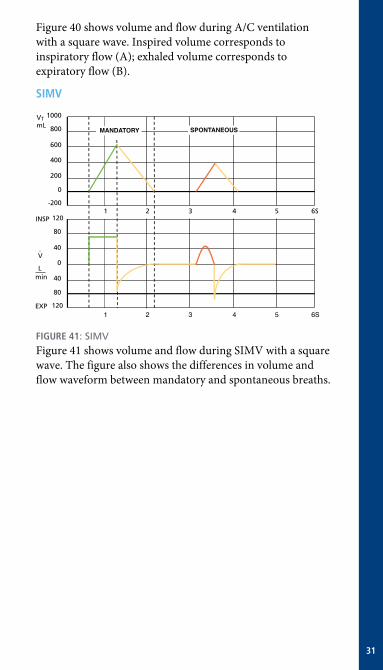
Figure.40.shows.volume.and.flow.during.A/C.ventilation.with.a.square.wave ..Inspired.volume.corresponds.to.inspiratory.flow.(A);.exhaled.volume.corresponds.to.expiratory.flow.(B) .
simV
6S54321
6S54321
800
600
400
200
0
VTmL
1000
-200
EXP
.
80
40
0
40
80
120
120
V Lmin
INSP
MANDATORY SPONTANEOUS
FiGure 41: SIMV Figure.41.shows.volume.and.flow.during.SIMV.with.a.square.wave ..The.figure.also.shows.the.differences.in.volume.and.flow.waveform.between.mandatory.and.spontaneous.breaths .

32
sPonT
6S54321
6S54321
800
600
400
200
0
VTmL
1000
-200
EXP
.
80
40
0
40
80
120
120
V Lmin
INSP
A B
1
FiGure 42: SPONTFigure.42.shows.volume.and.flow.during.SPONT ..The.sine-like.flow.waveform.and.reduced.volume.are.characteristic.of.spontaneous.breathing ..Inspiration.(A).and.exhalation.(B).are.plotted.simultaneously.for.both.volume.and.flow .
Pressure support Ventilation
6S54321
6S54321
800
600
400
200
0
VTmL
1000
-200
EXP
.
80
40
0
40
80
120
120
V Lmin
INSP
A
B
C
FiGure 43: Pressure Support Ventilation
33
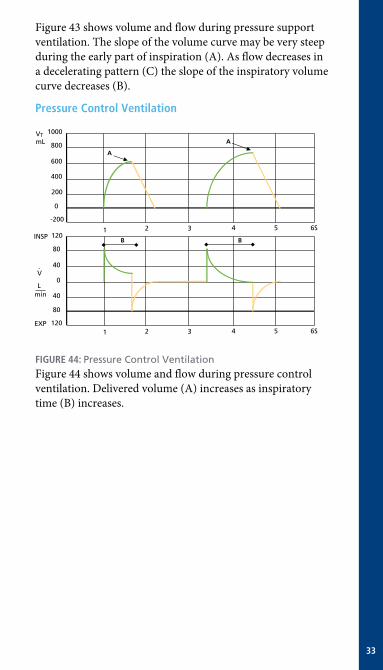
Figure.43.shows.volume.and.flow.during.pressure.support.ventilation ..The.slope.of.the.volume.curve.may.be.very.steep.during.the.early.part.of.inspiration.(A) ..As.flow.decreases.in.a.decelerating.pattern.(C).the.slope.of.the.inspiratory.volume.curve.decreases.(B) .
Pressure Control Ventilation
6S54321
6S54321
800
600
400
200
0
VTmL
1000
-200
EXP
.
80
40
0
40
80
120
120
V Lmin
INSP
A
A
B B
FiGure 44: Pressure Control VentilationFigure.44.shows.volume.and.flow.during.pressure.control.ventilation ..Delivered.volume.(A).increases.as.inspiratory.time.(B).increases .
34
bi-level
6S54321
6S54321
800
600
400
200
0
VTmL
1000
-200
EXP
.
80
40
0
40
80
120
120
V Lmin
INSP
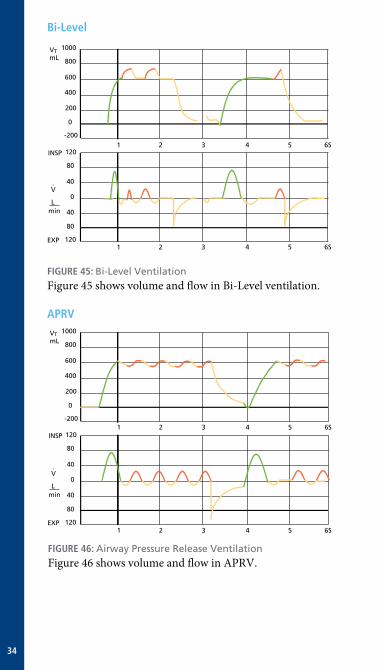
FiGure 45: Bi-Level VentilationFigure.45.shows.volume.and.flow.in.Bi-Level.ventilation .
APrV
6S54321
6S54321
800
600
400
200
0
VTmL
1000
-200
EXP
.
80
40
0
40
80
120
120
V Lmin
INSP
FiGure 46: Airway Pressure Release VentilationFigure.46.shows.volume.and.flow.in.APRV .
35
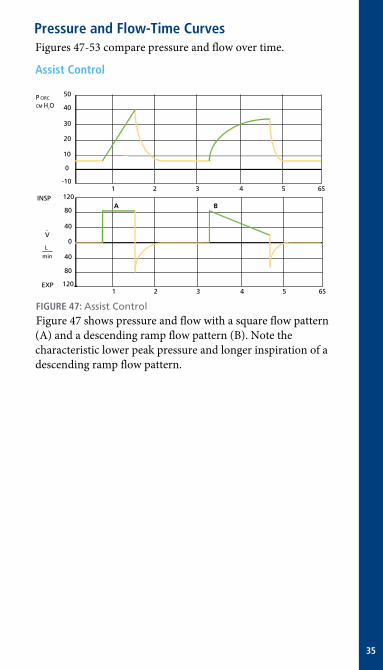
Pressure and Flow-Time CurvesFigures.47-53.compare.pressure.and.flow.over.time .
Assist Control
80
40
0
40
80
120
1206S54321
40
30
20
10
0
50
-106S54321
EXP
.V
L
min
INSPA B
P CIRC
CM H2O
FiGure 47: Assist Control Figure.47.shows.pressure.and.flow.with.a.square.flow.pattern.(A).and.a.descending.ramp.flow.pattern.(B) ..Note.the.characteristic.lower.peak.pressure.and.longer.inspiration.of.a.descending.ramp.flow.pattern .
36
simV
80
40
0
40
80
120
1206S54321
40
30
20
10
0
50
-106S54321
EXP
.V
L
min
INSPA
A
B
B
P CIRC
CM H2O
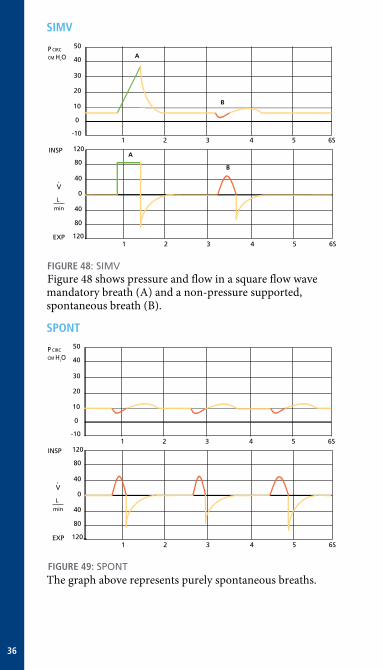
FiGure 48: SIMV Figure.48.shows.pressure.and.flow.in.a.square.flow.wave.mandatory.breath.(A).and.a.non-pressure.supported,.spontaneous.breath.(B) .
sPonT
80
40
0
40
80
120
1206S54321
40
30
20
10
0
50
-106S54321
EXP
.V
L
min
INSP
P CIRC
CM H2O
FiGure 49: SPONTThe.graph.above.represents.purely.spontaneous.breaths .
37
Pressure support Ventilation
80
40
0
40
80
120
1206S54321
40
30
20
10
0
50
-106S54321
EXP
.V
L
min
INSP
P CIRC
CM H2O
C
A
D
B
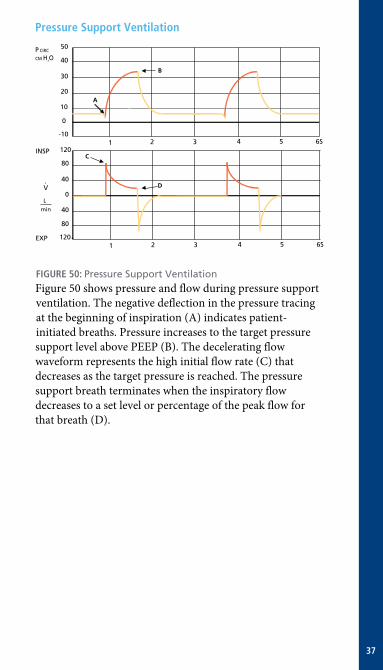
FiGure 50: Pressure Support VentilationFigure.50.shows.pressure.and.flow.during.pressure.support.ventilation ..The.negative.deflection.in.the.pressure.tracing.at.the.beginning.of.inspiration.(A).indicates.patient-initiated.breaths ..Pressure.increases.to.the.target.pressure.support.level.above.PEEP.(B) ..The.decelerating.flow.waveform.represents.the.high.initial.flow.rate.(C).that.decreases.as.the.target.pressure.is.reached ..The.pressure.support.breath.terminates.when.the.inspiratory.flow.decreases.to.a.set.level.or.percentage.of.the.peak.flow.for.that.breath.(D) .
38
Pressure Control Ventilation
80
40
0
40
80
120
1206S54321
40
30
20
10
0
50
-106S54321
EXP
.V
L
min
INSP
P CIRC
CM H2O
BC
A
D
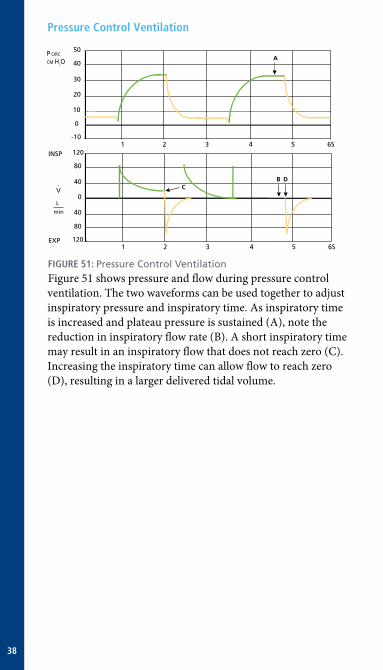
FiGure 51: Pressure Control VentilationFigure.51.shows.pressure.and.flow.during.pressure.control.ventilation ..The.two.waveforms.can.be.used.together.to.adjust.inspiratory.pressure.and.inspiratory.time ..As.inspiratory.time.is.increased.and.plateau.pressure.is.sustained.(A),.note.the.reduction.in.inspiratory.flow.rate.(B) ..A.short.inspiratory.time.may.result.in.an.inspiratory.flow.that.does.not.reach.zero.(C) ..Increasing.the.inspiratory.time.can.allow.flow.to.reach.zero.(D),.resulting.in.a.larger.delivered.tidal.volume .
39
bi-level
80
40
0
40
80
120
1206S54321
40
30
20
10
0
50
-106S54321
EXP
.V
L
min
INSP
P CIRC
CM H2O
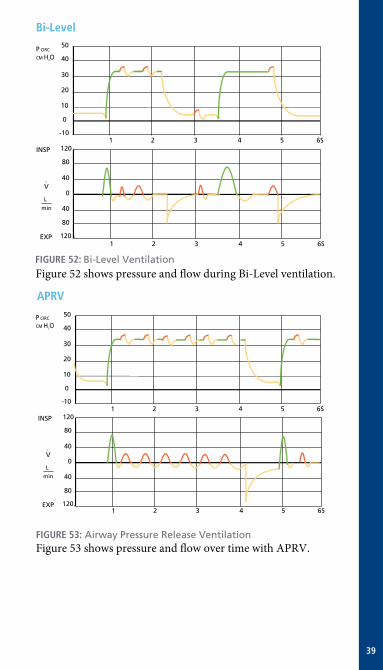
FiGure 52: Bi-Level VentilationFigure.52.shows.pressure.and.flow.during.Bi-Level.ventilation .
APrV
80
40
0
40
80
120
1206S54321
40
30
20
10
0
50
-106S54321
EXP
.V
L
min
INSP
P CIRC
CM H2O
FiGure 53: Airway Pressure Release VentilationFigure.53.shows.pressure.and.flow.over.time.with.APRV .
40
Pressure-Volume looP
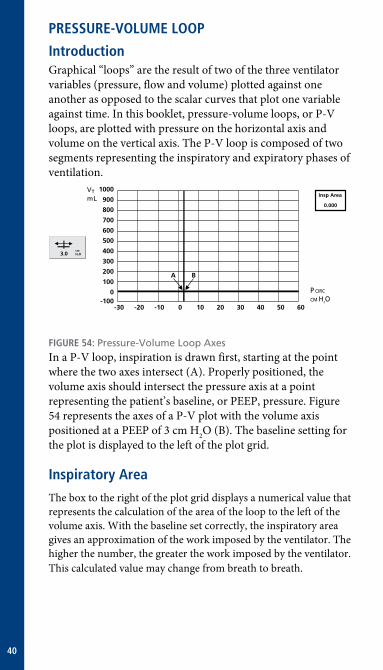
introductionGraphical.“loops”.are.the.result.of.two.of.the.three.ventilator.variables.(pressure,.flow.and.volume).plotted.against.one.another.as.opposed.to.the.scalar.curves.that.plot.one.variable.against.time ..In.this.booklet,.pressure-volume.loops,.or.P-V.loops,.are.plotted.with.pressure.on.the.horizontal.axis.and.volume.on.the.vertical.axis ..The.P-V.loop.is.composed.of.two.segments.representing.the.inspiratory.and.expiratory.phases.of.ventilation .
-30 -20 -10 0 10 20 30 40 50 60
1000
900
800
700
600
500
400
300
200
100
0 -100
Insp Area
0.000
3.0cmH2O
VT
mL
P CIRC
CM H2O
A B
FiGure 54: Pressure-Volume Loop AxesIn.a.P-V.loop,.inspiration.is.drawn.first,.starting.at.the.point.where.the.two.axes.intersect.(A) ..Properly.positioned,.the.volume.axis.should.intersect.the.pressure.axis.at.a.point.representing.the.patient’s.baseline,.or.PEEP,.pressure ..Figure.54.represents.the.axes.of.a.P-V.plot.with.the.volume.axis.positioned.at.a.PEEP.of.3.cm.H2O.(B) ..The.baseline.setting.for.the.plot.is.displayed.to.the.left.of.the.plot.grid .
inspiratory Area
The.box.to.the.right.of.the.plot.grid.displays.a.numerical.value.that.represents.the.calculation.of.the.area.of.the.loop.to.the.left.of.the.volume.axis ..With.the.baseline.set.correctly,.the.inspiratory.area.gives.an.approximation.of.the.work.imposed.by.the.ventilator ..The.higher.the.number,.the.greater.the.work.imposed.by.the.ventilator ..This.calculated.value.may.change.from.breath.to.breath .

41
breath TypesPressure-Volume.loops.are.plotted.differently.for.mandatory.and.spontaneous.breaths ..
mandatory breaths
-30 -20 -10 0 10 20 30 40 50 60
1000
900
800
700
600
500
400
300
200
100
0 -100
Insp Area
0.000
3.0cmH2O
VT
mL
P CIRC
CM H2O
A
CB
A B
..
.FiGure 55: Mandatory BreathThe.loop.in.Figure.55.represents.a.mandatory.breath ..It.is.plotted.in.a.counterclockwise.direction,.starting.at.PEEP,.with.inspiration.(A).being.drawn.first,.then.exhalation.(B) ..Since.mandatory.breaths.normally.result.in.the.delivery.of.pressures.greater.than.PEEP,.the.loop.is.drawn.to.the.right.of.the.volume.axis,.in.the.positive.pressure.area.of.the.grid ..The.end.of.inspiration.(C).reflects.both.the.peak.inspiratory.pressure.and.the.delivered.volume.for.that.breath ..After.inspiration.is.finished,.the.expiratory.portion.of.the.loop.(B).reflects.pressure.and.volume.changes.as.the.patient.exhales,.with.the.volume.returning.to.zero.and.the.pressure.returning.back.to.PEEP .
42
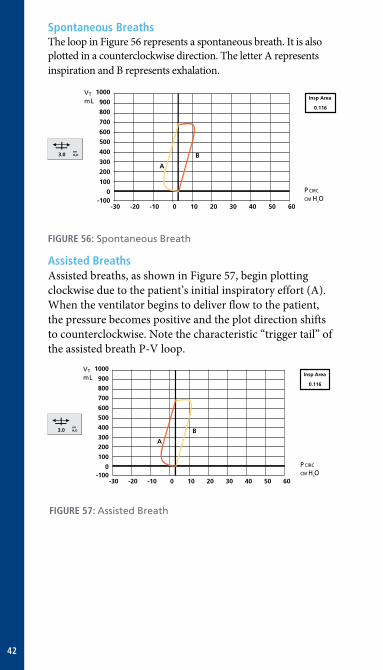
spontaneous breathsThe.loop.in.Figure.56.represents.a.spontaneous.breath ..It.is.also.plotted.in.a.counterclockwise.direction ..The.letter.A.represents.inspiration.and.B.represents.exhalation .
-30 -20 -10 0 10 20 30 40 50 60
1000
900
800
700
600
500
400
300
200
100
0 -100
Insp Area
0.116
3.0cmH2O
VT
mL
P CIRC
CM H2O
A
B
FiGure 56: Spontaneous Breath
Assisted breathsAssisted.breaths,.as.shown.in.Figure.57,.begin.plotting.clockwise.due.to.the.patient’s.initial.inspiratory.effort.(A) ..When.the.ventilator.begins.to.deliver.flow.to.the.patient,.the.pressure.becomes.positive.and.the.plot.direction.shifts.to.counterclockwise ..Note.the.characteristic.“trigger.tail”.of.the.assisted.breath.P-V.loop .
-30 -20 -10 0 10 20 30 40 50 60
1000
900
800
700
600
500
400
300
200
100
0 -100
Insp Area
0.116
3.0cmH2O
VT
mL
P CIRC
CM H2O
A
B
FiGure 57: Assisted Breath
43
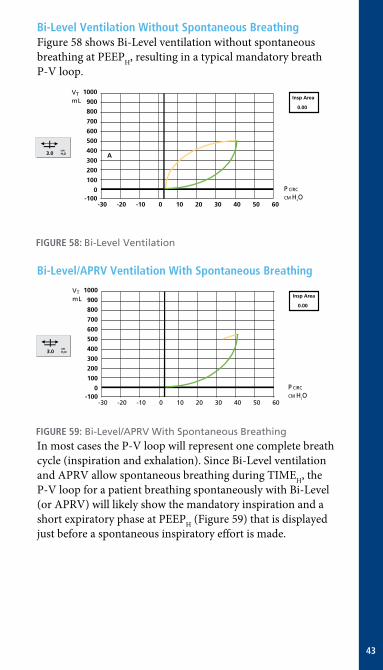
bi-level Ventilation Without spontaneous breathingFigure.58.shows.Bi-Level.ventilation.without.spontaneous.breathing.at.PEEPH,.resulting.in.a.typical.mandatory.breath.P-V.loop ..
-30 -20 -10 0 10 20 30 40 50 60
1000
900
800
700
600
500
400
300
200
100
0 -100
Insp Area
0.00
3.0cmH2O
VT
mL
P CIRC
CM H2O
A
.
FiGure 58: Bi-Level Ventilation
bi-level/APrV Ventilation With spontaneous breathing
-30 -20 -10 0 10 20 30 40 50 60
1000
900
800
700
600
500
400
300
200
100
0 -100
Insp Area
0.00
3.0cmH2O
VT
mL
P CIRC
CM H2O
FiGure 59: Bi-Level/APRV With Spontaneous BreathingIn.most.cases.the.P-V.loop.will.represent.one.complete.breath.cycle.(inspiration.and.exhalation) ..Since.Bi-Level.ventilation.and.APRV.allow.spontaneous.breathing.during.TIMEH,.the.P-V.loop.for.a.patient.breathing.spontaneously.with.Bi-Level.(or.APRV).will.likely.show.the.mandatory.inspiration.and.a.short.expiratory.phase.at.PEEPH.(Figure.59).that.is.displayed.just.before.a.spontaneous.inspiratory.effort.is.made .
44
-30 -20 -10 0 10 20 30 40 50 60
1000
900
800
700
600
500
400
300
200
100
0 -100
Insp Area
0.00
3.0cmH2O
VT
mL
P CIRC
CM H2O
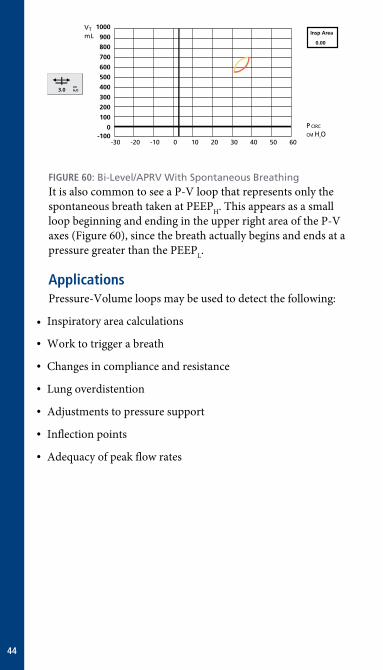
FiGure 60: Bi-Level/APRV With Spontaneous Breathing
It.is.also.common.to.see.a.P-V.loop.that.represents.only.the.spontaneous.breath.taken.at.PEEPH ..This.appears.as.a.small.loop.beginning.and.ending.in.the.upper.right.area.of.the.P-V.axes.(Figure.60),.since.the.breath.actually.begins.and.ends.at.a.pressure.greater.than.the.PEEPL .
ApplicationsPressure-Volume.loops.may.be.used.to.detect.the.following:
•. .Inspiratory.area.calculations
•. Work.to.trigger.a.breath
•. Changes.in.compliance.and.resistance
•. Lung.overdistention
•. Adjustments.to.pressure.support
•. Inflection.points
•. Adequacy.of.peak.flow.rates
45
Assessing the Work to Trigger a breath
-30 -20 -10 0 10 20 30 40 50 60
1000
900
800
700
600
500
400
300
200
100
0 -100
Insp Area
0.017
3.0cmH2O
VT
mL
P CIRC
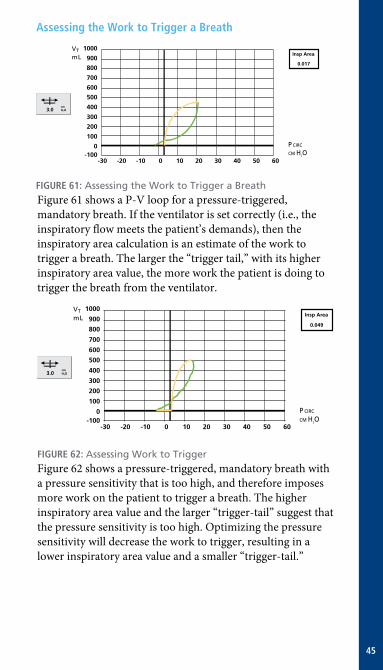
CM H2O
FiGure 61: Assessing the Work to Trigger a Breath Figure.61.shows.a.P-V.loop.for.a.pressure-triggered,.mandatory.breath ..If.the.ventilator.is.set.correctly.(i .e .,.the.inspiratory.flow.meets.the.patient’s.demands),.then.the.inspiratory.area.calculation.is.an.estimate.of.the.work.to.trigger.a.breath ..The.larger.the.“trigger.tail,”.with.its.higher.inspiratory.area.value,.the.more.work.the.patient.is.doing.to.trigger.the.breath.from.the.ventilator .
-30 -20 -10 0 10 20 30 40 50 60
1000
900
800
700
600
500
400
300
200
100
0 -100
Insp Area
0.049
3.0cmH2O
VT
mL
P CIRC
CM H2O
FiGure 62: Assessing Work to Trigger Figure.62.shows.a.pressure-triggered,.mandatory.breath.with.a.pressure.sensitivity.that.is.too.high,.and.therefore.imposes.more.work.on.the.patient.to.trigger.a.breath ..The.higher.inspiratory.area.value.and.the.larger.“trigger-tail”.suggest.that.the.pressure.sensitivity.is.too.high ..Optimizing.the.pressure.sensitivity.will.decrease.the.work.to.trigger,.resulting.in.a.lower.inspiratory.area.value.and.a.smaller.“trigger-tail .”
46
Assessing Compliance
-30 -20 -10 0 10 20 30 40 50 60
1000
900
800
700
600
500
400
300
200
100
0 -100
Insp Area
0.000
3.0cmH2O
VT
mL
P CIRC
CM H2O
BSlope
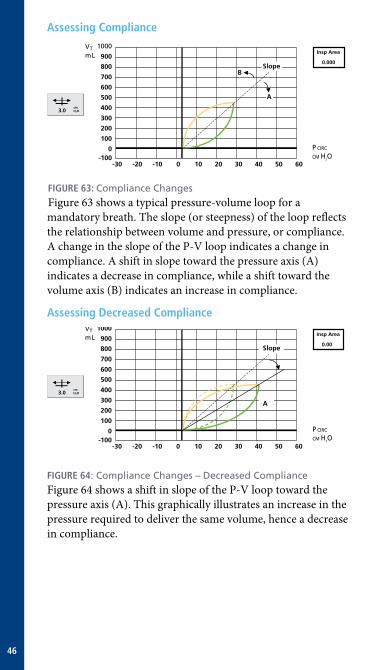
A
FiGure 63: Compliance Changes Figure.63.shows.a.typical.pressure-volume.loop.for.a.mandatory.breath ..The.slope.(or.steepness).of.the.loop.reflects.the.relationship.between.volume.and.pressure,.or.compliance ..A.change.in.the.slope.of.the.P-V.loop.indicates.a.change.in.compliance ..A.shift.in.slope.toward.the.pressure.axis.(A).indicates.a.decrease.in.compliance,.while.a.shift.toward.the.volume.axis.(B).indicates.an.increase.in.compliance .
Assessing decreased Compliance
-30 -20 -10 0 10 20 30 40 50 60
1000
900
800
700
600
500
400
300
200
100
0 -100
Insp Area
0.00
3.0cmH2O
VT
mL
P CIRC
CM H2O
A
Slope
FiGure 64: Compliance Changes – Decreased Compliance Figure.64.shows.a.shift.in.slope.of.the.P-V.loop.toward.the.pressure.axis.(A) ..This.graphically.illustrates.an.increase.in.the.pressure.required.to.deliver.the.same.volume,.hence.a.decrease.in.compliance .
47
Assessing resistance
-30 -20 -10 0 10 20 30 40 50 60
1000
900
800
700
600
500
400
300
200
100
0 -100
Insp Area
0.00
3.0cmH2O
VT
mL
P CIRC
CM H2O
A
B
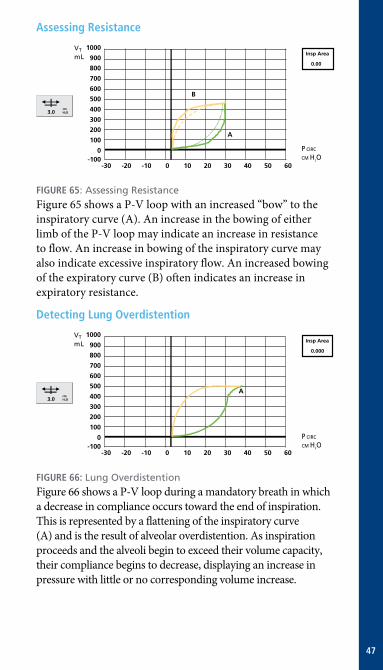
FiGure 65: Assessing Resistance Figure.65.shows.a.P-V.loop.with.an.increased.“bow”.to.the.inspiratory.curve.(A) ..An.increase.in.the.bowing.of.either.limb.of.the.P-V.loop.may.indicate.an.increase.in.resistance.to.flow ..An.increase.in.bowing.of.the.inspiratory.curve.may.also.indicate.excessive.inspiratory.flow ..An.increased.bowing.of.the.expiratory.curve.(B).often.indicates.an.increase.in.expiratory.resistance .
detecting lung overdistention
-30 -20 -10 0 10 20 30 40 50 60
1000
900
800
700
600
500
400
300
200
100
0 -100
Insp Area
0.000
3.0cmH2O
VT
mL
P CIRC
CM H2O
A
FiGure 66: Lung Overdistention Figure.66.shows.a.P-V.loop.during.a.mandatory.breath.in.which.a.decrease.in.compliance.occurs.toward.the.end.of.inspiration ..This.is.represented.by.a.flattening.of.the.inspiratory.curve.(A).and.is.the.result.of.alveolar.overdistention ..As.inspiration.proceeds.and.the.alveoli.begin.to.exceed.their.volume.capacity,.their.compliance.begins.to.decrease,.displaying.an.increase.in.pressure.with.little.or.no.corresponding.volume.increase ..
48
determining the effects of Flow Pattern on the P-V loop
-30 -20 -10 0 10 20 30 40 50 60
1000
900
800
700
600
500
400
300
200
100
0 -100
Insp Area
0.000
3.0cmH2O
VT
mL
P CIRC
CM H2O
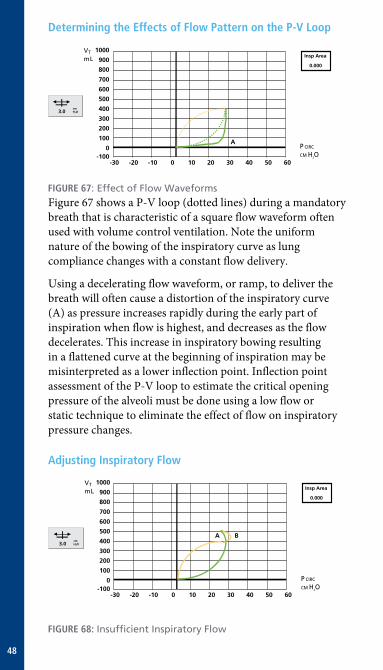
A
FiGure 67: Effect of Flow Waveforms Figure.67.shows.a.P-V.loop.(dotted.lines).during.a.mandatory.breath.that.is.characteristic.of.a.square.flow.waveform.often.used.with.volume.control.ventilation ..Note.the.uniform.nature.of.the.bowing.of.the.inspiratory.curve.as.lung.compliance.changes.with.a.constant.flow.delivery ..
Using.a.decelerating.flow.waveform,.or.ramp,.to.deliver.the.breath.will.often.cause.a.distortion.of.the.inspiratory.curve.(A).as.pressure.increases.rapidly.during.the.early.part.of.inspiration.when.flow.is.highest,.and.decreases.as.the.flow.decelerates ..This.increase.in.inspiratory.bowing.resulting.in.a.flattened.curve.at.the.beginning.of.inspiration.may.be.misinterpreted.as.a.lower.inflection.point ..Inflection.point.assessment.of.the.P-V.loop.to.estimate.the.critical.opening.pressure.of.the.alveoli.must.be.done.using.a.low.flow.or.static.technique.to.eliminate.the.effect.of.flow.on.inspiratory.pressure.changes .
Adjusting inspiratory Flow
-30 -20 -10 0 10 20 30 40 50 60
1000
900
800
700
600
500
400
300
200
100
0 -100
Insp Area
0.000
3.0cmH2O
VT
mL
P CIRC
CM H2O
A B
FiGure 68: Insufficient Inspiratory Flow
49
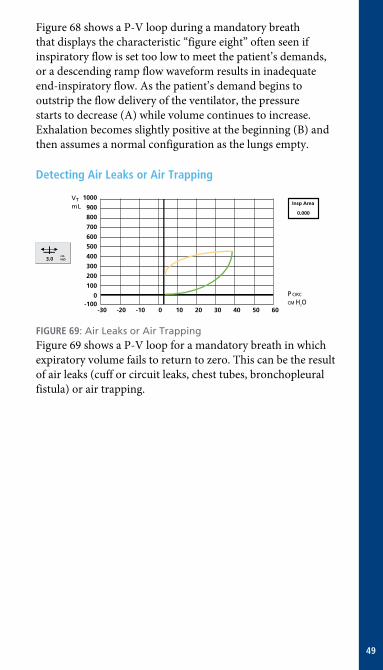
Figure.68.shows.a.P-V.loop.during.a.mandatory.breath.that.displays.the.characteristic.“figure.eight”.often.seen.if.inspiratory.flow.is.set.too.low.to.meet.the.patient’s.demands,.or.a.descending.ramp.flow.waveform.results.in.inadequate.end-inspiratory.flow ..As.the.patient’s.demand.begins.to.outstrip.the.flow.delivery.of.the.ventilator,.the.pressure.starts.to.decrease.(A).while.volume.continues.to.increase ..Exhalation.becomes.slightly.positive.at.the.beginning.(B).and.then.assumes.a.normal.configuration.as.the.lungs.empty .
detecting Air leaks or Air Trapping
-30 -20 -10 0 10 20 30 40 50 60
1000
900
800
700
600
500
400
300
200
100
0 -100
Insp Area
0.000
3.0cmH2O
VT
mL
P CIRC
CM H2O
FiGure 69: Air Leaks or Air Trapping Figure.69.shows.a.P-V.loop.for.a.mandatory.breath.in.which.expiratory.volume.fails.to.return.to.zero ..This.can.be.the.result.of.air.leaks.(cuff.or.circuit.leaks,.chest.tubes,.bronchopleural.fistula).or.air.trapping .
50
FloW-Volume looP
A
B
VT
mL
200 0 200 400 600 800 1000 1200 1400 1600
3.0
2.5
2.0
1.5
1.0
0.5
0
0.5
1.0
1.5
2.0
2.5
.V Lsec
EXH
INSP
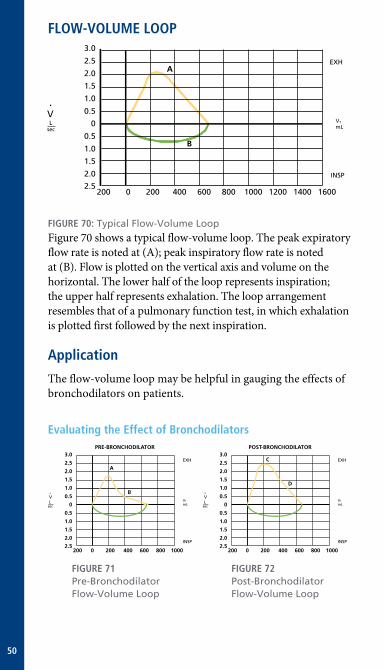
FiGure 70: Typical Flow-Volume Loop Figure.70.shows.a.typical.flow-volume.loop ..The.peak.expiratory.flow.rate.is.noted.at.(A);.peak.inspiratory.flow.rate.is.noted.at.(B) ..Flow.is.plotted.on.the.vertical.axis.and.volume.on.the.horizontal ..The.lower.half.of.the.loop.represents.inspiration;.the.upper.half.represents.exhalation ..The.loop.arrangement.resembles.that.of.a.pulmonary.function.test,.in.which.exhalation.is.plotted.first.followed.by.the.next.inspiration ..
Application
The.flow-volume.loop.may.be.helpful.in.gauging.the.effects.of.bronchodilators.on.patients .
evaluating the effect of bronchodilatorsPRE-BRONCHODILATOR POST-BRONCHODILATOR
VT
mL
200 0 200 400 600 800 1000
3.0
2.5
2.0
1.5
1.0
0.5
0
0.5
1.0
1.5
2.0
2.5
. V Lsec
EXH
INSP
VT
mL
200 0 200 400 600 800 1000
3.0
2.5
2.0
1.5
1.0
0.5
0
0.5
1.0
1.5
2.0
2.5
. V Lsec
EXH
INSP
D
C
A
B
FiGure 71 FiGure 72Pre-Bronchodilator Post-Bronchodilator Flow-Volume Loop Flow-Volume Loop

51
Figures.71.and.72.show.pre-.and.post-bronchodilator.flow-volume.loops.that.indicate.a.positive.response.to.the.bronchodilator.administration ..The.flow-volume.loop.before.bronchodilator.administration.shows.a.low.peak.expiratory.flow.rate.(A).and.a.scalloped.shape.near.the.end.of.exhalation.(B).that.is.characteristic.of.poor.airway.conductivity ..The.post-bronchodilator.loop.shows.an.improved.peak.expiratory.flow.(C).as.well.as.improved.flow.toward.the.end.of.exhalation.(D) .

6135.Gunbarrel.AvenueBoulder,.CO.80301
800-635-5267 www .covidien .com
COVIDIEN, COVIDIEN with logo, Covidien logo and positive results for life are U.S. and internationally
registered trademarks of Covidien AG. Other brands are trademarks of a Covidien company.
©2010 Covidien. All rights reserved
09-VE-0563v13 VE07100
Nellcor™
Puritan Bennett™
Airox™
Mallinckrodt™
DAR™
Shiley™