Vendor Landscape: IT Asset Management (ITAM) · Vendor Landscape: IT Asset Management Info-Tech...
35
1 Info-Tech Research Group Vendor Landscape: IT Asset Management Info-Tech Research Group, Inc. is a global leader in providing IT research and advice. Info-Tech’s products and services combine actionable insight and relevant advice with ready-to-use tools and templates that cover the full spectrum of IT concerns. © 1997-2016 Info-Tech Research Group Inc. Vendor Landscape: IT Asset Management (ITAM) Choosing the right tool to manage the complexity of your environment will make all the difference in gaining access to great data.
Transcript of Vendor Landscape: IT Asset Management (ITAM) · Vendor Landscape: IT Asset Management Info-Tech...
1Info-Tech Research GroupVendor Landscape: IT Asset Management
Info-Tech Research Group, Inc. is a global leader in providing IT research and advice.
Info-Tech’s products and services combine actionable insight and relevant advice with
ready-to-use tools and templates that cover the full spectrum of IT concerns.
© 1997-2016 Info-Tech Research Group Inc.
Vendor Landscape: IT Asset Management (ITAM)
Choosing the right tool to manage the complexity of your environment will make all the
difference in gaining access to great data.
2Info-Tech Research GroupVendor Landscape: IT Asset Management
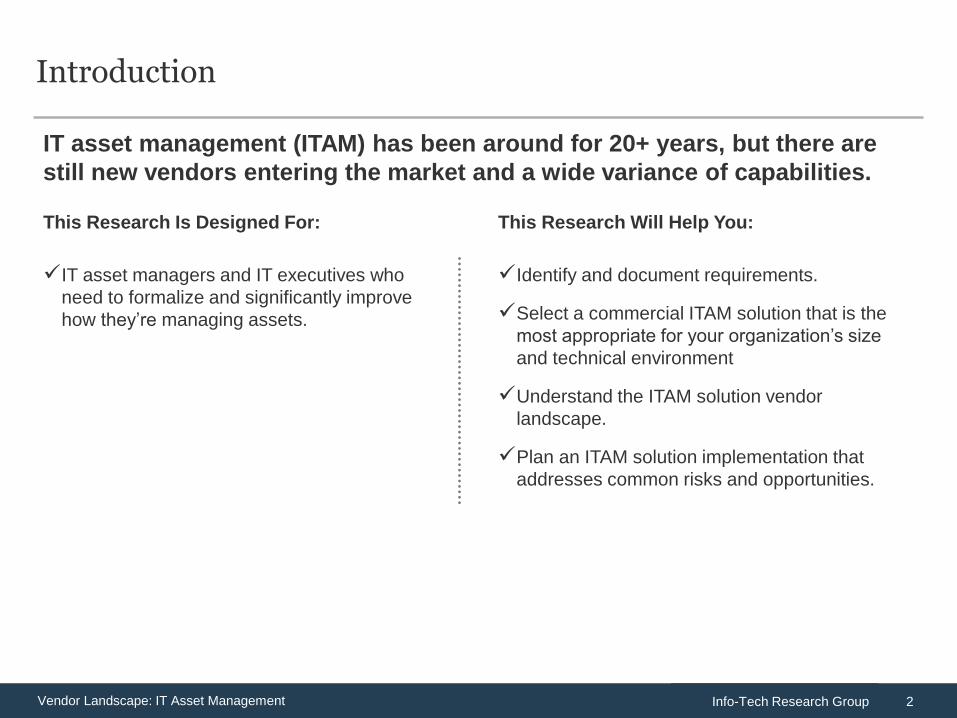
IT asset management (ITAM) has been around for 20+ years, but there are
still new vendors entering the market and a wide variance of capabilities.
Introduction
IT asset managers and IT executives who
need to formalize and significantly improve
how they’re managing assets.
This Research Is Designed For: This Research Will Help You:
Identify and document requirements.
Select a commercial ITAM solution that is the
most appropriate for your organization’s size
and technical environment
Understand the ITAM solution vendor
landscape.
Plan an ITAM solution implementation that
addresses common risks and opportunities.
3Info-Tech Research GroupVendor Landscape: IT Asset Management
Executive summary
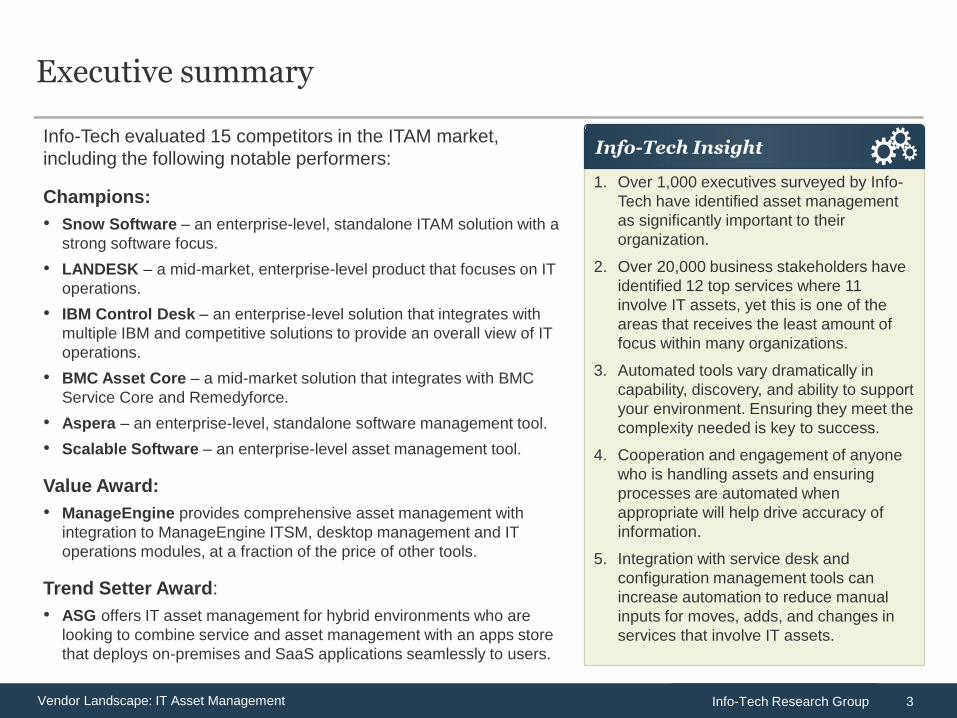
Info-Tech evaluated 15 competitors in the ITAM market,
including the following notable performers:
Champions:
• Snow Software – an enterprise-level, standalone ITAM solution with a
strong software focus.
• LANDESK – a mid-market, enterprise-level product that focuses on IT
operations.
• IBM Control Desk – an enterprise-level solution that integrates with
multiple IBM and competitive solutions to provide an overall view of IT
operations.
• BMC Asset Core – a mid-market solution that integrates with BMC
Service Core and Remedyforce.
• Aspera – an enterprise-level, standalone software management tool.
• Scalable Software – an enterprise-level asset management tool.
Value Award:
• ManageEngine provides comprehensive asset management with
integration to ManageEngine ITSM, desktop management and IT
operations modules, at a fraction of the price of other tools.
Trend Setter Award:
• ASG offers IT asset management for hybrid environments who are
looking to combine service and asset management with an apps store
that deploys on-premises and SaaS applications seamlessly to users.
1. Over 1,000 executives surveyed by Info-
Tech have identified asset management
as significantly important to their
organization.
2. Over 20,000 business stakeholders have
identified 12 top services where 11
involve IT assets, yet this is one of the
areas that receives the least amount of
focus within many organizations.
3. Automated tools vary dramatically in
capability, discovery, and ability to support
your environment. Ensuring they meet the
complexity needed is key to success.
4. Cooperation and engagement of anyone
who is handling assets and ensuring
processes are automated when
appropriate will help drive accuracy of
information.
5. Integration with service desk and
configuration management tools can
increase automation to reduce manual
inputs for moves, adds, and changes in
services that involve IT assets.
Info-Tech Insight
4Info-Tech Research GroupVendor Landscape: IT Asset Management
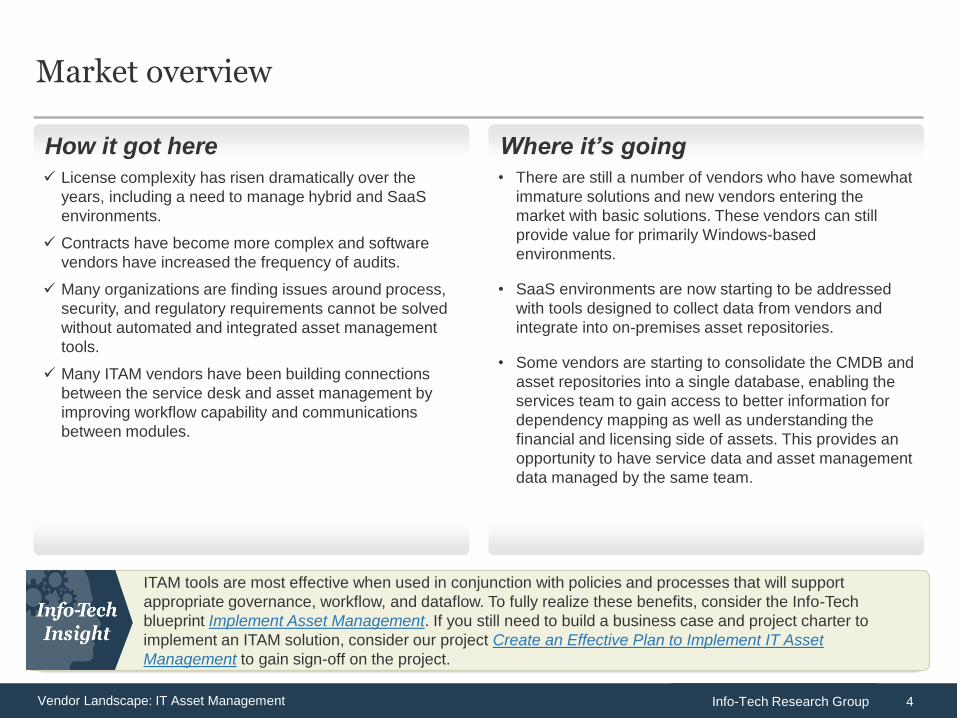
Market overview
License complexity has risen dramatically over the
years, including a need to manage hybrid and SaaS
environments.
Contracts have become more complex and software
vendors have increased the frequency of audits.
Many organizations are finding issues around process,
security, and regulatory requirements cannot be solved
without automated and integrated asset management
tools.
Many ITAM vendors have been building connections
between the service desk and asset management by
improving workflow capability and communications
between modules.
• There are still a number of vendors who have somewhat
immature solutions and new vendors entering the
market with basic solutions. These vendors can still
provide value for primarily Windows-based
environments.
• SaaS environments are now starting to be addressed
with tools designed to collect data from vendors and
integrate into on-premises asset repositories.
• Some vendors are starting to consolidate the CMDB and
asset repositories into a single database, enabling the
services team to gain access to better information for
dependency mapping as well as understanding the
financial and licensing side of assets. This provides an
opportunity to have service data and asset management
data managed by the same team.
How it got here Where it’s going
ITAM tools are most effective when used in conjunction with policies and processes that will support
appropriate governance, workflow, and dataflow. To fully realize these benefits, consider the Info-Tech
blueprint Implement Asset Management. If you still need to build a business case and project charter to
implement an ITAM solution, consider our project Create an Effective Plan to Implement IT Asset
Management to gain sign-off on the project.
5Info-Tech Research GroupVendor Landscape: IT Asset Management
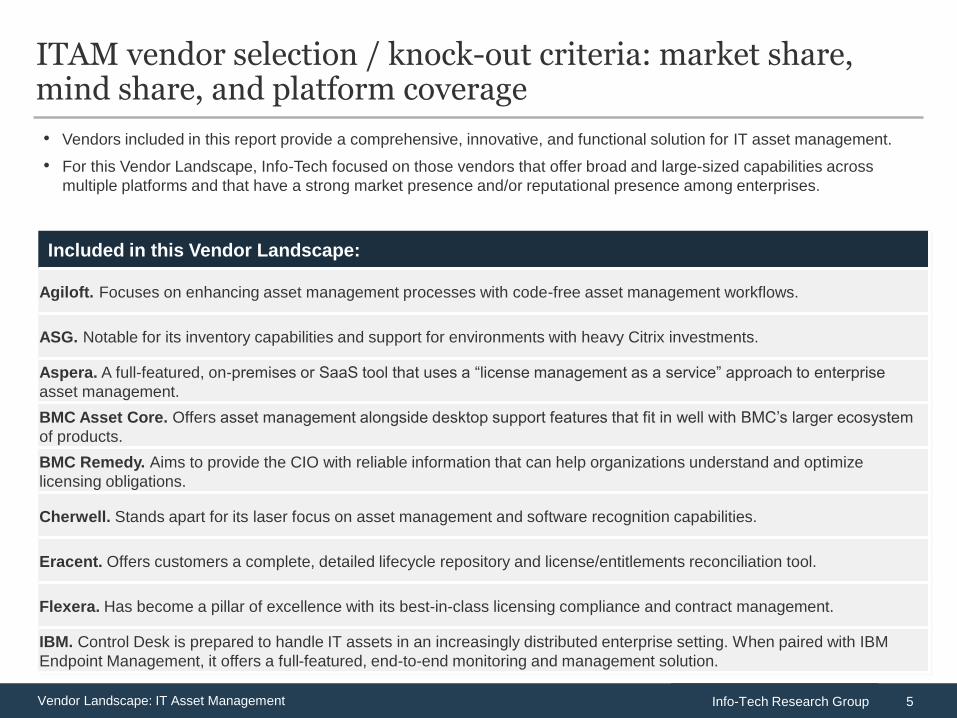
ITAM vendor selection / knock-out criteria: market share, mind share, and platform coverage
• Vendors included in this report provide a comprehensive, innovative, and functional solution for IT asset management.
• For this Vendor Landscape, Info-Tech focused on those vendors that offer broad and large-sized capabilities across
multiple platforms and that have a strong market presence and/or reputational presence among enterprises.
Included in this Vendor Landscape:
Agiloft. Focuses on enhancing asset management processes with code-free asset management workflows.
ASG. Notable for its inventory capabilities and support for environments with heavy Citrix investments.
Aspera. A full-featured, on-premises or SaaS tool that uses a “license management as a service” approach to enterprise
asset management.
BMC Asset Core. Offers asset management alongside desktop support features that fit in well with BMC’s larger ecosystem
of products.
BMC Remedy. Aims to provide the CIO with reliable information that can help organizations understand and optimize
licensing obligations.
Cherwell. Stands apart for its laser focus on asset management and software recognition capabilities.
Eracent. Offers customers a complete, detailed lifecycle repository and license/entitlements reconciliation tool.
Flexera. Has become a pillar of excellence with its best-in-class licensing compliance and contract management.
IBM. Control Desk is prepared to handle IT assets in an increasingly distributed enterprise setting. When paired with IBM
Endpoint Management, it offers a full-featured, end-to-end monitoring and management solution.
6Info-Tech Research GroupVendor Landscape: IT Asset Management
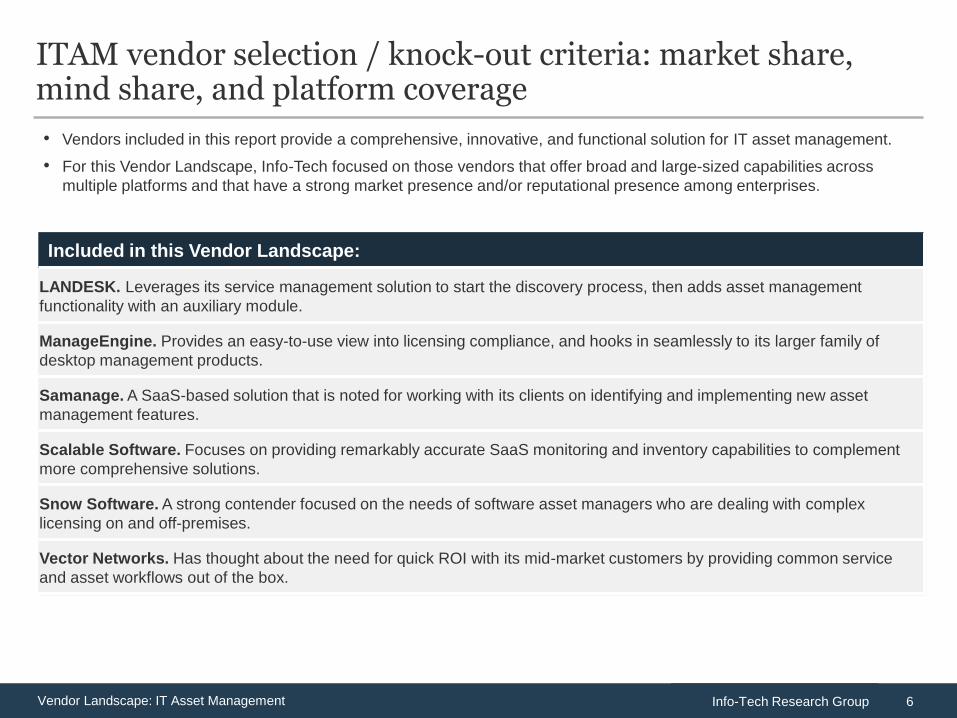
ITAM vendor selection / knock-out criteria: market share, mind share, and platform coverage
• Vendors included in this report provide a comprehensive, innovative, and functional solution for IT asset management.
• For this Vendor Landscape, Info-Tech focused on those vendors that offer broad and large-sized capabilities across
multiple platforms and that have a strong market presence and/or reputational presence among enterprises.
Included in this Vendor Landscape:
LANDESK. Leverages its service management solution to start the discovery process, then adds asset management
functionality with an auxiliary module.
ManageEngine. Provides an easy-to-use view into licensing compliance, and hooks in seamlessly to its larger family of
desktop management products.
Samanage. A SaaS-based solution that is noted for working with its clients on identifying and implementing new asset
management features.
Scalable Software. Focuses on providing remarkably accurate SaaS monitoring and inventory capabilities to complement
more comprehensive solutions.
Snow Software. A strong contender focused on the needs of software asset managers who are dealing with complex
licensing on and off-premises.
Vector Networks. Has thought about the need for quick ROI with its mid-market customers by providing common service
and asset workflows out of the box.
7Info-Tech Research GroupVendor Landscape: IT Asset Management
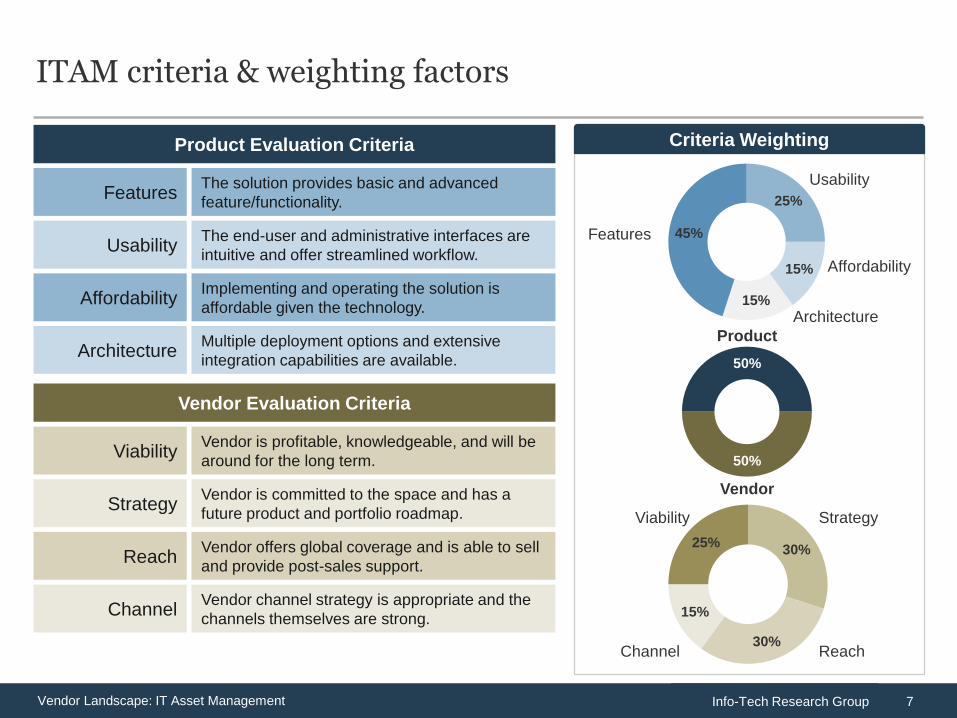
Criteria Weighting
ITAM criteria & weighting factors
25%
15%
15%
45%
50%
50%
Vendor is committed to the space and has a
future product and portfolio roadmap.Strategy
Vendor offers global coverage and is able to sell
and provide post-sales support. Reach
Vendor is profitable, knowledgeable, and will be
around for the long term.Viability
Vendor channel strategy is appropriate and the
channels themselves are strong. Channel
Implementing and operating the solution is
affordable given the technology.Affordability
Multiple deployment options and extensive
integration capabilities are available.Architecture
The end-user and administrative interfaces are
intuitive and offer streamlined workflow.Usability
The solution provides basic and advanced
feature/functionality.Features
30%
30%
15%
25%
Features
Usability
Architecture
Affordability
Product
Vendor
Viability Strategy
Channel Reach
Product Evaluation Criteria
Vendor Evaluation Criteria
8Info-Tech Research GroupVendor Landscape: IT Asset Management
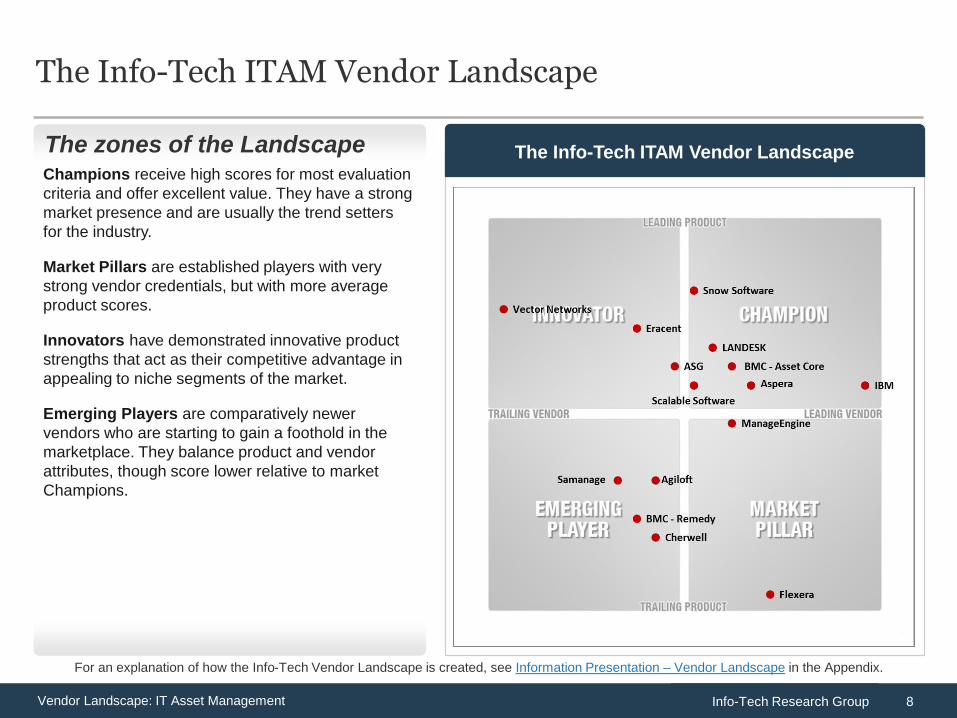
The Info-Tech ITAM Vendor Landscape
The Info-Tech ITAM Vendor Landscape
Champions receive high scores for most evaluation
criteria and offer excellent value. They have a strong
market presence and are usually the trend setters
for the industry.
Market Pillars are established players with very
strong vendor credentials, but with more average
product scores.
Innovators have demonstrated innovative product
strengths that act as their competitive advantage in
appealing to niche segments of the market.
Emerging Players are comparatively newer
vendors who are starting to gain a foothold in the
marketplace. They balance product and vendor
attributes, though score lower relative to market
Champions.
For an explanation of how the Info-Tech Vendor Landscape is created, see Information Presentation – Vendor Landscape in the Appendix.
The zones of the Landscape
9Info-Tech Research GroupVendor Landscape: IT Asset Management
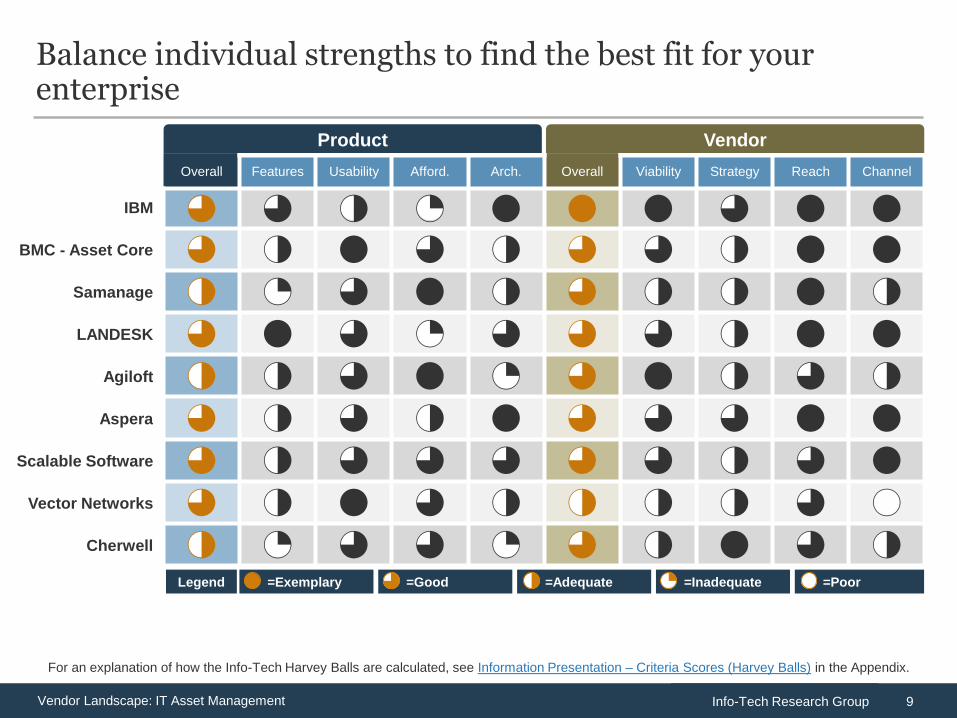
Balance individual strengths to find the best fit for your enterprise
For an explanation of how the Info-Tech Harvey Balls are calculated, see Information Presentation – Criteria Scores (Harvey Balls) in the Appendix.
Overall Features Usability Afford. Arch. Overall Viability Strategy Reach Channel
3 3 2 1 4 4 4 3 4 4
3 2 4 3 2 3 3 2 4 4
2 1 3 4 2 3 2 2 4 2
3 4 3 1 3 3 3 2 4 4
2 2 3 4 1 3 4 2 3 2
3 2 3 2 4 3 3 3 4 4
3 2 3 3 3 3 3 2 3 4
3 2 4 3 2 2 2 2 3 0
2 1 3 3 1 3 2 4 3 2
Product Vendor
IBM
BMC - Asset Core
Samanage
LANDESK
Agiloft
Aspera
Scalable Software
Vector Networks
Cherwell
=Exemplary =Good =Adequate =Inadequate =PoorLegend
10Info-Tech Research GroupVendor Landscape: IT Asset Management
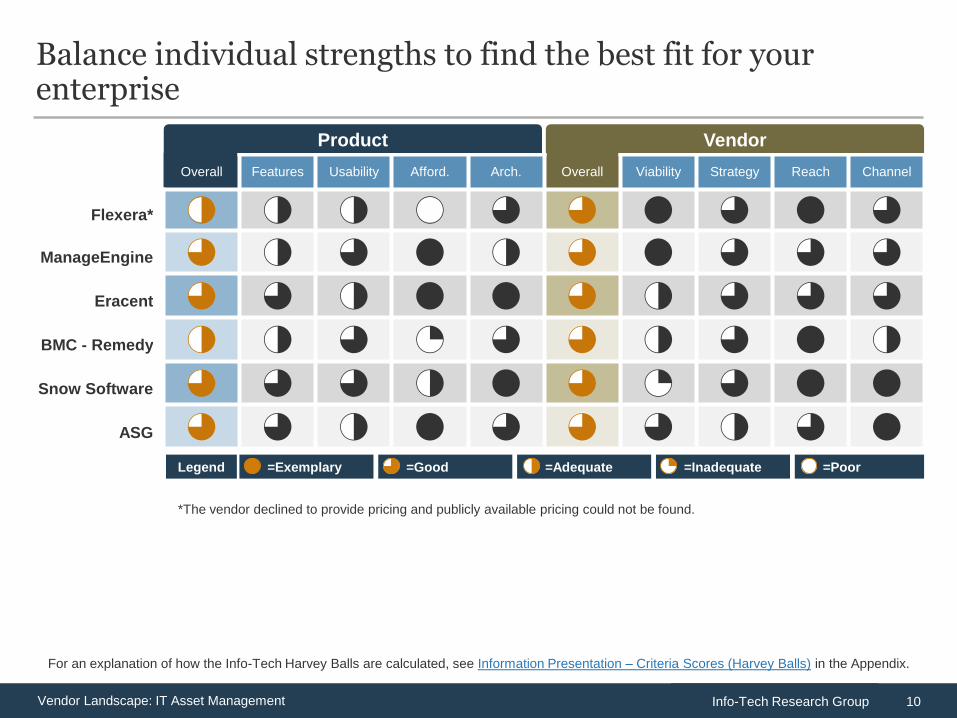
Balance individual strengths to find the best fit for your enterprise
Overall Features Usability Afford. Arch. Overall Viability Strategy Reach Channel
2 2 2 0 3 3 4 3 4 3
3 2 3 4 2 3 4 3 3 3
3 3 2 4 4 3 2 3 3 3
2 2 3 1 3 3 2 3 4 2
3 3 3 2 4 3 1 3 4 4
3 3 2 4 3 3 3 2 3 4
Product Vendor
For an explanation of how the Info-Tech Harvey Balls are calculated, see Information Presentation – Criteria Scores (Harvey Balls) in the Appendix.
*The vendor declined to provide pricing and publicly available pricing could not be found.
Flexera*
ManageEngine
Eracent
BMC - Remedy
Snow Software
ASG
=Exemplary =Good =Adequate =Inadequate =PoorLegend
11Info-Tech Research GroupVendor Landscape: IT Asset Management
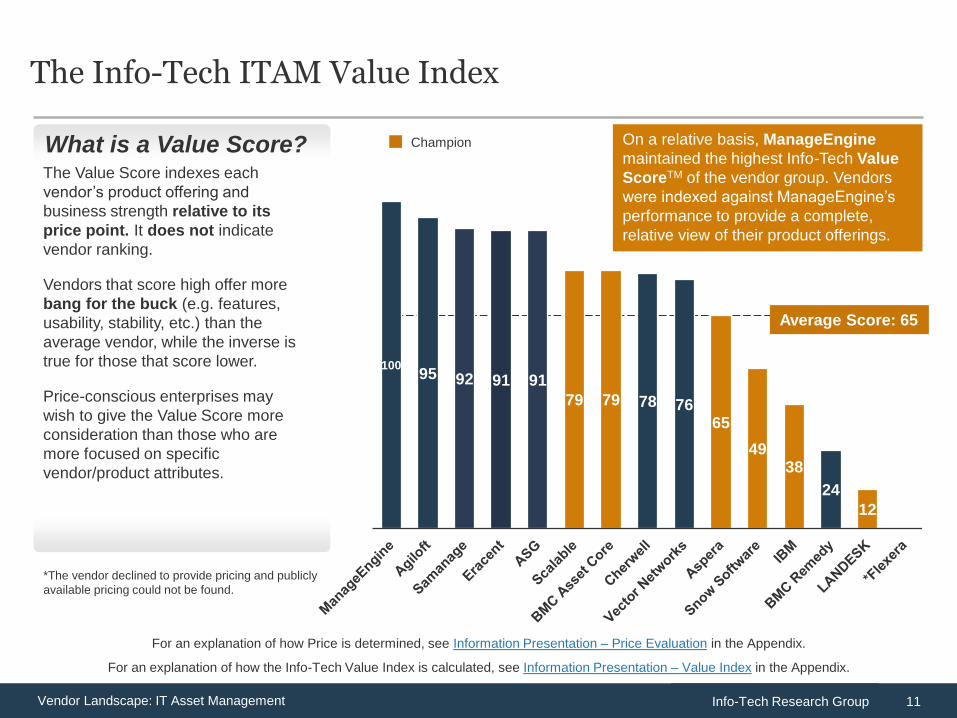
What is a Value Score?
The Info-Tech ITAM Value Index
4050
6070
8090
3020
10
The Value Score indexes each
vendor’s product offering and
business strength relative to its
price point. It does not indicate
vendor ranking.
Vendors that score high offer more
bang for the buck (e.g. features,
usability, stability, etc.) than the
average vendor, while the inverse is
true for those that score lower.
Price-conscious enterprises may
wish to give the Value Score more
consideration than those who are
more focused on specific
vendor/product attributes.
On a relative basis, ManageEngine
maintained the highest Info-Tech Value
ScoreTM of the vendor group. Vendors
were indexed against ManageEngine’s
performance to provide a complete,
relative view of their product offerings.
Champion
For an explanation of how the Info-Tech Value Index is calculated, see Information Presentation – Value Index in the Appendix.
For an explanation of how Price is determined, see Information Presentation – Price Evaluation in the Appendix.
*The vendor declined to provide pricing and publicly
available pricing could not be found.
Average Score: 65
10095 92 91 91
79 79 78 7665
4938
24
12 0
12Info-Tech Research GroupVendor Landscape: IT Asset Management
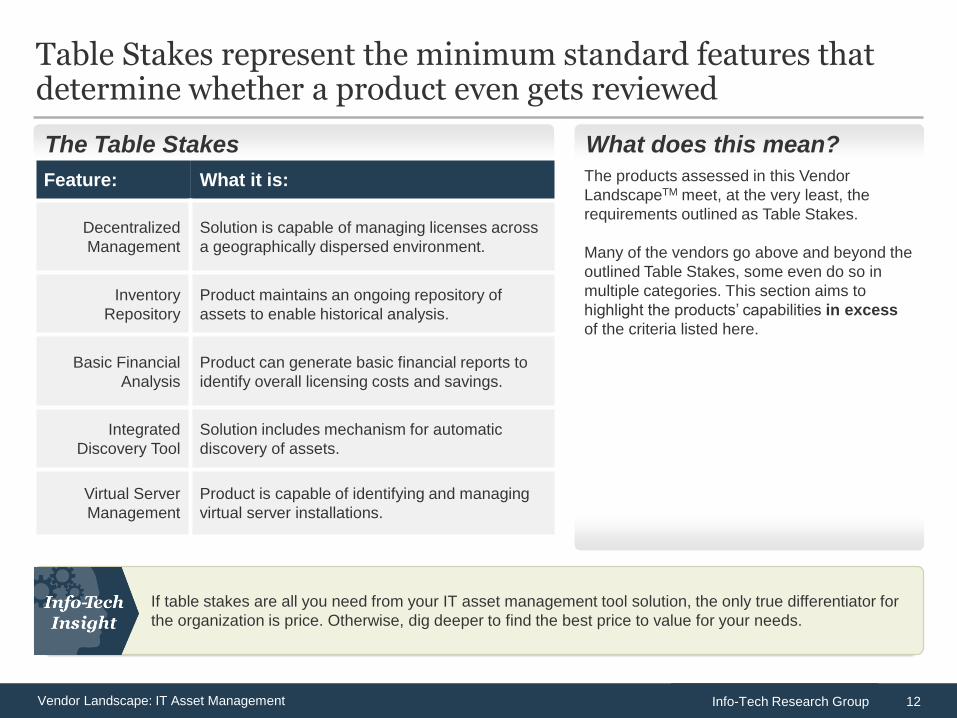
Table Stakes represent the minimum standard features that determine whether a product even gets reviewed
If table stakes are all you need from your IT asset management tool solution, the only true differentiator for
the organization is price. Otherwise, dig deeper to find the best price to value for your needs.
The products assessed in this Vendor
LandscapeTM meet, at the very least, the
requirements outlined as Table Stakes.
Many of the vendors go above and beyond the
outlined Table Stakes, some even do so in
multiple categories. This section aims to
highlight the products’ capabilities in excess
of the criteria listed here.
The Table Stakes What does this mean?
Feature: What it is:
Decentralized
Management
Solution is capable of managing licenses across
a geographically dispersed environment.
Inventory
Repository
Product maintains an ongoing repository of
assets to enable historical analysis.
Basic Financial
Analysis
Product can generate basic financial reports to
identify overall licensing costs and savings.
Integrated
Discovery Tool
Solution includes mechanism for automatic
discovery of assets.
Virtual Server
Management
Product is capable of identifying and managing
virtual server installations.
13Info-Tech Research GroupVendor Landscape: IT Asset Management
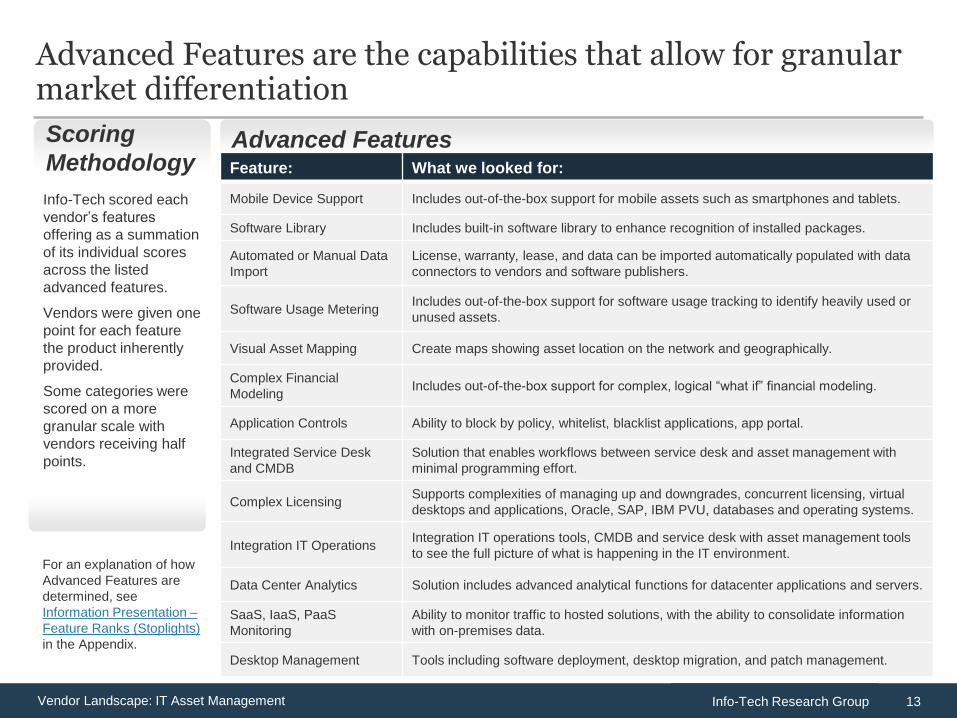
Advanced Features are the capabilities that allow for granular market differentiation
Advanced Features
Info-Tech scored each
vendor’s features
offering as a summation
of its individual scores
across the listed
advanced features.
Vendors were given one
point for each feature
the product inherently
provided.
Some categories were
scored on a more
granular scale with
vendors receiving half
points.
Scoring
Methodology
For an explanation of how
Advanced Features are
determined, see
Information Presentation –
Feature Ranks (Stoplights)
in the Appendix.
Feature: What we looked for:
Mobile Device Support Includes out-of-the-box support for mobile assets such as smartphones and tablets.
Software Library Includes built-in software library to enhance recognition of installed packages.
Automated or Manual Data
Import
License, warranty, lease, and data can be imported automatically populated with data
connectors to vendors and software publishers.
Software Usage MeteringIncludes out-of-the-box support for software usage tracking to identify heavily used or
unused assets.
Visual Asset Mapping Create maps showing asset location on the network and geographically.
Complex Financial
ModelingIncludes out-of-the-box support for complex, logical “what if” financial modeling.
Application Controls Ability to block by policy, whitelist, blacklist applications, app portal.
Integrated Service Desk
and CMDB
Solution that enables workflows between service desk and asset management with
minimal programming effort.
Complex LicensingSupports complexities of managing up and downgrades, concurrent licensing, virtual
desktops and applications, Oracle, SAP, IBM PVU, databases and operating systems.
Integration IT OperationsIntegration IT operations tools, CMDB and service desk with asset management tools
to see the full picture of what is happening in the IT environment.
Data Center Analytics Solution includes advanced analytical functions for datacenter applications and servers.
SaaS, IaaS, PaaS
Monitoring
Ability to monitor traffic to hosted solutions, with the ability to consolidate information
with on-premises data.
Desktop Management Tools including software deployment, desktop migration, and patch management.
14Info-Tech Research GroupVendor Landscape: IT Asset Management
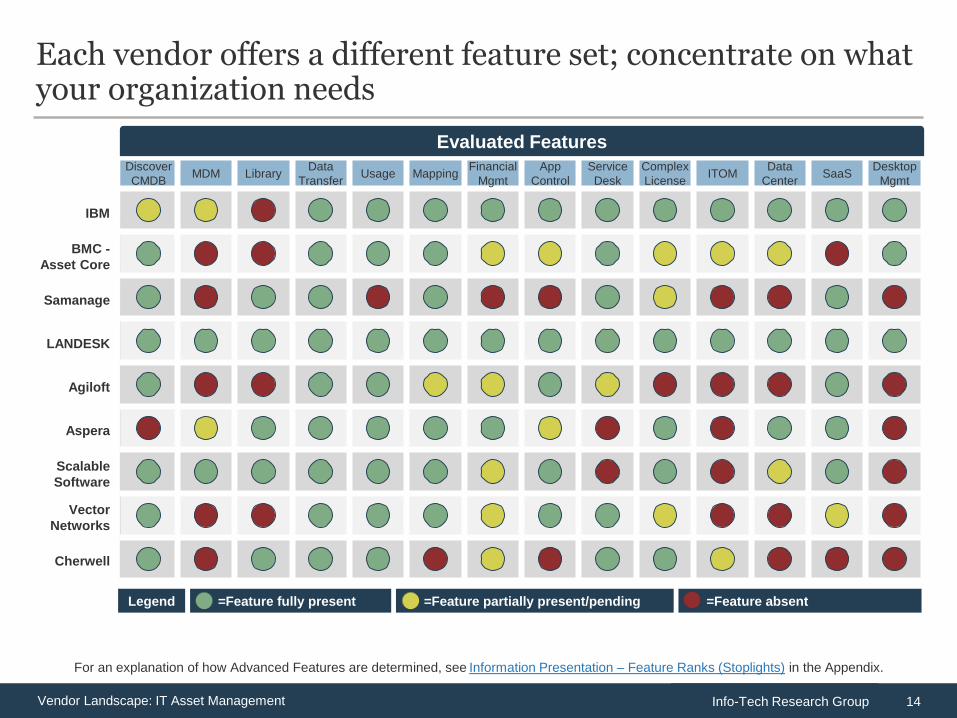
Each vendor offers a different feature set; concentrate on what your organization needs
Discover
CMDBMDM Library
Data
TransferUsage Mapping
Financial
Mgmt
App
Control
Service
Desk
Complex
LicenseITOM
Data
CenterSaaS
Desktop
Mgmt
Evaluated Features
=Feature absent=Feature partially present/pending=Feature fully presentLegend
For an explanation of how Advanced Features are determined, see Information Presentation – Feature Ranks (Stoplights) in the Appendix.
IBM
BMC -
Asset Core
Samanage
LANDESK
Agiloft
Aspera
Scalable
Software
Vector
Networks
Cherwell
15Info-Tech Research GroupVendor Landscape: IT Asset Management
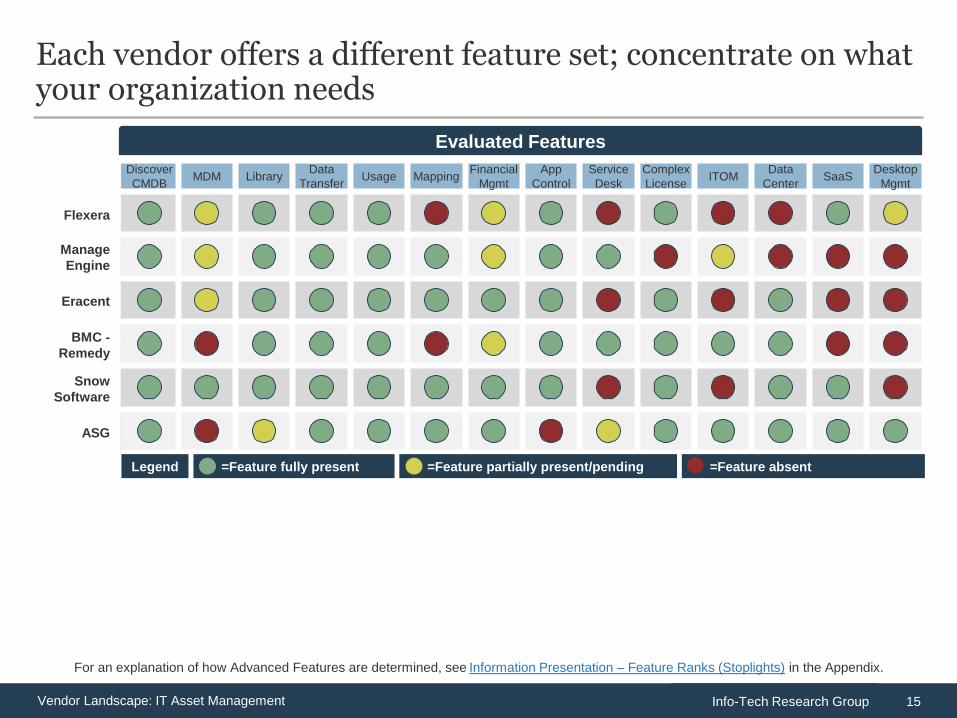
Each vendor offers a different feature set; concentrate on what your organization needs
Discover
CMDBMDM Library
Data
TransferUsage Mapping
Financial
Mgmt
App
Control
Service
Desk
Complex
LicenseITOM
Data
CenterSaaS
Desktop
Mgmt
Evaluated Features
=Feature absent=Feature partially present/pending=Feature fully presentLegend
For an explanation of how Advanced Features are determined, see Information Presentation – Feature Ranks (Stoplights) in the Appendix.
Flexera
Manage
Engine
Eracent
BMC -
Remedy
Snow
Software
ASG
16Info-Tech Research GroupVendor Landscape: IT Asset Management
Often chosen by mid-market organizations looking for an all-in-one solution
to take advantage of integrated workflows with a single management console.
IT asset management solutions with a focus on end-user device and license management
Why Scenarios?
In reviewing the products included
in each Vendor LandscapeTM,
certain use cases come to the
forefront. Whether those use cases
are defined by applicability in
certain locations, relevance for
certain industries, or as strengths in
delivering a specific capability, Info-
Tech recognizes those use cases
as Scenarios, and calls attention to
them where they exist.
32
ITAM combined with ITSM
and desktop configuration1
For an explanation of how Scenarios are determined, see Information Presentation – Scenarios in the Appendix.
Exemplary Performers
4 Asset Core
17Info-Tech Research GroupVendor Landscape: IT Asset Management
Often chosen by enterprise organizations looking for a solution to manage
servers and desktops through fully integrated components.
IT asset management solutions with integrated desktop management and systems management tools for IT operations
Exemplary Performers1
For an explanation of how Scenarios are determined, see Information Presentation – Scenarios in the Appendix.
Remedy
43
ITAM, ITSM and IT
operations tools2
Why Scenarios?
In reviewing the products included
in each Vendor LandscapeTM,
certain use cases come to the
forefront. Whether those use cases
are defined by applicability in
certain locations, relevance for
certain industries, or as strengths in
delivering a specific capability, Info-
Tech recognizes those use cases
as Scenarios, and calls attention to
them where they exist.
18Info-Tech Research GroupVendor Landscape: IT Asset Management
Often chosen by small to mid-market organizations needing to mature
service management, but not necessarily needing all ITIL process modules.
IT asset management tools combined with service management solutions
Exemplary Performers
21
ITAM and ITSM3
For an explanation of how Scenarios are determined, see Information Presentation – Scenarios in the Appendix.
Why Scenarios?
In reviewing the products included
in each Vendor LandscapeTM,
certain use cases come to the
forefront. Whether those use cases
are defined by applicability in
certain locations, relevance for
certain industries, or as strengths in
delivering a specific capability, Info-
Tech recognizes those use cases
as Scenarios, and calls attention to
them where they exist.
19Info-Tech Research GroupVendor Landscape: IT Asset Management
Often chosen by enterprise organizations to manage large, complex
licensing installations, working standalone or with ITAM/ITSM solutions.
IT asset management tools with a focus on managing complex licensing scenarios
Exemplary Performers
21
For an explanation of how Scenarios are determined, see Information Presentation – Scenarios in the Appendix.
3
ITAM only4Why Scenarios?
In reviewing the products included
in each Vendor LandscapeTM,
certain use cases come to the
forefront. Whether those use cases
are defined by applicability in
certain locations, relevance for
certain industries, or as strengths in
delivering a specific capability, Info-
Tech recognizes those use cases
as Scenarios, and calls attention to
them where they exist.
20Info-Tech Research GroupVendor Landscape: IT Asset Management
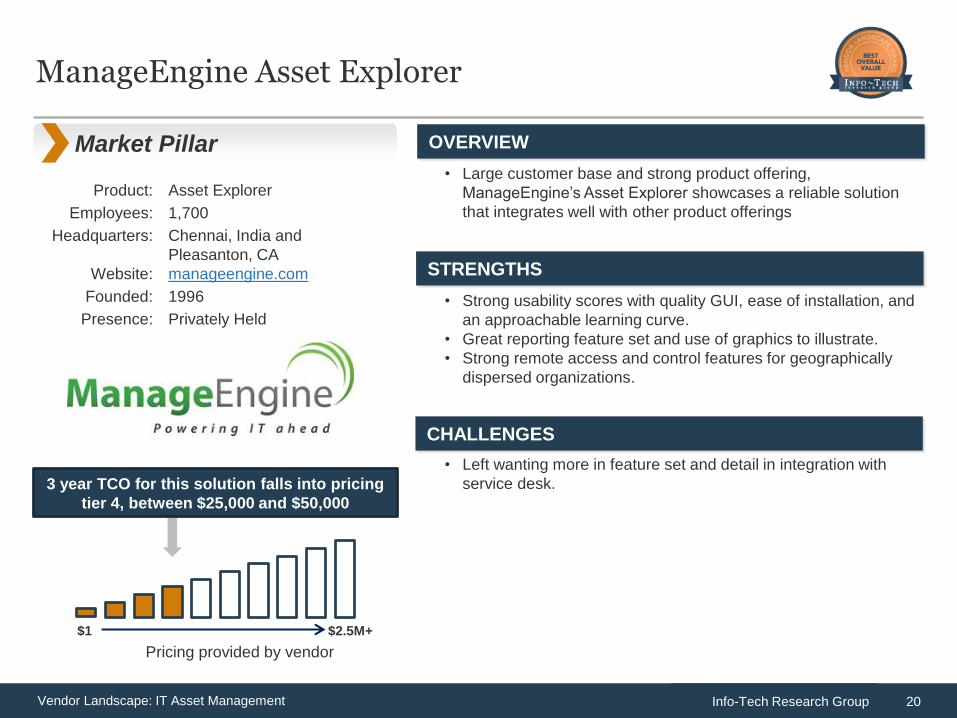
ManageEngine Asset Explorer
3 year TCO for this solution falls into pricing
tier 4, between $25,000 and $50,000
OVERVIEW
$1 $2.5M+
Pricing provided by vendor
Product: Asset Explorer
Employees: 1,700
Headquarters: Chennai, India and
Pleasanton, CA
Website: manageengine.com
Founded: 1996
Presence: Privately Held
STRENGTHS
CHALLENGES
• Large customer base and strong product offering,
ManageEngine’s Asset Explorer showcases a reliable solution
that integrates well with other product offerings
• Strong usability scores with quality GUI, ease of installation, and
an approachable learning curve.
• Great reporting feature set and use of graphics to illustrate.
• Strong remote access and control features for geographically
dispersed organizations.
• Left wanting more in feature set and detail in integration with
service desk.
Market Pillar
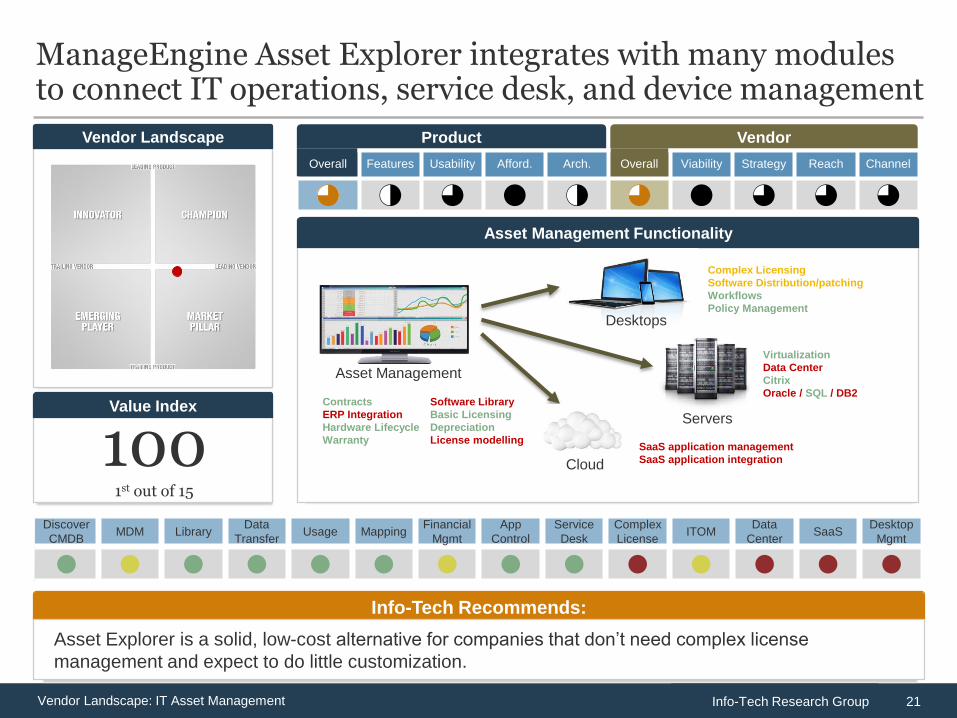
21Info-Tech Research GroupVendor Landscape: IT Asset Management
Vendor Landscape
ManageEngine Asset Explorer integrates with many modules to connect IT operations, service desk, and device management
Info-Tech Recommends:
Asset Explorer is a solid, low-cost alternative for companies that don’t need complex license
management and expect to do little customization.
Overall Features Usability Afford. Arch. Overall Viability Strategy Reach Channel
3 2 3 4 2 3 4 3 3 3
Product Vendor
Asset Management Functionality
Contracts Software Library
ERP Integration Basic Licensing
Hardware Lifecycle Depreciation
Warranty License modelling
Virtualization
Data Center
Citrix
Oracle / SQL / DB2
Complex Licensing
Software Distribution/patching
Workflows
Policy Management
Asset Management
Desktops
Servers
Cloud
SaaS application management
SaaS application integration
Discover
CMDBMDM Library
Data
TransferUsage Mapping
Financial
Mgmt
App
Control
Service
Desk
Complex
LicenseITOM
Data
CenterSaaS
Desktop
Mgmt
4 4 4 4 4 4 4 4 4 4 4 4 4 4
Value Index
1001st out of 15
22Info-Tech Research GroupVendor Landscape: IT Asset Management
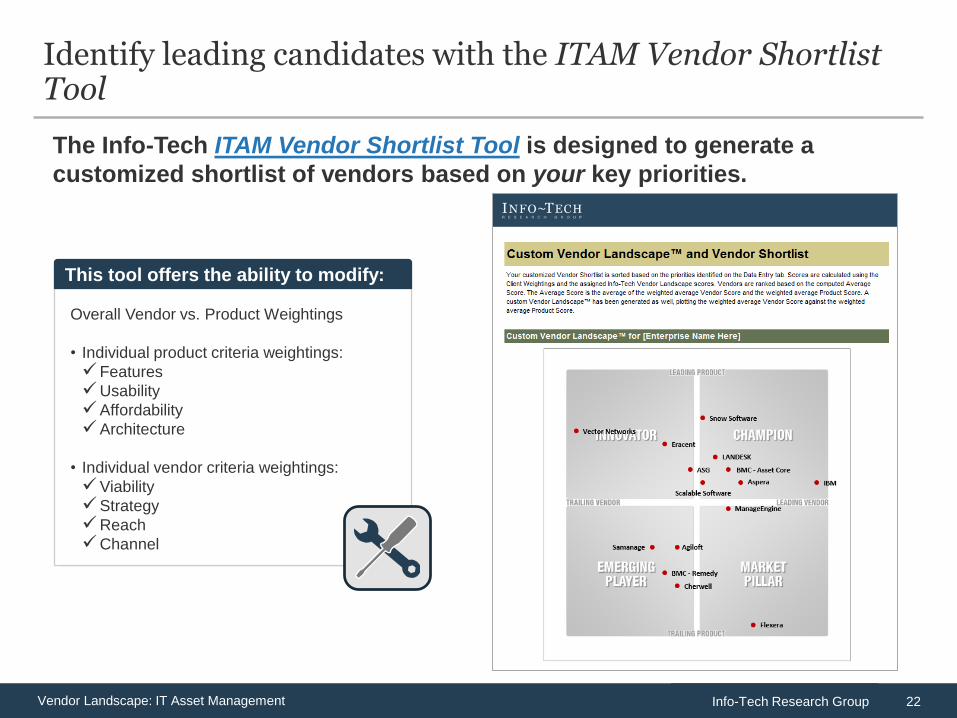
The Info-Tech ITAM Vendor Shortlist Tool is designed to generate a
customized shortlist of vendors based on your key priorities.
Identify leading candidates with the ITAM Vendor Shortlist Tool
Overall Vendor vs. Product Weightings
• Individual product criteria weightings:
Features
Usability
Affordability
Architecture
• Individual vendor criteria weightings:
Viability
Strategy
Reach
Channel
This tool offers the ability to modify:
23Info-Tech Research GroupVendor Landscape: IT Asset Management
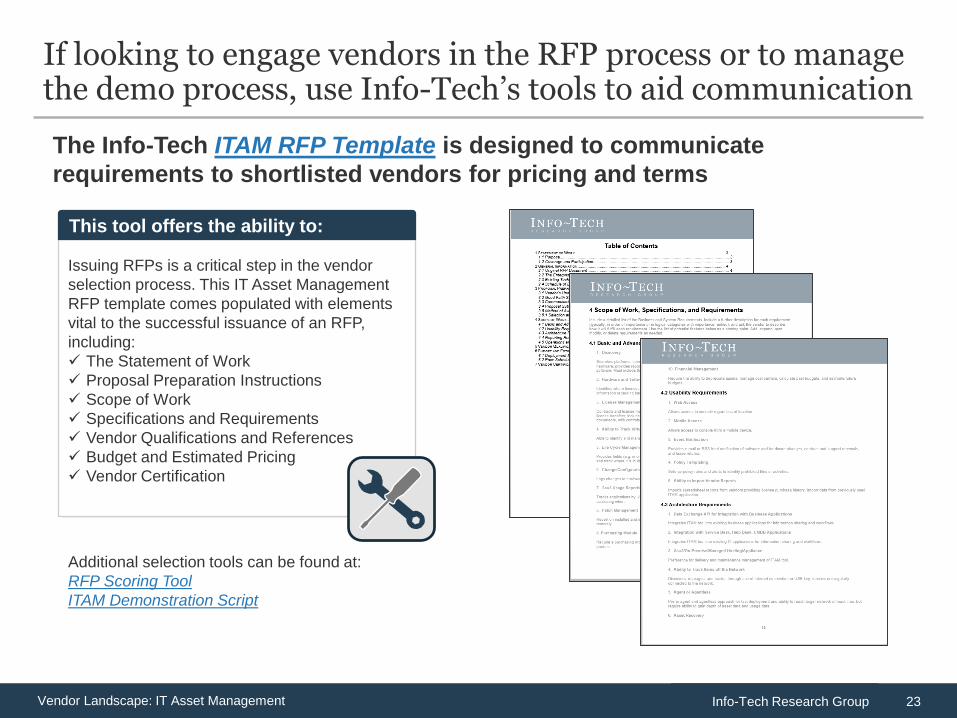
The Info-Tech ITAM RFP Template is designed to communicate
requirements to shortlisted vendors for pricing and terms
If looking to engage vendors in the RFP process or to manage the demo process, use Info-Tech’s tools to aid communication
Issuing RFPs is a critical step in the vendor
selection process. This IT Asset Management
RFP template comes populated with elements
vital to the successful issuance of an RFP,
including:
The Statement of Work
Proposal Preparation Instructions
Scope of Work
Specifications and Requirements
Vendor Qualifications and References
Budget and Estimated Pricing
Vendor Certification
This tool offers the ability to:
Additional selection tools can be found at:
RFP Scoring Tool
ITAM Demonstration Script
24Info-Tech Research GroupVendor Landscape: IT Asset Management
Appendix
1. Vendor Landscape Methodology: Overview
2. Vendor Landscape Methodology: Product Selection & Information Gathering
3. Vendor Landscape Methodology: Scoring
4. Vendor Landscape Methodology: Information Presentation
5. Vendor Landscape Methodology: Fact Check & Publication
6. Product Pricing Scenario
25Info-Tech Research GroupVendor Landscape: IT Asset Management
Vendor Landscape Methodology:Overview
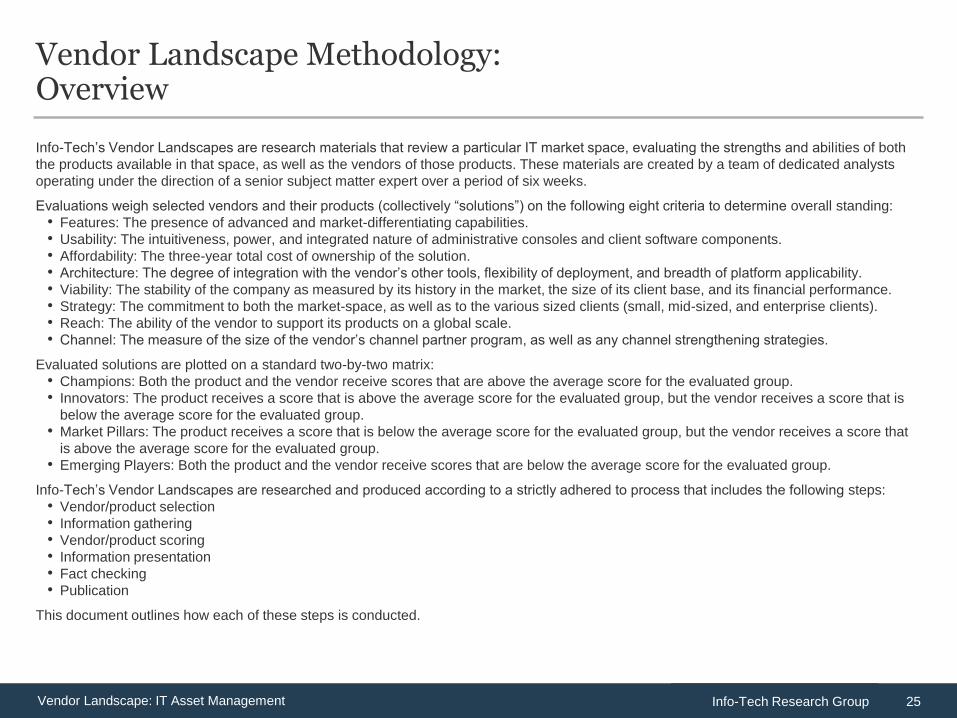
Info-Tech’s Vendor Landscapes are research materials that review a particular IT market space, evaluating the strengths and abilities of both
the products available in that space, as well as the vendors of those products. These materials are created by a team of dedicated analysts
operating under the direction of a senior subject matter expert over a period of six weeks.
Evaluations weigh selected vendors and their products (collectively “solutions”) on the following eight criteria to determine overall standing:
• Features: The presence of advanced and market-differentiating capabilities.
• Usability: The intuitiveness, power, and integrated nature of administrative consoles and client software components.
• Affordability: The three-year total cost of ownership of the solution.
• Architecture: The degree of integration with the vendor’s other tools, flexibility of deployment, and breadth of platform applicability.
• Viability: The stability of the company as measured by its history in the market, the size of its client base, and its financial performance.
• Strategy: The commitment to both the market-space, as well as to the various sized clients (small, mid-sized, and enterprise clients).
• Reach: The ability of the vendor to support its products on a global scale.
• Channel: The measure of the size of the vendor’s channel partner program, as well as any channel strengthening strategies.
Evaluated solutions are plotted on a standard two-by-two matrix:
• Champions: Both the product and the vendor receive scores that are above the average score for the evaluated group.
• Innovators: The product receives a score that is above the average score for the evaluated group, but the vendor receives a score that is
below the average score for the evaluated group.
• Market Pillars: The product receives a score that is below the average score for the evaluated group, but the vendor receives a score that
is above the average score for the evaluated group.
• Emerging Players: Both the product and the vendor receive scores that are below the average score for the evaluated group.
Info-Tech’s Vendor Landscapes are researched and produced according to a strictly adhered to process that includes the following steps:
• Vendor/product selection
• Information gathering
• Vendor/product scoring
• Information presentation
• Fact checking
• Publication
This document outlines how each of these steps is conducted.
26Info-Tech Research GroupVendor Landscape: IT Asset Management
Vendor Landscape Methodology:Vendor/Product Selection & Information Gathering
Info-Tech works closely with its client base to solicit guidance in terms of understanding the vendors with whom clients wish to work and the
products that they wish evaluated; this demand pool forms the basis of the vendor selection process for Vendor Landscapes. Balancing this
demand, Info-Tech also relies upon the deep subject matter expertise and market awareness of its Senior, Lead, and Principal Research
Analysts to ensure that appropriate solutions are included in the evaluation. As an aspect of that expertise and awareness, Info-Tech’s
analysts may, at their discretion, determine the specific capabilities that are required of the products under evaluation, and include in the
Vendor Landscape only those solutions that meet all specified requirements.
Information on vendors and products is gathered in a number of ways via a number of channels.
Initially, a request package is submitted to vendors to solicit information on a broad range of topics. The request package includes:
• A detailed survey.
• A pricing scenario (see Vendor Landscape Methodology: Price Evaluation and Pricing Scenario, below).
• A request for reference clients.
• A request for a briefing and, where applicable, guided product demonstration.
These request packages are distributed approximately twelve weeks prior to the initiation of the actual research project to allow vendors ample
time to consolidate the required information and schedule appropriate resources.
During the course of the research project, briefings and demonstrations are scheduled (generally for one hour each session, though more time
is scheduled as required) to allow the analyst team to discuss the information provided in the survey, validate vendor claims, and gain direct
exposure to the evaluated products. Additionally, an end-user survey is circulated to Info-Tech’s client base and vendor-supplied reference
accounts are interviewed to solicit their feedback on their experiences with the evaluated solutions and with the vendors of those solutions.
These materials are supplemented by a thorough review of all product briefs, technical manuals, and publicly available marketing materials
about the product, as well as about the vendor itself.
Refusal by a vendor to supply completed surveys or submit to participation in briefings and demonstrations does not eliminate a vendor from
inclusion in the evaluation. Where analyst and client input has determined that a vendor belongs in a particular evaluation, it will be evaluated
as best as possible based on publicly available materials only. As these materials are not as comprehensive as a survey, briefing, and
demonstration, the possibility exists that the evaluation may not be as thorough or accurate. Since Info-Tech includes vendors regardless of
vendor participation, it is always in the vendor’s best interest to participate fully.
All information is recorded and catalogued, as required, to facilitate scoring and for future reference.
27Info-Tech Research GroupVendor Landscape: IT Asset Management
Vendor Landscape Methodology:Scoring
Once all information has been gathered and evaluated for all vendors and products, the analyst team moves to scoring. All scoring is
performed at the same time so as to ensure as much consistency as possible. Each criterion is scored on a ten point scale, though the manner
of scoring for criteria differs slightly:
• Features is scored via Cumulative Scoring
• Affordability is scored via Scalar Scoring
• All other criteria are scored via Base5 Scoring
In Cumulative Scoring, a single point is assigned to each evaluated feature that is regarded as being fully present, partial points to each
feature that is partially present, and zero points to features that are deemed to be absent or unsatisfactory. The assigned points are summed
and normalized to a value out of ten. For example, if a particular Vendor Landscape evaluates eight specific features in the Feature Criteria,
the summed score out of eight for each evaluated product would be multiplied by 1.25 to yield a value out of ten.
In Scalar Scoring, a score of ten is assigned to the lowest cost solution, and a score of one is assigned to the highest cost solution. All other
solutions are assigned a mathematically determined score based on their proximity to / distance from these two endpoints. For example, in an
evaluation of three solutions, where the middle cost solution is closer to the low end of the pricing scale it will receive a higher score, and
where it is closer to the high end of the pricing scale it will receive a lower score; depending on proximity to the high or low price it is entirely
possible that it could receive either ten points (if it is very close to the lowest price) or one point (if it is very close to the highest price). Where
pricing cannot be determined (vendor does not supply price and public sources do not exist), a score of 0 is automatically assigned.
In Base5 scoring a number of sub-criteria are specified for each criterion (for example, Longevity, Market Presence, and Financials are sub-
criteria of the Viability criterion), and each one is scored on the following scale:
5 - The product/vendor is exemplary in this area (nothing could be done to improve the status).
4 - The product/vendor is good in this area (small changes could be made that would move things to the next level).
3 - The product/vendor is adequate in this area (small changes would make it good, more significant changes required to be exemplary).
2 - The product/vendor is poor in this area (this is a notable weakness and significant work is required).
1 - The product/vendor is terrible/fails in this area (this is a glaring oversight and a serious impediment to adoption).
The assigned points are summed and normalized to a value out of ten as explained in Cumulative Scoring above.
Scores out of ten, known as Raw scores, are transposed as-is into Info-Tech’s Vendor Landscape Shortlist Tool, which automatically
determines Vendor Landscape positioning (see Vendor Landscape Methodology: Information Presentation - Vendor Landscape, below),
Criteria Score (see Vendor Landscape Methodology: Information Presentation - Criteria Score, below), and Value Index (see Vendor
Landscape Methodology: Information Presentation - Value Index, below).
28Info-Tech Research GroupVendor Landscape: IT Asset Management
Vendor Landscape Methodology:Information Presentation – Vendor Landscape
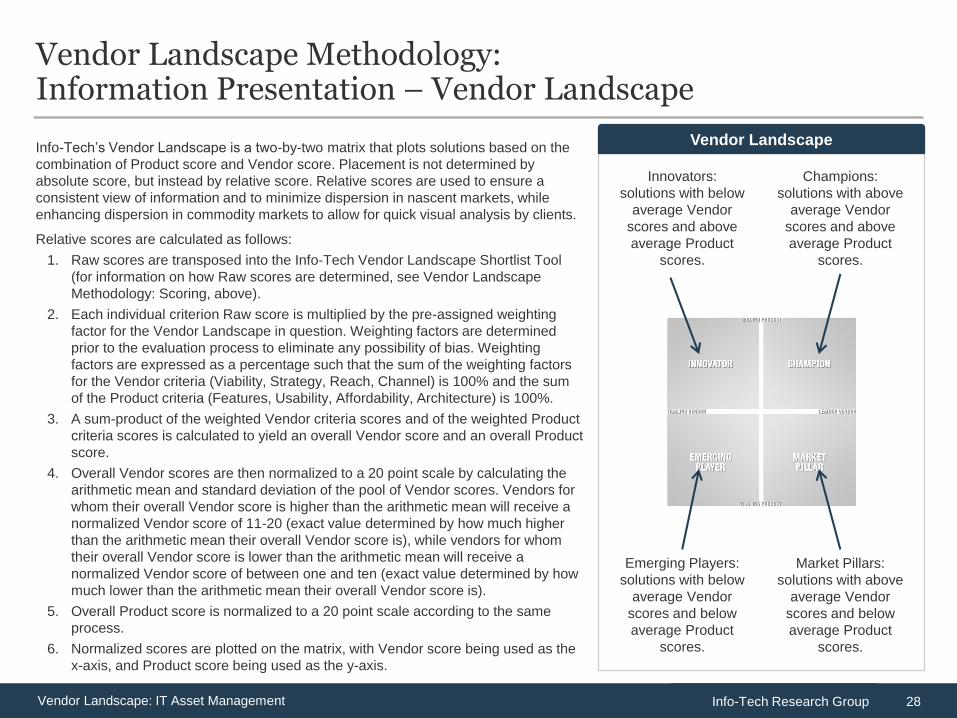
Info-Tech’s Vendor Landscape is a two-by-two matrix that plots solutions based on the
combination of Product score and Vendor score. Placement is not determined by
absolute score, but instead by relative score. Relative scores are used to ensure a
consistent view of information and to minimize dispersion in nascent markets, while
enhancing dispersion in commodity markets to allow for quick visual analysis by clients.
Relative scores are calculated as follows:
1. Raw scores are transposed into the Info-Tech Vendor Landscape Shortlist Tool
(for information on how Raw scores are determined, see Vendor Landscape
Methodology: Scoring, above).
2. Each individual criterion Raw score is multiplied by the pre-assigned weighting
factor for the Vendor Landscape in question. Weighting factors are determined
prior to the evaluation process to eliminate any possibility of bias. Weighting
factors are expressed as a percentage such that the sum of the weighting factors
for the Vendor criteria (Viability, Strategy, Reach, Channel) is 100% and the sum
of the Product criteria (Features, Usability, Affordability, Architecture) is 100%.
3. A sum-product of the weighted Vendor criteria scores and of the weighted Product
criteria scores is calculated to yield an overall Vendor score and an overall Product
score.
4. Overall Vendor scores are then normalized to a 20 point scale by calculating the
arithmetic mean and standard deviation of the pool of Vendor scores. Vendors for
whom their overall Vendor score is higher than the arithmetic mean will receive a
normalized Vendor score of 11-20 (exact value determined by how much higher
than the arithmetic mean their overall Vendor score is), while vendors for whom
their overall Vendor score is lower than the arithmetic mean will receive a
normalized Vendor score of between one and ten (exact value determined by how
much lower than the arithmetic mean their overall Vendor score is).
5. Overall Product score is normalized to a 20 point scale according to the same
process.
6. Normalized scores are plotted on the matrix, with Vendor score being used as the
x-axis, and Product score being used as the y-axis.
Vendor Landscape
Champions:
solutions with above
average Vendor
scores and above
average Product
scores.
Innovators:
solutions with below
average Vendor
scores and above
average Product
scores.
Market Pillars:
solutions with above
average Vendor
scores and below
average Product
scores.
Emerging Players:
solutions with below
average Vendor
scores and below
average Product
scores.
29Info-Tech Research GroupVendor Landscape: IT Asset Management
Harvey Balls
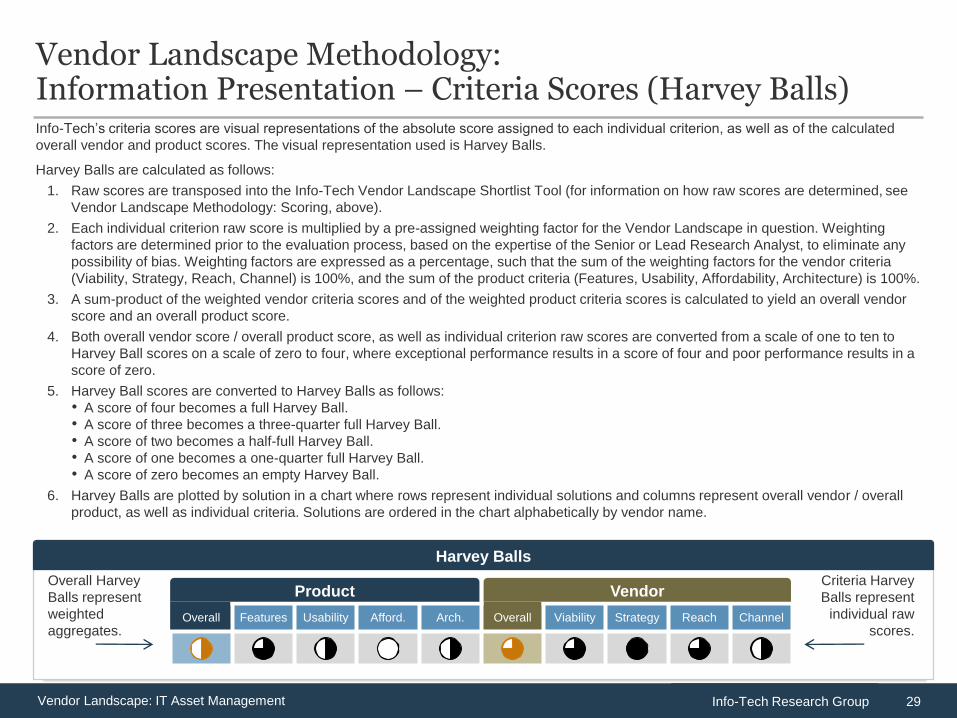
Vendor Landscape Methodology:Information Presentation – Criteria Scores (Harvey Balls)Info-Tech’s criteria scores are visual representations of the absolute score assigned to each individual criterion, as well as of the calculated
overall vendor and product scores. The visual representation used is Harvey Balls.
Harvey Balls are calculated as follows:
1. Raw scores are transposed into the Info-Tech Vendor Landscape Shortlist Tool (for information on how raw scores are determined, see
Vendor Landscape Methodology: Scoring, above).
2. Each individual criterion raw score is multiplied by a pre-assigned weighting factor for the Vendor Landscape in question. Weighting
factors are determined prior to the evaluation process, based on the expertise of the Senior or Lead Research Analyst, to eliminate any
possibility of bias. Weighting factors are expressed as a percentage, such that the sum of the weighting factors for the vendor criteria
(Viability, Strategy, Reach, Channel) is 100%, and the sum of the product criteria (Features, Usability, Affordability, Architecture) is 100%.
3. A sum-product of the weighted vendor criteria scores and of the weighted product criteria scores is calculated to yield an overall vendor
score and an overall product score.
4. Both overall vendor score / overall product score, as well as individual criterion raw scores are converted from a scale of one to ten to
Harvey Ball scores on a scale of zero to four, where exceptional performance results in a score of four and poor performance results in a
score of zero.
5. Harvey Ball scores are converted to Harvey Balls as follows:
• A score of four becomes a full Harvey Ball.
• A score of three becomes a three-quarter full Harvey Ball.
• A score of two becomes a half-full Harvey Ball.
• A score of one becomes a one-quarter full Harvey Ball.
• A score of zero becomes an empty Harvey Ball.
6. Harvey Balls are plotted by solution in a chart where rows represent individual solutions and columns represent overall vendor / overall
product, as well as individual criteria. Solutions are ordered in the chart alphabetically by vendor name.
Overall Harvey
Balls represent
weighted
aggregates.
Criteria Harvey
Balls represent
individual raw
scores.Overall Features Usability Afford. Arch. Overall Viability Strategy Reach Channel
Product Vendor
30Info-Tech Research GroupVendor Landscape: IT Asset Management
Stoplights
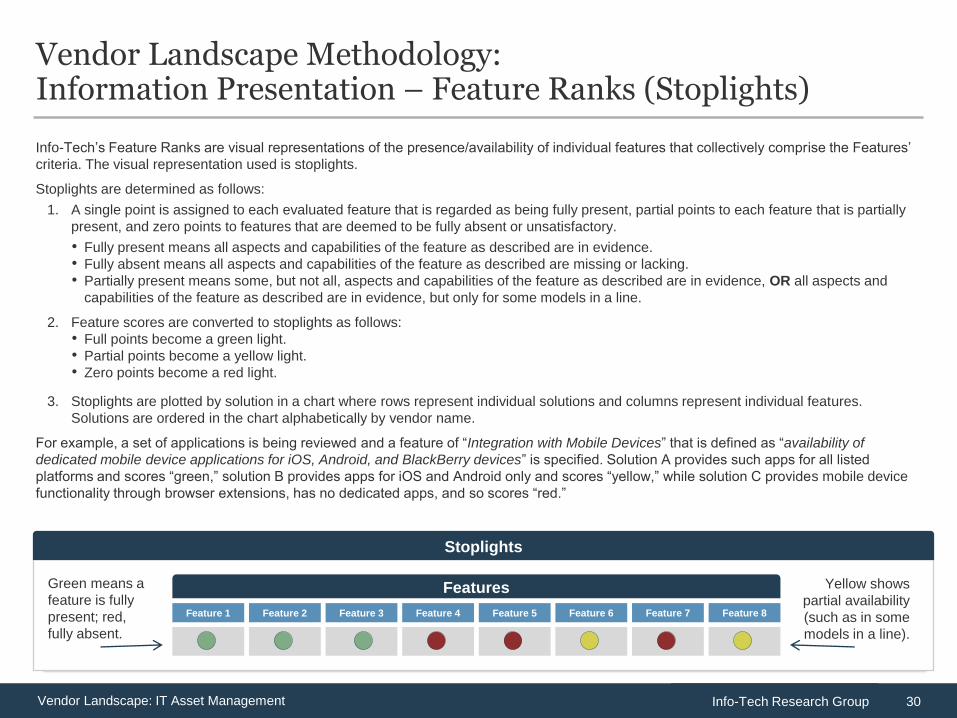
Vendor Landscape Methodology:Information Presentation – Feature Ranks (Stoplights)
Info-Tech’s Feature Ranks are visual representations of the presence/availability of individual features that collectively comprise the Features’
criteria. The visual representation used is stoplights.
Stoplights are determined as follows:
1. A single point is assigned to each evaluated feature that is regarded as being fully present, partial points to each feature that is partially
present, and zero points to features that are deemed to be fully absent or unsatisfactory.
• Fully present means all aspects and capabilities of the feature as described are in evidence.
• Fully absent means all aspects and capabilities of the feature as described are missing or lacking.
• Partially present means some, but not all, aspects and capabilities of the feature as described are in evidence, OR all aspects and
capabilities of the feature as described are in evidence, but only for some models in a line.
2. Feature scores are converted to stoplights as follows:
• Full points become a green light.
• Partial points become a yellow light.
• Zero points become a red light.
3. Stoplights are plotted by solution in a chart where rows represent individual solutions and columns represent individual features.
Solutions are ordered in the chart alphabetically by vendor name.
For example, a set of applications is being reviewed and a feature of “Integration with Mobile Devices” that is defined as “availability of
dedicated mobile device applications for iOS, Android, and BlackBerry devices” is specified. Solution A provides such apps for all listed
platforms and scores “green,” solution B provides apps for iOS and Android only and scores “yellow,” while solution C provides mobile device
functionality through browser extensions, has no dedicated apps, and so scores “red.”
Feature 1 Feature 2 Feature 4 Feature 5Feature 3
Features
Feature 6 Feature 7 Feature 8
Yellow shows
partial availability
(such as in some
models in a line).
Green means a
feature is fully
present; red,
fully absent.
31Info-Tech Research GroupVendor Landscape: IT Asset Management
Value Index
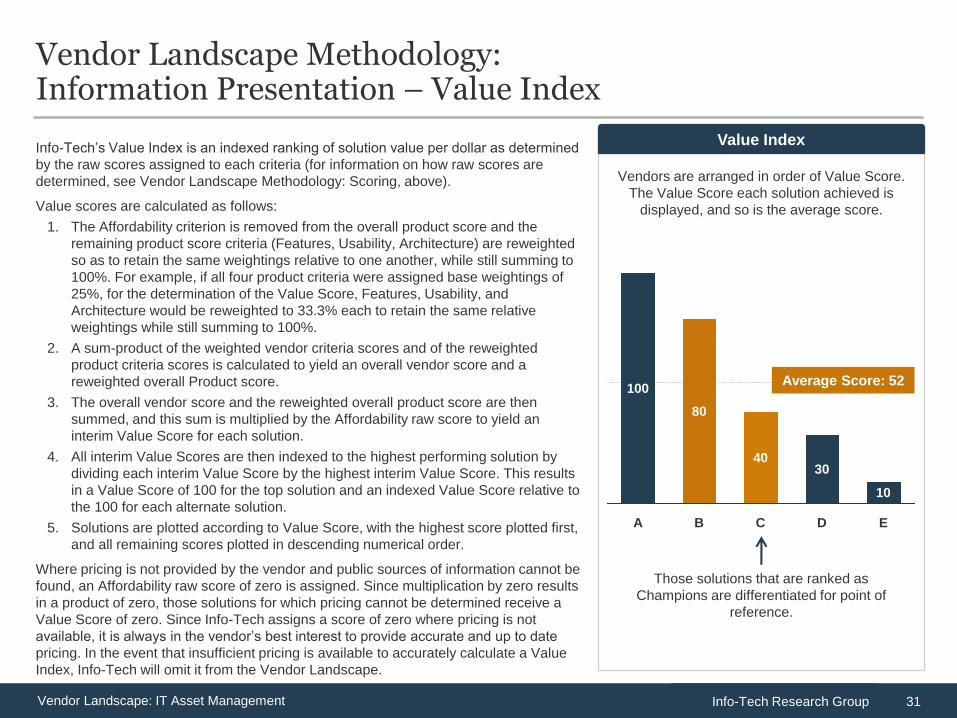
Vendor Landscape Methodology:Information Presentation – Value Index
Info-Tech’s Value Index is an indexed ranking of solution value per dollar as determined
by the raw scores assigned to each criteria (for information on how raw scores are
determined, see Vendor Landscape Methodology: Scoring, above).
Value scores are calculated as follows:
1. The Affordability criterion is removed from the overall product score and the
remaining product score criteria (Features, Usability, Architecture) are reweighted
so as to retain the same weightings relative to one another, while still summing to
100%. For example, if all four product criteria were assigned base weightings of
25%, for the determination of the Value Score, Features, Usability, and
Architecture would be reweighted to 33.3% each to retain the same relative
weightings while still summing to 100%.
2. A sum-product of the weighted vendor criteria scores and of the reweighted
product criteria scores is calculated to yield an overall vendor score and a
reweighted overall Product score.
3. The overall vendor score and the reweighted overall product score are then
summed, and this sum is multiplied by the Affordability raw score to yield an
interim Value Score for each solution.
4. All interim Value Scores are then indexed to the highest performing solution by
dividing each interim Value Score by the highest interim Value Score. This results
in a Value Score of 100 for the top solution and an indexed Value Score relative to
the 100 for each alternate solution.
5. Solutions are plotted according to Value Score, with the highest score plotted first,
and all remaining scores plotted in descending numerical order.
Where pricing is not provided by the vendor and public sources of information cannot be
found, an Affordability raw score of zero is assigned. Since multiplication by zero results
in a product of zero, those solutions for which pricing cannot be determined receive a
Value Score of zero. Since Info-Tech assigns a score of zero where pricing is not
available, it is always in the vendor’s best interest to provide accurate and up to date
pricing. In the event that insufficient pricing is available to accurately calculate a Value
Index, Info-Tech will omit it from the Vendor Landscape.
Those solutions that are ranked as
Champions are differentiated for point of
reference.
E
10
D
30
C
40
B
80
A
100Average Score: 52
Vendors are arranged in order of Value Score.
The Value Score each solution achieved is
displayed, and so is the average score.
32Info-Tech Research GroupVendor Landscape: IT Asset Management
Vendor Landscape Methodology:Information Presentation – Price Evaluation: Mid-Market
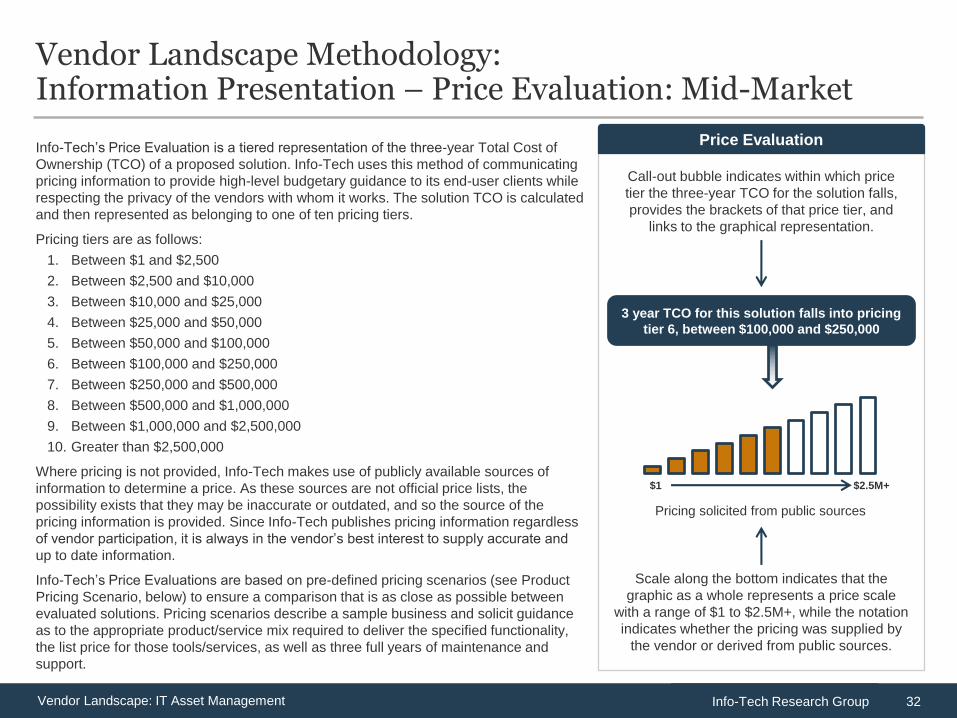
Info-Tech’s Price Evaluation is a tiered representation of the three-year Total Cost of
Ownership (TCO) of a proposed solution. Info-Tech uses this method of communicating
pricing information to provide high-level budgetary guidance to its end-user clients while
respecting the privacy of the vendors with whom it works. The solution TCO is calculated
and then represented as belonging to one of ten pricing tiers.
Pricing tiers are as follows:
1. Between $1 and $2,500
2. Between $2,500 and $10,000
3. Between $10,000 and $25,000
4. Between $25,000 and $50,000
5. Between $50,000 and $100,000
6. Between $100,000 and $250,000
7. Between $250,000 and $500,000
8. Between $500,000 and $1,000,000
9. Between $1,000,000 and $2,500,000
10. Greater than $2,500,000
Where pricing is not provided, Info-Tech makes use of publicly available sources of
information to determine a price. As these sources are not official price lists, the
possibility exists that they may be inaccurate or outdated, and so the source of the
pricing information is provided. Since Info-Tech publishes pricing information regardless
of vendor participation, it is always in the vendor’s best interest to supply accurate and
up to date information.
Info-Tech’s Price Evaluations are based on pre-defined pricing scenarios (see Product
Pricing Scenario, below) to ensure a comparison that is as close as possible between
evaluated solutions. Pricing scenarios describe a sample business and solicit guidance
as to the appropriate product/service mix required to deliver the specified functionality,
the list price for those tools/services, as well as three full years of maintenance and
support.
Price Evaluation
Call-out bubble indicates within which price
tier the three-year TCO for the solution falls,
provides the brackets of that price tier, and
links to the graphical representation.
Scale along the bottom indicates that the
graphic as a whole represents a price scale
with a range of $1 to $2.5M+, while the notation
indicates whether the pricing was supplied by
the vendor or derived from public sources.
3 year TCO for this solution falls into pricing
tier 6, between $100,000 and $250,000
$1 $2.5M+
Pricing solicited from public sources
33Info-Tech Research GroupVendor Landscape: IT Asset Management
Vendor Landscape Methodology:Information Presentation – Scenarios
Info-Tech Research Group is providing each vendor with a common pricing scenario to enable normalized scoring of affordability, calculation
of Value Index rankings, and identification of the appropriate solution pricing tier as displayed on each vendor scorecard.
The pricing scenario functionality applies to at least one of the use cases. Please indicate if your pricing would be significantly different if your
products were used for any of the other use cases being considered.
Vendors are asked to provide list costs for an ITAM tool to address the needs of a reference organization described in the pricing
scenario. Please price out the lowest possible 3-year Total Cost of Ownership (TCO) including list prices for software and licensing fees to
meet the requirements of the following scenario.
The pricing scenario:
An organization is looking to implement ITAM. They have a datacenter with 600 virtual servers and 50 physical servers. Approximately 50
routers and switches and 20 printers will need to be managed. Approximately 7,000 end-user devices need to discovered and
inventoried. The IT asset management process will be managed by one ITAM manager centrally, but will require another 10 asset managers
to view and update data.
The expected solution capabilities are as follows:
The solution must be able to discover assets on the network and (if applicable) deploy agents to those assets.
Gold-level support services should include the following:
• Implementation support
• Technical documentation and guides
• 24/7 technical support by phone or online
• Access to upgrades
• Do not include costs of hardware or additional software (OS) required to host solution
34Info-Tech Research GroupVendor Landscape: IT Asset Management
Vendor Landscape Methodology:Information Presentation – Vendor Awards
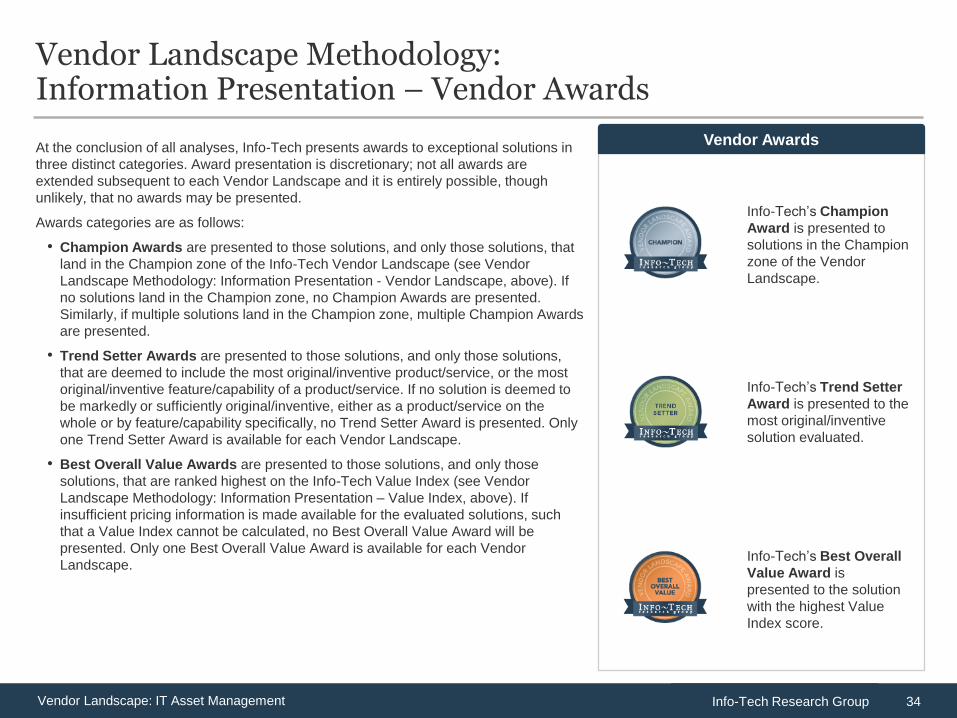
At the conclusion of all analyses, Info-Tech presents awards to exceptional solutions in
three distinct categories. Award presentation is discretionary; not all awards are
extended subsequent to each Vendor Landscape and it is entirely possible, though
unlikely, that no awards may be presented.
Awards categories are as follows:
• Champion Awards are presented to those solutions, and only those solutions, that
land in the Champion zone of the Info-Tech Vendor Landscape (see Vendor
Landscape Methodology: Information Presentation - Vendor Landscape, above). If
no solutions land in the Champion zone, no Champion Awards are presented.
Similarly, if multiple solutions land in the Champion zone, multiple Champion Awards
are presented.
• Trend Setter Awards are presented to those solutions, and only those solutions,
that are deemed to include the most original/inventive product/service, or the most
original/inventive feature/capability of a product/service. If no solution is deemed to
be markedly or sufficiently original/inventive, either as a product/service on the
whole or by feature/capability specifically, no Trend Setter Award is presented. Only
one Trend Setter Award is available for each Vendor Landscape.
• Best Overall Value Awards are presented to those solutions, and only those
solutions, that are ranked highest on the Info-Tech Value Index (see Vendor
Landscape Methodology: Information Presentation – Value Index, above). If
insufficient pricing information is made available for the evaluated solutions, such
that a Value Index cannot be calculated, no Best Overall Value Award will be
presented. Only one Best Overall Value Award is available for each Vendor
Landscape.
Vendor Awards
Info-Tech’s Champion
Award is presented to
solutions in the Champion
zone of the Vendor
Landscape.
Info-Tech’s Trend Setter
Award is presented to the
most original/inventive
solution evaluated.
Info-Tech’s Best Overall
Value Award is
presented to the solution
with the highest Value
Index score.
35Info-Tech Research GroupVendor Landscape: IT Asset Management
Vendor Landscape Methodology:Fact Check & Publication
Info-Tech takes the factual accuracy of its Vendor Landscapes, and indeed of all of its published content, very seriously. To ensure the utmost
accuracy in its Vendor Landscapes, we invite all vendors of evaluated solutions (whether the vendor elected to provide a survey and/or
participate in a briefing or not) to participate in a process of fact check.
Once the research project is complete and the materials are deemed to be in a publication ready state, excerpts of the material specific to each
vendor’s solution are provided to the vendor. Info-Tech only provides material specific to the individual vendor’s solution for review
encompassing the following:
• All written review materials of the vendor and the vendor’s product that comprise the evaluated solution.
• Info-Tech’s Criteria Scores / Harvey Balls detailing the individual and overall vendor / product scores assigned.
• Info-Tech’s Feature Rank / stoplights detailing the individual feature scores of the evaluated product.
• Info-Tech’s Raw Pricing for the vendor either as received from the vendor or as collected from publicly available sources.
• Info-Tech’s Scenario ranking for all considered scenarios for the evaluated solution.
Info-Tech does not provide the following:
• Info-Tech’s Vendor Landscape placement of the evaluated solution.
• Info-Tech’s Value Score for the evaluated solution.
• End-user feedback gathered during the research project.
• Info-Tech’s overall recommendation in regard to the evaluated solution.
Info-Tech provides a one-week window for each vendor to provide written feedback. Feedback must be corroborated (be provided with
supporting evidence), and where it does, feedback that addresses factual errors or omissions is adopted fully, while feedback that addresses
opinions is taken under consideration. The assigned analyst team makes all appropriate edits and supplies an edited copy of the materials to
the vendor within one week for final review.
Should a vendor still have concerns or objections at that time, they are invited to a conversation, initially via email, but as required and deemed
appropriate by Info-Tech, subsequently via telephone, to ensure common understanding of the concerns. Where concerns relate to ongoing
factual errors or omissions, they are corrected under the supervision of Info-Tech’s Vendor Relations personnel. Where concerns relate to
ongoing differences of opinion, they are again taken under consideration with neither explicit not implicit indication of adoption.
Publication of materials is scheduled to occur within the six weeks immediately following the completion of the research project, but does not
occur until the fact check process has come to conclusion, and under no circumstances are “pre-publication” copies of any materials made
available to any client.